1. Introduction
The massive proliferation of mobile devices and its widespread use, not just for communication purposes but entertaining as well, poses additional challenges to Mobile Network Operators (MNOs). While delivery of regular services (e.g., voice, data services) functioning is expected and somehow taken for granted, users continuously demand even higher standards for existent and future services Quality of Experience (QoE). As a matter of a fact, people nowadays perceive mobile devices as just commodities being part of their lifestyle. As a result, MNOs were forced to not only focus on delivering high network Quality of Service (QoS) but, evermore network QoE, changing the management paradigm of mobile networks; nowadays, Customer Experience Management (CEM) is a critical task for MNOs [
1].
The technological landscape of MNOs is continuously evolving either with the introduction of technological advancements as Software Defined Network (SDN) [
2], network architecture advancements such as Cloud Radio Access Network (C-RAN) [
3], or even with the deployment of new Radio Access Networks (RANs), as the 5th Generation (5G). In this context, MNOs have to jointly operate, manage and optimize their networks, balancing the new technological developments and network deployments with the legacy networks and associated dependencies. In this ecosystem, MNOs manage and operate highly complex networks and systems.
Moreover, the ecosystem of MNOs generates evermore data from several data sources. From the classical QoS data sources, as Drive Tests (DTs), Configuration Management (CM), Performance Management (PM), and Fault Management (FM), to customer-related data as billing, to new data sources as crowdsourcing [
4]. Additionally, data fusion techniques are being used to enrich MNOs’ data, as pointed out in [
5]. It augments an MNO data volume and increases the need to centralize data access and management.
That being said, an MNO needs to hold a set of efficient systems/solutions and tools to cope with these increasing challenges during a network life cycle. One of the areas that can be particularly troublesome is network Operation and Maintenance (OAM). Indeed, an MNO is constantly asked to monitor and optimize the network in real-time to achieve better QoS and QoE targets. Moreover, current and future systems/solutions should incorporate Artificial Intelligence (AI) as it is a fundamental enabler to handle current and future network complexity [
6]. A shift from a reactive-driven operation mode to a proactive and data-driven operation mode is possible with AI enhancing the network OAM. Access to multiple data sources in a single environment that guarantees data integrity is essential to accomplish the reactive to proactive transition [
7].
Within this context, we have designed and implemented a software solution to help MNOs tackling those demands. Its design and implementation is twofold: Firstly, to allow the software solution users to perform their tasks in a friendly and efficient manner. Secondly, to provide access to a set of high-quality RAN oriented algorithms as a backbone for network diagnosis, optimization, and planning.
The algorithms incorporated in the proposed software solution were previously developed regarding actual data from MNOs and validated in OAM commercial projects. Moreover, the modular architecture of the software solution and open-source dependencies provide high flexibility to incorporate new data sources, new algorithms, and AI-based automation.
1.1. Main Contributions
The main contributions of this paper can be summarized as follows:
A web-based software solution designed for MNOs to monitor/solve network problems related to planning, operation, and optimization for multiple Radio Access Technologys (RATs).
The development of a modular 3-tier architecture for handling the access to multiple MNO data sources providing rich and diversified visualizations, on top of data managing operations, and allowing the integration of future AI procedures.
The incorporation of multiple RAN algorithms into the software solution, that combined with data managing operations allows the development of dynamic and customized use cases for mobile network OAM.
The users can explore network simulations, resorting to the RAN algorithms, of how the network will behave under certain conditions, and visualize the outcome of those simulations.
1.2. Structure of the Paper
This paper is organized as follows: After the introduction provided in
Section 1, we review relevant related work in
Section 2. Then, in
Section 3, the recently developed RAN algorithms that are incorporated into the proposed software solution are summarized. In
Section 4, we introduce user and design requirements, alongside the architecture that supports the implemented software solution, presented in
Section 5. Then, two case studies are presented in
Section 6, to highlight the potentialities and usability of the proposed solution. Finally, in
Section 7, the main conclusions and future work are presented.
2. Related Work
Software solutions for wireless networks OAM are largely dominated by industry suppliers with proprietary solutions. While some solutions as Atoll allows the optimization of the network as well as its design, by providing access to both live network data and predictions based data [
8], others tend to focus on the network planning stage as ASSET, which is a radio-planning tool that provides Radio Frequency (RF) coverage, capacity and neighbor planning for cellular networks [
9]. Another example is provided by China Unicom, a large MNO, which proposed a platform particularly suited to handle large volumes of network traffic records [
10]. However, such solutions, and others, tend to be aligned with the prospected evolution of wireless networks operations, in particular with the demand for network automation as a mean to increase network efficiency and reduce its cost. In [
11], the authors discuss several principles to pursue network automation as developing open solutions or platforms, disrupting data and operational silos, and as using rule-based and Machine Learning (ML) algorithms for RAN operation.
Open solutions or platforms that facilitate the gathering and abstraction of data from multiple sources and vendors break data silos, promote a consolidated access to information and empower the development of automated used cases. In [
12], Xu et al. developed a platform for mobile wireless networks, hinged on the open principle, by proposing a multi-layer architecture from data ingestion to the network application layer. The proposed solution includes access to multiple data sources but does not include the visualization of georeferenced data in maps, which is paramount for MNOs. Kassela et al. also presented the trend of multi-layer and modular architectures [
13]. However, the proposed solution encompasses only one area of interest of MNOs, in this case, Base Station (BS) energy efficiency. Rueda et al. proposed a customized tool to solve the monitoring needs of CEM for MNOs [
14]. Even though the proposed tool allows near real-time operation, it is highly focused on the network QoE analysis, not including other network performance areas as QoS. Also, it does not explore the network optimization stage of the network life cycle, as it is highly focused on the monitoring stage. A similar work was also developed by Garcia et al. in [
1].
Not surprisingly, monitoring networks nowadays implies at some point the need of processing and analysing large sets of data. Therefore, there is a demand in this field to incorporate big data technologies for that matter. We stress a work by Suleykin and Panfilov, see [
15], who proposed a monitoring framework based on big data technologies to manage mobile network infrastructures and services. The main goal was to improve QoS and network performance where big data technologies were used to process real time data sources such as BS measurements, user demands/claims, and other sensors. In [
16], Wen and Li discuss issues related to deployment of big data storage and analysis techniques in existing mobile network architectures.
Concerning algorithms applied to RAN, the use of ML-based techniques continues to be a hot research topic. In [
17], Rafique and Velasco produced an extensive overview on the use of ML for RAN automation, with objective application scenarios as predictive maintenance and capacity optimization. Yang et al. developed a big data analytics platform for anomaly detection and root cause analysis in mobile networks, validating the proposed algorithms using real network data [
18]. With respect to network performance optimization in RAN, Gazda et al. developed an optimal small cell placement algorithm, based on unsupervised learning, to optimize user coverage based on mobility patterns [
19], while in [
20], Suarez-Rodriguez et al. presented a numerical optimization of coverage probability and user throughput using a novel user cell-association strategy.
3. Radio Access Network Algorithms
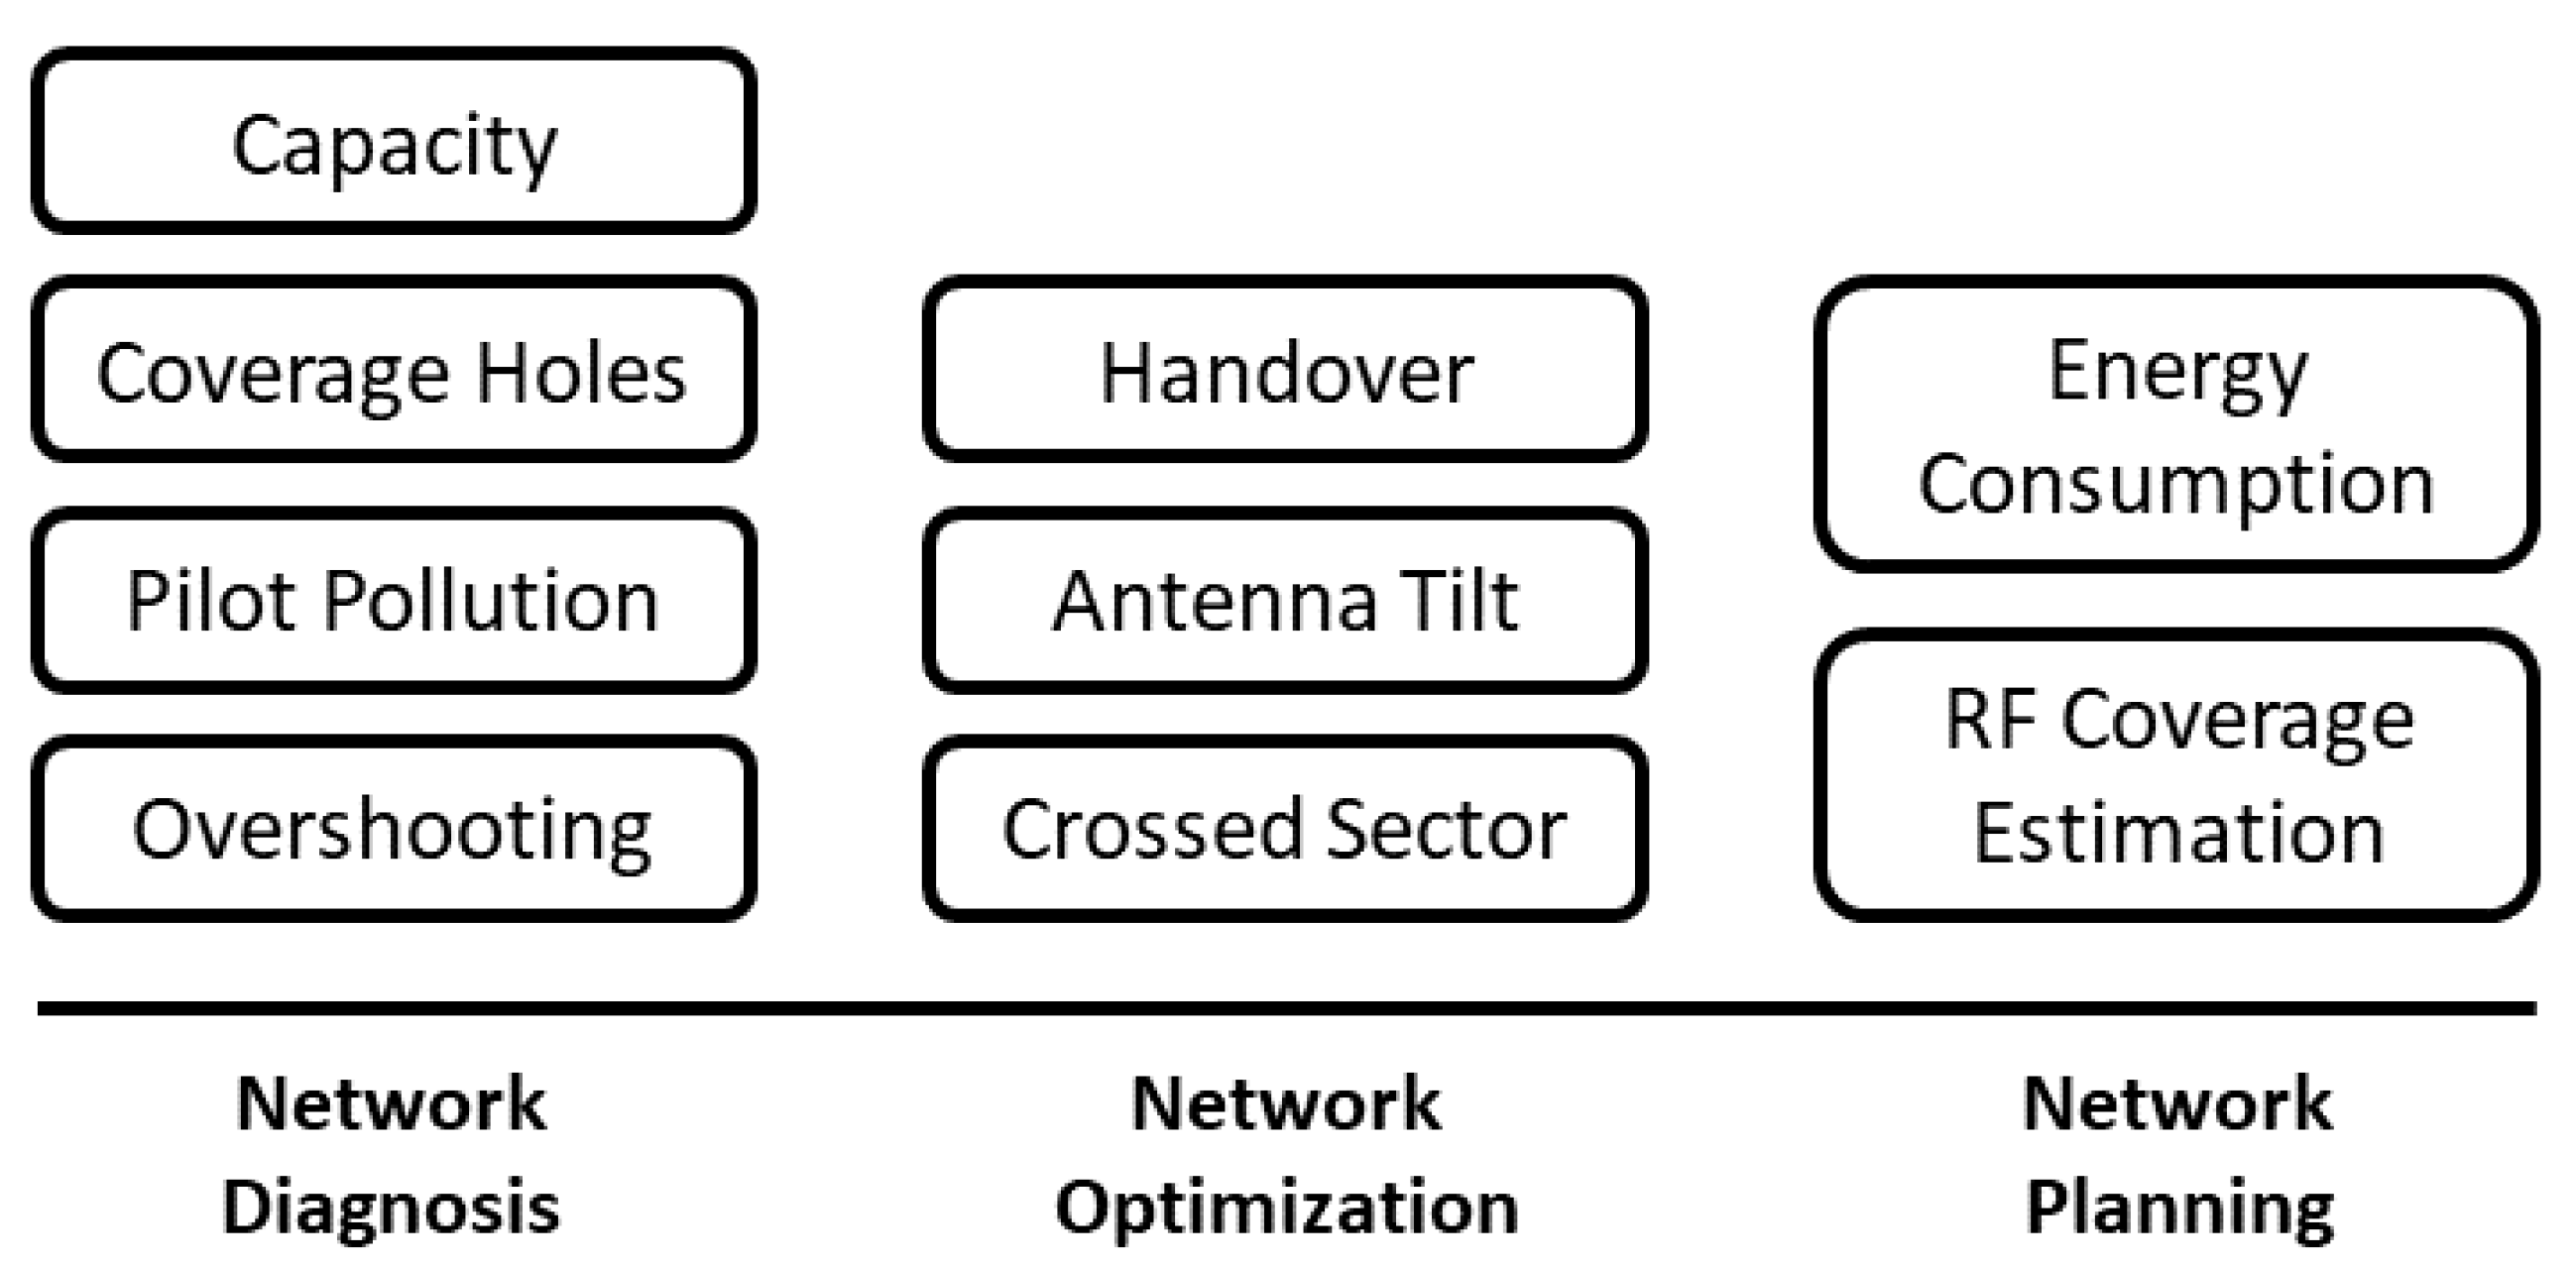
During a network life cycle, a MNO spends most of time in the OAM stage, mainly monitoring the network performance and optimizing it, when the performance is unsatisfactory. Thus, we have selected a set of RAN algorithms, to be incorporated into the proposed software solution, which promote an efficiency increase in OAM tasks. These algorithms are divided between network diagnosis and network optimization (see
Figure 1). Besides, a set of algorithms are also incorporated to cope with network planning.
The execution of the algorithms, depicted in
Figure 1 is independent from each other, as the radio engineer using the software solution selects the ones that allow him to perform his desired analysis. Additionally, it is worth emphasizing that the goal of this work was to develop a modular software solution. Thus, the incorporated RAN algorithms were previously developed, implemented, and validated in previous works. Consequently, only a brief description is given for each of the algorithms in the following sections. However, when a particular algorithm is more relevant for the analysis of the results of the proposed solution, additional details are provided.
3.1. Network Diagnosis
The purpose of the network diagnosis algorithms is to evaluate network performance, in terms of QoS, and to identify cells causing performance degradation to User Equipments (UEs). To this end, four algorithms are presented: the detection of overshooting, pilot pollution, coverage holes, and an algorithm to identify and extrapolate network capacity. Overall, these algorithms evaluate, on a cell basis, the existence and magnitude of each of the above sub performance scenarios.
The capacity algorithm aims to derive capacity models, specific for each network cell, measuring the UEs throughput by considering the cell specific RF environment, namely the interference levels. Multiple Linear Regression (MLR) is used to estimate the cell total throughput based on high-resolution network Key Performance Indicators (KPIs), such as Channel Quality Indicator (CQI), Modulation and Coding Scheme (MCS), and others. With the corresponding cell capacity model, the maximum capacity (throughput) is estimated. With such a reference, the headroom capacity, i.e., the difference between the cell average and its maximum, is estimated, allowing to identify and predict cells whose capacity limit is being reached [
21].
The overshooting algorithm identifies cells whose coverage reaches beyond what is planned, occurring as an “island” of coverage in the service area of another cell. The pilot pollution algorithm detects scenarios where too many pilots (or reference signals) are received in the same area, while lacking a dominant one. Finally, the coverage holes algorithm was developed to find areas where the pilot (or reference) signal power is in between the lowest network access threshold and the lowest value required for assigning full coverage. Even though being independent algorithms, they share the same structure (see
Figure 2).
The overshooting, coverage holes, and the pilot pollution algorithms [
22] exploit scanner DT data, and by associating the DT measurements to the respective cells of the mobile network (Cell Footprint block of
Figure 2), identify DT measurements corresponding to overshooting, pilot pollution or lack of coverage scenarios. This process, specific for each scenario, is conducted by the Self-Diagnosis block of
Figure 2, according to the received power and interference level of each DT measurement. This evaluation requires the user to define power and interference thresholds. Then, the geographical disposition of the identified DT measurements is evaluated by its division into clusters, based on their relative distance (corresponds to the Cluster Partitioning block in
Figure 2). It allows to identify prevalent performance degradation and discard isolated behaviors. Finally, the Statistical Analysis block supports the calculation of a severity index, measuring the degree of network performance degradation for each of the involved cells and clusters.
The capacity algorithm can be applied to 4th Generation (4G) and to 5G networks [
21], while the remaining algorithms only include the legacy networks [
22].
3.2. Network Optimization
When network performance degradation is detected, optimization actions should be taken to restore or improve the desired QoS levels. In this work, two algorithms are considered for the optimization of antenna physical characteristics, the crossed sector/feeder detector and the antenna tilt optimization algorithm. Finally, the handover algorithm is considered for the optimization of handover parameters.
Concretely, the crossed sector/feeder algorithm is designed to solve a frequent network implementation error, which is to erroneously swap the antenna cables of two sectors, when deploying BSs, thus creating a crossed sector/feeder scenario. Even though the two swapped sectors/antennas still provide RF coverage, they do not illuminate the desired cell area, thus causing several potential performance issues mostly related with interference. The algorithm considers the received power (measured by DTs) and the BS antenna radiation pattern. The concept is to compare the measured received signal strength from two sectors, with a signal strength prediction based on a correct network topology and antenna pattern knowledge [
23].
The antenna tilt algorithm aims to optimize low coverage and high interference areas, through the adjustment of the antenna tilts, using DT measurements and antenna models. The process is achieved using a specific implementation of a Particle Swarm Optimization (PSO) algorithm that selects the optimal tilt value according to a multi objective loss function, considering the cell coverage and/or the cell interference [
22].
The handover optimization algorithm aims to optimize the handover parameters, either facilitating or delaying handovers in order to maintain the highest QoS for the UEs. This is achieved by using both dedicated and scanner DT measurements, comparing RF conditions (power and interference) monitored by the UE in dedicated mode, with the overall RF conditions, including potential cells that the UE did not connect to, but can sustain better performance. This analysis can identify scenarios were cells offering potential higher QoS were available, and a handover did not occur, given the configured handover parameters. By optimizing these parameters, new handovers can be feasible thus achieving an overall higher QoS [
24].
Both the antenna tilt and the handover optimization algorithms share a common structure, which is presented in the flowchart of
Figure 3.
From the flowchart of
Figure 3, it can be seen that the algorithms, from the respective cell footprint (DT measurements), use a particular objective function, which is minimized using a PSO algorithm to identify new configurations. A new configuration updates the cell footprint (e.g., the received power with a new tilt configuration), and the process repeats itself until a maximum number of iterations is reached.
The objective function for the antenna tilt optimization algorithm is given by (adapted from [
22]):
where
is the cell tilt configuration (Mechanical Downtilt (MDT) and Electrical Downtilt (EDT)),
is a function that penalizes configurations
very distinct from the cell initial configuration, and
is the main optimization objective given by:
where
,
, and
indicate the cell footprint performance in terms of coverage holes, overshooting, and pilot pollution, respectively. The coefficients
,
, and
can be adjusted to prioritize any of the terms.
For the handover optimization algorithm, the objective function is given by (adapted from [
24]):
where
represents the set of handover parameters of a cell, and
represents the set of handover parameters specific for cell neighborhood relationships.
evaluates the coverage level,
penalizes configurations very distinct from the initial configuration, and
evaluates the number of handovers, which is minimized by the proposed objective function. More details on the antenna tilt and the handover algorithms are given in [
22,
24].
Regarding the applicable network technologies, both the crossed sector/feeder algorithm and the antenna tilt optimization algorithm can be applied from 2nd Generation (2G) to 5G networks, while the handover parameter optimization is still specific for 4G.
3.3. Network Planning
When real network data is unavailable or nonexistent (e.g., performance or fault management data), the common approach is to reach for link-level or system-level network simulations. This is the case in initial network planning, where coverage simulations in green fields are required to plan the future deployment of the BSs. In this work, a network planning support algorithm is presented: the RF coverage estimation. A second algorithm, the energy consumption extrapolation algorithm, provides energy consumption estimates, which can also be used for planning purposes.
The RF coverage estimation algorithm was developed to simulate cell coverage, considering customized propagation models, by using DT measurements to calibrate existent stochastic propagation models, and antenna models to consider the link-level antenna gain. The calibration process of the propagation models improves the large-scale path loss estimation error, and allows developing more realistic planning and coverage studies. This algorithm has been developed to meet the 5G requirements, including a new beamforming Massive Multiple-Input Multiple-Output (mMIMO) antenna model, and also the use of high-resolution 3-Dimensional (3D) environment databases, the last, to cope with Millimeter Wave (mmWave) propagation modelling [
25].
The topic of RAN power consumption and energy efficiency received great interest by MNOs on the past years, as a mean to reduce Operating Expense (OpEx) but also to develop more environment friendly (green) networks. In this scope, the energy consumption algorithm was developed, allowing extrapolating the power consumption of a BS Remote Radio Unit (RRU) and Baseband Unit (BBU) under different radio conditions. The algorithm is based on a model obtained using records of energy consumption of BS RRU and BBU equipment and considers the effects of voice and data traffic variations on the BS power consumption. Other variables, such as transmitted power, cell availability, or resources allocated to users, are also considered. These energy consumption models were obtained using supervised regression techniques and mixed effect models, and validated with real energy consumption data from several BSs [
26].
These algorithms are being applied to 2G/3rd Generation (3G)/4G legacy networks and 5G.
4. Requirements and Architecture
One of the initial tasks of the research work was to setup user and design requirements for the software solution. The methodology included close contact with MNOs, who are the potential end-users of the solution. As a result, a set of major functional and non-functional requirements were established, as follows:
A user should be able:
- -
To upload and overview the state of the network;
- -
To run a simulation of a RAN algorithm so he or she can infer how the network will behave under certain conditions;
- -
To record user interface workspace conditions for future use;
- -
To record the outcome of simulations made for future use;
User interaction should be carried out via a web client;
User interactivity is paramount;
The solution should be built using open-source software;
The solution must be designed in a way that facilitates the incorporation of more RAN algorithms in the future.
Based on the requirements set out, we have developed a web-based solution that provides users an interactive visual environment so they can focus on network data exploration.
Figure 4 shows the architecture of the solution. It follows the classic 3-tier architecture—presentation, logic and data layers.
In the presentation layer, there are two main components, resembling the two major user tasks: overview the state of the network and simulate its potential behavior. Most of the rendering is leaning towards the client side, that is, the web browser, as it is nowadays a common trend in web applications. By doing so, we are able to deliver a richer user experience, in line with the requirement about interactivity being paramount.
As for the logic layer, there are three components. First, the web server dealing with required web services, not just intrinsically to the web technology but also domain related calls. Then, we have the core component of the application server, where most of domain related code resides. For instance, code to check cell information across the network or to validate quality parameters. The 3rd module deals specifically with simulation of RAN algorithms. This also fits into the purpose of facilitating extensibility of algorithms, as set in the requirements.
Finally, in the data layer, we have a relational database server where data is held, ranging from the network itself, the simulations to the user-interface history, if any is required.
5. Implementation
In accordance to the architecture shown in
Figure 4, the implementation of the solution upholds state-of-art principles inherent to web application development [
27]. We turn now our attention to the presentation layer, so following a user-centric, top-down approach, namely discussing the network overview and the network simulation modules.
5.1. Network Overview
In general, the overview of the network encompasses two stages. Firstly, the data of interest should be selected via filters available in the interface. That is the case, for example, of cells that must satisfy requirements such as frequency, technology, operator, whether the cell is indoor or outdoor, or specific cells via ID; or DTs related to particular technology, frequency, time interval, and so on. Then, the data collected from the database will be shown over a correspondent geographical map.
Figure 5 highlights the kind of view we expect once we start grasping the state of the network.
For example, after selecting cells and DTs of interest, a user can see the fetched information superimposed over a map and then he or she can interact with. In the end, it follows the classic information visualization mantra: overview first, zoom and filter, then details-on-demand [
28]. Hence, if there is too much information to be visualized at once, the solution will cluster the visual objects and show them as zoom in progresses. Then, at some point, the user will use visual functionalities to explore further the information of interest. For example, to display a panel with information about a particular cell, as depicted in
Figure 6.
On the other hand, users are also entitled to collect and visualize metrics about the status of the network, the so-called KPIs. These are mostly shown via graphs.
Cells and sites representation. Once we reach a point of zoom in over a map where we can interact with cells and sites they are in, let us say over a particular street, the visual representation of those entities and interactivity available is critical to provide a good user experience and so understanding the network. On that basis, we introduce a novel visual representation of cells in a site, as depicted in
Figure 7.
It works as follows: for a particular site, which holds a latitude and longitude, we represent a cell as a 4-side polygon within a flat cone whose pointed vertex is the location of the site and it points towards the direction of the correspondent azimuth. The opening angle is restricted to up to 180°. Furthermore, because we may have various technologies at once—2G, 3G, 4G and 5G—there will be concentric rings, one after the other, for each technology and colored accordingly, and where cells will be drawn in. The flat cone, mostly defined by latitude, longitude and azimuth, is somehow filled in, first by technology and then by the cells of that technology. In order to differentiate cells within each flat cone/ring, we use two opacity levels set in an on-off mode.
The case for indoors is treated similarly but now there is no azimuth so cones have 360° opening compulsory.
It is worth noting that, if for some reason there are too many cells in a particular site, that is, it was expected to graphically represent them just in one particular geographical location, the solution sorts out the overcrowd problem by representing various sets of cells in a spiral fashion so they will not be overdrawn one on top of each other. In the end, cell interactivity is always guaranteed.
Workspaces. In order to improve productivity, the solution allows users to record settings of filters they are using at some point in time, when they are looking for information of interest, so they can use them later on. We call these recordings as workspaces. Hence, users are entitled to create as many workspaces as they want, and to manage them. Later on, probably in a new working session, they may delete, update or upload them, one at the time.
5.2. Network Simulation
The network simulation is the functionality that allows users to infer how the network (the selected site/cells on the network overview section) will behave under certain conditions. To this end, a user is guided through a step-based selection procedure. The naming of each step indicates the transition from general objectives to particular objectives, culminating with the selection of a specific RAN algorithm. More specifically, the procedure comprises four steps, as well call them: Data Context, Playing Mode, Song, and Instrument (see
Table 1).
The Data Context represents the first filter intended to aid the user in the RAN algorithms (instruments) selection process. It allows filtering the instruments by the data source requirement of each. From the four data sources available, DTs, Energy Management (EM), PM, and CM, a user may be interested in evaluating a particular data source, such as PM.
After selecting the data context (one or more data sources), the user selects a Playing Mode (see
Table 1). This filter aims to guide the user towards its end goal. It can be to perform network planning, network diagnosis, or network orchestration (optimization).
Then, depending on the selected playing mode, the respective Songs are presented. A song allows filtering the RAN algorithms according to a specific network area. For instance, if the Playing Mode orchestration is selected, the user is provided with a choice between site or cell configuration. Accordingly, different RAN algorithms are displayed for selection by the software solution user.
As an example, considering that a user selects as Data Context, DTs, EM, and PM, orchestration as Playing Mode, and cell configuration as Song, it is given two instruments: handover and antenna tilt (cf.
Table 1). Considering that the instrument antenna tilt is selected,
Figure 8 is exhibited to the user.
In the case of the antenna tilt optimization algorithm, four user inputs are required. The first input controls which tilt should be optimized, only the MDT, only the EDT, or both. The second defines the optimization objective (minimize interference, maximize coverage or both). Then the coverage and interference thresholds are defined. After, the user adds a name to this simulation and invokes the execution by pressing the call simulation button. Such action will dispatch a running process in background that, once finished, stores its outcome in the database. Notice that this runs in parallel so the user can do other things in meantime (actually, the running of the algorithm may take a while to be completed). At some point later on, the user will check the status of the running of the algorithm. If it is complete, then the user can upload and visualize the results. Any algorithm will have its own set of peculiarities as far as visualization and inputs is concerned.
Therefore, for a particular user, there will be a set of simulations at disposal that he or she required. In addition, those simulations can be managed, not just uploaded but also deleted. It is worth pointing out that it is possible to input cells either by enumerating the cells ID or by drawing areas of interest in the map.
5.3. Technologies
As for the technologies used, we have upheld the requirement of relying on open-source software. In the following, we describe the full-stack software.
5.3.1. Client Side
In accordance with the requirements set for the software solution, the client side (i.e., the Presentation Layer) will run in a web browser. On that basis, we have put together a set of technologies that, at this point in time, are commonly used when building the front-end of a web solution. Such technologies are centered around the JavaScript programming language.
The details are as follows: the front-end is based on the JavaScript library React [
29] that relates itself to the JavaScript runtime environment Node.js. The user interface components are built with Material-UI, which provides React components to build the user interface with a consistent look and feel [
30]. The maps rely on the JavaScript library Leaflet [
31], while charts are created with the help of libraries built on top of React and the JavaScript library D3.js. Notice that D3 is very popular in the data visualization field [
32].
An aspect worth mentioning is that all the rendering of information is carried out in the client side. We put a great deal of workload in this component as, for instance, to be able to minimise the number of connections to the server side and speeding up the response time, so MNOs can have a richer user experience.
5.3.2. Server Side and Data Storage
The server side (i.e., the
Logic Layer) and data storage (i.e., the
Data Layer) are intrinsically interconnected as far as the implementation is concerned. Similarly to the case of the client side discussed above, the focus here was to use well-proven technologies. So, and in accordance to the proposed 3-tier architecture, we have selected the Django web framework [
33] as a primary tool to build the back-end of the solution. It is based in Python and it follows the Model-View-Controller (MVC) architectural pattern. But we should mention that we have discarded the Django functionality to build the front-end of the solution. In our opinion, it does not match the quality provided by React as far as the front-end is concerned.
The database management system that supports the solution relies on the classic MySQL, whose accesses and updates are carried out through a RESTful API, built around the Django REST framework.
In respect to the RAN algorithms, they are written in NET core and run always as background processes in the operating system. Notice that some of these algorithms are by design very time-consuming, so using a programming language like C# was a sensible choice. As a matter of fact, these algorithms were previously implemented and published (see
Section 3).
All in all, despite using various but common technologies, a lot of effort was required to fit them together in a cohesive way.
6. Case Studies
One of the main purposes of the solution is to provide access to a set of high-quality RAN algorithms as a backbone for network simulation and optimization. These algorithms support a user to monitor each network element performance, to conduct processes of Root-Cause Analysis (RCA) for network faults, as well as to identify efficient actions for network performance optimization. For all these tasks, the access to accurate, complete and relevant network data is of utmost importance. The data layer fulfils these requirements and aggregates several network data sources, as network topology, DT data, CM data, PM data, and EM.
We now show two typical use cases for the solution. In both cases, the dataset to be used is composed by a subset of a real MNO topology data, with the respective CM and PM data, and a set of DT campaigns. Moreover, the dataset is bounded geographically to a urban/suburban area of interest and it provides information about 2G, 3G and 4G technologies.
The CM information included both configuration parameters and information about the network topology (sites and cells). Overall, for each site, its location, type (e.g., macro, micro, indoor), and the vendor are provided. For each cell, the available information includes the cells’ antenna height, azimuth, band, frequency, and bandwidth. The CM parameters encompass the MDT, EDT, maximum transmission power, and handover configurations.
The PM data, which was not available for all network cells, included several KPIs from three groups. A group of KPIs reporting the distribution of UE CQIs, considering the CQI indexes (from 0 to 15), another group measuring the cell downlink throughput, and the last group indicating the number of successful establishments, both globally and by the establishment cause (e.g., emergency, high priority, mobile originating data). Additionally, all the available KPIs report to a period of two months with a temporal resolution of 15 min.
The available DT measurements include information about the received power (Received Signal Strength Indicator (RSSI) for 2G, Received Signal Code Power (RSCP) for 3G, and Reference Signal Received Power (RSRP) for 4G), and the interference level (Reference Signal Received Quality (RSRQ) for 4G and Energy per Chip on Spectral Noise Density (Ec/No) for 3G). Additionally, each DT measurement includes the cell identification (Broadcast Control Channel (BCCH) and Base Station Identity Code (BSIC) for 2G, the Primary Scrambling Code (PSC) for 3G, and the Physical Cell Identity (PCI) for 4G), and the measurement frequency, besides the respective measurement location.
Notice that both use cases underlie very interactive workflows, which makes difficult to truly depicting them in this document. Anyhow, the goal is to provide a glimpse about the potentialities of the solution.
6.1. Network Troubleshooting
A MNO, in the daily tasks of OAM, has to monitor the network performance continuously while investigating network incidents and failures to reestablish services’ QoS or optimize the network performance to the desired levels. In this case study, we show how a radio engineer can troubleshoot a network service drop, in a 4G service, supported by the proposed web-based solution, considering the workflow in
Figure 9.
6.1.1. Setup
The setup step is intended to give an overview of the geographical context of the failure considering the network topology, so that the relevant nodes can be analyzed. This initial step can be accomplished by virtue of the network overview (
Section 5.1), which allows the user to select an interest area (failure location) and filter the cells context considering technology and frequency. After applying the appropriate filters, the result from
Figure 10 is obtained. In this case, besides the interest area corresponding to the failure location, all cells regardless of technology and carrier frequency are represented for the complete network context. At this stage, the user can inspect with more detail each network element (as in
Figure 6).
6.1.2. Analysis
In the analysis setup, the RCA is performed subjected to different hypothesis, as root causes for the service drop: lack of coverage; high interference; cell accessibility (see
Figure 9). For network metrics as RF coverage and interference, which are more stable than other indicators, the use of DT data is common, when available. Thus, a user trying to evaluate coverage in a given area can select this data source to be added to the map, as in
Figure 11.
The DT color scheme ranges from high-received power (red) to low power (black), thus identifying an area in the center of the interest area with the lowest received power. In this case, just the 4G DT measurements (best sever only) are represented, however the user is able to add or remove data, by filtering the relevant DT information. However, as the lower range of the received power corresponds to −105 dBm in a 4G network, even though being a low value, do not justify by itself the service drop. So, the RCA moves into the interference domain, still based on DT data.
Another possibility to visualize DT data, and gauge the corresponding QoS levels, is to represent it in histogram format, as in
Figure 12. The user can visualize the abscissa values dynamically when crossing the mouse over the graph.
As the 4G interference is the domain being considered, the select metric is the RSRQ (that has a reporting range between −19.5 dB to −3 dB [
34]), where it can be stated that this area is characterized by high interference, with a considerable number of measurements below −14.5 dB.
To evaluate in detail the accessibility of a given network node, another data source is required: PM data. This data source, with multiple KPIs, is also available in the solution’s network overview module, to be explored and visualized thought the cell objects represented in the map. A user by interacting with the cell attached to the service drop can select and visualize the available KPIs, as in
Figure 13.
Up to two KPIs can be represented in simultaneous, and a sliding window bar allows focusing on specific time spans. The available KPIs included information about the UE CQI (for all the possible CQIs) and the number of successful connection establishments. Also, several KPIs reporting the downlink traffic (volume and throughput) were available.
With respect to this study case, a KPI with the occurrence of UE CQI 1, which corresponds to the use of the most robust modulation and codification, along with another KPI with the occurrence of successful establishments were selected. Furthermore, using the sliding window to focus on the failure time, a sudden rise of CQI 1 is reported while the successful establishments drop. This erratic behavior, in an area with moderated RF conditions can be concluded as the cause of the service drop.
6.2. Network Diagnosis and Optimization
The assessment of the network QoS levels is also a routine operation, considered in the OAM tasks of a MNO. Additionally, a MNO has often its network divided into multiple geographical areas, which are attributed to different engineering teams. In this case study, we present a possible workflow using the developed web-based solution towards diagnosing and optimizing, a specific area when applying the integrated RAN algorithms (see
Section 3).
6.2.1. Diagnosis Stage
In the diagnosis stage, besides focusing on a specific geographical area, the analysis is also centered in a particular 4G carrier. As a first step, the related data is loaded into the solution, as in
Figure 14.
In the center of the figure, the circles with the darkest colors identify DT measurements with received power around −120 dBm, while being the best server in that carrier frequency. From the coverage perspective, it indicates a low QoS performance, which can be fully analyzed in
Figure 15.
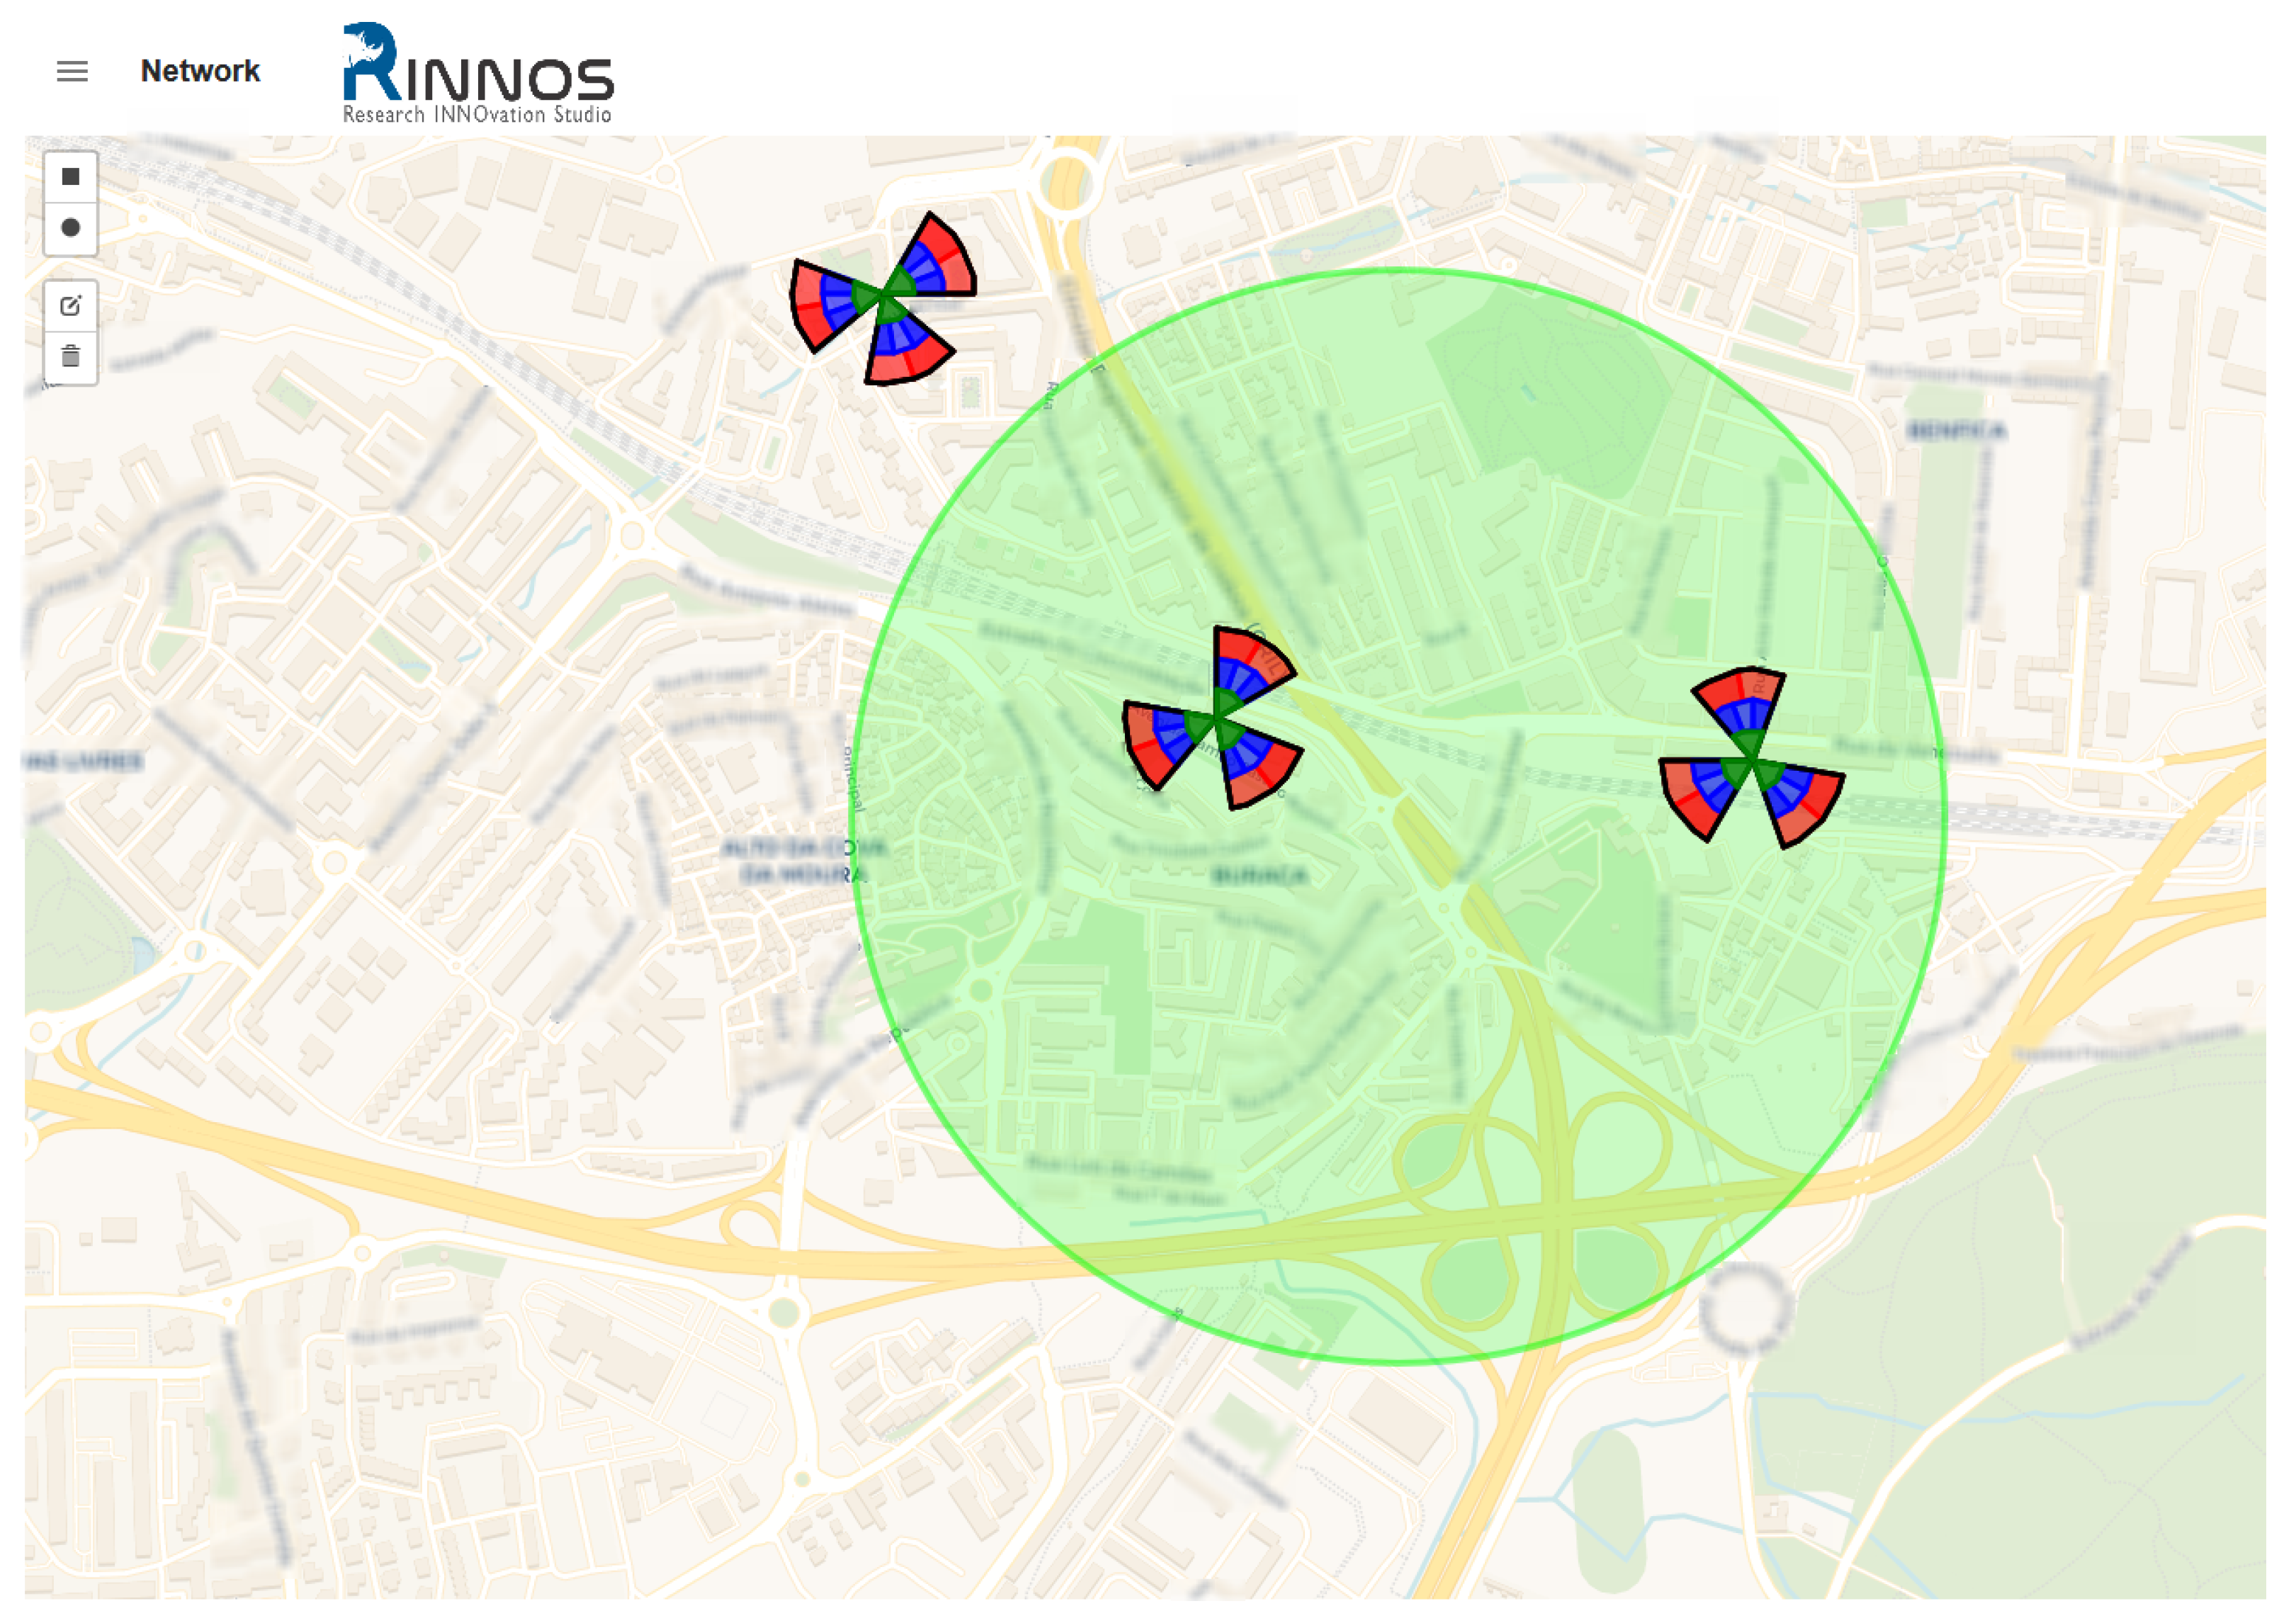
In the following, the aim is to bound the specific areas with low coverage, assuming a −120 dBm threshold, and to identify which of the surrounding cells are the dominant cells in the low coverage areas. This can be accomplished, by selecting the cells which are more likely to be responsible for the low coverage and executing the coverage holes algorithm, as one of the diagnosis RAN algorithms integrated into the developed solution. The selection process is highlighted in
Figure 16, where a map selection feature is used to select the cells contained in the green circle.
By executing the coverage holes algorithm, specific areas, where the low coverage is both limited geographically, prevalent and consistent regarding its measured power, are identified. In this case, four individual areas were identified, being attributed to three cells, as represented in
Figure 17.
The colored circles identify the DT measurements that being best server signals, do not guarantee the required coverage. Moreover, the different colors pinpoint the corresponding cell by having the same color, respectively.
Additional DT measurements also have a received power lower than −120 dBm, however these tend to be sparse geographically, and are more likely a consequence of the log-normal distribution of shadow fading than actually a systematic behavior.
However, by analysing the obtained results it can be questioned why does not the grey cell (bottom right side of
Figure 17) provides good coverage. To further evaluate this scenario, the coverage estimation algorithm (see
Section 3.1) was used to estimate the received power, but it was selected to represent the respective diffraction losses, instead of the estimated received power, as in
Figure 18.
In
Figure 18, it can be verified that in the area corresponding to low coverage, this cell presents high diffraction losses due to Non-Line-of-Sight (NLoS). Thus, even though the low coverage area is close to the cell stressed in
Figure 18, this area must be covered by other cells.
After diagnosing this area with low coverage, and identifying the corresponding cells by using the coverage holes algorithm, optimization stage actions are considered in the following, to improve the QoS levels.
6.2.2. Optimization Stage
Considering that the cells causing low coverage to UEs have been identified in the previous stage, the optimization of the respective EDTs is a possible solution to restore (or even improve) QoS. Thus, the antenna tilt optimization algorithm was configured to maximize the coverage according with the previously used low coverage threshold, −120 dBm. In
Figure 19, the DT measurements corresponding to that geographical area were filtered to only the four cells previously associated with the low coverage areas, allowing to visualize their joint service area.
The antenna tilt algorithm considered the cell’s initial EDT configuration, and optimized the EDT configuration by evaluating the coverage impact in all the DT measurements represented in
Figure 19. Interestingly, the algorithm suggested keeping the actual EDT configuration. In fact, these cells have wide service areas (see
Figure 19) so, a new EDT configuration that would increase the coverage, in the identified areas, while not causing excessive degradation in other areas, was not found. Moreover, only 1.4% of the measurements have been identified below the serving threshold, which limits the effectiveness of a tilt optimization, without causing additional signal degradation.
In scenarios where the antenna physical parameters are already optimized, a possible workaround is to optimize other configuration parameters, as the handover parameters. In this case, the DT measurements identify low coverage areas for a specific carrier frequency; however, other carriers might provide good coverage. To evaluate this hypothesis, another carrier frequency was represented in the study area (see
Figure 20).
Comparing the initial carrier coverage (
Figure 14) with the new carrier presented in
Figure 20, the coverage for this new carrier frequency does not present low coverage areas. Thus, the handover optimization algorithm can be executed for that area, to guarantee that when a UE reaches the low coverage area, the inter-frequency parameters, allow an handover to a new frequency, maintaining QoS. However, as for the study area, there were not dedicated DTs (mandatory for the execution of the handover optimization algorithm). Hence, for demonstration purposes, an example is presented in
Figure 21.
In
Figure 21, two areas with low coverage in dedicated mode are represented. These areas were optimized by adjusting the inter-frequency parameters between two distinct carrier frequency cells that serve in that specific area. Applying the algorithm’s proposed configuration, the network will allow UEs to handover from the worst coverage carrier frequency to the other, before the service QoS drops excessively.
7. Conclusions and Future Work
This paper presents a web-based modular solution that allows users to carry out assigned tasks of network OAM in an efficient and user-friendly manner. Its modular architecture provides access to multiple MNO data sources with the associated visualizations, and data management processes. Additionally, it is developed to operate a set of RAN algorithms while allowing the addition of future algorithms. With this software solution, users can easily overview the state of the network, either by focusing on a particular geographical area, or by looking at a particular site and/or cell, as well as considering overall KPIs. After, data analysis decisions can be made to optimize the network behavior. This process of decision-based optimization is mostly supported by the outcome of simulations that users may require to be run. The solution provides a simulation module containing nine RAN algorithms, for that purpose.
From the two use case studies presented in
Section 6, we have demonstrated how a radio engineer can benefit from the proposed web-based solution, to conduct complex OAM tasks in a user friendly and efficient manner. From firstly data extraction, including multiples data sources and domains, in a particular context, to extracting benefit (detailed network diagnosis, or network optimization/simulations) by making use of high-quality RAN algorithms, the solution should represent a step forward in mobile networks’ optimization. Besides the presented use case studies, the combination of all RAN algorithms, with the multiple data sources, and the functionalities implemented in the web-based solution, enables a wide range of tasks within an operator OAM life cycle, by exploiting the intuitive design of the solution.
Finally, regarding the visualizations we get, it is worth pointing out the novel visual representation of cells in a site, which has proven to be very user-friendly and effective.
In the future, we expect to pursuit various research paths in order to enhance the solution. In particular, the following ones deserve consideration:
Evaluate and improve the software solution performance and efficiency.
The extension to 5G for all algorithms, with the inclusion of more 5G data sources.
The transition from a model based on a relational database to a NOSQL model, in order to scale the volume of stored data as well as its variety.
The solution interface adaptation (especially web services) to carry out all processing in the cloud (or in a big data related structure), thus allowing to process a larger volume of data in a relatively short period of time.
The expansion of the web-based solution to the transmission and core network domains by including new data sources and incorporating new algorithms.


 ,
, 


