1. Introduction
This age is the age of connection—connecting fields of knowledge, which have been developing independently for a long time, but also connecting ideas, cultures, philosophies, and peoples. Globalization is closely linked to the digitalization of the world. More and more actions take place in the virtual reality instead of the physical sphere; the material world is enriched by the extended reality. The progress influences the society, as well as individuals, all the inhabitants of the developed parts of the world, and the whole planet.
There is an increasing development in the field of data analysis. The new datasets are bigger and more complex than those recorded in previous periods. They are often unstructured or semi-structured, ideally enriched by metadata. These new sets are frequently measured in terabytes or even petabytes. There is an increasing demand for executing the data in real or near-real time, or for predictive maintenance, which helps to prevent failures, thus significantly decreasing the time and finances needed to fix the problems which have already occurred. The methods for operating data that were used in previous periods are ceasing to be effective. They are not flexible enough, and they do not suffice the rising demands anymore.
The traditional statistical methods for operating data are therefore being substituted by more complex and more practical methods collectively known as Big Data, developed specifically for working with huge data volumes. The phases of data processing are described by CRISP-DM methodology, which is generally accepted for its intuitive nature, simplicity, and logicality. This methodology serves as a firm base for data analysists and data scientists.
In the analysis, the better we know the process we are working with, the data sources we draw from, and the overall context, the simpler the investigation of error sources and searching for hidden patterns are. The data scientists cooperate with the experts from the examined field and consult the project’s next steps with them. It is advantageous for the data scientists to follow the progress of data analysis, its current fields of interests, new methods, and solutions, as well.
3. Goals
As the literature overview suggested, most of the research focus either on solving a certain problem, summarizing knowledge of the field, or developing a specific solution. All of these types of research are productive and required. However, we identified lack of complex best practices based on real-world problems. Out of 43 examined projects, only four dealt with this topic. Therefore, we decided to fill in this gap and to come up with our own best practices for the field of production industry.
We base our proposal on three main points: the CRISP-DM methodology as the theoretical framework, the literature overview as an expression of current needs and interests in the field of data analysis, and case studies of our projects as a source of real-world experience.
The proposal will be presented in a form of BPMN (business process modeling notation) diagrams, lists of most common errors, possible solutions to them, and other recommendations.
To achieve this goal, the following steps need to be taken:
1. Literature overview:
When performing the literature overview, we divided our area of interest into four partially overlapping topics: Industry 4.0, Big Data, CRISP-DM, and predictive maintenance. All of them are closely connected to the main topic of this research. An overwhelming majority of the review papers and studies focus on production industry and related fields, but briefly deal also with other fields where Big Data and CRISP-DM methodologies are currently being used, aimed on the up-to-date trends.
2. Case studies:
There are six real-world projects from the authors’ praxis used as a practical base for the paper, and they are later described in detail. All the projects deal with problems from real companies and represent important factors in forming our best practices.
3. Solutions described on case studies for the selected phases:
At least two projects (case studies), together with the practical solution described in details, are chosen for the selected phases of CRISP-DM, ‘Data Preparation’, and ‘Modelling’. Every project will be used at least once in the whole process, and some will have several instances. There, the practical problems will be demonstrated in order to extract the knowledge later to make it more general.
4. Best practices for each of the selected phases:
The solutions of all the projects for a phase will be combined and generalized to form best practices for the phase. This proposal will include a list of problems typical for the phase, recommendations, and diagrams.
5. Best practices for the whole process:
The overall best practices will be formed out of combination of best practices of the phases. Apart from typical problems, their solutions, and diagrams, it will also include applicability of the best practices, as well as industry production specifics description and possible transferability to other areas.
4. Materials and Methods
Researching papers on the topics of Industry 4.0, Big Data, CRISP-DM, and predictive maintenance revealed that there is a fair number of studies solving real-world problems and also a lot of theory-compiling works, but rarely there is a project aimed to present complex best practices for data analysis based on praxis in a certain field. We see this as a gap to be filled.
We assembled our documentation from real-world projects from our praxis. We have chosen current projects, thematically similar (from the production industry), but different in their nature (goals of analysis, data acquisition methods and data structure) to serve as the basic for experience extraction and best practice generalization.
The authors were directly involved in all of the mentioned projects as a data scientist and/or a project manager.
The projects introduced below serve as case studies for demonstrating one or more phases of CRISP-DM methodology. Companies’ names (places of project implementation) and other distinguishing details were omitted to keep the confidentiality contract. Moreover, because of data sensitivity, most of them were anonymized. The case studies are addressed using the names Project I to Project VI. Although anonymized, for every project/case study, the important details, such as goal, list of available data sources, and interesting points of the analysis are provided. Projects I–III are aimed particularly at the ‘Data Preparation’ phase, and Projects IV–VI are focused preferentially to the ‘Modelling’ phase.
We were working with several software tools when performing data analysis. Most often, we used the following ones:
RapidMiner—for preprocessing during the ‘Data Preparation’ phase; for various analyses during the ‘Data Understanding’, ‘Modelling’, and ‘Evaluation’ phases;
Python—universal tool helpful in data acquisition during the ‘Data Understanding’ phase; numerous preprocessing and analysis tasks during the ‘Data Preparation’, ‘Modelling’, and ‘Evaluation’ phases; and visualization of results during the ‘Deployment’ phase.
Elasticsearch—for visualizing data during the ‘Deployment’ phase and for operating extremely large datasets (unmanageable by RapidMiner) during the ‘Data Understanding’ and ‘Modelling’ phases.
4.1. Project I
The goal of the project was to predict production failures on automated screwing heads, therefore lowering failure rate on the screwing mechanism. Failures were connected to violation of established boundaries of key parameters: adhesive pressure, axial torque, and screwing depth. There were other available parameters of the process: quality and chemical constitution of material, its thickness, position of screw, etc.
Data sources:
The last data source (‘product moves’, containing timestamps for various points of the product occurrence during the production process) was originally not meant to be used at all. However, it had to be included early after the start of the ‘Data Preparation’ phase, since there was no identifier in the data common for all the sources, and, furthermore, they were not time-synchronized, making joining of the sources impossible. The ‘product moves’ data source contained enough information to connect it with all the three other sources.
Specific problems arose due to multilingual nature of the company. Attribute names were often listed as a mixture of two or more languages, and the same applied to notes written manually by workers. This made some words illegible when using specific characters (such as Slovak letters with diacritics), particularly when transferring from one data source to another. Another problem connected to the issue was mixed usage of decimal point and decimal comma. In some cases, also dates were affected by multilingualism: date formats ‘yyyy-MM-dd’ and ‘yyyy-dd-MM’ were used interchangeably, and on some occasions, some of the records were accepted in incorrect format, while others were identified as text by analytical tools. Another minor (but still important) issue was the numerical values being recorded together with their units (such as [Nm] in screwing moment). If this was omitted during the preprocessing phase, the attribute was often misclassified as textual during the data modelling phase, while it was clearly a numerical attribute with wrong formatting.
After successful preprocessing, in the ‘Modelling’ phase the appearance of various error types during individual weeks was analyzed on six-month period sample. We realized that the major problem of the screwing process was the screwing technique, so after that we focused mostly on ‘Errors of the connecting technology’ data source, which contains more detailed description of the attributes evaluated during the process. Further analysis was applied on ten robots with the biggest number of errors.
4.2. Project II
The goal of the project was investigating correlations between various departments of the company in order to optimize financial flows. Important part of the task was to prepare financial data from ERP level to a form suitable for standard business reports. That included setting up regular monthly exports, data preprocessing, and construction of correlation matrices in order to tabularly display relations between company departments. The project dealt with a lot of sensitive data; therefore, data anonymization was an important part of the task.
Data sources:
In the ‘Business Understanding’ phase we defined requirements for export from required part of database. Exports were provided in the ‘Data Understanding’ phase by the financial department employees. In the first attempt, data were exported via script. The plan was to merge several tables at once. The exported file contained a large matrix of data, with a too-complex structure, and column separator was not integrated correctly. After that, several files were exported, with one account per file, and with names of departments used as attributes (column names) as a result of the second attempt, resulting in a very high number of attributes (more than 700) and making further processing of data quite laborious and impractical. Finally, the requirements for export were redefined one more time. New set of exports was performed, containing multiple files with one department per file. This structure was validated by both us and the management and used in the next phases of the process.
There were three different ways in which accounts can be identified: ID, name, or ID+name. The redundancy of the dataset represented the biggest problem (alongside the general issues such as empty rows). Furthermore, while the (anonymized) IDs were consistent, the names of the same account differed in spelling (with or without diacritics) and letter case. These issues were addressed in the ‘Data Preparation’ phase.
Once prepared, the data were used for construction of various correlation matrices in the ‘Modelling’ phase, as to uncover and explain relations between finances of different departments, accounts, for different employees, time periods, and sources. In the ‘Deployment’ phase, the results were presented to the management of the company, and after incorporating their suggestions, regular exports were set up.
4.3. Project III
The goal of the project was to integrate data sources in painting process in order to find correlations between painting attributes and their subsequent optimization. Painting process is one of the most complex processes within the company, consisting of several sub-processes, and connected with other processes via inputs and outputs. Inconsistency and insufficient documentation evocate need for describing and visualizing relations between individual components.
Data sources:
Paint thickness;
Paint colors;
Paint structure;
Paint usage;
Paint audit;
Process values;
Alarms;
Product moves;
Technical information;
Meteorological data.
The company management was interested in integration of the sources concerning Paintshop. This would be impossible without deeper understanding of sources and the overall process. Every part of the Paintshop process was supervised by a different person or people, and just a few of them were in mutual contact, causing data fragmentation. After internal discussion during the ‘Business Understanding’ phase, we came up with the following steps that are to be taken before moving on to the integration:
First, we had to accumulate all the accessible information about the painting process as a whole and use it to create scheme of the process, as to mark all the sub-processes, their respective data sources, and relations between them within the process flow. Second, we had to make a list of all responsible persons, contact them and gain as much documentation and information about the sources as possible. Third, we had to describe each of the sources and decide about their usability within the integration.
The data were heterogeneous in both quantity and availability. Only four of the sources offered regular exports. Most data could be obtained only via one-time exports by a third person who could provide us with the required data only after we first obtained permission from the management of the company. This prolonged the data-obtaining process and rapidly diminished possibilities of real-time monitoring and analysis. Each data source had to undergo data preparation phase individually. Two of them may serve as examples here.
The ‘paint thickness’ data source contained information about paint thickness, measured at several points of the car body. Its structure proved to be extremely problematic for the further analysis, as the key attributes were situated in the first column, thus precluding us from analyzing multiple car bodies at a time. To handle this, we designed a script via Microsoft VBA in Microsoft Excel environment, providing following tasks: transposing key attributes from rows to columns; creating new columns and names of attributes; computing min, max, and average from the measured values; recording the values into new attributes; and merging all the Excel sheets.
Meteorological data were obtained from a small meteorological station placed in the company, monitoring several weather attributes—meteodata—such as temperature, humidity, and wind speed. The problem with the data source was inconsistency in frequency of recording. While in 2018 (the year when we were working on the project) the data were recorded every 5 min, the historical data (2015–2017) were much less frequent, being recorded only once an hour. Therefore, we proposed a process in RapidMiner with three basic steps: generating new time units attributes (year, month, day, and hour) from the more-detailed (newer) data, aggregating newer data by all the time units and averaging their values, and merging the two sets.
Compatible time interval represented the main criterion for data integration on the selected sources and possibility to connect them all in real time to support predictive maintenance, and therefore improve quality of the painting process was set out as the ultimate objective.
4.4. Project IV
The goal of the project was to uncover causes of production failures in gluing process. We disposed with process values with clearly marked failure states, but there was neither documentation about process and its parameters nor an error log, and it proved impossible to contact a responsible person. Therefore, a big part of analysis consisted of identifying cycles and sequences within the process and categorization of failures. Only that allowed to form theories about causes of failures.
Data sources:
The original goal, as defined by the company management, was rather vague: They were dissatisfied with the number of errors cumulating within the process, and wished the error rate to be decreased. Along with that, they wanted the cause(s) of errors to be discovered, so that failures can be prevented in the future.
After obtaining the data, followed by internal discussions over them, we decided that this goal must be extended. With documentation inaccessible, we knew we were going to spend significant amount of time figuring out and describing the inner functioning of the process. Therefore, we included this important step into the business goal.
Before we started looking for anomalies in the data, we needed to know what normal process flow looks like. Some attributes in the set were extremely disperse (represented by coefficient of variation >0.3). Normal distribution was scarce. That implied we should look for more than one pattern (or set of desired values) within the data. When we applied a heatmap for the data sorted by timestamp, we were able to see some repeating sequences. They were visible in most of the real and average values but seemed not to affect the last values. There were at least six different sequences with a different frequency.
After the ‘Modelling’ phase of this project, it proved to be impossible to use data-mining methods in the contemplated way; there was clearly no connection between available attributes and the errors, as the attributes did not degrade over time, and their values directly and non-directly preceding production failures were not unusual in any way. However, even though the contemplated way of uncovering patterns was not usable, we noticed a couple of interesting features in the data while performing analysis. We discussed this with the management, and together defined new goal for the project. We agreed we would assemble rules for cases possibly leading to failures.
In the ‘Evaluation’ phase, after investigating the conditions by which the errors happen, mostly based on categorical attributes (which values occur in categorical attributes during failures, and to which cycles they usually belong?), on consecutiveness (what sequences of cycles usually lead to a failure), and on time criteria (how often the failures happen, and how much do they tend to cumulate?), we were able to form a hypothesis. We hypothesized that an algorithm responsible for switching cycles/tools/locations on a product is not working correctly. As one of the categorical attributes kept the last value of one of the previous cycles, it was possible that the algorithm gets stuck on the last point of that cycle without resetting to the required position, thus leading to inevitable collapse. Such a theory was unprovable without further insight into how the algorithm works (and, in fact, whether such an algorithm existed, as there was a fair possibility that the process is operated manually).
After that, in the ‘Deployment’ phase, monitoring was set up. All the numerical attributes were displayed as process flows, grouped based on their nature. Categorical attributes were visualized tabularly, divided by cycles. Errors were displayed in consideration of the facts exposed during the analysis.
4.5. Project V
The goal of the project was to design a monitoring system with anomaly detection for welding process in real time. Similar to the previous project, no documentation was accessible, and because of that, initial identification of patterns within data was necessary. Moreover, there was no information about production failures (it was impossible to clearly distinguish error state from non-error state), leading to the need of drafting the identification procedure of (possible) failures.
Data sources:
Similar to the previous project, no documentation to the process or dataset was available, as well as no information on normal or error states. Furthermore, the error states were not even marked in the set. Therefore, it was necessary for us not only to look for cycles and sequences typical for the process, but also estimate those parts where the cycles were broken or had incorrect values. That was the purpose of the ‘Data Understanding’ phase, which was a dominant phase for this project.
We repeated the approach from the previous project and depicted the data via a heatmap. This time, however, we were not able to use the real values of the attributes in every moment, so we used values aggregated by second instead, in order to visualize all the attributes at once. This led to decreasing the accuracy of the data, and the patterns we were able to see were not absolutely reliable. We needed to add one more factor to improve reliability of the findings.
Hence, we investigated the ‘Timestamp’ attribute. The differences between two consecutive rows (in seconds, which were the smallest time units after the aggregation) were of two categories: they were either under 5 s, or above 30 s. We assumed the former were two rows of the same cycle, while the latter were two rows of different cycles, with the >30 s gap/pause between them.
Understanding so we were able to divide the process flow into individual cycles, and to identify these cycles, to which we assigned names from the end of the alphabet, e.g., X, Y, Z, etc. We could not be sure, however, whether they each belonged to a different procedure, or whether they were modifications of the same procedures, which had developed over time. There were 7 different cycles in terms of process values (visualized via heatmap), but no more than three of them were present at a time during the observed period taking almost 4 months. When we compared their lengths, we concluded that there may be three cycles in the process, updating as the time goes, one of them significantly major in frequency, and two minor ones.
When marking possible error states, we divided the estimated process failures into three categories: The first type was blocks with incorrect values, which significantly differed from the values typical for any of the cycles. As these values might alternatively represent other, yet undefined, cycles, we decided we would call a cycle of those blocks which represent at least 5% of all the blocks; otherwise, we would consider it an anomaly and a potential error. The second type was blocks which copy parts of some of the cycles in term of process values, but which were significantly shorter than the respective cycle. This might mean the process had either finished too early or began too late and therefore could not be completed successfully. It is reasonable to consider these blocks to be failures within the process. The third type was blocks consisting of a single value. They are, indeed, an anomaly; however, it stays unclear now what caused them: they may belong to the previous or following cycle, being recorded at the wrong time, or they may be accidental recordings of the process values of the machine.
In the ‘Deployment’ phase, we set up online monitoring with anomaly detection, similarly to the previous project.
4.6. Project VI
The goal of the project was to design and implement a system for prediction of the final state (error/non-error), based on input parameters of a production process in real time. Input and output numerical values of two parameters served as a training set. The data-mining part could be approached as both classification and regression problem.
Data sources:
The dataset consisted of measurements from several points on the surface of the products, recorded for 2 months. Each point had been saved in an individual .csv file and contained approximately 19,000 records. Out of the points, 26 contained enough measurements for both numerical attributes on input and output to performs further analysis.
Before applying any data-mining models, we constructed correlation matrices for each point as to see whether there are any meaningful correlations. There was at least one moderate correlation between inputs and outputs in 18 out of 26 points. We also searched for correlations between points of the groups. As a results, there was at least moderate correlation found in 7 out of 8.
We decided to use three different approaches which we would compare to each other in the end. Two of them dealt with individual points: the first one used models built via Rapid Miner, and the second one was an experimental setting of boundaries via Python. The third approach was similar to the first one, but instead of individual points, groups were used. We chose classification over regression for the task (though both methods would be possible due to the nature of the data) and we used sensitivity as an evaluation criterion.
Though the initial correlation matrix looked more in favor of groups (87.50% at least moderately correlated vs. 69.23% for individual points), the results of validation proved different: Approach 3 (data-mining methods used specifically for groups) was successfully trained for only 37.50% of cases, which was less than for any other case; and furthermore, no groups were validated successfully.
This left us with the first two Approaches, from which the first one was the very best (53.85% validated successfully on both cross and split validation), followed by the second Approach (46.15% successfully validated). In the last step of the ‘Modelling’ phase we combined the two Approaches in an ensemble model with results calculated via voting.
The monitoring was set up in near-real time in the ‘Deployment’ phase. Before visualizing, the data were bulked from Qdb database (‘Data Sources’) into Kibana/Elasticsearch (‘Data Storage Layer’) via a Python parser (‘Data Acquisition Layer’). On frontend, the data from Input and their predicted Output were displayed in form of ‘traffic lights’. The table contained ID of a product, timestamp of recording, point on the surface of the product, values from two Input attributes, and predicted Output—green for OK, red for NOK, intuitively.
5. Results
The projects we were working on provided us with two types of useful experience. First, there were aspects in which most of the projects followed the same line. We can think about them as typical for production industry. This knowledge is the easiest to generalize and forms a base for our proposals.
Then there were features that differ for certain projects. These specifics impersonate problems (and solutions) that cannot be fully generalized because of the lack of examples (and therefore lack of variability required for generalization), but they are still going to be incorporated to some extent, serving as basis for future projects closely dealing with problems only briefly touched within our proposal.
For the purposes of this project, we are proposing our best practices for the ‘Data Preparation’ and ‘Modelling’ phases, and to the process as a whole.
5.1. Data Preparation
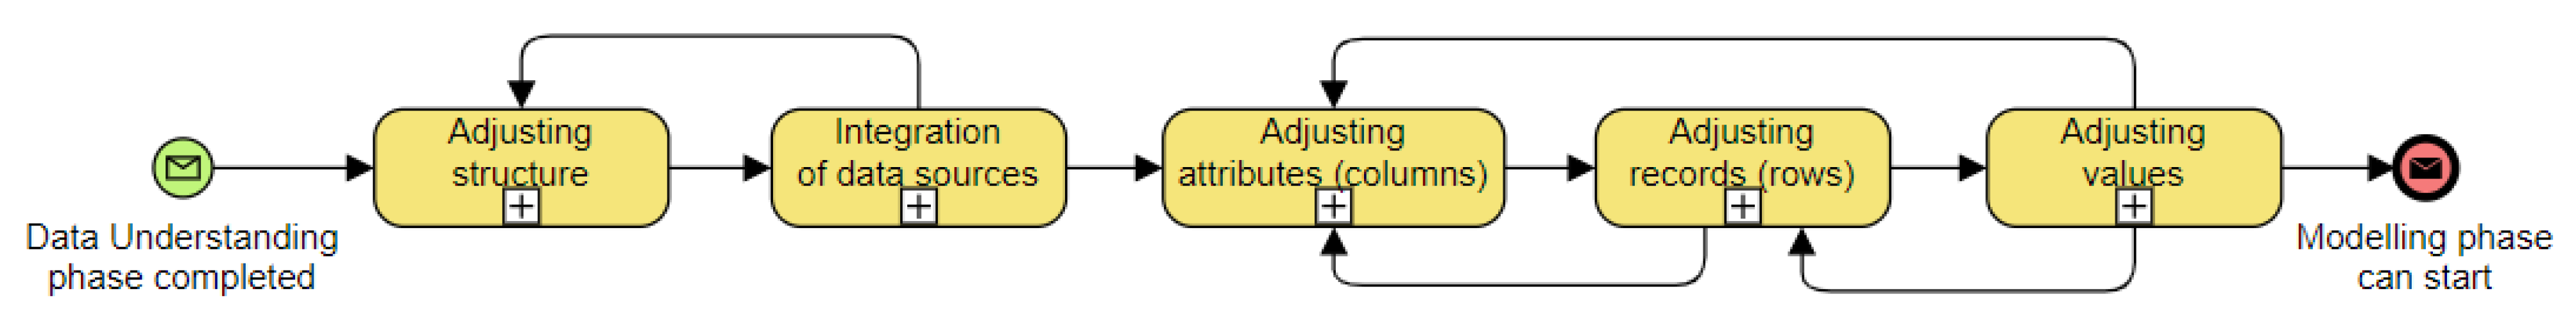
After documenting the ‘Data Preparation’ phase for various real-world projects, we assembled the most common problems and their solutions. In the top BPMN diagram (
Figure 1), there is a proposal for the top level of this phase. The structure is linear, with two main parts, which can iterate, if necessary, until the desired result is achieved. The process follows the ‘Data Understanding’ phase. It starts with ‘Adjusting structure’, being either working with given exports, or returning to the ‘Data Understanding’ phase for a while, to design a new export structure that is close enough to the required structure (if possible and necessary). The next step is ‘Integration of data sources’ via a common identifier (e.g., ID), timestamp, composed keys, etc. If two sources cannot be integrated in a meaningful way, a return to the ‘Data Understanding’ phase, or even the ‘Business Understanding’ phase, may be necessary to reconsider either available data sources or business/data-mining goal, respectively. Successful integration is followed by adjustments inside the source. The following order proved to be the most advantageous one: First, ‘Adjusting attributes (columns)’ is performed. The desired attributes are selected, new ones are calculated, and supplementary ones are removed. Then, ‘Adjusting records (rows)’ follows, as to keep only the records happening in the desired time periods (e.g., omitting records from holidays and weekends or keeping just records from specific working shifts). This also includes dealing with empty and semi-empty rows. The latter may be either removed or reconstructed. The last step is ‘Adjusting values’, in which various issues are addressed, concerning data types and formats. In multilingual companies, language issues were found to be very important and may take time to be solved (and unearthed, in the first place). After that, the ‘Data Preparation’ phase is completed, and the ‘Modelling’ phase can start.
Identification of sub-phases of a certain phase, as presented above, was only one of the reasons why we decided to use case studies as a basis to form our proposal. Another, and arguably the most important, reason was to identify problems occurring in real-world projects. That is the kind of knowledge only praxis can provide, and a source of a company’s best practices. Some of the problems tend to be more general, recurring, applicable to almost every project; such problem is, sadly, lack of (available) documentation. Others are more specific, but still common enough to be considered for a certain group of projects. Then there are very specific problems which occur only rarely, but are also documented in case a similar project will be solved in the future, and also to challenge new data scientists in the team by introducing them to the hypothetical problem. Our proposal is based on problems which occurred in at least two presented projects.
We assembled the most common problems that occurred to us during the ‘Data Preparation’ phase. We then classified these problems into groups, based on their affiliation to one of the six data-quality dimensions.
Accuracy:
Completeness:
Consistency:
Structure incompatible with other sources;
Missing common unambiguous identifier;
Two time periods have completely different structure;
One period recorded much less frequently;
Naming inconsistencies;
Spelling inconsistencies (aka case, diacritics);
Inconsistent usage of decimal point/comma;
Different time formats;
Names/text written in mix of languages.
Timelines:
Validity:
Structure not suitable for software tools;
Structure too complex (e.g., consisting of one large matrix);
Big number of attributes;
Attributes in rows instead of columns;
Composed (non-atomic) attributes;
Categorical attributes not usable in data-mining methods;
Records from non-working days misrepresent results;
Characters not manageable by the process;
Words illegible where using specific characters;
More versions of spelling.
Uniqueness:
Structure of the data should be already decided in the ‘Data Understanding’ phase, before first export is made; these exports are usually manageable by a data scientist, if they set up the export themselves, or if they cooperate with the person responsible for the exports. It is important to get with the structure as close to ideal as possible. The crucial criterion is manageability by software tools used in the ‘Data Preparation’ phase (and following phases). During this step, problems such as a too-complex structure (consisting of large matrices) or a big number of attributes are addressed. Ideal structure for most of the data-mining projects is with attributes presented in columns (with the first row as a header holding attributes’ names) and individual records (distinguished by timestamp, ID of product, etc.) in rows. This structure is acceptable as an input for data-mining methods in software tools such as RapidMiner, Statistica, etc. When designing required structure, one must think of the way the data should be later examined. For example, ‘Are we going to analyze every machine/account/year separately?’, ‘Is our focus on errors solely, or on the process values?’, or ‘What structure are the other datasets in, will they be compatible enough to be joined together?’ Most structure adjustments can be achieved via scripts, either in scripting languages, such as Python, or even via VBA (Visual Basic for Applications—programming language for Microsoft Excel). RapidMiner also provides various preprocessing options, and alongside Python, it was our most valuable tool.
It is expected that all the attributes will be measured at once. Most exports provide this, but some are only able to provide one attribute (process value) at a time, along with timestamp (and some additional information, such as machine identifier). This proves to be a viability problem for future analysis. It can be addressed in the following way: First, all the data are recorded in one file, one row per record. One column is for timestamp, another is for the parameter identifier, and the third one is for value. Second, time units (years, …, milliseconds) are calculated from the timestamp (number of units depending on accuracy of said timestamp) for each row. Third, suitable time unit for aggregation is decided—that means the most specific time unit which simultaneously keeps an adequate proportion of each attribute (with minimal information loss). The time unit should ideally cover all of the attributes at once. Four, the attributes are aggregated by timestamp and value (ideally averages, or average+mode in the case of categorical value) and grouped by chosen time unit (and the ones preceding it).
Some of the sources, especially the ones recorded for a longtime period, may undergo major structure changes over time. This needs to be considered and resolved before joining with other sources. This may involve changing frequency of recording. If the data are to be used together, the more frequently changing data have to be adjusted to match frequency of the other part. Similar to the problem mentioned in previous subparagraph, this may be performed by aggregating values of the more frequent part and grouping them via the smallest time unit presented in the less frequent part.
Joining two (and cumulatively more) datasets is ideally performed with ID (e.g., of a product) as a primary key. If there is no common unambiguous identifier present in both datasets, combination of other attributes may serve as a substitute, in case their combination clearly distinguishes one specific record from all the others. For time-synchronized data sources, the timestamp (or its combination with other attributes) can serve for this purpose. If none of these options is available, and joining the sources is crucial for further progress, accessing another data source may be considered, one which includes indications to both sources, recorded at once.
Once joined, inner issues should be resolved one by one. It is advantageous to start with attributes (columns) as a whole, as it spares time that would be otherwise used to modify attributes that may not even be used in the end. This step includes removing supplementary attributes/selecting useful ones, generating new attributes, and various adjustments of the existing ones. As to the removal, this means redundant ones (due to their occurrence in more than one source, or their entire substitutability by other attribute), or rigid attributes (in term they never change—such as technical information; however, these should be stored for the documentation purposes), or attributes insignificant for analysis purposes. Generating attributes comprises calculations for simplification of future analysis, but also decomposition of complex attributes into atomic ones (e.g., the attribute ‘Address’ may be divided into ‘Country’, ‘County’, ‘Town’, ‘Street’, etc.), and getting time units out of timestamp.
Inconsistencies in the names of attributes, such as using names for some attributes and code for others, or using different letter cases, or different types of spelling (e.g., with or without diacritics) may not prevent successful analysis, but are highly unaesthetic (especially when setting up monitoring or presenting results to the company management board) and bring element of chaos into the data, and should be diminished in this step, with unified form established for all the attributes. It may be useful to decide on one structure, which will be later used on all the sources—this helps to prevent many regretful errors.
Data-mining methods such as decision tree (and other ensemble trees) or neural networks do not accept categorical attributes (e.g., type of error). If this is the case and such attributes and methods are planned to be used, it is advantageous to prepare the data beforehand by constructing dummies out of these attributes.
Another step is dealing with rows (records). Mostly it means removing undesired rows. This applies to redundant rows (redundant by identifier and/or timestamp; they may occur due to incorrect recording by the machine or during joining of sources), and also the empty rows. As to the rows which miss some of the values, but not all of them, they should be inspected thoroughly and either destroyed or kept. If some of the records are missing, they can be reconstructed, for example with average values of surrounding rows. This step should also address desired and non-desired periods of recording, such as working vs. non-working (weekends and holidays) periods, monitored working shifts, etc. Keeping what should be omitted may bring further inaccuracies to the observed periods. After the selected periods are removed, related attributes should be re-calculated (e.g., duration of error—if an error persists into non-working period, this time should not be counted into its duration).
Finally, last step of this phase is adjusting values. The data type of all the attributes should be decided and properly set. In case of all sorts of IDs and categorical identifiers it is usually more useful to change their data type, if numerical originally, to textual. It may help to keep characters such as zeros in the beginning, and also prevents these attributes to be later understood as numerical by data-mining algorithms. Moreover, formats of numbers and of date time should be changed into the desired ones. As when dealing with the attribute names, also the values (especially the ones manually written down by workers) should be checked for spelling inconsistencies; however, this task may prove to be tricky and difficult for big amounts of data, and may lead to removing attributes with too many inconsistencies.
Problems connected to multilingualism represent a special category. Names and values written in more than one language should be unified—it is better to pick only one language, universally spoken in the company, for one data source. Mix of languages can also cause illegibility of some characters (such as those with diacritics) or obstruct their manageability by the process, especially after merging of sources. Using different versions of spelling, such as German ‘ü’ vs. ‘ue’ (the latter used specifically for German names/words in text written in other language), is a problem connected to this issue. Finally, two more issues are to be checked: first, the usage of local decimal sign (e.g., decimal comma vs. decimal point), and second, different date formats ‘yyyy-dd-MM’ vs. ‘yyyy-MM-dd’.
Steps mentioned in this phase will usually go through more than one iteration, as new issues are unearthed and new factors considered. After the desired structure, both external and internal, is achieved, the ‘Data Preparation’ phase may be considered finished.
In the BPMN diagram (
Figure 2) you can see proposal of procedure for the ‘Data Preparation’ phase, based on our real-world experience.
5.2. Modelling
We assembled a top-layer BPMN diagram (
Figure 3) based on the information from the real-world projects. The diagram has five main parts. After the data were preprocessed during the ‘Data Preparation’ phase, they undergo ‘Initial Analysis’. Note that an analysis was already performed during the ‘Data Understanding’ phase—but that was a general analysis, whereas this one is already focused on a clearly defined goal. Its purpose is to uncover features important for the data-mining goal (e.g., future input and output attributes). With this knowledge, ‘Possible solutions’ are discussed. Usually there are many ways how to strive for the goal, and these should be listed and drafted in this step, without actually implementing them. However, in this step, all possibilities should be investigated, focusing on their advantages, disadvantages, demandingness, how much of the original goal they may cover, etc. After that, the most useful solutions are picked. (From this step on, we are going to call them Approaches). Their number depends on how many of them met the desired criteria, and also how much time and resources the team disposes with. ‘Building an Approach’ is a step that follows, usually in loop for every chosen Approach. In this step, the chosen ideas are implemented. It can be performed via available data-mining methods or as a script built from scratch. The model is applied to a dataset, validated, and verified. When this is finished, ‘Comparing Approaches’ takes place. All the viable Approaches are selected. One or more of them may be chosen for future evaluation and deployment. If none of the Approaches is good enough, combining them may be considered, as to improve their characteristics. In the case that all the Approaches are completely unusable, return to the ‘Business Understanding’ phase and redefining data-mining and/or business goal to something that is both achievable and acceptable by management is necessary. On the other hand, if there is at least one viable solution, the ‘Final Approach’ step follows. If there are more solutions to be combined, they are combined either using one (or more) already existing ensemble methods or by scripting own methods. Finally, the final Approach is finished and documented. Then the ‘Evaluation’ phase may start.
Similar to the previous phase, we assembled all the problems occurring during the work on our case studies and made a list of those which occurred at least in two of them, using them as a base to form a proposal for the phase. For the ‘Modelling’ phase, there is a big number of possible tasks—there are various types of data mining as classification, regression and clustering, and aim of the project can extend even beyond those types. Therefore, we did not focus on every type and method, we rather tried to form a general concept on finding the right approach and tools to fit the desired goal.
The following problems (again, categorized into groups based on data quality dimensions) were repeating most frequently during this phase:
Accuracy:
Completeness:
No meaningful solution available;
The DM/business goal is unfulfilled;
No Approach is viable;
An Approach is viable, but for different purposes.
Consistency:
Initial analysis does not confirm the management’s hypothesis;
The future results of a solution are doubtful;
Results do not confirm the team’s hypothesis;
The Approaches are difficult to combine/cannot be combined;
Combining Approaches rips them of certain characteristics.
Timeliness:
Validity:
The data could not be put in a form ideal for the desired analysis;
Desired analysis is not possible;
No solution leading to the desired goal;
No build-in methods for the purpose we need;
Results are leading somewhere else than expected.
Uniqueness:
Too many solutions available;
Too many ways how to work on an Approach;
Too many viable Approaches.
The whole analysis—the whole project—is often based on hypotheses made by the company experts and their long-time experience with the production process. They encounter certain problems and are the first ones to make assumptions. Even though their observations are often crucial for the success of the analysis, in some cases their hypotheses are not proven true by the initial analysis. Sometimes they can be neither proved nor disproved—the available attributes are not connected to the investigated feature at all. If this happens, the focus needs to be slightly changed and other combinations of attributes should be checked for correlations. Experts’ assumptions may be insightful, but without the power of data-mining algorithms, the experts are of course unable to see the hidden relations between parameters.
Correlation matrix is a good way to uncover the less complex influences of parameters on each other. It may also serve for a preliminary feature selection—if two or more input parameters are highly correlated, some of them may be omitted. If no meaningful correlations are found via correlation matrix and similar methods, it does not necessarily mean the further analysis is meaningless. As mentioned, the relations influencing the output may be too complex to be discovered via simple statistics and analytics. However, the absence of meaningful correlations may be problematic in case there is an extremely small number of input attributes. This should be considered in building the model, and other than data-mining solutions of the problem may be tried.
Sometimes the attributes are the correct ones, but the form in which they are represented is problematic. This may make the desired analysis impossible. Even though this phase is preceded by the ‘Data Preparation’ phase, another iteration of data preparation may be needed. The former was aimed more generally, while the latter will focus on accentuating special characteristics, needed for carrying out the desired goal.
Data mining is the most common way how to deal with the business goal tasks, but it is by no means the only one. Sometimes the existing methods just do not satisfy the needs of analysis, and an own solution must be scripted using software tools and programming languages.
If the final Approach consists of multiple partial Approaches, there are a few things to be considered: preferred ways of combining results (voting, averaging, and stacking—depending on the rate of importance of the Approaches, and whether the algorithms should be performed gradually or in parallel), and a preferred ensemble method—as before, it can be also scripted manually, though there are many existing methods. In case the two Approaches cannot be combined, the more viable one should be picked and improved so that it closes in with the criteria.
Combining Approaches may sometimes prove to be counter-productive. A combined Approach may be stripped of certain characteristics; it can be slow due to increased demands on computational power. In such case, using slightly less successful, but faster and less demanding partial Approach may be considered.
Rarely, no solution can be assembled from the materials we dispose with, or there are solutions, but their results are far worse than expected or they do not lead to the desired goal, which means no Approach is viable and the data mining (or even business) goal stays unfulfilled. In such a case, a return to the ‘Business Understanding’ phase is necessary, as to decide on a new data-mining (and business) goal. If the possibilities for data-mining solutions were already used up, other results may be used instead—facts, patterns and assumptions accumulated since the start of the analysis. They just need to be sorted, cleaned, and visualized in a meaningful way.
Alternatively, if there is a solution which leads somewhere, but not to the desired goal, and if its results are meaningful enough, it can be offered to the customer as an alternative. Even if their hypothesis is disproved (or is not proven), the results may be still interesting for them to learn new information about the process. (It proves sensible to hoard such solutions, as they can often be used in the future for unrelated projects. It is only for good to be equipped with arsenal of well-documented solutions.)
The opposite problem is posed by having too many viable solutions/Approaches/ways to work on an Approach, either in the phase of proposal or as already carried out solutions. When picking the best one(s), two criteria are the most important: coverage of the original goal, and the demands on the implementation/deployment. The rate of the importance of the two criteria is individual for every project and should be discussed internally. Time can be another important criterion—most projects have their allowed time, either in man-hours or by a deadline. In case of solutions which are not yet implemented it may be advantageous to pick the ones which have demonstrably better chances to become viable and omit the ones with more doubtful future results. There are, of course, other criteria to be considered, and the customer should always be the one doing the final decision.
Our proposal of a BPMN diagram of the ‘Modelling’ phase is depicted below in
Figure 4. After this phase is completed, the ‘Evaluation’ phase follows.
5.3. Integration of Phases
In addition to the proposals of the two phases described above, we processed proposals for the remaining four phases in a similar way. Since the extensiveness of the work, they will not be described in detail, but all the phases together serve as a basis in forming diagrams covering the whole process.
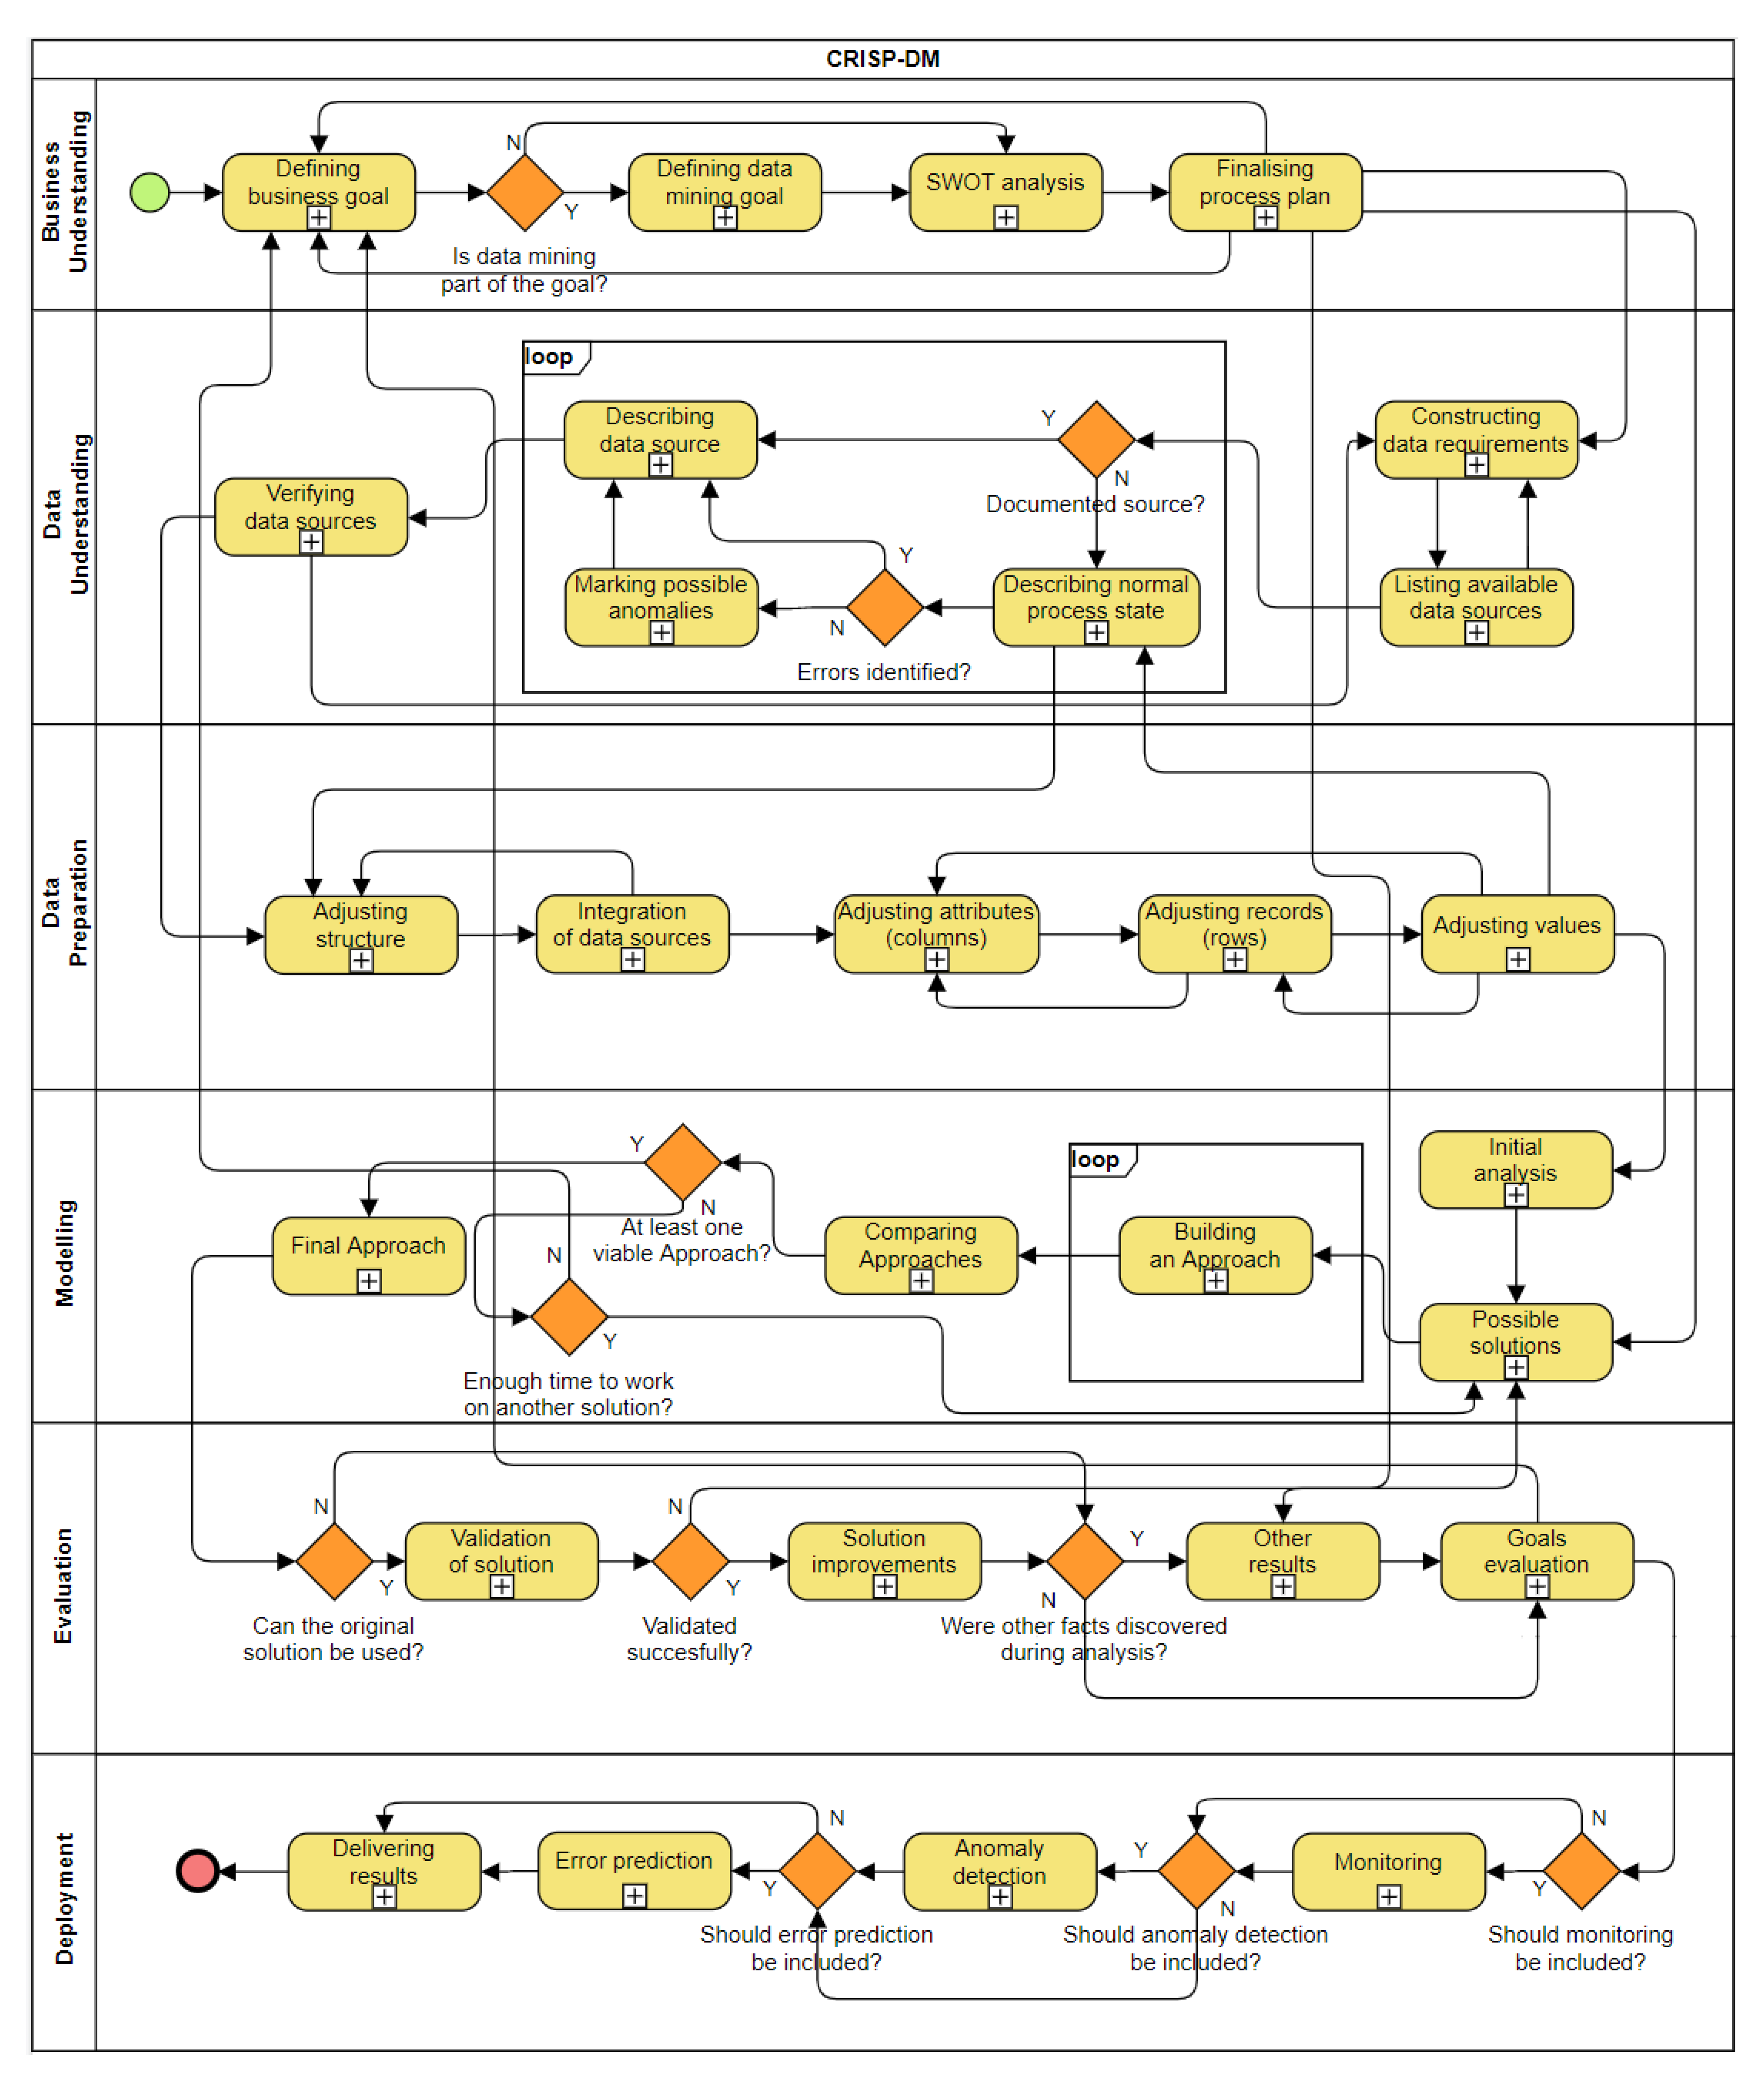
We made two versions for every diagram for every phase: a top-level one (featuring just subphases of every phase) and an advanced one (with elaborated subphases). By joining all members of the former category, we get a new diagram composed of top-level diagrams (
Figure 5).
As one can see from
Figure 5, not only the inner structure is different from typical CRISP-DM, but also the sequence has been enriched by new connections between the phases. The original methodology already includes returning to some of the previous phases, but the praxis shows the phases are much more connected among each other, in both directions; for example, if the data-mining goal was not fulfilled in the ‘Modelling’ phase, the return to the ‘Business Understanding’ phase may be necessary to define a new goal according to the remaining resources and possibilities. After that, we may usually skip the next two or three phases and execute either the ‘Modelling’ or ‘Evaluation’ phase, based on the nature of the new desired results.
The connections between phases are addressed in the top-level diagram composed from the basic phases (
Figure 6).
One of the main contributions of our research is implementation of new approaches, obtained via analysis of several real-world projects, into the lifecycle of solving Big Data projects based on CRISP-DM methodology. Application of these approaches can help with avoiding/early eliminating problems, which usually occurs during work on Big Data projects. Furthermore, the best practices we proposed contribute to the more effective problem-solving, with several prearranged solutions to be used when necessary.
That way, the best practices can help with sparing company’s time and money, as well as time and sources of the data scientist’s team.
6. Discussion
The presented best practices were based on experience of our team. We oriented the proposals on problem-solving of a specific phase and designed BPMN diagrams for such purpose. Our best practices emerge from CRISP-DM methodology as a theoretical base. From the methodology, we take division into phases and their sequence. We get the content and inner structure of the phases by tracking our projects’ documentation.
As an example, we can take the ‘Data Preparation’ phase. The CRISP-DM methodology consists of six subphases: data cleaning, data integration, data transformation, data reduction, data discretization, and feature engineering. We included these subphases in one form or another, but we tracked the typical course of our projects to reorder tasks due to their purpose (rather than to their nature), as this proved to be the most suitable for most of the projects we have carried out. That led to forming five subphases: ‘Adjusting structure’, ‘Integration of data sources’, ‘Adjusting attributes (columns)’, ‘Adjusting records (rows)’, and ‘Adjusting values’. This order represents a logical sequence of events, starting with rough changes of sources’ structure as to prepare them for integration—followed by the actual integration—then changes of internal structure take place, first addressing the most important units of a dataset (attributes), then the individual instances (records), and finally focuses on minor (yet important) issues, such as format, spelling, and language inconsistencies (i.e., values issues). We performed similarly for all the other phases (from which only ‘Modelling’ is included in this paper).
6.1. Most Common Problems
Even though most errors which served as a base for our best practices were phase-specific, there were a couple of them which affected various phases and arose during several projects. Once more, we classified the most prominent and the most often occurring errors into groups based on data quality dimensions.
Accuracy:
Completeness:
Vaguely defined/incomplete business/data-mining goal;
Missing documentation;
Permitted/limited access to a source;
Lack of suitable data sources;
Not enough data for certain visualizations.
Consistency:
Process changing over time;
Missing common unambiguous identifier;
Structure changing over time;
Naming, spelling and language inconsistencies;
Validation on a different period/part unsuccessful.
Timeliness:
Validity:
Sensitive data;
Structure not suitable for software tools;
Desired analysis not possible;
Analysis took a different course.
Uniqueness:
Many of the problems come from inadequately defined requirements and a lack of documentation. The former problem can be usually helped by enough communication (with company management and within team). Specifically, it is important to know beforehand which sources will be available and what information can be extracted from them. The latter problem is something the data scientist cannot influence; however, early knowledge about the state of the documentation can be very helpful in estimating the time needed for the project. Moreover, it can lead to incorporating the building of documentation into the project’s goals. In any case, knowing as much as possible about the project before starting it is a key to finishing it successfully and on time.
We can find parallels to these problems in many of the papers we mentioned in the literature overview. Zhao et al. (2018) remark that introducing industrial Big Data is a big challenge for the company—that is the same struggle we observe many times, e.g., in incompatibility of data sources. Inconsistencies of data are also addressed by Keskar et al. (2021).
Sun et al. (2019) determined that one of the problems with choosing the right data to be collected is the lack of suitable data sources; we also identified this problem. Lacam et al. (2021) focus on the importance of generating Smart Data by enriching Big Data—and we discuss the general lack of documentation. Solid documentation is the base for such enrichment.
Juez-Gil et al. (2021) came to a conclusion that more complex methods may prove less useful, similarly to one of the possible problems we identified for the ‘Modelling’ phase. Küfner et al. (2021) describe problems with working close to real time, what is also reflected in our experience with not being able to access certain data sources in real time or monitor all attributes at once.
Human factor is another aspect which we addressed often in our projects (in issues such as missing documentation, vaguely defined business goal, or denied access to a database). Importance of involving employees into Industry 4.0 was accentuated by Gallo et al. (2021) and Shin et al. (2021). Schuh et al. (2019) also focuses on extensive internal knowledge in a company.
As we stated before, summarizing best practices or extending existing methodologies is rather unusual topic among the studies on key terms of this paper. However, we were still able to find similarities with our work. Schröer et al. (2021) also build their best practices on CRISP-DM—they focus on a single phase, ‘Deployment’. Huber et al. (2019) do something similar for ‘Data Acquisition’ subphase.
That proves that the problems we were discussing are not limited to a small group of projects. However, even though they are often present, they are but scarcely summarized and discussed in other studies. We collected and systematized them and used them as a basis for a new set of best practices. Along with listing the problems, we also discussed them in detail, providing possible solutions. The best practices include BPMN diagrams as a visual representation of generalized project solutions. They can be helpful when choosing a path of approaching a project, as they often provide more than one possible solution and allow to skip certain parts of the process.
By getting familiar with challenges we (repeatedly) encountered, other data scientists can prepare in advance when working on similar projects.
6.2. Specifics of Production Industry
We used six projects as case studies for this paper. All of them were dealing with real processes in companies. Moreover, since we based the research on problems found in production, our proposal was also focused on this area.
One of the most important features of production process is, obviously, its practical orientation. Most tasks focus either on improving the production, diminishing errors, or on more general predictive maintenance. Getting knowledge just for knowledge is not demanded, every result should have its appliance in praxis.
A customer, and not the data scientist’s team, is the one to decide. Therefore, a more logical solution (from the data scientist’s point of view) may be dropped in favor of the one picked by the client (whose reasons may be rooted in company policy, long-term goal, etc.). Here, the team’s ability to negotiate and to honestly present pros and cons of every solution and to provide the customer with enough information proved to be crucial for a successful communication with the client. It is very useful when there is not only management of the company present to the meetings but also experts from praxis.
The level of deployment of Industry 4.0 in a company can make a huge difference in difficulty of acquiring and processing data. Ideally, all the processes are time-synchronized, and the storing of the data is unified for the whole company. In our best practices we address both this ideal case and the opposite (sadly, frequent) case. However, still, most of the data are recorded and often even stored, thus decreasing the need for the team to set up their own measuring. It may be necessary only in the cases where the project explicitly states the need for measuring either completely different features of the process, or already measured features in an unprecedented way.
Another important thing about the production process data is that most of them are artificial in their nature, produced by machines programmed by humans, or connected to the scheduled processes (meteorological data captured to uncover influences of weather on the production process represent an exception from the rule). The artificialness of the data means we are often able to guess the possible structure of the process flow, which will in many cases consist of repeating cycle or cycles (their number guessable due to how many different product types and tasks are operated on the machine). Most of the attributes will have either ideal values or boundaries set up, allowing us to mark those parts of the process where these values are incorrect.
7. Conclusions
Even though the best practices were meant to be applied for the production industry projects, we were also thinking about the possible transmission of it to other fields from the very beginning.
After stating the specifics of the original field, it is clear that there are parts of the proposal which cannot be fully used for other fields, but there are definitely some that could be used, either fully or with just minor adjustments. By the other fields are meant any other areas prone to data analysis, such as biology, medicine, social sciences, marketing, etc.
The parts of the proposed best practices which would not need major changes are ‘Business Understanding’, ‘Data Preparation’, ‘Modelling’, and ‘Evaluation’.
‘Business Understanding’, despite its name, can be understood as Project Understanding or even Defining Goals. Similarly, if we substitute ‘management’ with terms such as ‘institution’, ‘university’, or even ‘client’, the proposal is still viable. In cases where the team decides about the project independently, the sub-steps connected to the management may be omitted.
‘Data Preparation’ deals with preprocessing the raw data into the desired format; the origins and meaning of the data are not important in this context. The process can be applied basically to any other data.
‘Modelling’, even though it can mean very different things for different fields, is generalized to the extent where only the path is defined (e.g., the decision between already existing DM methods and designing own solution), but the proposal is general enough to be usable for projects with completely different nature.
‘Evaluation’ validates the model(s) designed in the previous phase and summarizes other discoveries made during the analysis. Again, the proposal describes mostly the sequence of steps, and is therefore applicable in other areas as well.
Then there are two phases which cannot be so easily applied out of the production process: ‘Data Understanding’ and ‘Deployment’.
‘Data Understanding’ in industry production works with records of a process designed by human and performed by machines; the conditions are controlled, tasks predefined and purpose clear, the process is divided into clearly distinguishable cycles and sequences. Our proposal of getting to know previously unknown process builds on these features. Choosing the most suitable representation in, for example, behavioral biology, can be far more complex and therefore needs a very different treatment, according to specifics of the field. Another issue is data acquisition: in industry production, we can often work with data recorded by a company and stored in the company’s data warehouses. However, the situation can be very different for other fields; for example, sociological research may demand a proposal not only for the data storage but also their gathering via manually filled answer sheets.
‘Deployment’ can mean fundamentally different things for other fields. While in production industry, it usually means deploying the solution (e.g., setting up predictive maintenance), followed by a delivery to the company’s management; in more scientific fields, the main goal may be publishing a paper/book; in ecology, the focus can lie on acquiring reasoning strong enough to persuade government to strengthen nature preservation, etc. Therefore, the phase should be reshaped for any new field and type of project.


