Abstract
Metaheuristic algorithms have been widely used to solve diverse kinds of optimization problems. For an optimization problem, population initialization plays a significant role in metaheuristic algorithms. These algorithms can influence the convergence to find an efficient optimal solution. Mainly, for recognizing the importance of diversity, several researchers have worked on the performance for the improvement of metaheuristic algorithms. Population initialization is a vital factor in metaheuristic algorithms such as PSO and DE. Instead of applying the random distribution for the initialization of the population, quasirandom sequences are more useful for the improvement the diversity and convergence factors. This study presents three new low-discrepancy sequences named WELL sequence, Knuth sequence, and Torus sequence to initialize the population in the search space. This paper also gives a comprehensive survey of the various PSO and DE initialization approaches based on the family of quasirandom sequences such as Sobol sequence, Halton sequence, and uniform random distribution. The proposed methods for PSO (TO-PSO, KN-PSO, and WE-PSO) and DE (DE-TO, DE-WE, and DE-KN) have been examined for well-known benchmark test problems and training of the artificial neural network. The finding of our techniques shows promising performance using the family of low-discrepancy sequences over uniform random numbers. For a fair comparison, the approaches using low-discrepancy sequences for PSO and DE are compared with the other family of low-discrepancy sequences and uniform random number and depict the superior results. The experimental results show that the low-discrepancy sequences-based initialization performed exceptionally better than a uniform random number. Moreover, the outcome of our work presents a foresight on how the proposed technique profoundly impacts convergence and diversity. It is anticipated that this low-discrepancy sequence comparative simulation survey would be helpful for studying the metaheuristic algorithm in detail for the researcher.
Keywords:
premature convergence; quasirandom sequences; PSO; GOP; WELL sequence; Knuth sequence; ANN 1. Introduction
The Meta-heuristic algorithms are an integral part of modern optimization. In the last couple of decades, a wide range of metaheuristic algorithms have arisen, and many meta-heuristics are incredibly popular, such as particle swarm optimization. Initialization of the population plays a vital role in Meta-heuristic algorithms. Generally, a Population-based algorithm is used for global optimization problems [1]. Meta-heuristics are problem-saving generalizations, typically stochastic as well as the most common method of minimizing global optimization. In the latest times’ researchers have shown an increasing curiosity in population-based stochastic exploration strategies to tackle the problems of global optimization. Meta-heuristic can be used to optimize combinations in an unconfined search area in which an optimum solution is sought. Another example of the problem is the TSP, where a candidate’s quest for a solution increases exponentially because the problem increases, and more solutions are not possible [2]. Optimization is an attempt of acquiring the optimum solution of a problem under given instances. All systems which might be optimized have an objective function and many decision variables that affect the functions. The important undertaking challenges of optimization is to reduce wastage time or exploit the preferred advantage of a given engineering system [3]. A preference to utilize existing sources for increasing the optimization strategies within the exceptional feasible way. Optimization techniques may be described as a procedure that accomplished superior solutions which fulfill the given objective feature [3]. Optimization refers to the observation of those problems wherein one seeks to reduce or maximize a characteristic through technically choosing the variables’ values within their allowed collections [4]. All possible benefits are recognized as acceptable solutions, while extraordinary output is considered to be the best solution. In recent few years, to tackle optimization complications, scientific society is aware of the development of techniques influenced by nature. The growing intelligence level of groups of basic independent agents is swarmed intelligence. 2 Swarm Intelligence (SI) is a field of Artificial Intelligence (AI), introduced by Gerardo Beni and Jing Wang. It is inspired by the nature and collective behavior of all individuals [5]. SI has no integrated but self-organized control structure. In which all Individuals follow certain agents that closer to the optimal outcome. An independent agent is a control system that communicates along with its ecosystem, obviously comprised of other agents, but behaving comparatively individually of all the other agents. The independent agent does not follow other participant’s instructions or a global plan. In nature, such systems are generally used to solve problems such as effective searching for food, target escaping, or colonies relocation. Generally, the information is stowed by partner agents that are enclosed in the environment, such as through the use of pheromones in flies and ants and closeness in the birds and fish [6]. Here we take the birds’ example that flies in a decentralized control structure, in which all the birds follow those birds that are nearer to the food. The SI library can be used for the acquisition of transit material, communication, medical database classification, dynamic control, heating plans, tracking problems, and predictions that have been valuable and intriguing, just as somewhat compromising, although SI works for the new innovative advancement [7]. Several influential population-based metaheuristics techniques had been produced and used successfully to solve many complex optimization problems. Some majors are Particle-Swarm-Optimization (PSO) [8], Bat algorithm [9], Ant Colony Optimization (ACO) [10], Bee Colony Algorithm (BCA) [11], etc. The focus of this research on Meta-heuristic global optimization with the Particle Swarm Optimization (PSO) technique in the literature of Swarm Intelligence originally by Kennedy and Eberhart [8]. Generally, PSO can be extended like many evolutionary computational methodologies to resolve most scalability issues and problems which can be converted into optimization problems [12]. Original meaning this algorithm is based on the flocking of birds and fishing school movement behavior while searching for food they scattered and place on the different locations where they find the food. While searching from one place to another, if any agent smells the food, they transmit information to each other, all the birds follow him to get the food without wasting time to reach the place where the food is. The most optimum solution of PSO can be worked out by the collective behavior of all individuals [13]. In this thesis work, the focus of study on Particle-Swarm-Optimization (PSO) that was initially introduced by James Kennedy and Russel Eberhart is a meta-heuristic global optimization strategy. Generally, PSO can be extended like many evolutionary computational methodologies to resolve most scalability issues and complex problems which altered into optimization problems. This algorithm’s significance is based on the flocking of the birds and the movement of fishing schools in their search for food that anywhere found [12]. When looking from one place to the next, if any agent detects the food, without wasting any time to fetch the food, all pursue the agent to reach the place. The collective behavior of all individuals can be the optimum PSO solution The PSO algorithm firstly searches for the optimum value of each particle and finds according to the minimum range values with the corresponding support and confidence, later the data is converted to binary values. Areas where other PSOs have shown specific consent, include multi-modal issues and concerns in which no advanced technique is accessible or for which unsatisfying outcomes are offered by all specialized techniques. Figure 1 illustrates the evolution of the particles in such a simplistic, 1-dimensional search area. Since 1995 its introduction, Particle-swarm-optimization (PSO) has several improvements. Researchers learned about this method, many new systems also have been inferred and new applications have been developed. Optimization of particle swarm has been used in a variety of applications [12], the most latent are system design applications, clustering, multi-objective optimization problems solving applications, pattern recognition application, power generation applications, sensor networks and neural network, fuzzy and neuro-fuzzy structures and controller, music generation applications, prediction and forecasting, detection of faults and recovery applications, games applications, optimization of communication networks, biological robotic applications, design/ optimization of electrical motors and engines, simulation and identification applications, computer graphical visualization applications, design and reformation of electricity networks and load dispatching application, electronics and electromagnetics applications, finance and economics, images and videos analysis applications, security and military applications, medicinal and pharmacological applications, data mining, signal processing, and decision making applications [12].
Figure 1.
Population initialization using the uniform distribution.
Above we have discussed some applications where it can be used. Till from its birth, it has lots of improvement and also integrated with another Mata-heuristic algorithm to improve its performance. Due to the easiness of implementation and the ability to promising optimization, PSO is successfully implemented in many fields [14]. However, the PSO has faced some problems such as the high complexity of the computation, premature convergence, and diversity of the algorithm. In some cases, the entire search area cannot explore a small population size with large iteration but can exploit some small area of search space by doing a local search, so a premature convergence problem happens [15]. Particularly to solving these complex problems, many researchers are devoted to dealing with this issue. The main reason for the premature convergence issue is the lack of diversity in the population [16]. It is very important to make the diversity of the population perfect.
Above we have discussed all the applications or fields where it can be used. PSO classifier is not only a tool for solving optimization problems but also a tool to comprise individuals as well as artificial agents socio-cognition related to social psychology principles. A PSO system integrates local search techniques with global search techniques to seek a sort of balance between exploration and exploitation [17]. The main concept of the exploration and exploitation are searching for the unknown solution points are discuss given below. Exploration means explore the whole search space to search for a new individual that far from the current individual. It has less chance to trap in the given search space. Exploitation is fewer exploration means explore the limited or restricted area. It utilizing the solution points in hand means to search the new individual in the search space that is nearby the current individual [18]. Premature convergence means that a group of the population while moving in the search space to find optimal solution converged too early [19].
PSO algorithm uses real number coding. Since there’s no selection, crossover, and mutation, the algorithm’s frame is relatively easy and the velocity of deployment is very quick. However, if some particle in the swarm finds the current optimal position, the other particles will quickly try to gather near it. If the position is a maximum of local, then the swarm of particles will not be able to find it again. Therefore, the algorithm is drowned in the maximum of the local and premature convergence occur [20]. From different perspectives, in each iteration, members of the population-based search algorithm understand the conceptions of exploring and exploiting in three phases: self-creation, collaboration, and competency. In the self-creation step, each individual improves their performance. In the collaboration step, each individual interacts with the other by transferring the information. Finally, with incompetency, each strives to suffer [21]. Generally, these phases are stochastic forms and can be utilized in different ways. These are the core concepts beyond nature-inspired population-based heuristic algorithms. These ideas help an algorithm find the best overall solution. As Swarm Intelligence (SI) methodology, due to the easiness of implementation and the ability to promising optimization, PSO is successfully implemented in a comprehensive scientific analysis and engineering solution.
However, the PSO has faced some problems such as the high complexity of the computation, premature convergence, and diversity of the algorithm. In certain cases, a limited population size combined with a large number of iterations is unable to cover the entire search space but can exploit some small area of search space by doing a local search, so a premature convergence problem happens. Particularly to solving these complex problems, many researchers are devoted to dealing with this issue [13]. Like other algorithms of empirical evolution, during the evolution process, the main cause for the premature convergence of Basic PSO is the rapid reduction of diversity of the population. It is very important to make the diversity of the population perfect. In general, there are some techniques for maintaining diversity. When an algorithm is used to measure the diversity of the population, it is a consistent measure to compare the diversity estimated value to different degrees. But the limit value constantly affects the properties of the PSO algorithm [22]. If the current zone is a local solution, the low diversity will obtain total collapse and finally, inflammation detect [23]. Consequently, many researchers are committed to increasing diversity to improve the quality of PSO solutions, especially for multi modal and multipurpose functions.
Another issue that PSO facing is not finding the optimum solution. While dealing with complex problems, swarms get stuck in local optima. The aspect of those new ideas include improvement in searching manners, increase the diversity in the population, modified existing strategies, and introduced new ideas. Therefore, we will introduce the new version of the PSO algorithm for finding global minima. This PSO can easily explore the whole search area using an effective diversity enhancement mechanism [9]. In this thesis, it is proposed to use the modified PSO strategy with a novel initialization approach to solving complex problems. In general, random starts are used to produce the initial population when. Usually, random initialization is used to produce an initial population while priority information is missing. The word random" must no longer obscure the readers within the QRS term. Such is neither pseudorandom nor actual random sequences. Certainly, QRSs are completely deterministic and in algorithms no random element is concerned but optimization problems are very useful [24]. The most commons are Sobol, Vander Corput, WELL, Torus, Halton, and Faure. PRNGs produce a series of numbers that closely resemble random numbers. these random numbers are efficient, deterministic, and periodic. The most commons are LCG, MCG, LFG, and ICG. These sequences were introduced to initialize the swarm as well as the quantum results indicate a significant development concerning traditional BPSO, using uniform random numbers distributed [25]. QRS and PRNGs enhanced population performance by initializing the QRS population.
The rest of the paper is structured as follows: Related work is presented in Section 2. Methodology is elaborated in the Section 3. Experimental setup is described in Section 4. Simulation results and discussions are presented in Section 5. Comparison of PSO and DE regarding data classification presented in Section 6, and lastly, the conclusion and future work described in the Section 7.
2. Related Work
The idea of using a random number generator for initializing the population into a multidimensional search space is not new. An essential step in any metaheuristic algorithm is to initialize its population correctly. If the initialization is not proper, then it may go on to search in unnecessary areas and may fail to explore the optimum solution. Proper initialization is very important for the metaheuristic algorithm for its performance. Many research studies proposed different variants based on initialization techniques.
Initialization of the swarm in a good way helps the PSO to search more efficiently [26]. In this work, the initialization of swarm with nonlinear simplex method (NSM) has been conducted. NSM requires only function evaluations without any derivatives for computation. NSM starts with initial simplex and produces sequence of steps moving the highest function value vertex in the opposite direction of the lowest one. They initialized the particle with the initial simplex in the D-dimensional search areas D+1, vertices of the simplex are D+1 particle of the swarm, and applied the MSN method for N-D+1 steps for N size swarm. In this way, each particle in the swarm has the information of the region. Lastly, they compared their results with simple PSO and found significant improvement.
This variant was introduced by Mark Richards and Dan Ventura in 2004. In their work [27], they proposed to use centroidal Voronoi tessellations for initializing the swarm. Voronoi tessellations is a technique of partitioning any region into compartments; each partition contains a group of generators. Each partition is associated with one generator, and it consists of all the particles closer to that generator. In the same way, the generators are selected for the initial position of the particle. In this way, they initialized the particle swarm optimization algorithm. They compared it with basic SPO on many benchmark functions and found improved performance in high-dimensional spaces.
Halton sampling was introduced by Nguyen Xuan Hoai, Nguyen Quang Uy, and R.I. McKay in 2007 [28,29]. Halton sequence is a low-discrepancy deterministic sequence used to generate a point in space. Halton sequence is not entirely random. To randomize X, Wang and F. J. Hickernell proposed a new function called randomize Halton sequence by using von Neumann–Kakutani transformation. They used this sequence to initialize the global best of the PSO. They performed a test on various benchmark functions and compared the result with the PSO and initialized with uniform random numbers. They found better performance, especially for complex and smaller populations.
VC-PSO was introduced by Millie Pant et al. in 2008. They used Van der Corput sequence for initializing the swarm for large dimensions’ search [30,31]. The Van der Corput and Sobol sequence generate a semirandom number, which is more suitable for computational purposes. They tested the new variant with different benchmark functions and compared the result with BPSO and SO-PSO and found significant improvement, especially for large search space dimensions. The main purpose of this variant is to see the performance of large search space problems. That is why they used search space with different sizes ranging [−5.12, 5.12] to [−1000, 1000]. The performance of the algorithm is showing prominence when the dimension increases to [−100, 100].
SMPO was introduced by Millie Pant et al. in 2008. They used a quasirandom Sobol sequence to initialize the particles instead of standard random numbers [25,32]. They used a new operator called a systematic mutation operator, which is used to improve the performance of the PSO. The new operator, instead of using the standard random number, use a quasirandom Sobol sequence to initialize the swarm as the QRS is less random as compared to pseudorandom sequences, which is helpful for computational methods. They proposed two variants SM-PSO1 and SM-PSO2. The main difference between the two versions is that in MSPSO1, the best particle is mutated, while in MS-PSO2, the worst particle is mutated. They found better results compared to BPSO and other variants.
This work is done by [33]. In this paper, researchers have proposed a new method of initialization. In their work, they have added the functionality to automatically detect when a particle is prematurely converged and initializes the swarm. They also added features to redesign the inertia weight to balance the searching ability globally and locally. They named it as IAWPSO.
This variant is proposed by P. Murugan in 2012 and applied on the transmission expansion problem to decide the installation of new circuits in increased usage of electricity and found this variant fruitful [34]. In this work, he used a new initialization technique called population monitored for complementary magnitudes initialization. In initialization, he used decision variables. All particles are initialized with an integer within the limit of the upper and lower values of the decision variable in such a way that each particle should be unique. The initial population is created in such a way that each particle can have the ability of the possible solution, and they are unique. Almost 50% of the particles are opposite to another 50%, considering the lower and upper limit of the decision variable. The important thing in this initialization is to maintain uniqueness and diversity among the particles of the swarm generated initially.
SIS_PSO was introduced by [35]. In this paper, the authors introduced a new initialization technique named space-based initialization strategy. In this work, they broke down each dimension of the search area into two segments: S1i and S2i. The border of the areas is [li, (li + ui)/2] and [(li + ui)/2, ui], and each segment is linked with a probability and initialized with 0.5. They applied SIS-PSO on 13 functions and compared the result with GPSO and CLPSO and found significant improvement.
Jensen et al. [36] describes that problem of finding the global minima or maxima in single real variable f(x) of continuous function is an equally important research domain for science and engineering. A number of methods have been proposed so far to properly solve this problem of finding global minima or maxima. All these methods have been generally categized into two sets or groups as deterministic or stochastic. In this paper, the author catered to these problems by introducing a novel approach as mix of both deterministic and stochastic approaches, by finding the precision of the deterministic approaches along with the localization ability of stochastic approaches. The proposed novel approach is aligned with genetic algorithm (GA).
This variant was introduced by [37]. In this work, they introduced a new variant of PSO called polar PSO. They explained that mostly the distortion occurred due to the polar particles. Hence, they introduced a new method for the reinitialization of the polar particles by redefining the distance based on the dimensionality of the point. By using this method, they removed the distortion occurring during the computation. They compared the results with BPSO and found some improvement.
This variant was proposed by [38]. In this work, they used the Nawaz–Enscore–Ham heuristic technique to initialize the swarm. This variant is named PHPSO. The sequence generated by NEH jobs is placed in ascending order of the sums of their total flow time. To construct a job sequence, it depends on its initial order. The minimum TFT sequence is the current sequence for the upcoming iteration among all the sequences. The resulting population generated by the NEH method is used to initialize the population of PSO. They applied this algorithm for the no-wait flow shop scheduling problem. They compared the result with DPSO and HPSO and found a comparatively better result.
This work is done by [39]. They proposed a new algorithm combining Adoptive PSO with backpropagation (BP) to train weights of neural network. In this work, they introduced different selection techniques to select inertia weight. They named it as PSO-BP. In the end, the BP algorithm was used to search around the global optimum. They compared the result with adaptive particle swarm optimization (APSOA) and back propagation algorithm and found better results.
This work is done by [40]. In this work, they used PSO to optimize weight and architecture of MLP feed-forward neural network. They have used PSO algorithms twice: the inner one and the outer one. The inner one was used to optimize the weight, and the outer one was used for architecture optimization. In the proposed technique, the outer PSO searches the hidden nodes of each hidden layers of the MLP networks. To improve the generalization, they used weight decay heuristics in the inner PSO. The performance of the proposed technique was applied to the famous benchmark classification problem in the medical field. The result shows better generalization for all data sets.
PSO-ANN is proposed by [41]. In this work, the authors showed a better performance of ANN by using PSO to adjust the weights. In the proposed technique, both the velocity and position of each particle was initialized randomly in a specific dimension to train the PSO-ANN based on particle position and calculated its fitness. They saved the current position and fitness as history. The individual best among all the particle was considered to be the best. The new set of position generated by this method was used for learning error generation. Every particle’s position and velocity was updated according to its personal best and global best. This helped the biases and weights trapping in a local minimum. The performance of PSO-ANN is compared with many backpropagation algorithms such as Levenberg–Marquardt and gradient descent algorithms resulting in better performance.
A new variant of PSO combining with stochastic gradient decent is proposed by [42] and named the PSO-SGD algorithm for training convolution neural network [42]. The proposed technique worked into two phases. PSO was used to train and initialize the CNN parameters in the first phase. When it showed, slow progress of PSO for a few iteration SGD was used in the second phase. In addition, they used PSO combining with genetic algorithm (GA), which helped the particle for simulation and overcame the slowness of SGD. They applied the new algorithm on a different benchmark data set and performed well for three different data sets. The proposed technique avoided the occurrence of local optimum and premature saturation, as it was in the known problem by using any single algorithm.
The authors in [43] examined the impact of initiating the initial population by excluding traditional techniques such as random numbers. The authors applied the nonlinear simplex method for generating the initial population of DE, where the proposed algorithm was termed NSD. The working of the proposed algorithm is measured with twenty benchmark functions and compared with standard DE and opposition-based DE (ODE) algorithm. Numerical results illustrate that the proposed technique enhances the convergence rate.
During the image segmentation process, to solve the issue of thresholding, an enhanced variant of standard DE algorithm with a local search (termed as LED) and low-discrepancy sequences is introduced [44]. Experimental results conclude that the performance of the introduced algorithm is superior for finding the optimum threshold.
For the steelmaking continuous (SCC) problem, in [45], the authors presented a novel enhanced technique of DE based on the two-step procedure for producing an initial population, as well as, a novel mutation approach. Furthermore, an incremental methodology for generating the initial population is also incorporated in DE to handle dynamic events. Computational experiments conducted with the presented approach show the effectiveness of the presented approach than others.
In the time-series prediction, the backpropagation neural network (BPNN) gets stuck into local optima. In [46], a hybrid technique having adaptive DE (ADE) and BPNN, termed ADE-BPNN, is developed to enhance the accuracy of BPNN. To validate the effectiveness of the proposed technique, two real-world time-series data sets are used. The results show that the proposed approach gives higher efficiency.
The authors in [47] proposed an improved differential evolution BA algorithm by combining BA algorithm with DE for optimizing NN for optimizing fuzzy NN to predict the traffic of the network. Due to the problems of DE such as the movement of premature convergence and inactive convergence rate, Gaussian disturbance crossover operator and adaptive mutation operator are used in an introduced variant of DE. The improved operators are utilized to design the crossover parameter and enhance the mutation of traditional DE. To test the performance of the proposed modification, four traditional functions and network traffic used. The results describe that the proposed variant of DE improves the prediction accuracy and the convergence rate as compared to other techniques.
For classification, a modified DE-trained Pi-sigma network (PSN) is presented [48]. The presented technique is an enhanced version of a novel mutation and standard DE/rand/1/bin algorithm and, in addition to this, crossover approaches utilized with regards to both exploitation and exploration. The presented approach for pattern classification is validated through three famous real-world classification problems taken from the UCI repository. The experimental results of the presented method is verified with two well-known algorithms: chemical reaction optimization and DE/rand/1/bin algorithms. The results depict that the presented approach is superior.
3. Methodology
The most important step in any evolutionary computing algorithm is to initialize its population properly. If the initialization is not proper, then it may go to search in unnecessary areas and may fail to search the optimum solution. Proper initialization is very important for any metaheuristic algorithm for its performance. A metaheuristic is random; therefore, it does not have a specific pattern to ensure the optimum global point. Therefore, by taking advantage of this randomness and considering this fact, we have proposed three novel quasirandom initialization strategies called WELL sequence, Knuth sequence, and Torus sequence to initialize the population in the search space. We initialized PSO and DE algorithm with these proposed pseudorandom strategies (WELL sequence, Knuth sequence, and Torus sequence). We have compared the novel techniques with the simple random distribution and family of low-discrepancy sequences on several unimodal and multimodal complex benchmark functions and training of the artificial neural network. A brief description of quasisequence approaches and proposed algorithms using WELL sequence, Knuth sequence, and Torus sequence for PSO, and DE is discussed below.
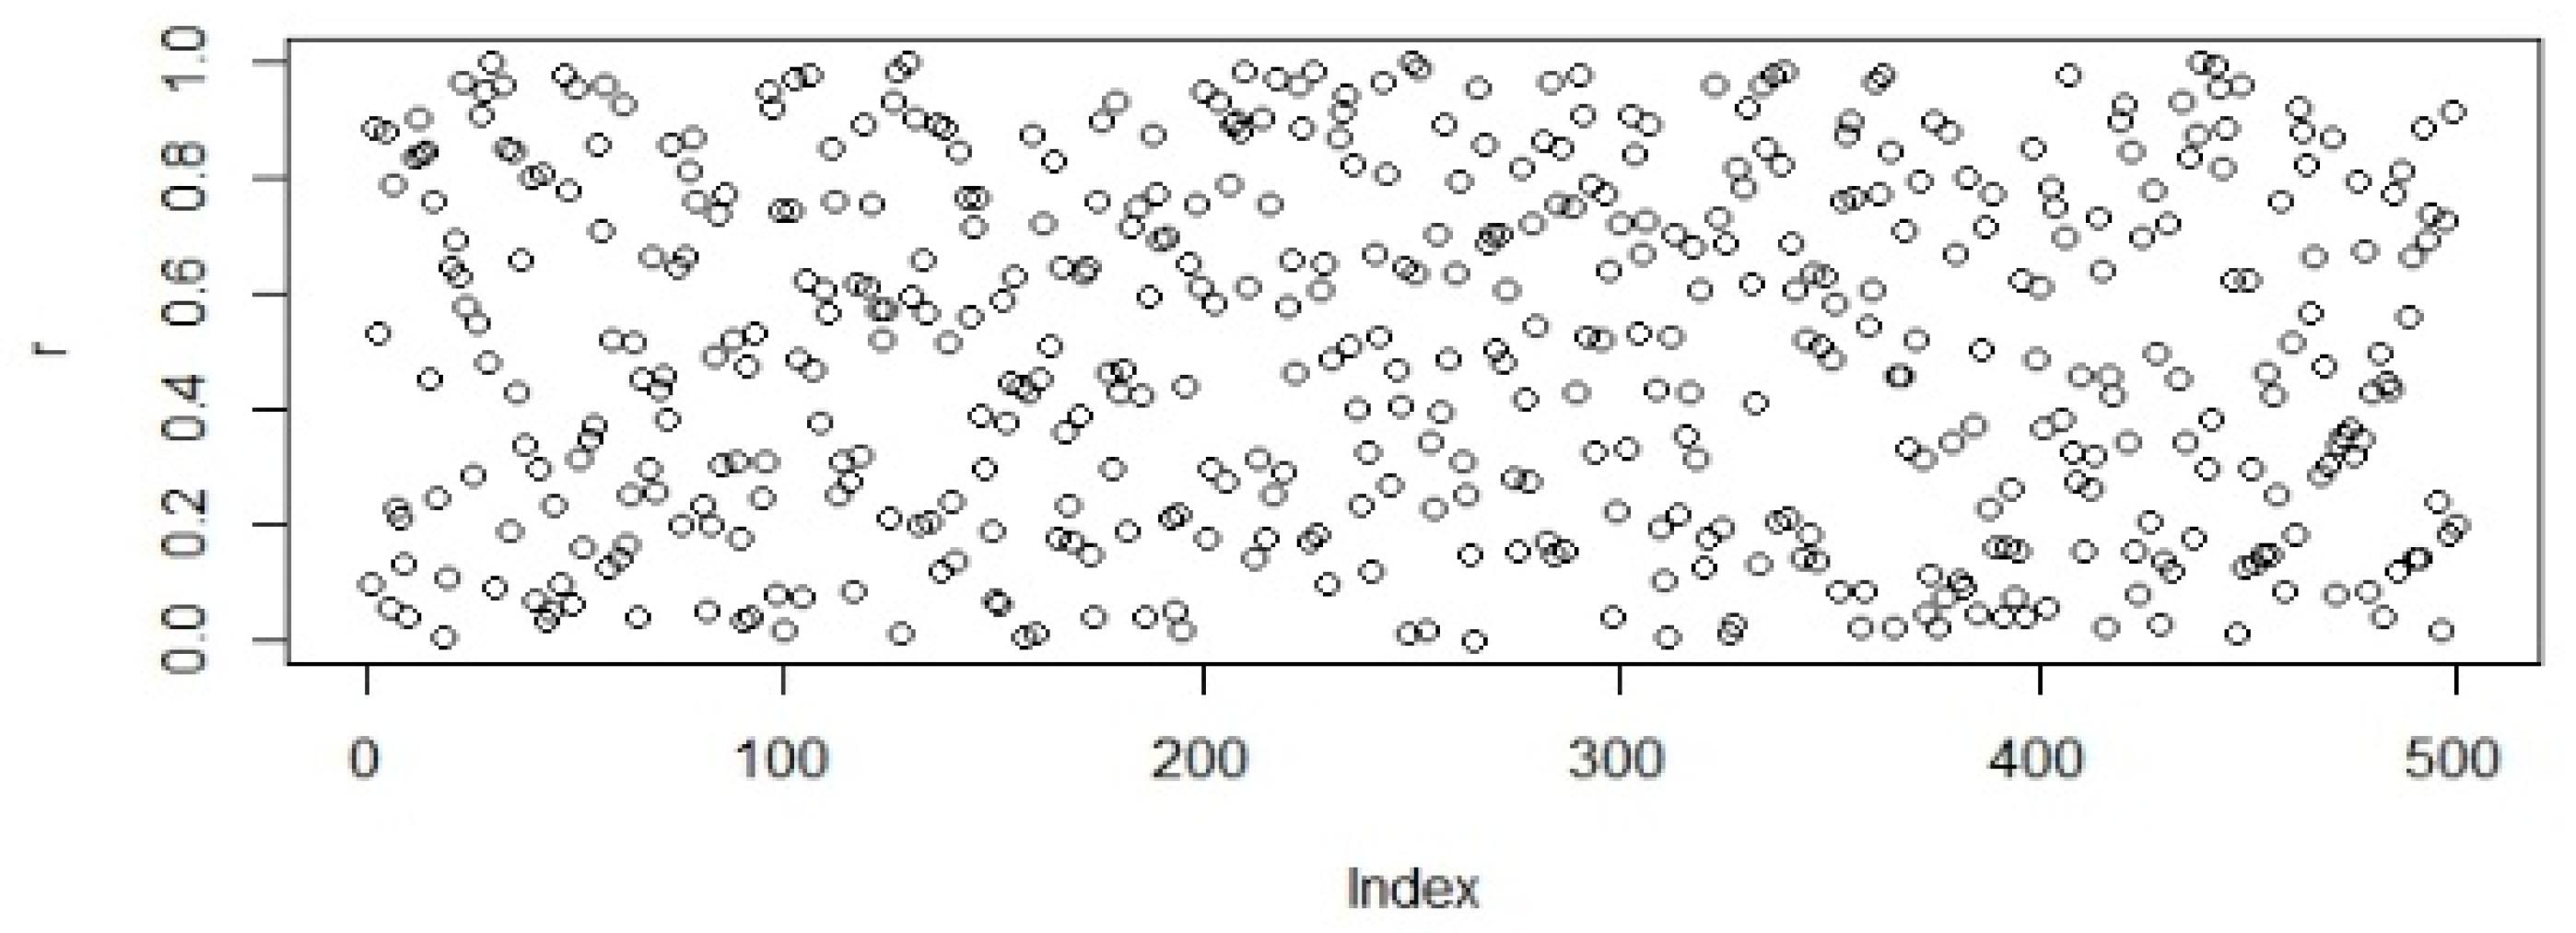
3.1. Random Number Generator
As discussed above, inbuilt library function is used, to generate the mesh of numbers randomly at uniform locations [49]. The probability density function of a continuous uniform distribution identifies the impact of uniformity on any sequence. The probability density function can be characterized as given:
where and represent the parameter of maximum likelihood. The value of is useless at the boundary of and due to the effect on the integrals of over any range. The estimation of the parameter of maximum likelihood is computed by the likelihood function of evaluation, which is given as:
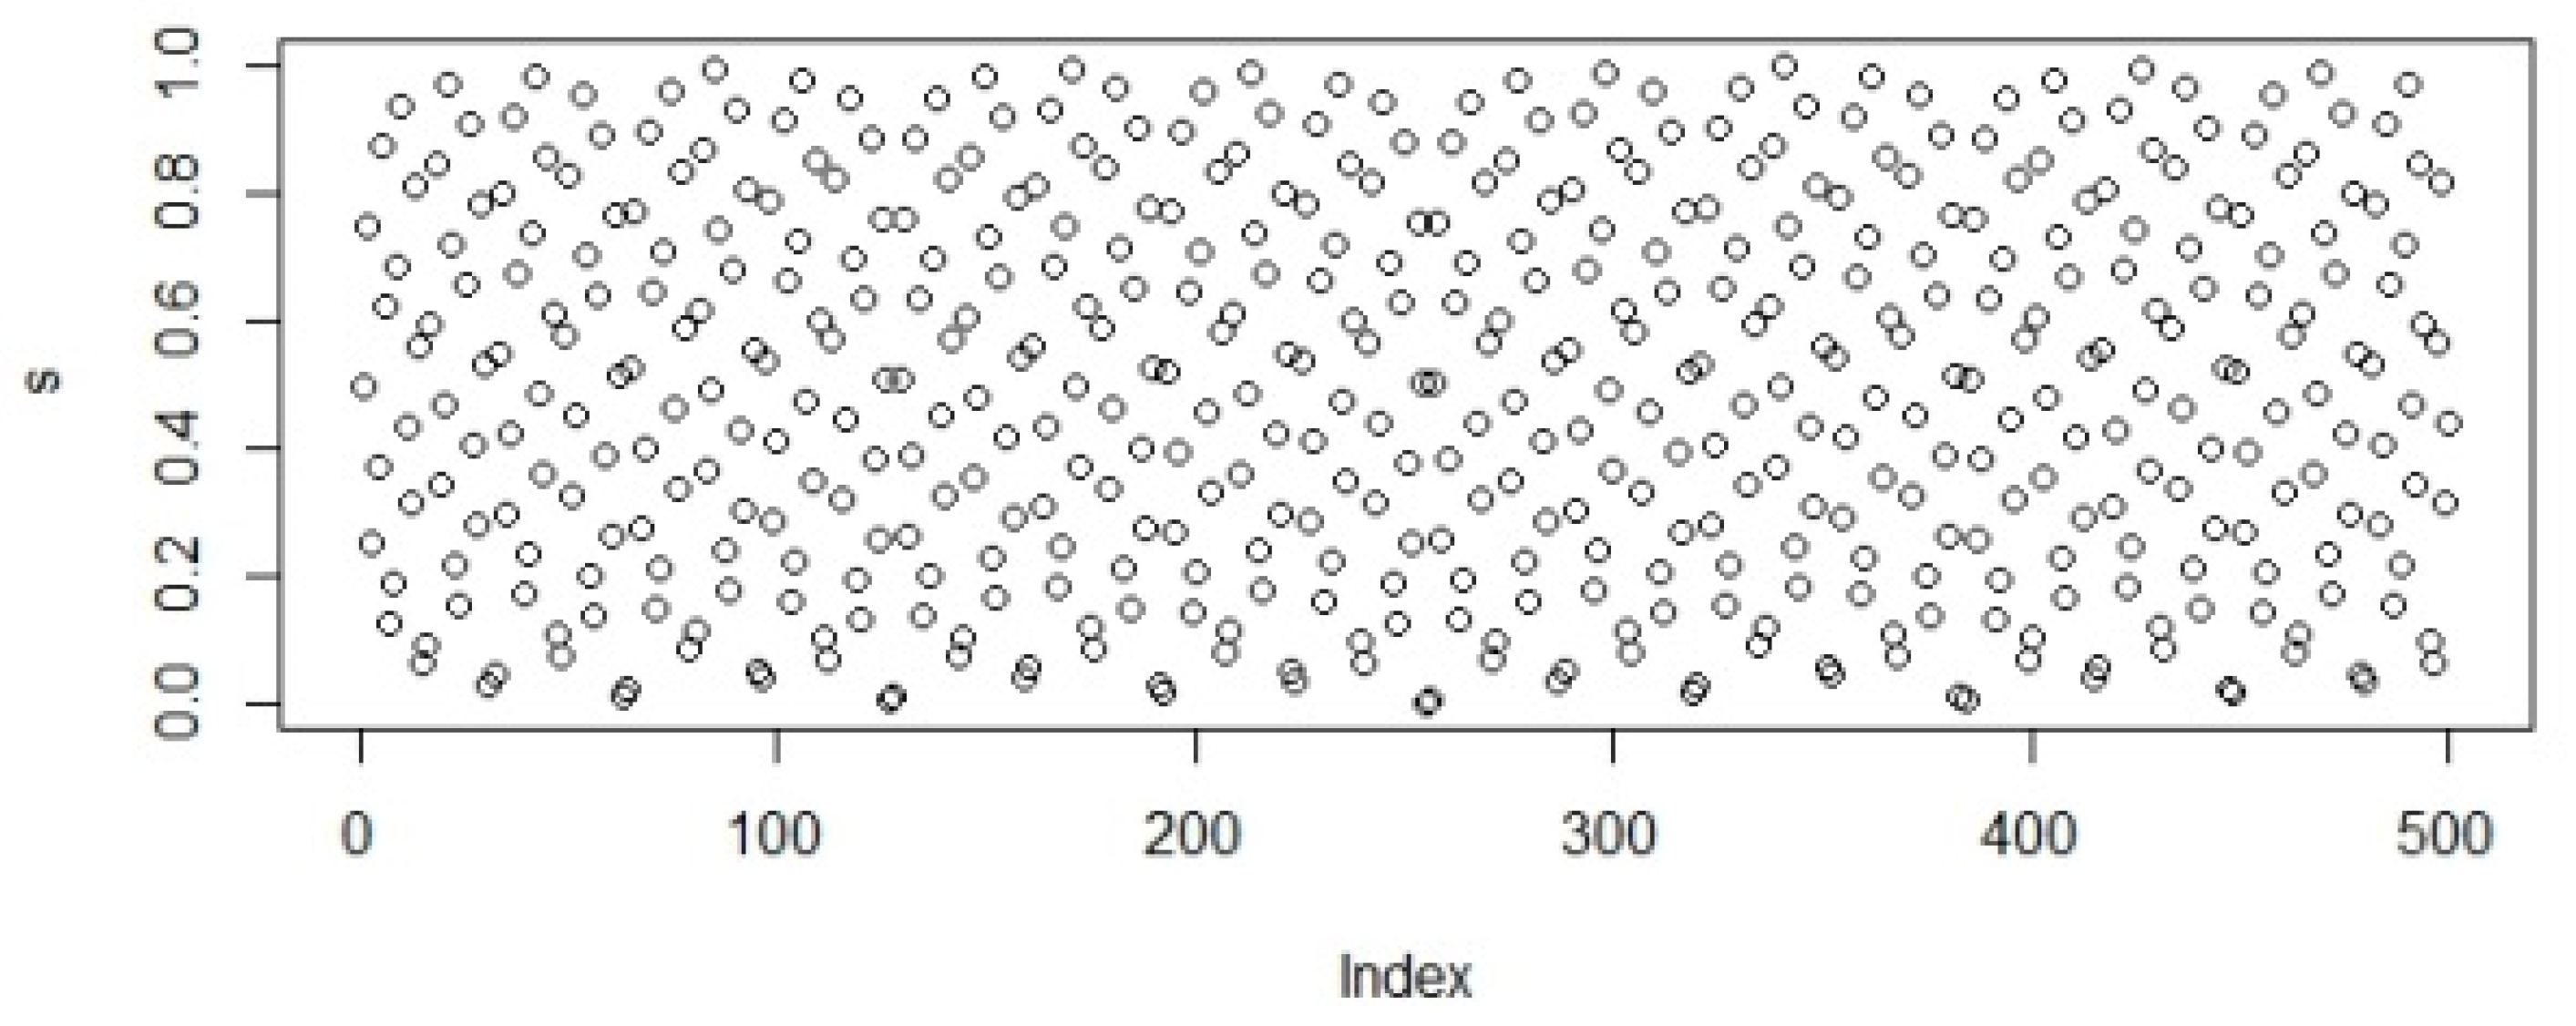
3.2. The Sobol Sequence
Russian mathematician named Sobol carried out the Sobol distribution in 1967 [50] to reconstruct coordinates. For each dimension , coordinate contains the relation of linear recurrences, and for the non-negative instance , the binary expression for liner recurrence can be defined as:
For dimension , the instance can be generated using Equation (4):
where denotes the binary function of the direction of an instance at the dimension , can be calculated using Equation (5):
describes the polynomial coefficient where .
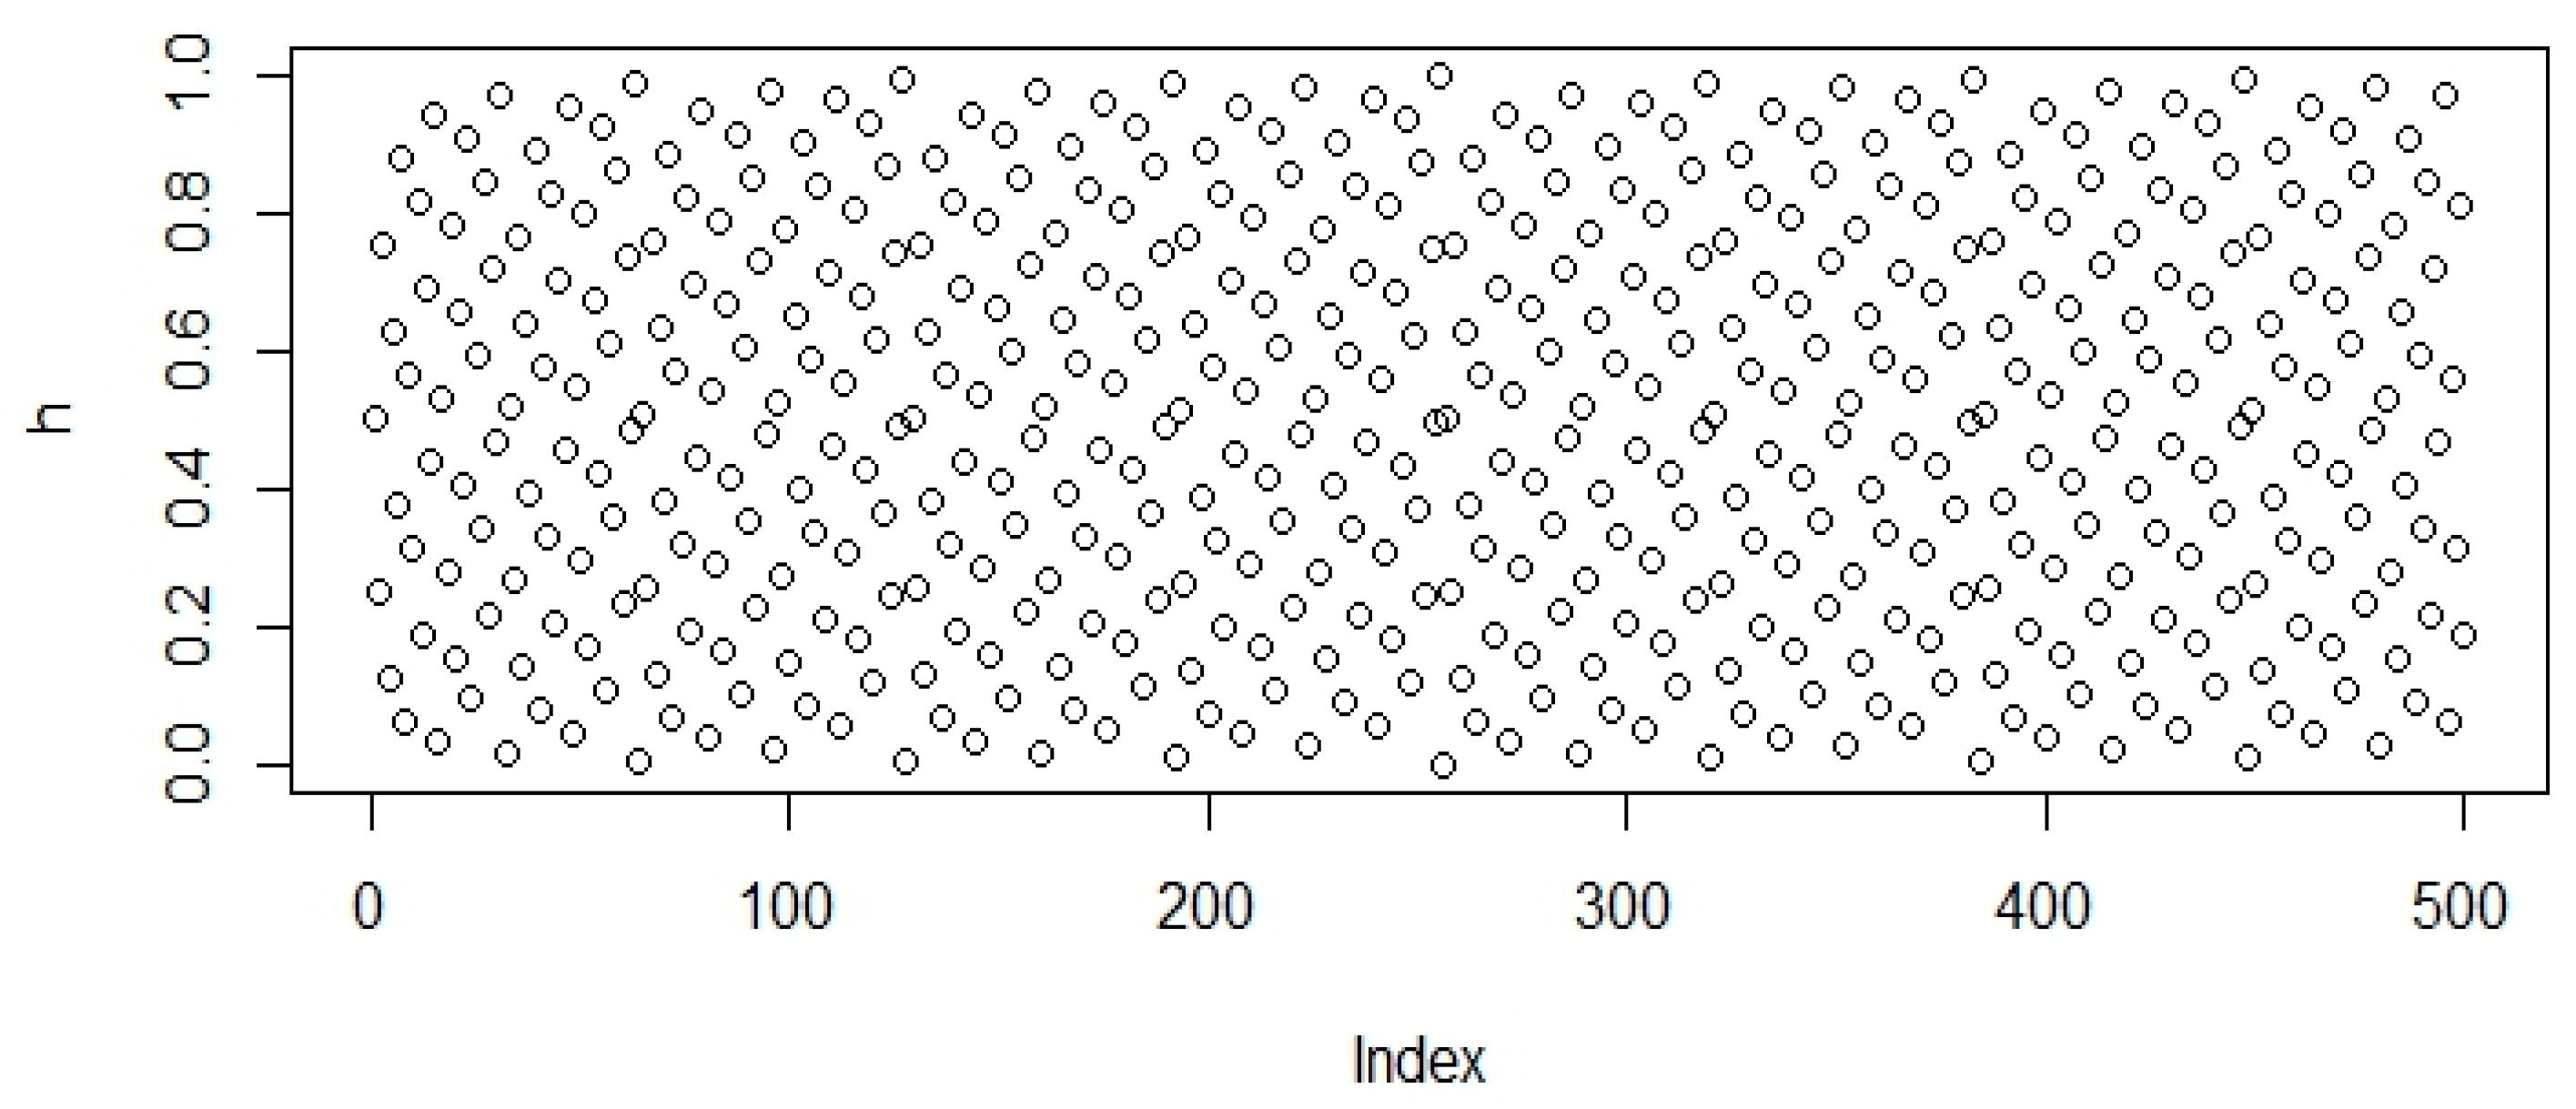
3.3. The Halton Sequence
Halton sequence, designed as an improved version of Van der Corput sequence, was proposed by the authors in [51]. Halton sequences use a base of to generate random points. The Algorithm 1 pseudocode to generate Halton sequences is as follows:
| Algorithm 1 Halton Sequences |
| Halton (): // input: Size = and base = with Dimension = // output: population instances = Fix the interval over For each iteration : do For each particle |
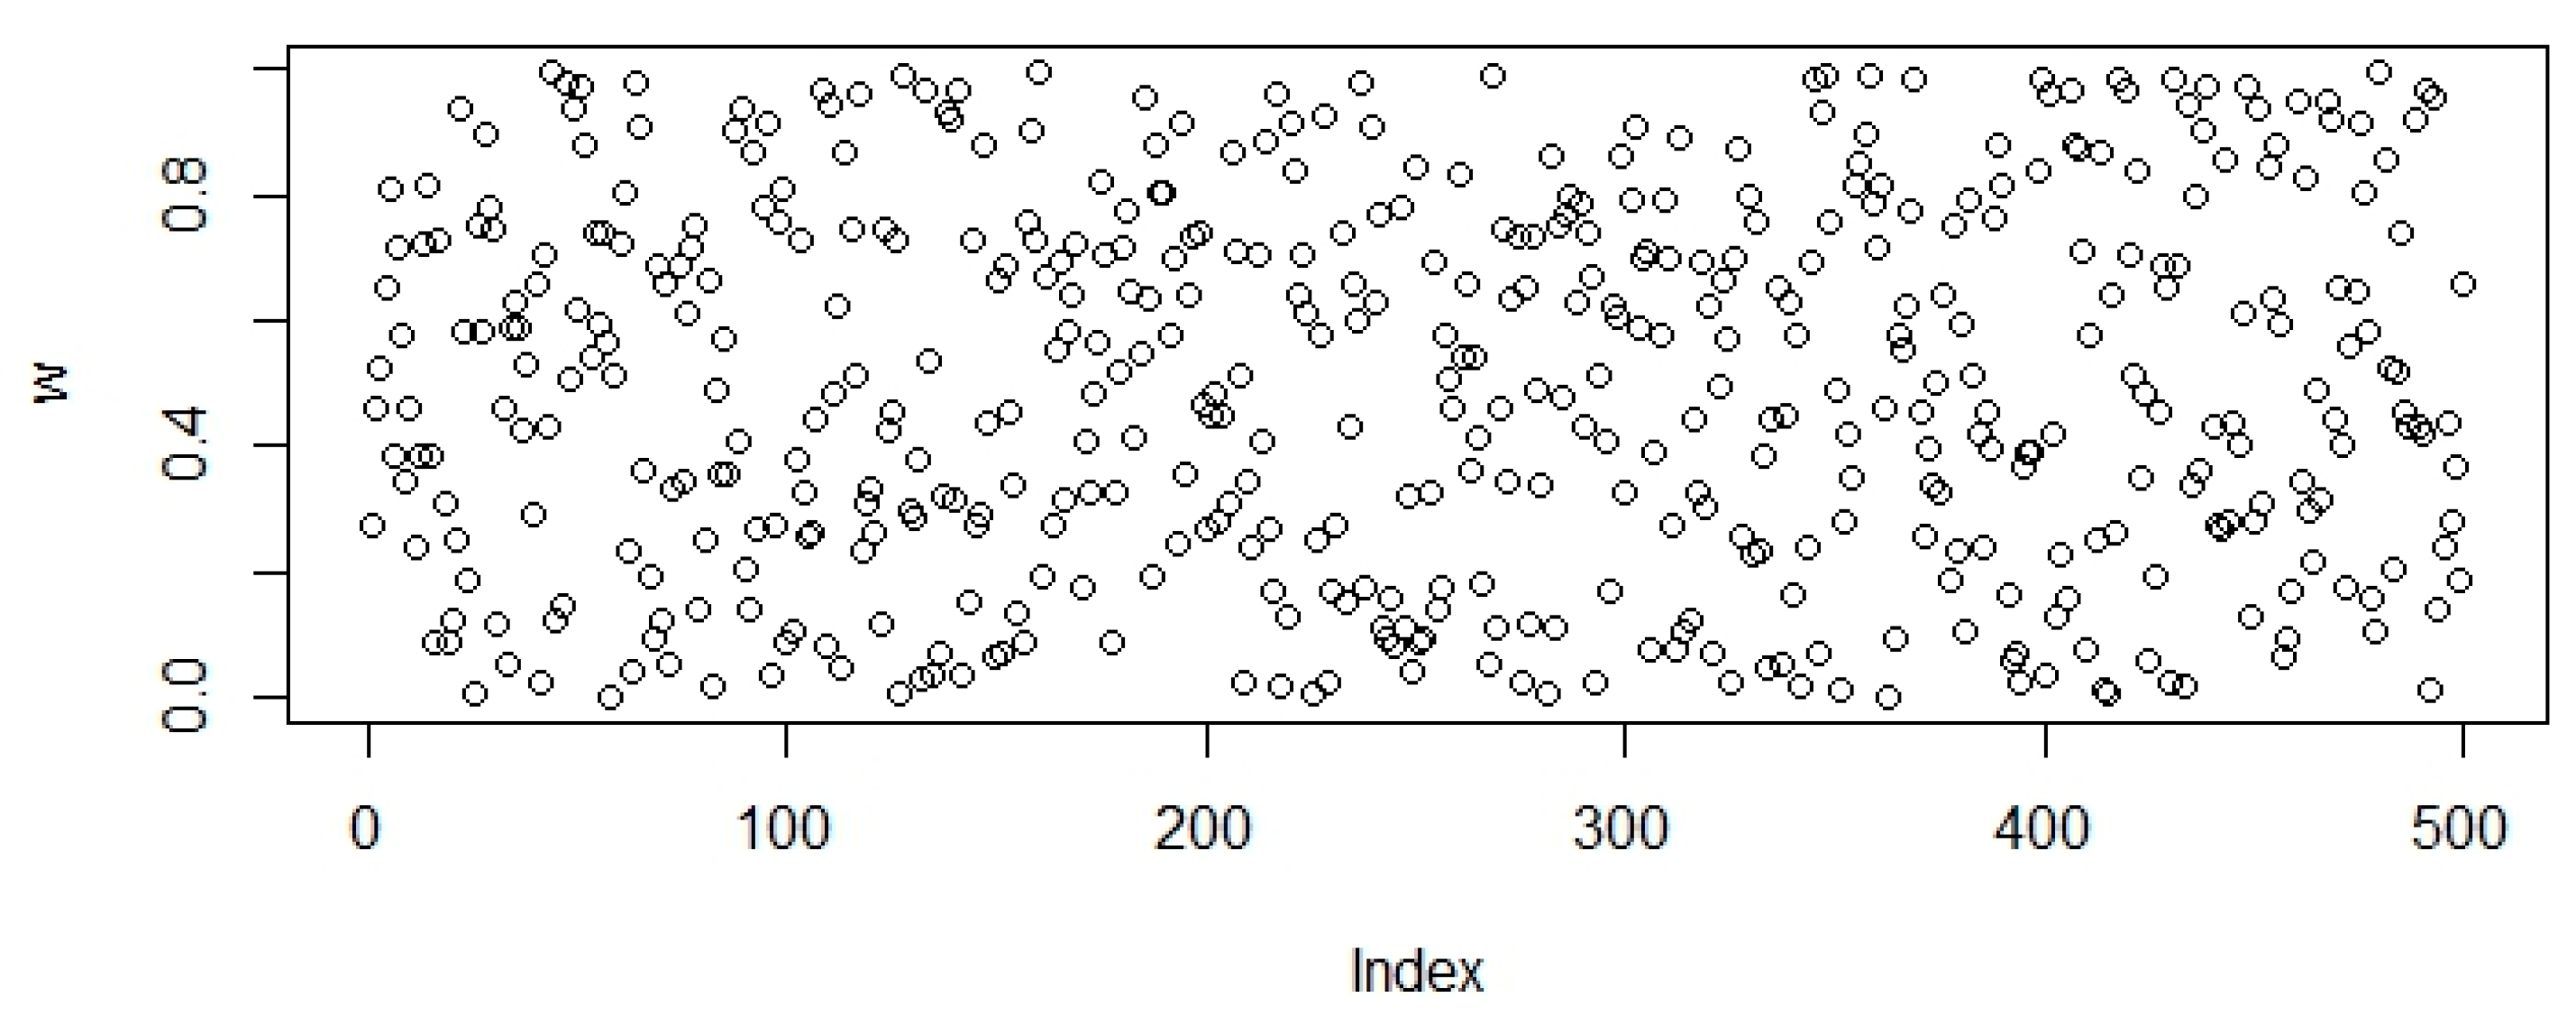
3.4. The Well Sequence
Well-equidistributed long-period linear (WELL) sequence was proposed by [52]. Initially, it carried out an updated version of the Mersenne twister algorithm. The Algorithm 2 for generating WELL distribution is given as:
| Algorithm 2 WELL Sequences |
| WELL (): for Return |
The algorithm stated above describes the general recurrence for the WELL distribution. The description for the algorithm is: and two integers with the interval of and , is the weight factor of distribution. – represents the binary matrix of size having bit block , describing the bitmask that holds the first bits. – are the temporary vector variables.
3.5. The Knuth Sequence
As discussed above, inbuilt library function is used, to generate Knuth sequences of random points. Knuth sequence is designed and was proposed by the authors in [53]. The pseudocode to generate Knuth sequences is as follows:
-To shuffle an array an of n elements (indices 0 … n − 1):
for i from 0 to n − 2 do
j ← random integer such that i ≤ j < n
exchange a[i] and a[j]
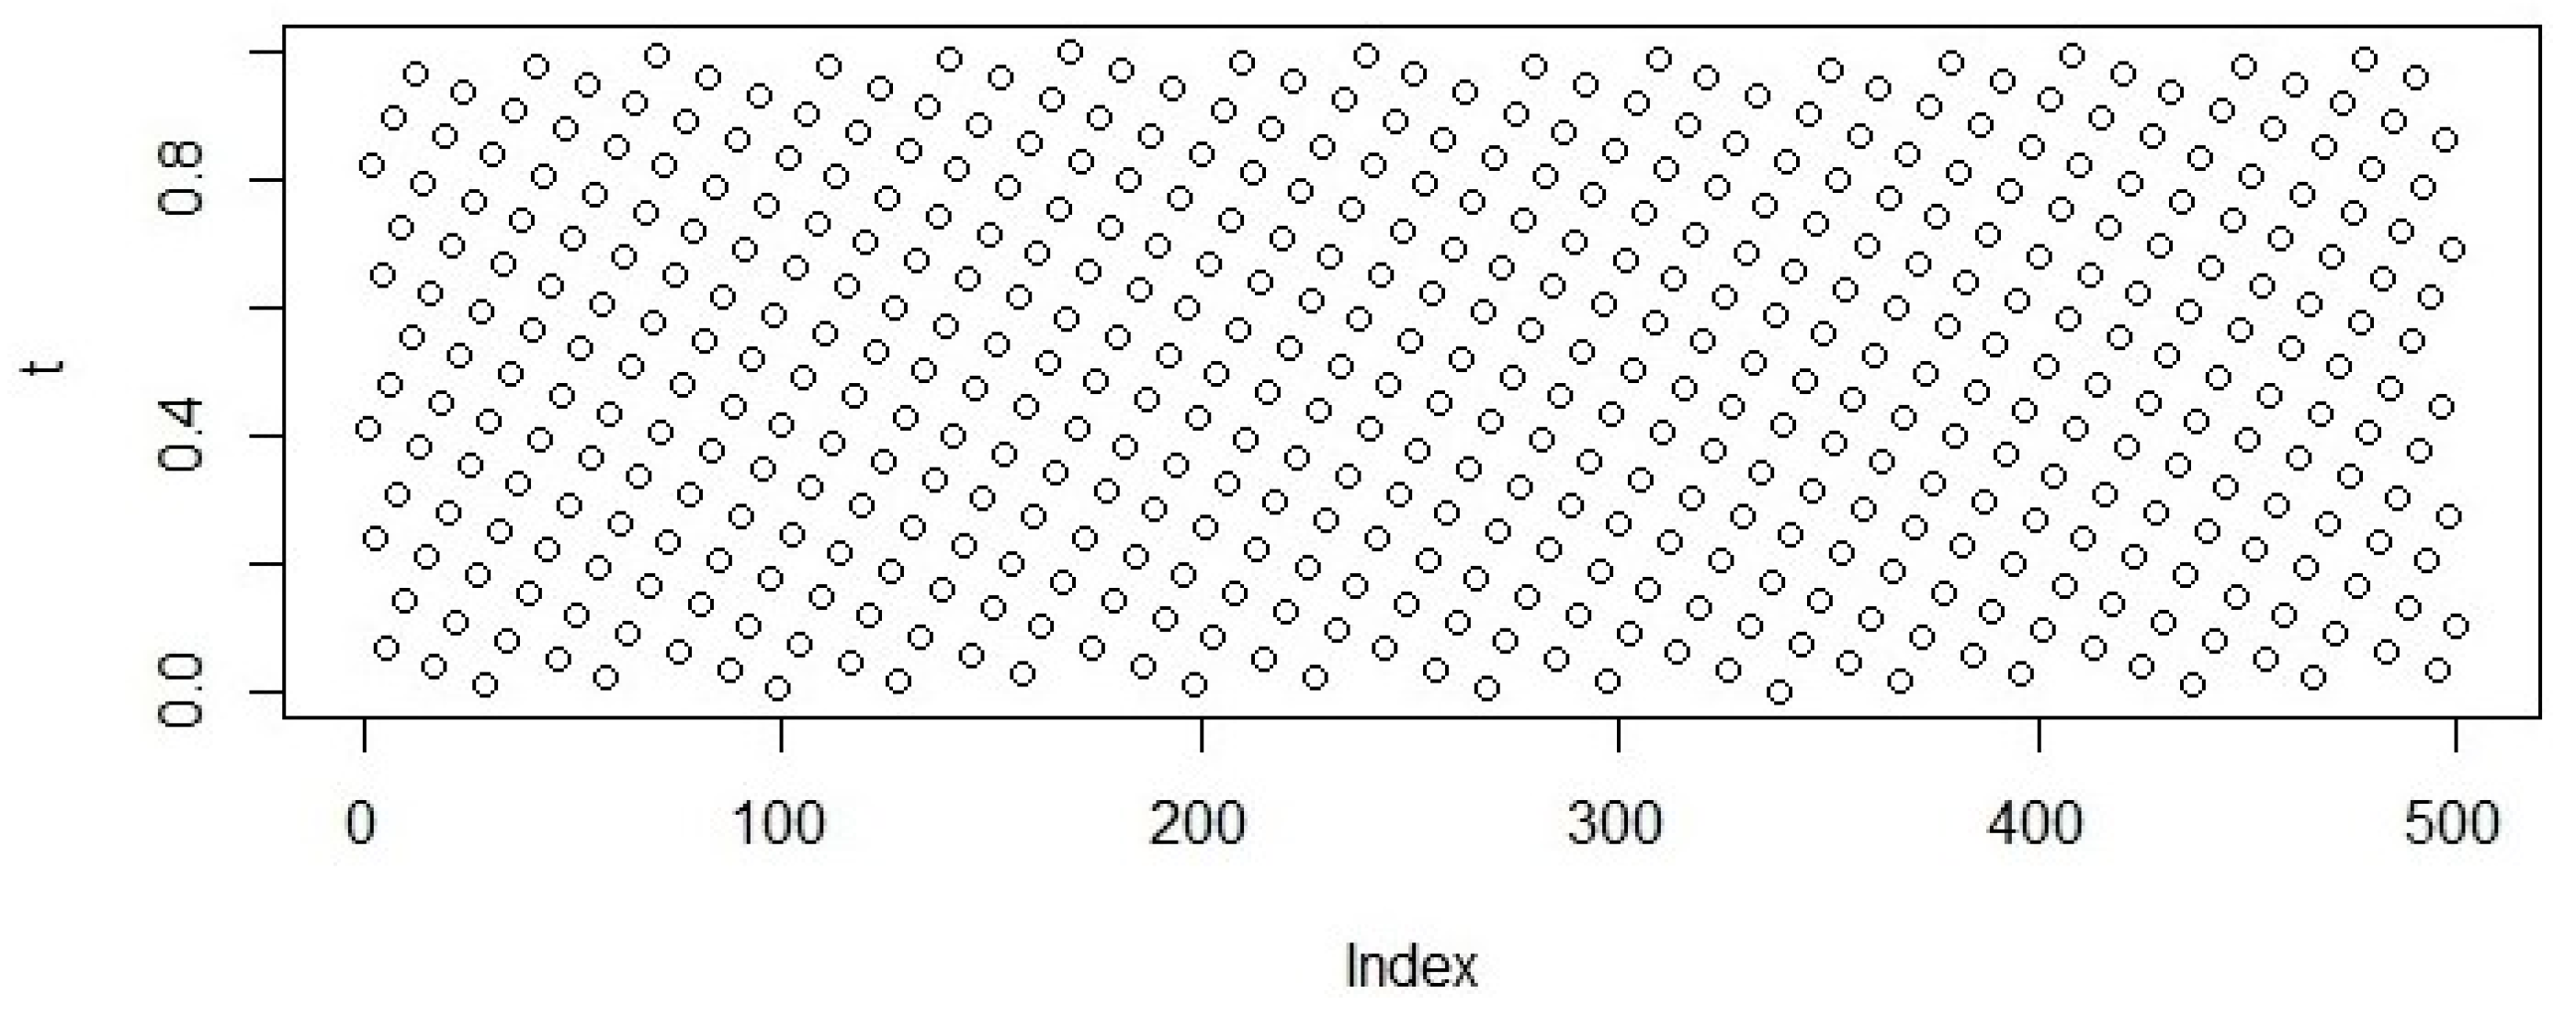
3.6. The Torus Sequence
Torus is a geometric term that was firstly used by the authors in [54] to generate a Torus mesh for a geometric coordinate system. In-game development Torus mesh is commonly used and can be created using a left-hand coordinate system or right-hand coordinate system. The shape for the Torus at 1D, 2D, and 3D is a circle and 2D rectangle, respectively. The Torus in 3D can be represented by the following Equations (6)–(8).
where their angles of circles are θ, δ and D is the distance from tube center to Torus center r denotes to the radius of circle. Inspired by this mesh with Torus, a low-discrepancy sequences have been generated that being initialize with the prime series as Torus effect. Equation (9) shows the mathematical notation for Torus series.
where s1 denotes the series of ith prime number, and f is a fraction which can be calculated by f = a − floor(a). Due to the prime constraints, the dimension for the Torus is limited to the 100,000, only if we use parameter prime in Torus function. For more than 100,000 dimensions the number must be provided manually.
In Figure 1, Figure 2, Figure 3, Figure 4, Figure 5 and Figure 6 random points following the Uniform, Sobol, Halton, WELL, Knuth, and Torus distribution are shown by bubble plot in which the y-axis represents the random values and the x-axis shows the relevant index of the concerned point in the table.
Figure 2.
Population initialization using Sobol distribution.
Figure 3.
Population initialization using Halton distribution.
Figure 4.
Population initialization using WELL distribution.
Figure 5.
Population initialization using Knuth distribution.
Figure 6.
Sample data generated using Torus distribution.
We have made our first significant contribution to this study by introducing three novel methods of initialization of population WE-PSO, KN-PSO, and TO-PSO.
Algorithm 3 shows the proposed distribution-based PSO initialization:
| Algorithm 3 Proposed Pseudocode of PSO Using Novel Method of Initialization |
|
In our other contribution in the paper, we proposed by introducing three new methods of initialization of population DE-KE, DE-WE, and DE-TO.
Algorithm 4 shows the proposed distribution-based DE initialization.
| Algorithm 4 Proposed Pseudo Code of DE Using Novel Method of Initialization |
| Input: 𝑥𝑖 = (𝑥𝑖,1, 𝑥𝑖,2, 𝑥𝑖,3, …, 𝑥𝑖,𝐷), Population size ‘N-P’, Problem Size ‘D’, Mutation Rate ‘F’, Crossover Rate ‘C-R’; Stopping Criteria {Number of Generation, Target}, Upper Bound ‘U’, Lower Bound ‘L’ Output: 𝑥𝑖, = Global fitness vector with minimal fitness value Pop = Initialize of Paraments (N-P, D, U, L); Generate initial population Using WELL,Knuth,Torus While (Stopping Criteria ≠ True) do Best Vector = Evaluate Pop (Pop); vx = Select Rand Vector (Pop); I = Find Index Vector (vx); Select Rand Vector (Pop,v1,v2,v3) where v1 ≠ v2 ≠ v3 ≠ vx vy = v1, + F(v2−v3) For (i = 0; i++; i < D−1) If (randj [0, 1) < C-R) Then U[i] = vx [i]. else U[i] = vy [i] End For loop If (Cost Fun Vector(U) ≤ Cost Fun Vector (vx)) Then Update Pop (U, I, Pop); End IF End While Retune Best Vector |
4. Experimental Setup
The parameter for the fair performance comparison is presented in Table 1. The algorithm settings are shown in Table 2. For the impartial progress, the correlation condition of the performance evaluation alongside the proposed strategy, all of the parameter was set to the uniform.
Table 1.
Experimental setting of parameters.
Table 2.
Parameters setting of algorithms.
The simulation has been simulated in C++ and applied on a computer using the C++ language on the computer with the Windows 10 operating system with the specifications of 8 gigabytes of ram and 2.3 GHz Core (M) 2 Duo CPU processor. Hence in our study, we used it to examine the optimization outcomes of the quasirandom-based approaches. A list of those functions is available in Table 3. In Table 3, D shows the dimensionality of the problem, S represents the interval of the variables, and fmin denotes the standard global optimum minimum value. In the parameters for the simulation used as c1 = c2 = 1.45, inertia weight w is used in the interval [0.9, 0.4], and swarm size is 50. For simulation, the function dimensions are D = 10, 20, and 30, and the maximum number of epochs is 3000. All techniques have been applied to similar parameters for comparatively effective results. In order to check the performance of each quasirandom sequence bases approach, all of them were tested for 10 runs.
Table 3.
Function table with characteristics.
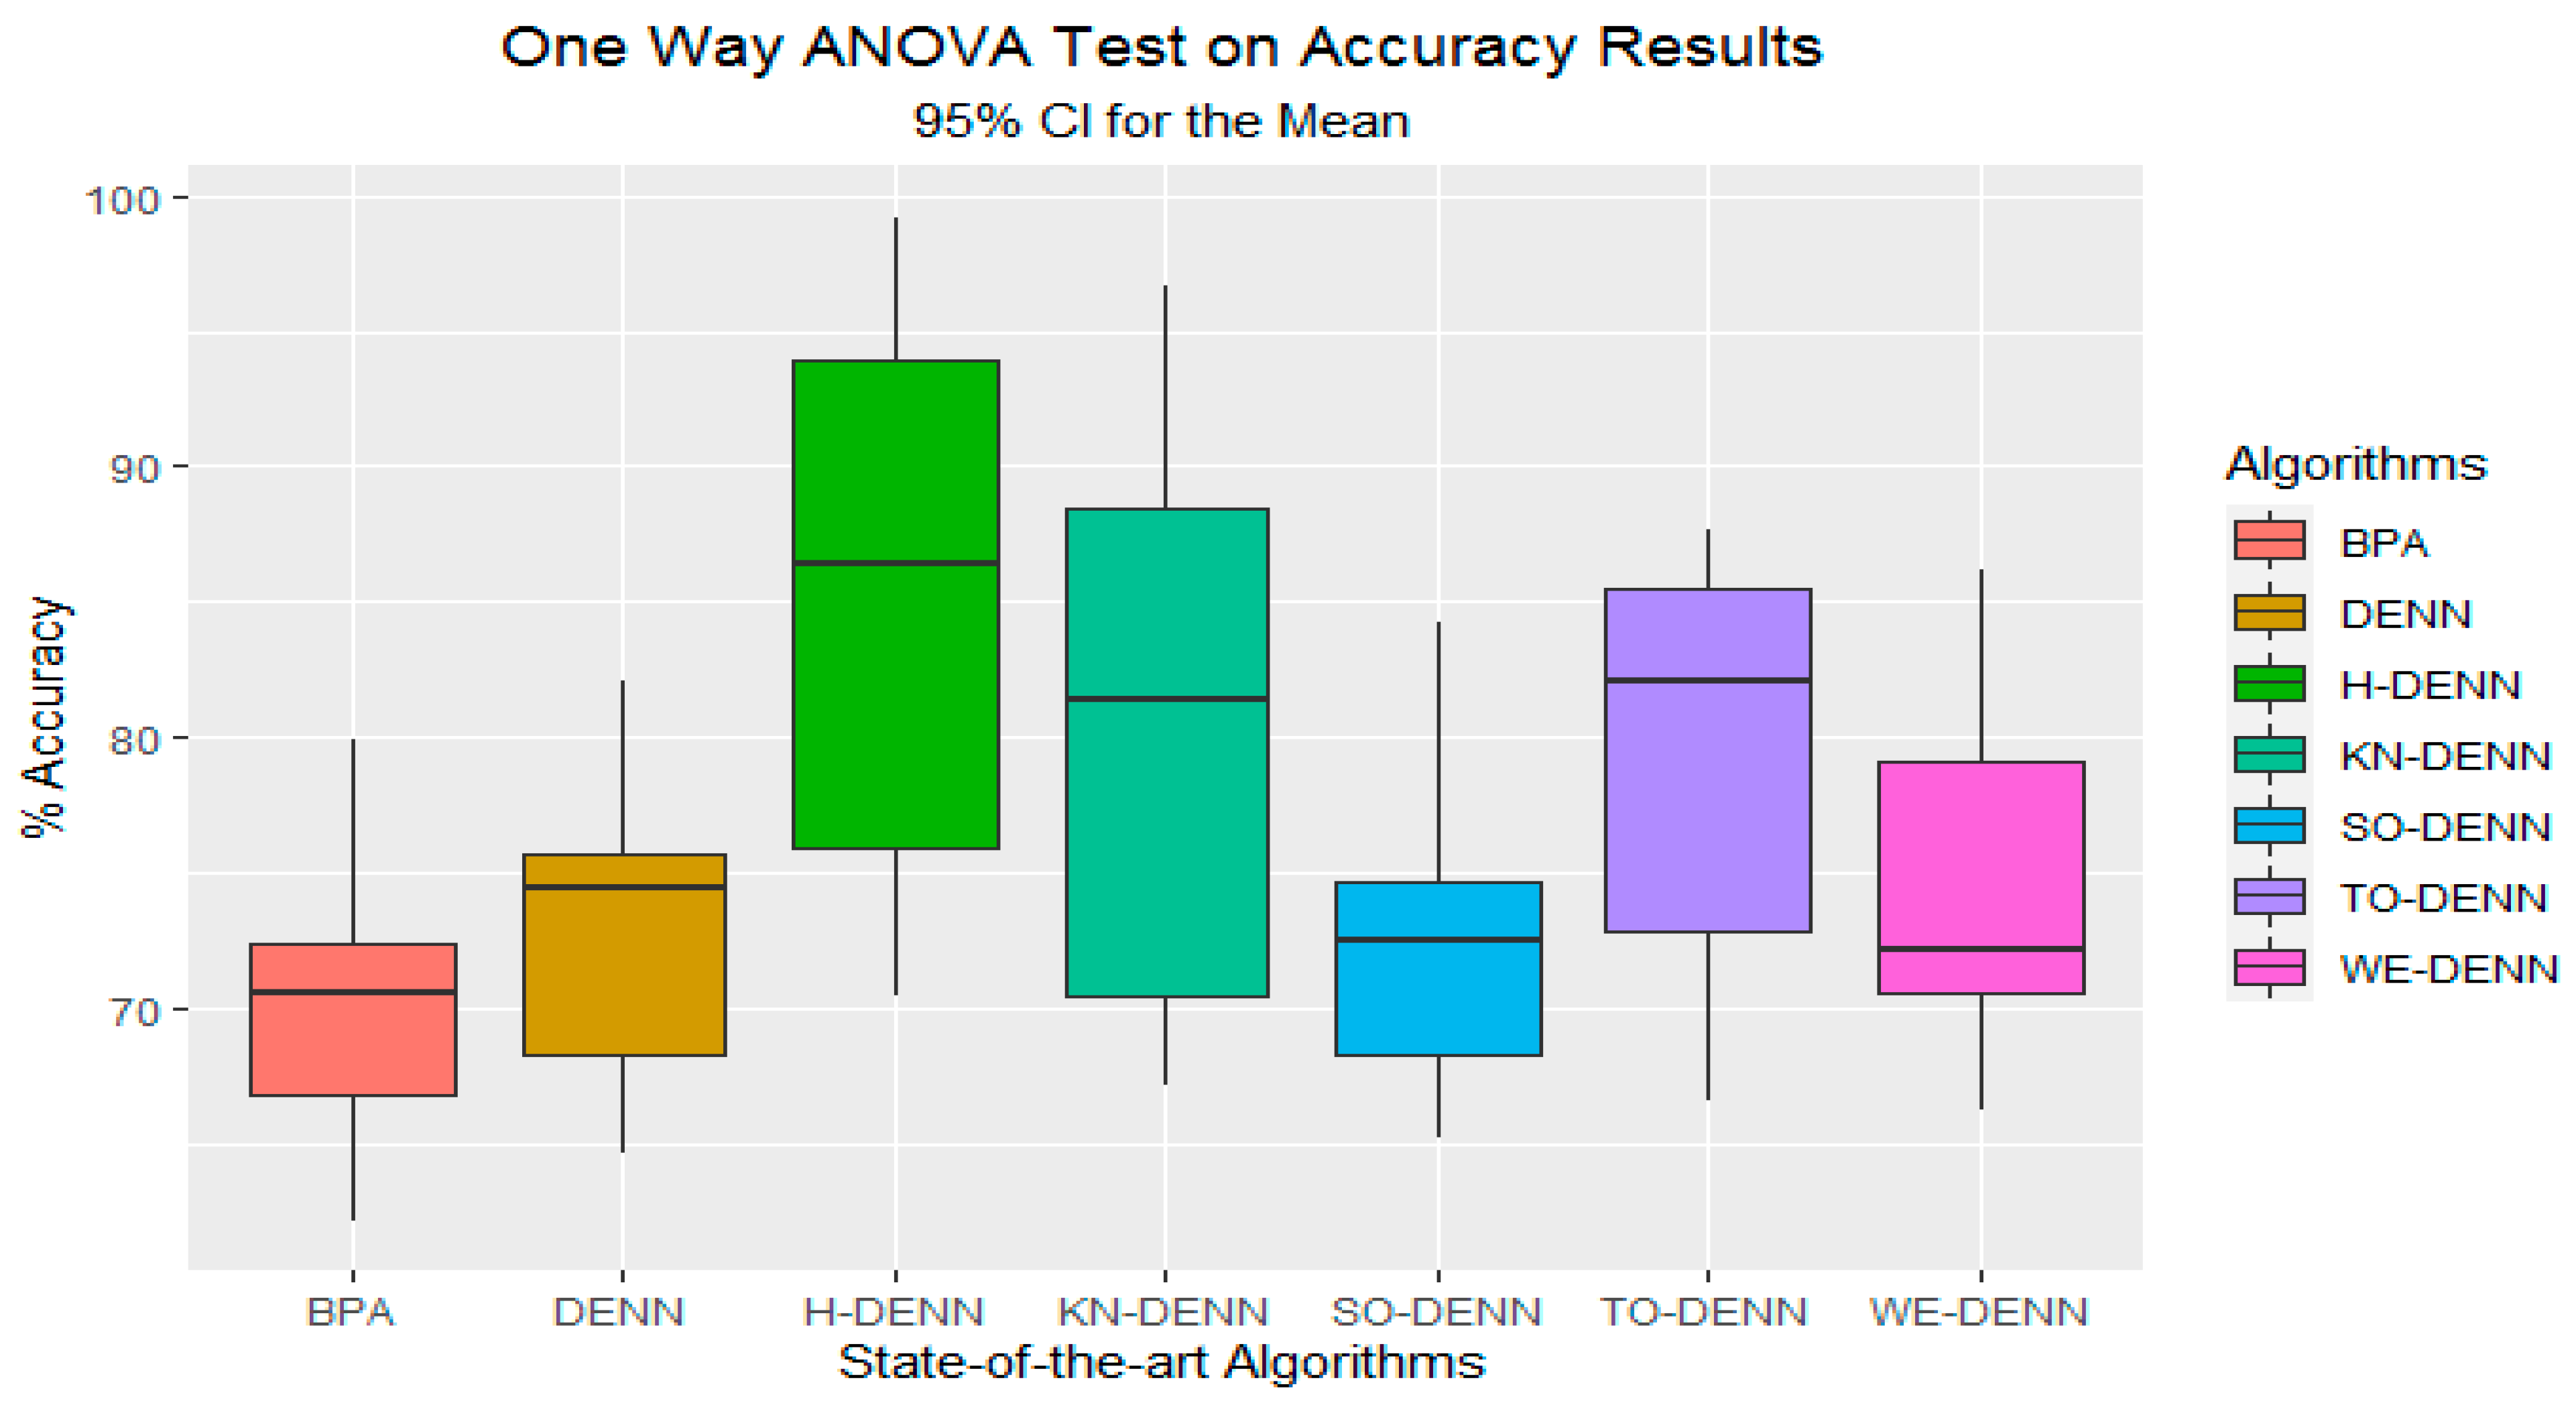
5. Simulation Results and Discussion
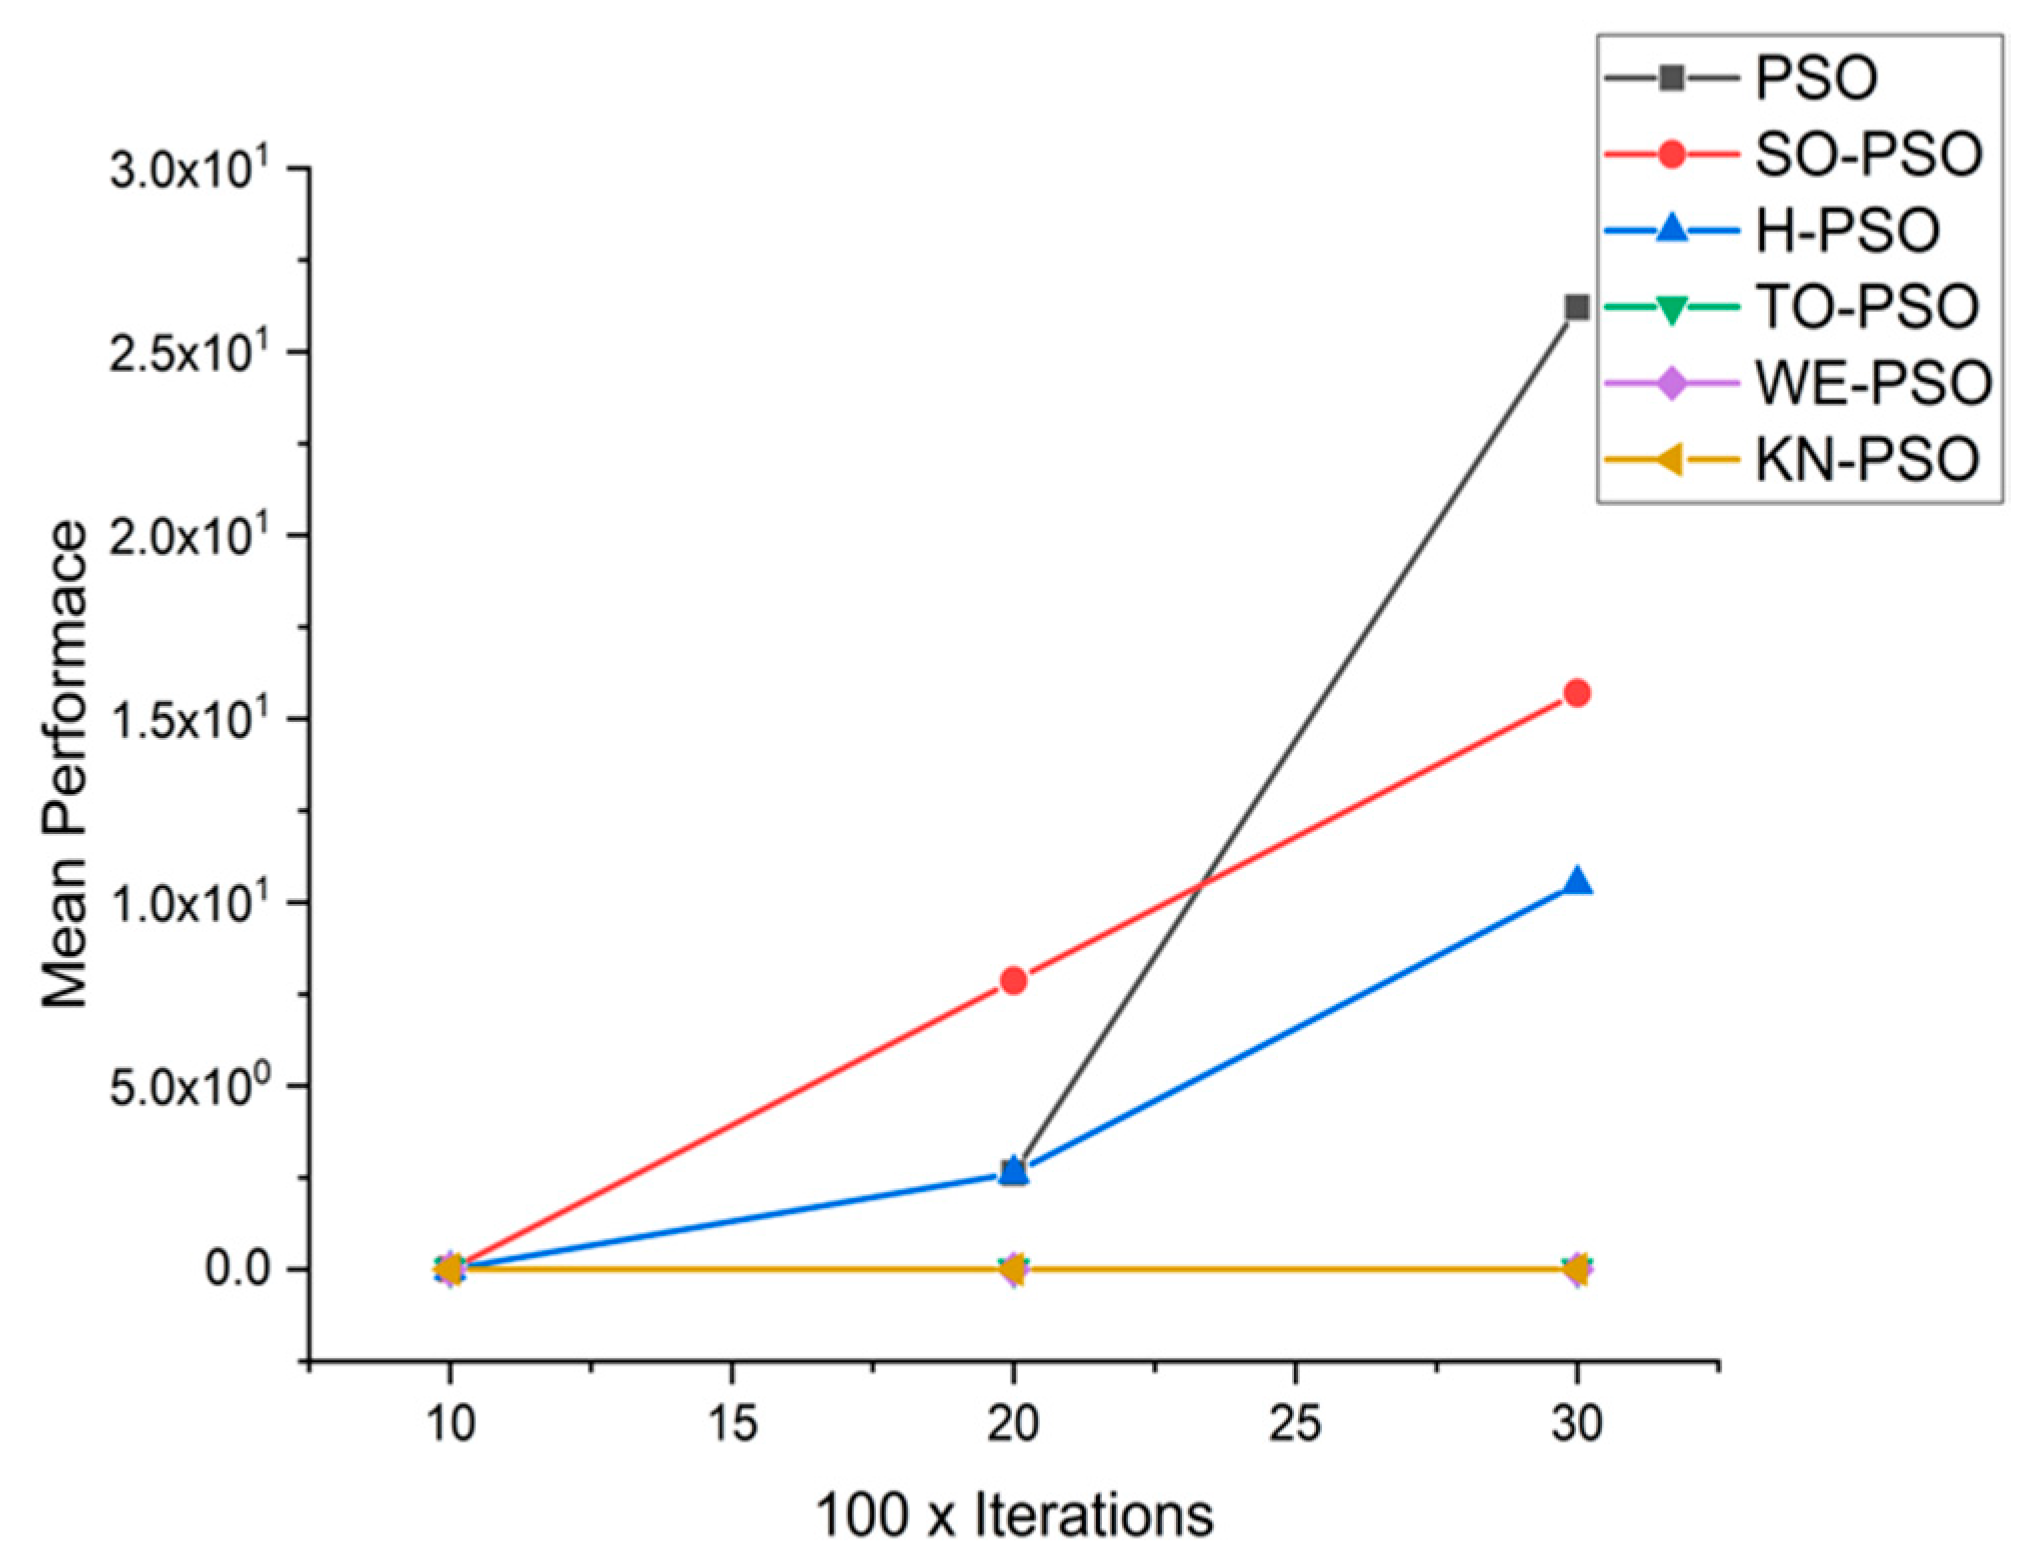
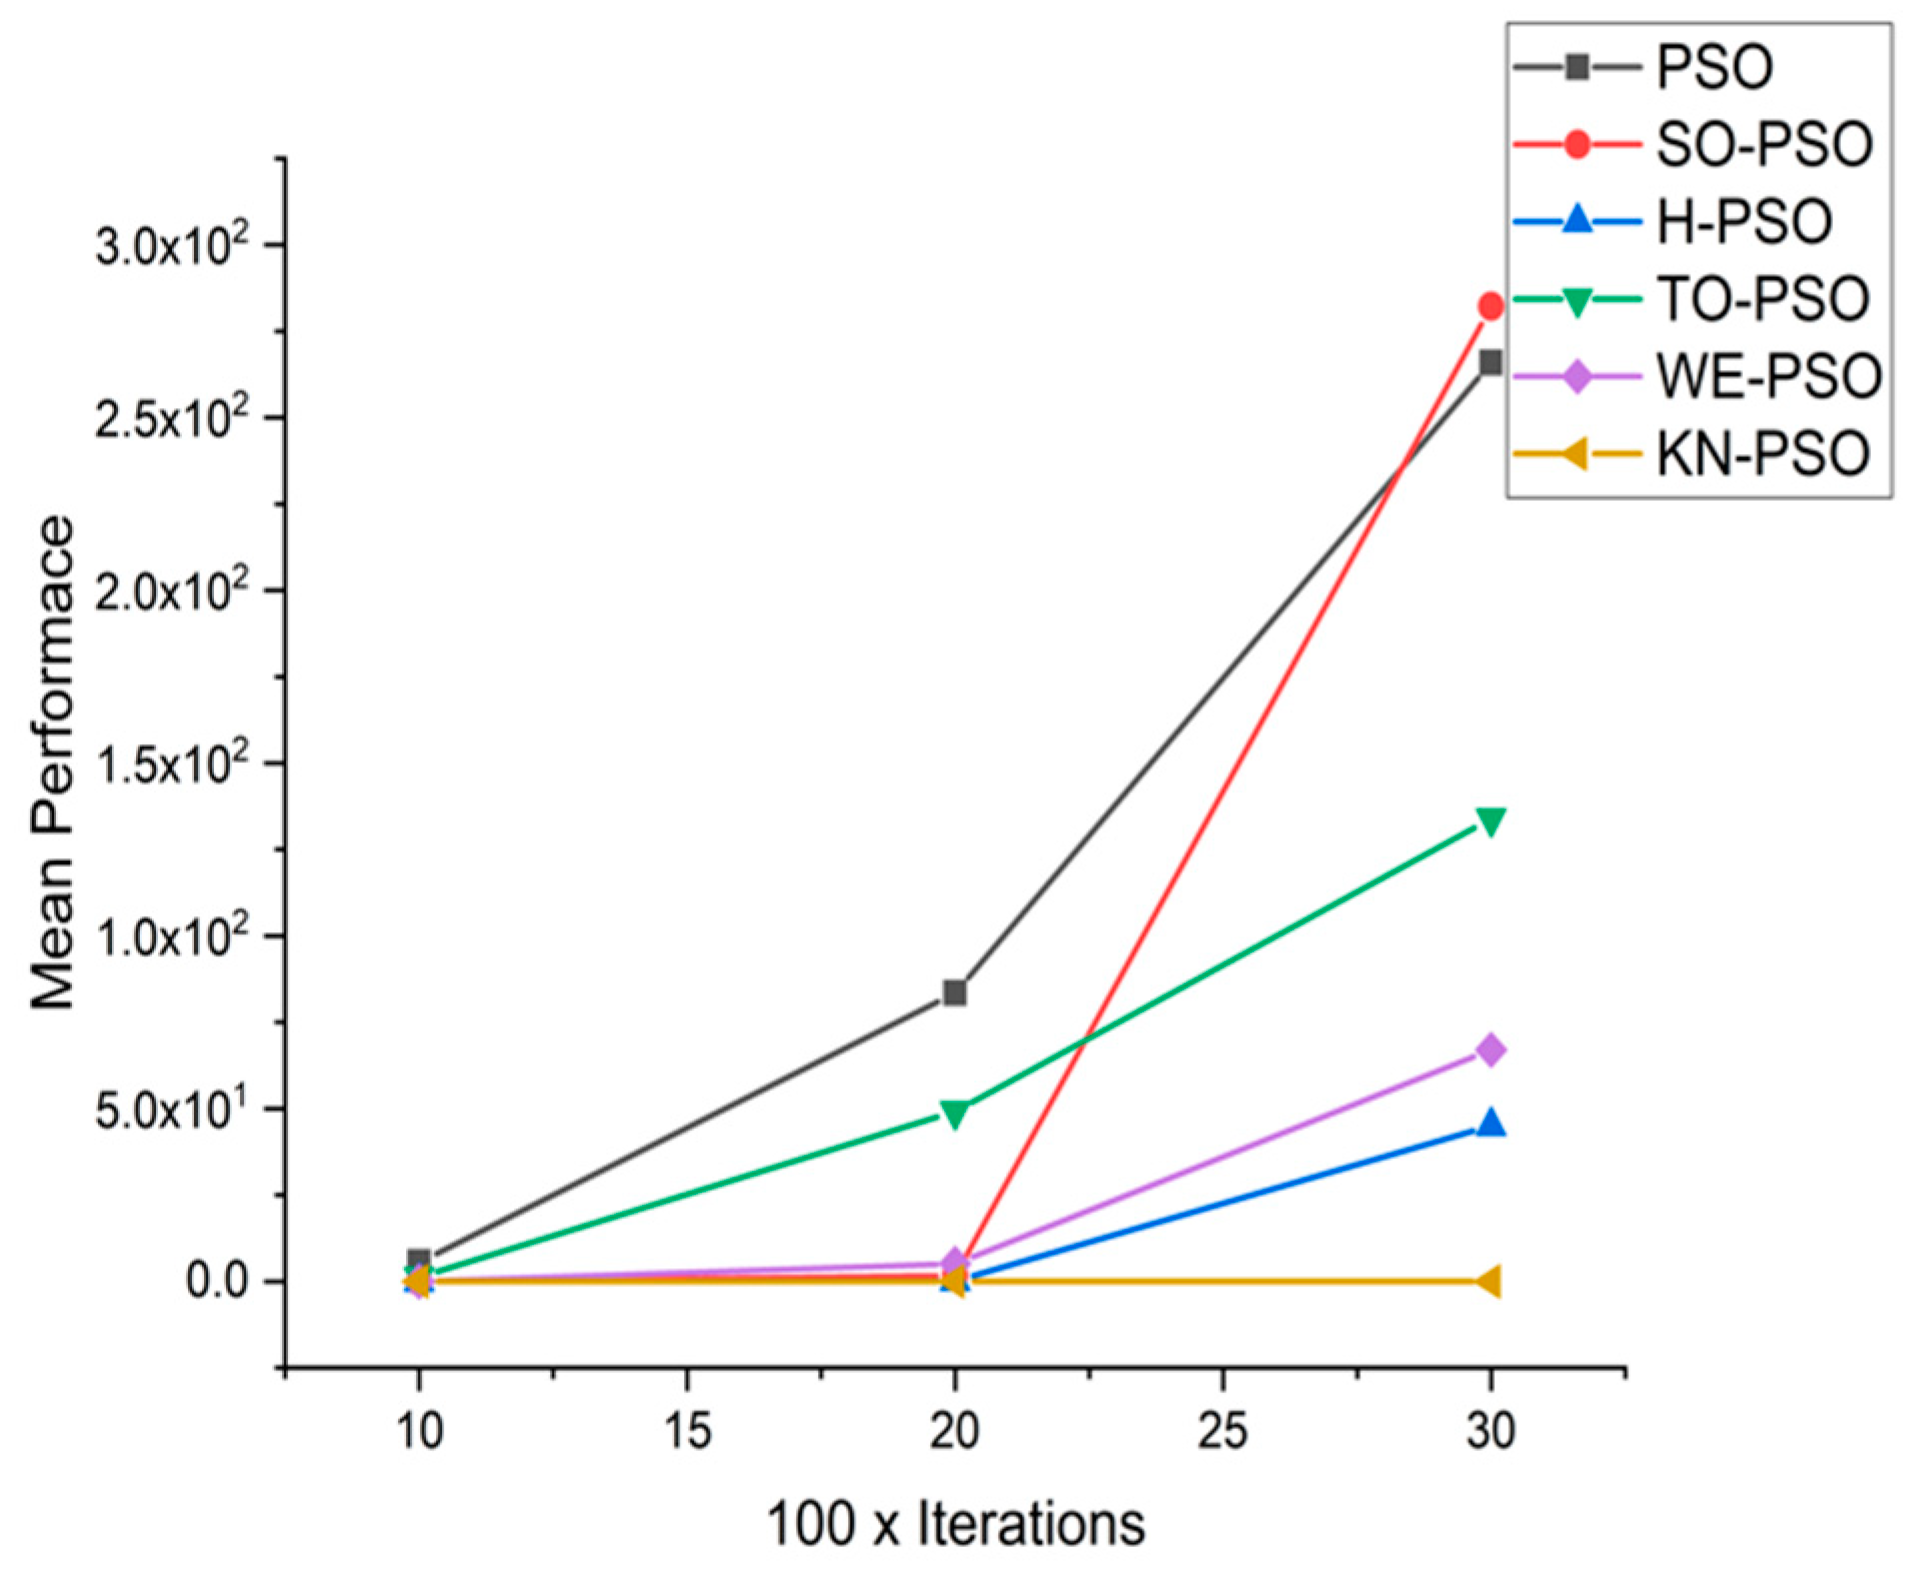
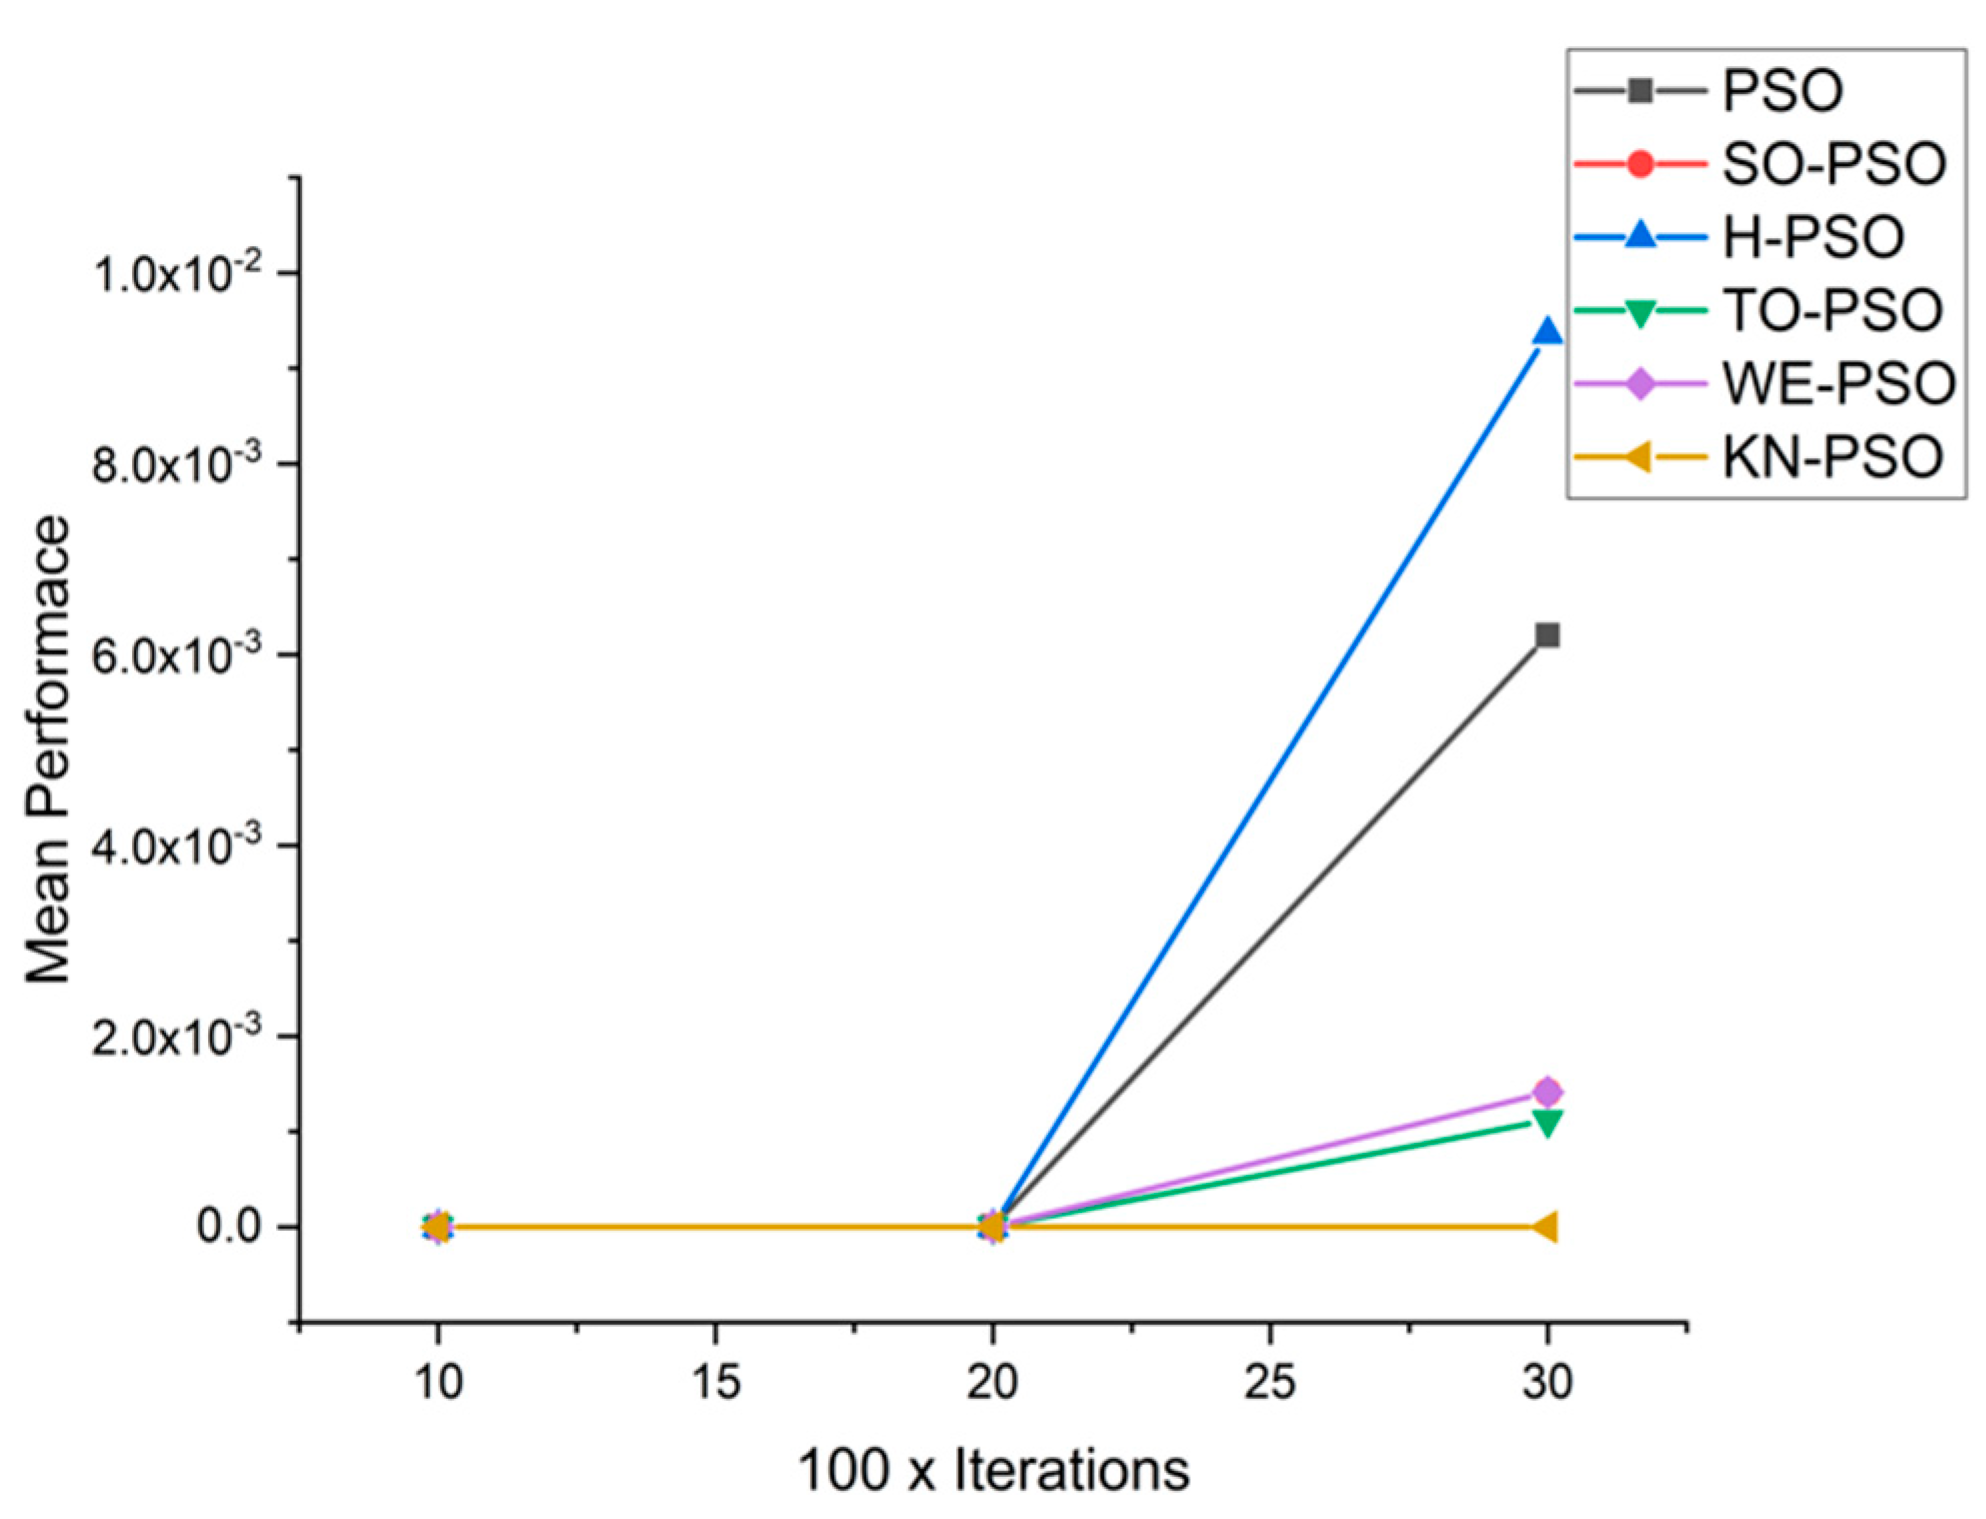
5.1. Results and Graphs on PSO Approaches
The comparative analysis can be seen from Table 4 that with a smaller dimension size, standard PSO performs well (D = 10), but as the size of dimension increases, KN-PSO outperforms in convergence significantly.
Table 4.
Comparative results for all PSO-based approaches on 16 standard benchmark functions.
5.2. Friedman and Kruskal–Wallis Test on PSO Approaches
Mean ranks obtained by Kruskal–Wallis and Friedman test are given in the Table 5.
Table 5.
Mean ranks obtained by Kruskal–Wallis and Friedman test for all PSO-based approaches.
5.3. Discussion on PSO Results
To measure the execution of proposed approaches WELL-based PSO (WE-PSO), Torus-based PSO (TO-PSO), and Knuth-based PSO (KN-PSO), on a group of 16 nonlinear benchmark test functions, have been utilized to make the comparison of WE-PSO, TO-PSO, and KN-PSO with standard PSO, SO-PSO, and H-PSO. These functions are generally applied to investigate the performance of any technique. Hence in our study, we used it to examine the optimization outcomes of the quasirandom-based approach of WE-PSO, TO-PSO, KN-PSO, SO-PSO, and H-PSO.
A. Discussion
The purpose of this study continues to observe whereby the unique characteristics of experimental results rely on dimensions of these standard benchmark functions. In the experiments, three simulation experiments were performed, where the following features of the quasirandom sequence were observed:
- Effect of using different initializing PSO approaches
- Effect of using different dimensions for problems
- A comparative analysis
The objective of this study to find the most suitable initializing method for the PSO, and during the first experiment, the proposed WE-PSO, TO-PSO, and KN-PSO with other approached SO-PSO, H-PSO, and standard PSO were investigated. The objective of second simulation is to find the nature of dimension regarding standard function optimization. Lastly, the simulation results of WE-PSO, TO-PSO, and KN-PSO were compared with standard PSO, SO-PSO, and H-PSO. In the rest of the paper, simulation results were discussed in detail.
Figure 6, Figure 7, Figure 8, Figure 9, Figure 10, Figure 11, Figure 12, Figure 13, Figure 14, Figure 15, Figure 16, Figure 17, Figure 18, Figure 19, Figure 20, Figure 21 and Figure 22 contain the graphical representation of the comparisons of proposed WE-PSO, TO-PSO, and KN-PSO with standard PSO, H-PSO, and SO-PSO. In the x-axis dimensions of the problem, 10, 20, and 30 are presented, while the y-axis represens the mean best against each dimension of the problem.
Figure 7.
Convergence curve on fn1.
Figure 8.
Convergence curve on fn2.
Figure 9.
Convergence curve on fn3.
Figure 10.
Convergence curve on fn4.
Figure 11.
Convergence curve on fn5.
Figure 12.
Convergence curve on fn6.
Figure 13.
Convergence curve on fn7.
Figure 14.
Convergence Curve on fn8.
Figure 15.
Convergence curve on fn9.
Figure 16.
Convergence curve on fn10.
Figure 17.
Convergence curve on fn11.
Figure 18.
Convergence curve on fn12.
Figure 19.
Convergence curve on fn13.
Figure 20.
Convergence curve on fn14.
Figure 21.
Convergence curve on fn15.
Figure 22.
Convergence curve on fn16.
We can see that majority of the figures contains better convergence curve for KN-PSO on functions F1, F2, F3, F4, F5, F6, F17, F8, F9, F10, F11, F12, F13, F14, and F15 over WE-PSO, TO-PSO, H-PSO, SO-PSO, and standard PSO on all dimensions comprehensively. The other proposed approach TO-PSO provides better results over WE-PSO on functions F1, F2, F4, F6, F17, F8, F9, F10, F14, F15, and F16 and beats on all functions for PSO, SO-PSO, and TO-PSO.
- i.
- Effect of Using Different Initializing PSO Approaches
In this simulation, PSO is initialized with the WELL sequence (WE-PSO), Torus Sequence (TO-PSO), and Knuth Sequence (KN-PSO) instead of uniform distribution. The variant proposed WE-PSO, TO-PSO, and KN-PSO is compared with other initialized approaches Sobol sequence (SO-PSO), Halton Sequence (H-PSO), and standard PSO. The experimental results give superior results in higher dimensions for KN-PSO on other SO-PSO, H-PSO, PSO, and proposed approach TO-PSO and WE-PSO.
- ii.
- Effect of Using Different Dimensions for Problems
The core objective of this simulation setup is to find the superiority of results depending upon the dimension of the functions that are to be optimized. In experiments, three dimensions for benchmark functions D = 10, D = 20, and D = 30 were used. Simulation results were presented in Table 2. From these simulation results, it was found that functions having larger dimensions found tougher to optimize and it can be seen from the Table 2 when dimension size is D = 20 and D = 30, and our proposed approach KN-PSO shows belter result on higher dimensions than other approaches such as WE-PSO, TO-PSO, standard PSO, H-PSO, and SO-PSO.
- iii.
- Comparative Analysis
KN-PSO is compared with the other approaches such as WE-PSO, TO-PSO, SO-PSO, H-PSO and standard PSO, where each technique true value is presented for comparison with other techniques for the same nature of problems. Standard benchmark functions are presented in the Table 3, and their parameter settings are also shown in the Table 2. The Table 4 shows that with dimension D-30, KN-PSO is more superior and outperforms in convergence than the WE-PSO, TO-PSO, standard PSO, SO-PSO, and H-PSO. The comparative analysis can be seen from Table 4 that with a smaller dimension size, standard PSO performs well (D = 10), but as the size of dimension increases, KN-PSO outperforms in convergence significantly. Hence, KN-PSO is best for higher dimensions. The experimental results from Table 4 show that KN-PSO outclasses the results of WE-PSO, TO-PSO, SO-PSO, H-PSO, and traditional PSO for all functions. It can be seen that the TO-PSO outperformed the results of the other techniques in all functions on SO-PSO, H-PSO, and standard PSO, while the other approach H-PSO performed better on functions f4, f1, f2 for 20D. However, H-PSO gives an overall poor result on higher dimensions, and SO-PSO gives a slightly better result on functions f8, f9, f15 on 10-D but the worst result on larger dimensions). Standard PSO did not provide a better result. Figures from Figure 7, Figure 8, Figure 9, Figure 10, Figure 11, Figure 12, Figure 13, Figure 14 and Figure 15 depict that WE-PSO outperforms in simulation results compared to other approaches for solving the standard benchmark tests functions for dim size D = 10, D = 20, and D = 30.
For the validation of the numerical results, mean ranks obtained by Kruskal–Wallis and Friedman test for KN-PSO, WE-PSO, TO-PSO, SO-PSO, HA-PSO, and standard PSO are given in the Table 5.
5.4. Discussion on DE Results
Population initialization is a vital factor in evolutionary computing-based algorithm, which considerably influences the diversity and convergence. Rather than applying the random distribution for initialization, quasirandom sequences are used to initialize the population. In this paper, the capability of DE has been extended to make it suitable for the optimization problem by introducing, new initialization techniques Knuth sequence-based DE (DE-KN), the Torus-based sequence-based (DE-TO) and the WELL sequence-based DE (DE-WE) to solve the optimization problems in large dimension search spaces. For global optimization, the most considerable variety of benchmark problems can be used. All benchmark problems have their own individual abilities, and the variety of detailed characteristics of such functions explains the level of complexity for benchmark problems. For the efficiency analysis of the abovementioned optimization algorithms, Table 3 displays the benchmark problems that are utilized. The Table 2 explains the following contents of benchmark problems: name, range, domain, and formulas. In this study, those benchmark problems are incorporated and have been extensively utilized in the literature for conveying a deep knowledge of the performance related to the abovementioned optimization algorithms. To measure the effectiveness and robustness of optimization algorithms, benchmark functions are applied. In this study, 16 computationally expensive black-box functions are applied to their various abilities and traits. The purpose of utilizing these benchmark functions is to examine the effectiveness of the abovementioned proposed approaches.
In this section, for a comparison among low-discrepancies sequence, methods are performed with each other with reference to capabilities and efficiency with the help of high-dimensional 15 benchmark functions. Nevertheless, the whole performance of optimization algorithms varies on the basis of setting parameters and also with other testing criteria. Benchmark problems may be embedded to demonstrate the performance of the low-discrepancies sequence approaches, at various complex levels. Table 6 contains the experimental simulation results on benchmark functions. The exhaustive statistical results are explained in Table 7. From Figure 23, Figure 24, Figure 25, Figure 26, Figure 27, Figure 28, Figure 29, Figure 30, Figure 31, Figure 32, Figure 33, Figure 34, Figure 35, Figure 36, Figure 37 and Figure 38, the experimental results of constrained benchmark test functions are only exhibited by having a surface with D = 10, 20, and 30. The experimental results of this work may not contemplate the entire competency of new proposed low-discrepancies sequence in accordance with the all possible conditions The core objective of this section is to review the consequences of tested optimization approaches in high dimensionality, regarding to the accuracy and reliability of achieved solutions at the time of solving complex and computationally expensive optimization problems. From Figure 23, Figure 24, Figure 25, Figure 26, Figure 27, Figure 28, Figure 29, Figure 30, Figure 31, Figure 32, Figure 33, Figure 34, Figure 35, Figure 36, Figure 37 and Figure 38, the performances of following methods: DE-KN, DE-WE, DE-TO, DE-S, DE-H, and traditional DE, are compared for 16 benchmark functions. In the graphs, the horizontal axis displays the total number of iterations, while on the other hand, the vertical axis displays the mean value of objective functions at the fixed number of function computations. Correspondingly, the value achieved in each iteration is operated as a performance measure. As a result, the exploitation ability of traditional DE is moderately low, particularly for high-dimensional problems. The results are also disclosed that traditional DE, DE-SO, and DE-H are only effective in performance while they are tackling with expensive design problems having low dimensionality.
Figure 23.
Convergence curve on fn1.
Figure 24.
Convergence curve on fn2.
Figure 25.
Convergence curve on fn3.
Figure 26.
Convergence curve on fn4.
Figure 27.
Convergence curve on fn5.
Figure 28.
Convergence curve on fn6.
Figure 29.
Convergence curve on fn7.
Figure 30.
Convergence curve on fn8.
Figure 31.
Convergence curve on fn9.
Figure 32.
Convergence curve on fn10.
Figure 33.
Convergence curve on fn11.
Figure 34.
Convergence curve on fn12.
Figure 35.
Convergence curve on fn13.
Figure 36.
Convergence curve on fn14.
Figure 37.
Convergence curve on fn15.
Figure 38.
Convergence curve on fn16.
Beside this, H-DE has excellent control on the high-dimensionality problems compared to other methods in spite of complexity and the superficial topology of the examined problems. Figure 23, Figure 24, Figure 25, Figure 26, Figure 27, Figure 28, Figure 29, Figure 30, Figure 31, Figure 32, Figure 33, Figure 34, Figure 35, Figure 36, Figure 37 and Figure 38 shows the achievements of traditional DE, DE-S, DE-WE, DE-KN, and DE-TO algorithms with regard to their efficiency and capability. The results are demonstrated that DE-H outperforms in higher dimensionality problems. By summarizing it, the dimensionality strongly influences the working of most algorithms. However, it is observed that DE-H is more consistent during the increment of dimensions of the problem. Due to this consistency of DE-H, it is proven that the DE-H algorithm has the greater capability of exploration. For statistical comparison, widely known mean ranks obtained by Kruskal–Wallis and Friedman test, which are implemented to compare the implications between the DE-H algorithm and other algorithms in DE-KN, DE-WE, DE-S, DE-TO, and standard DE, are given in the Table 5.
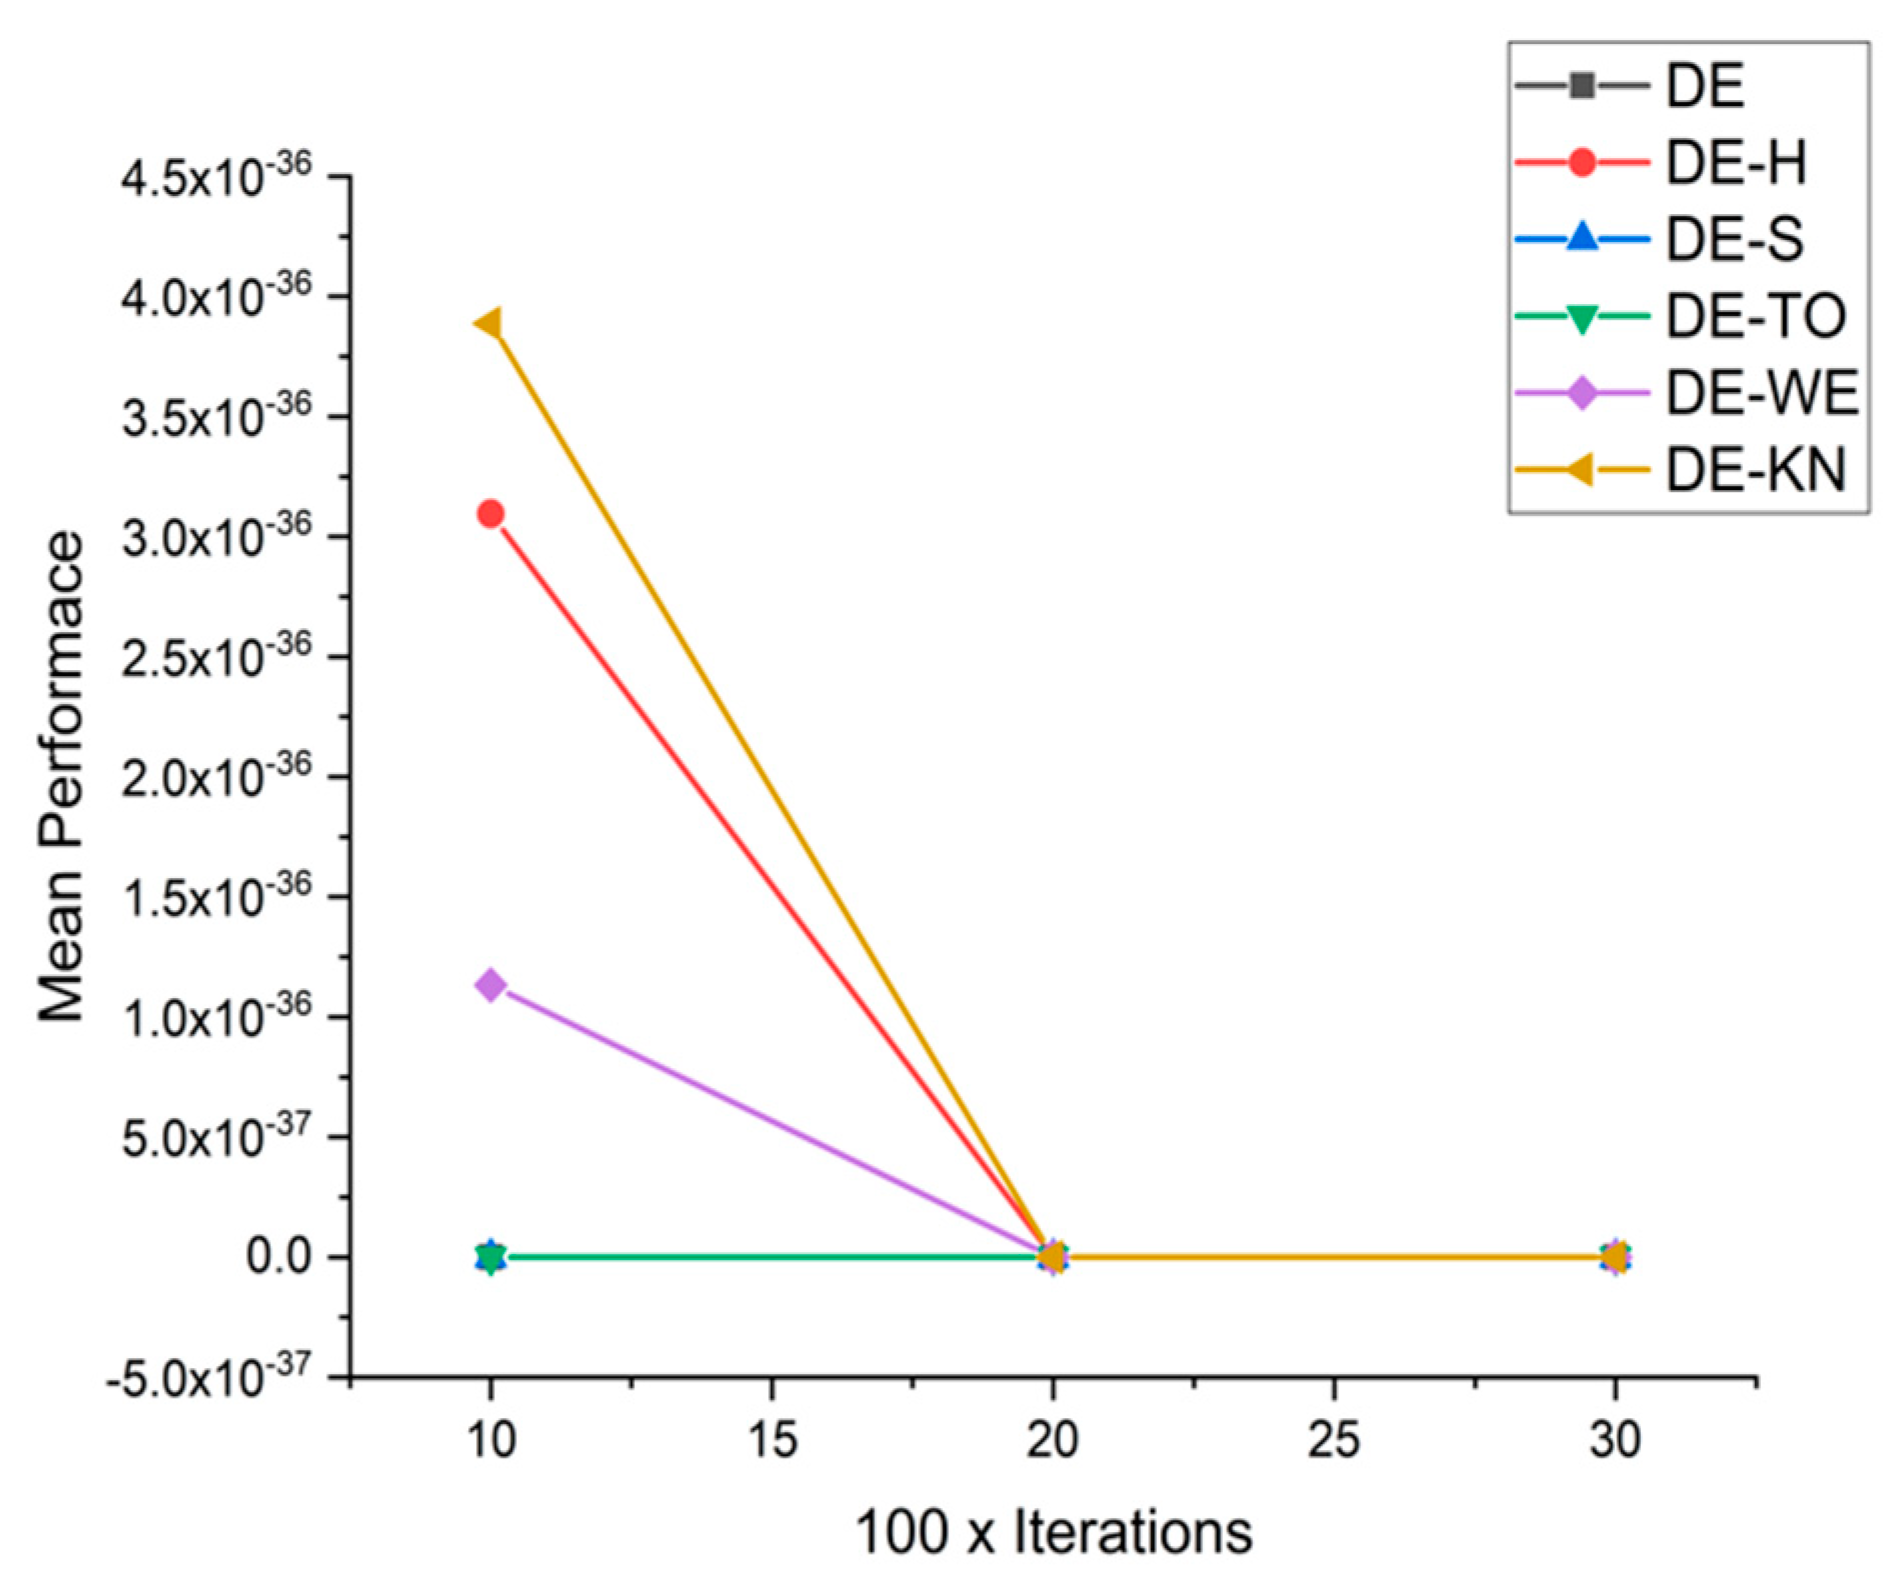
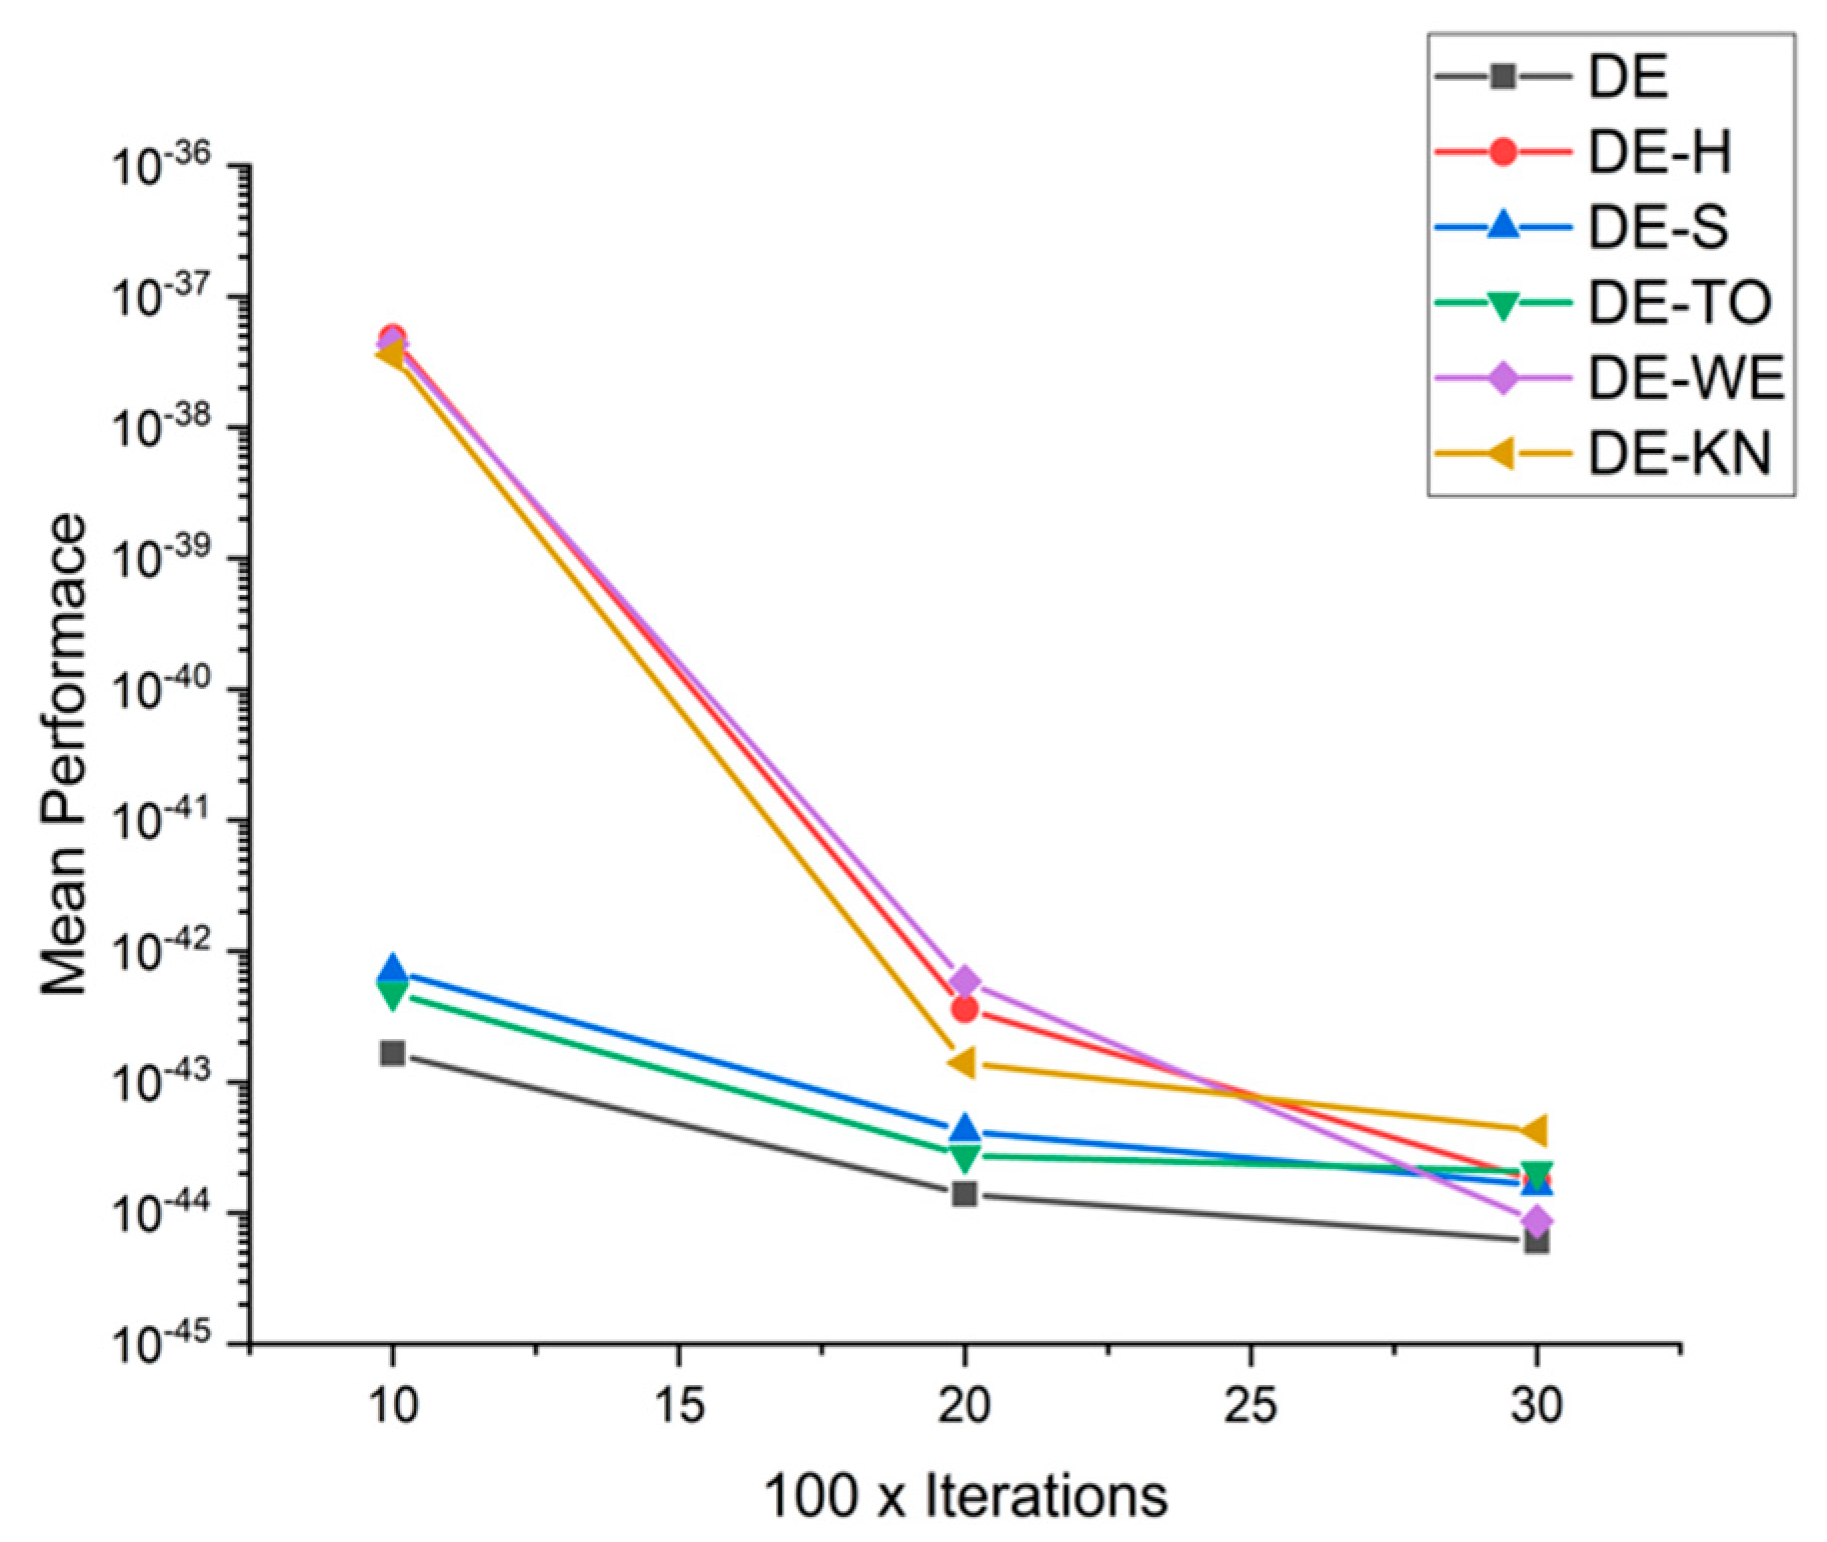
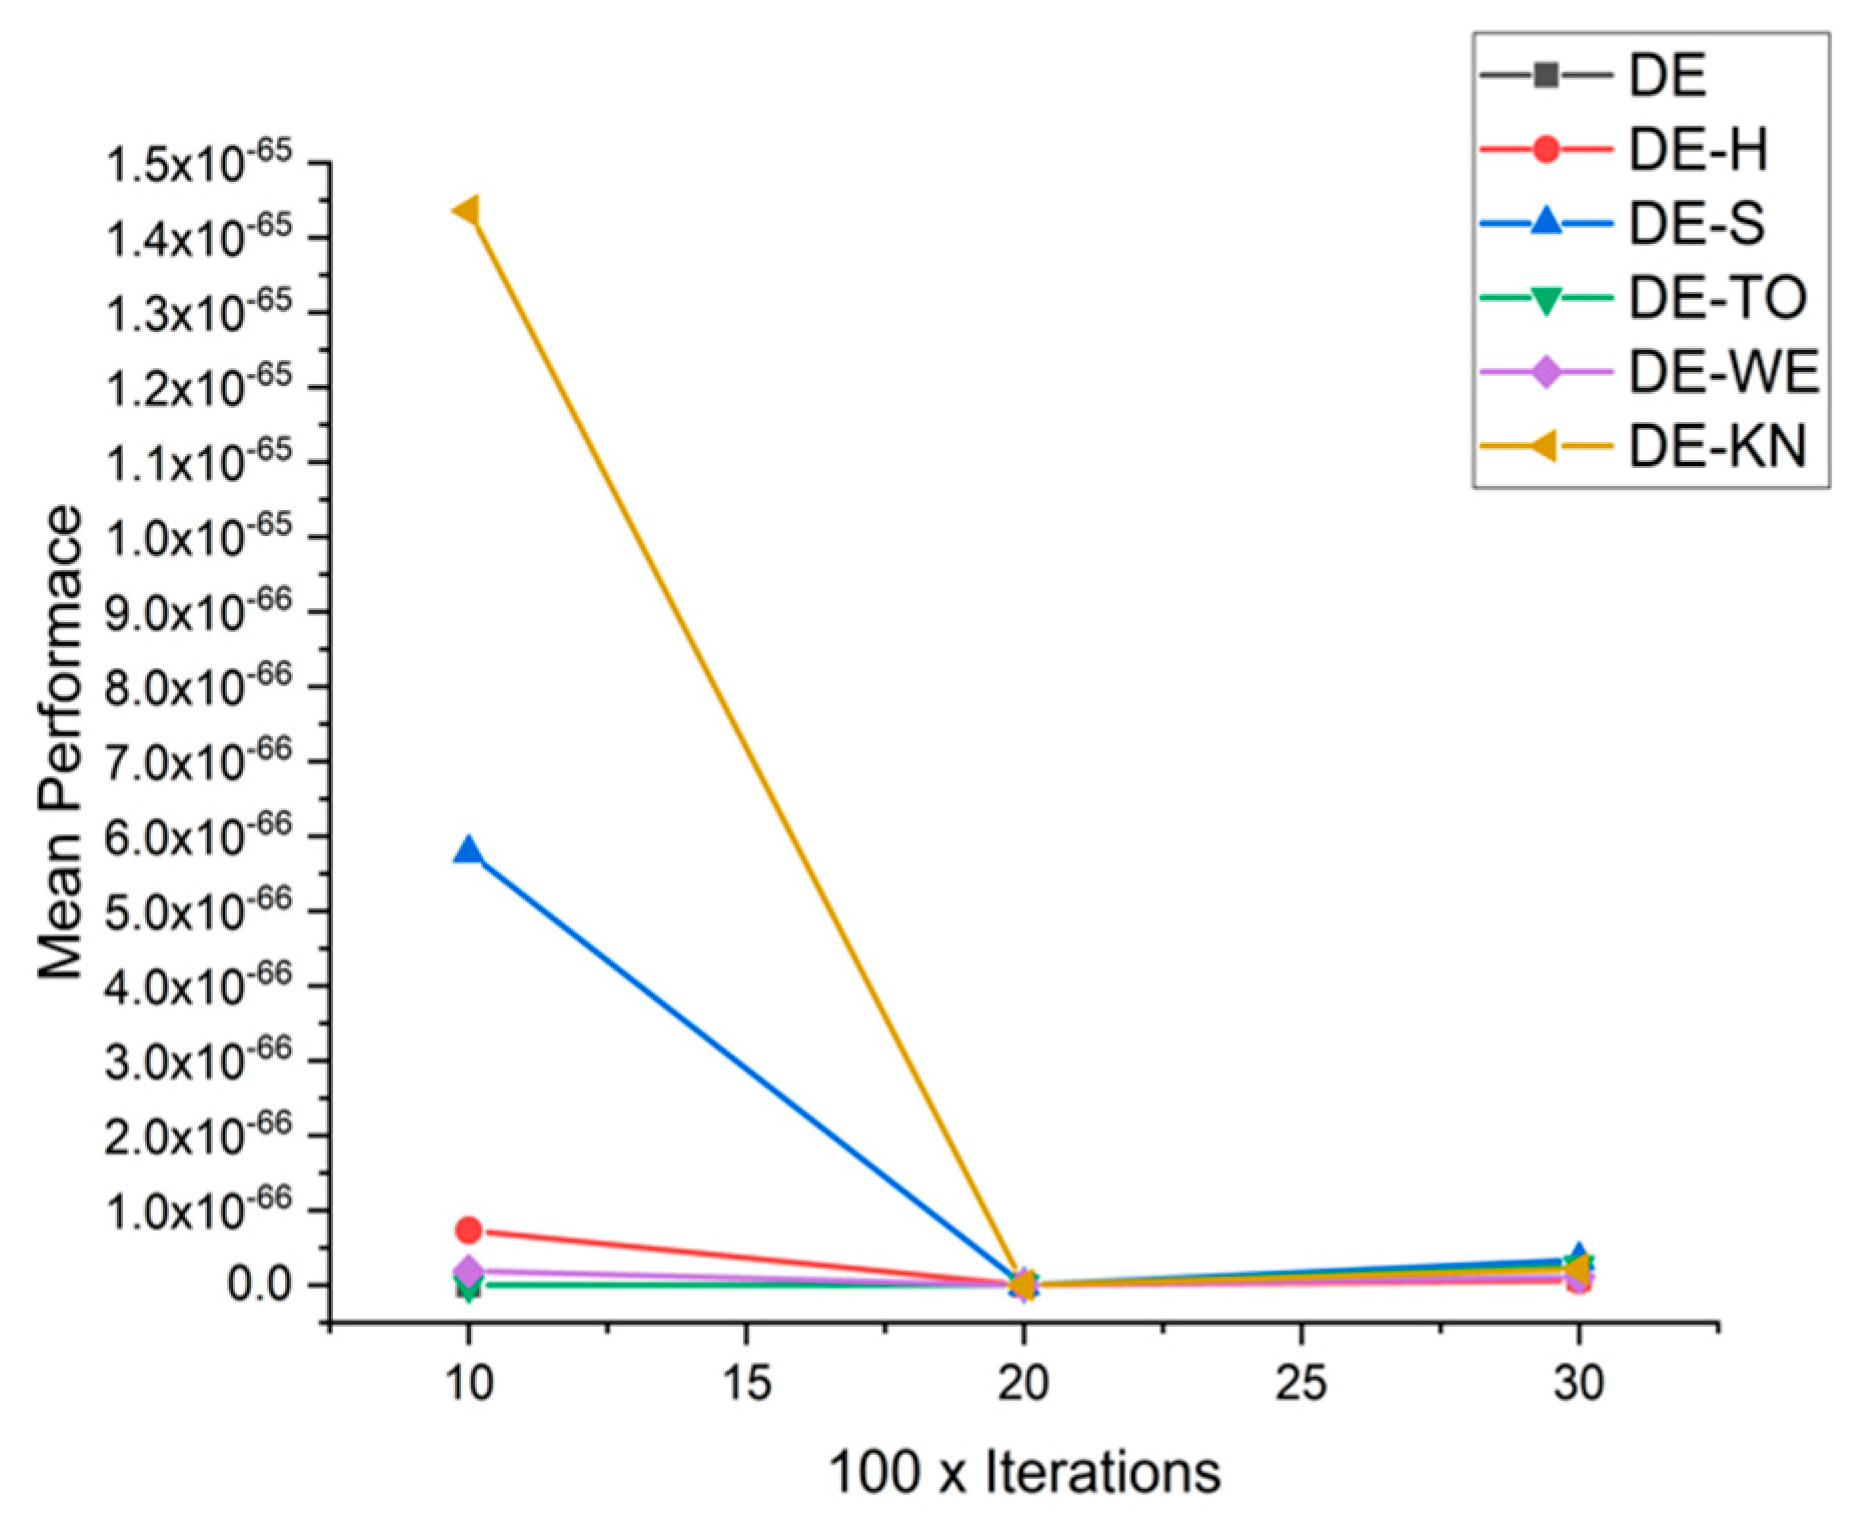
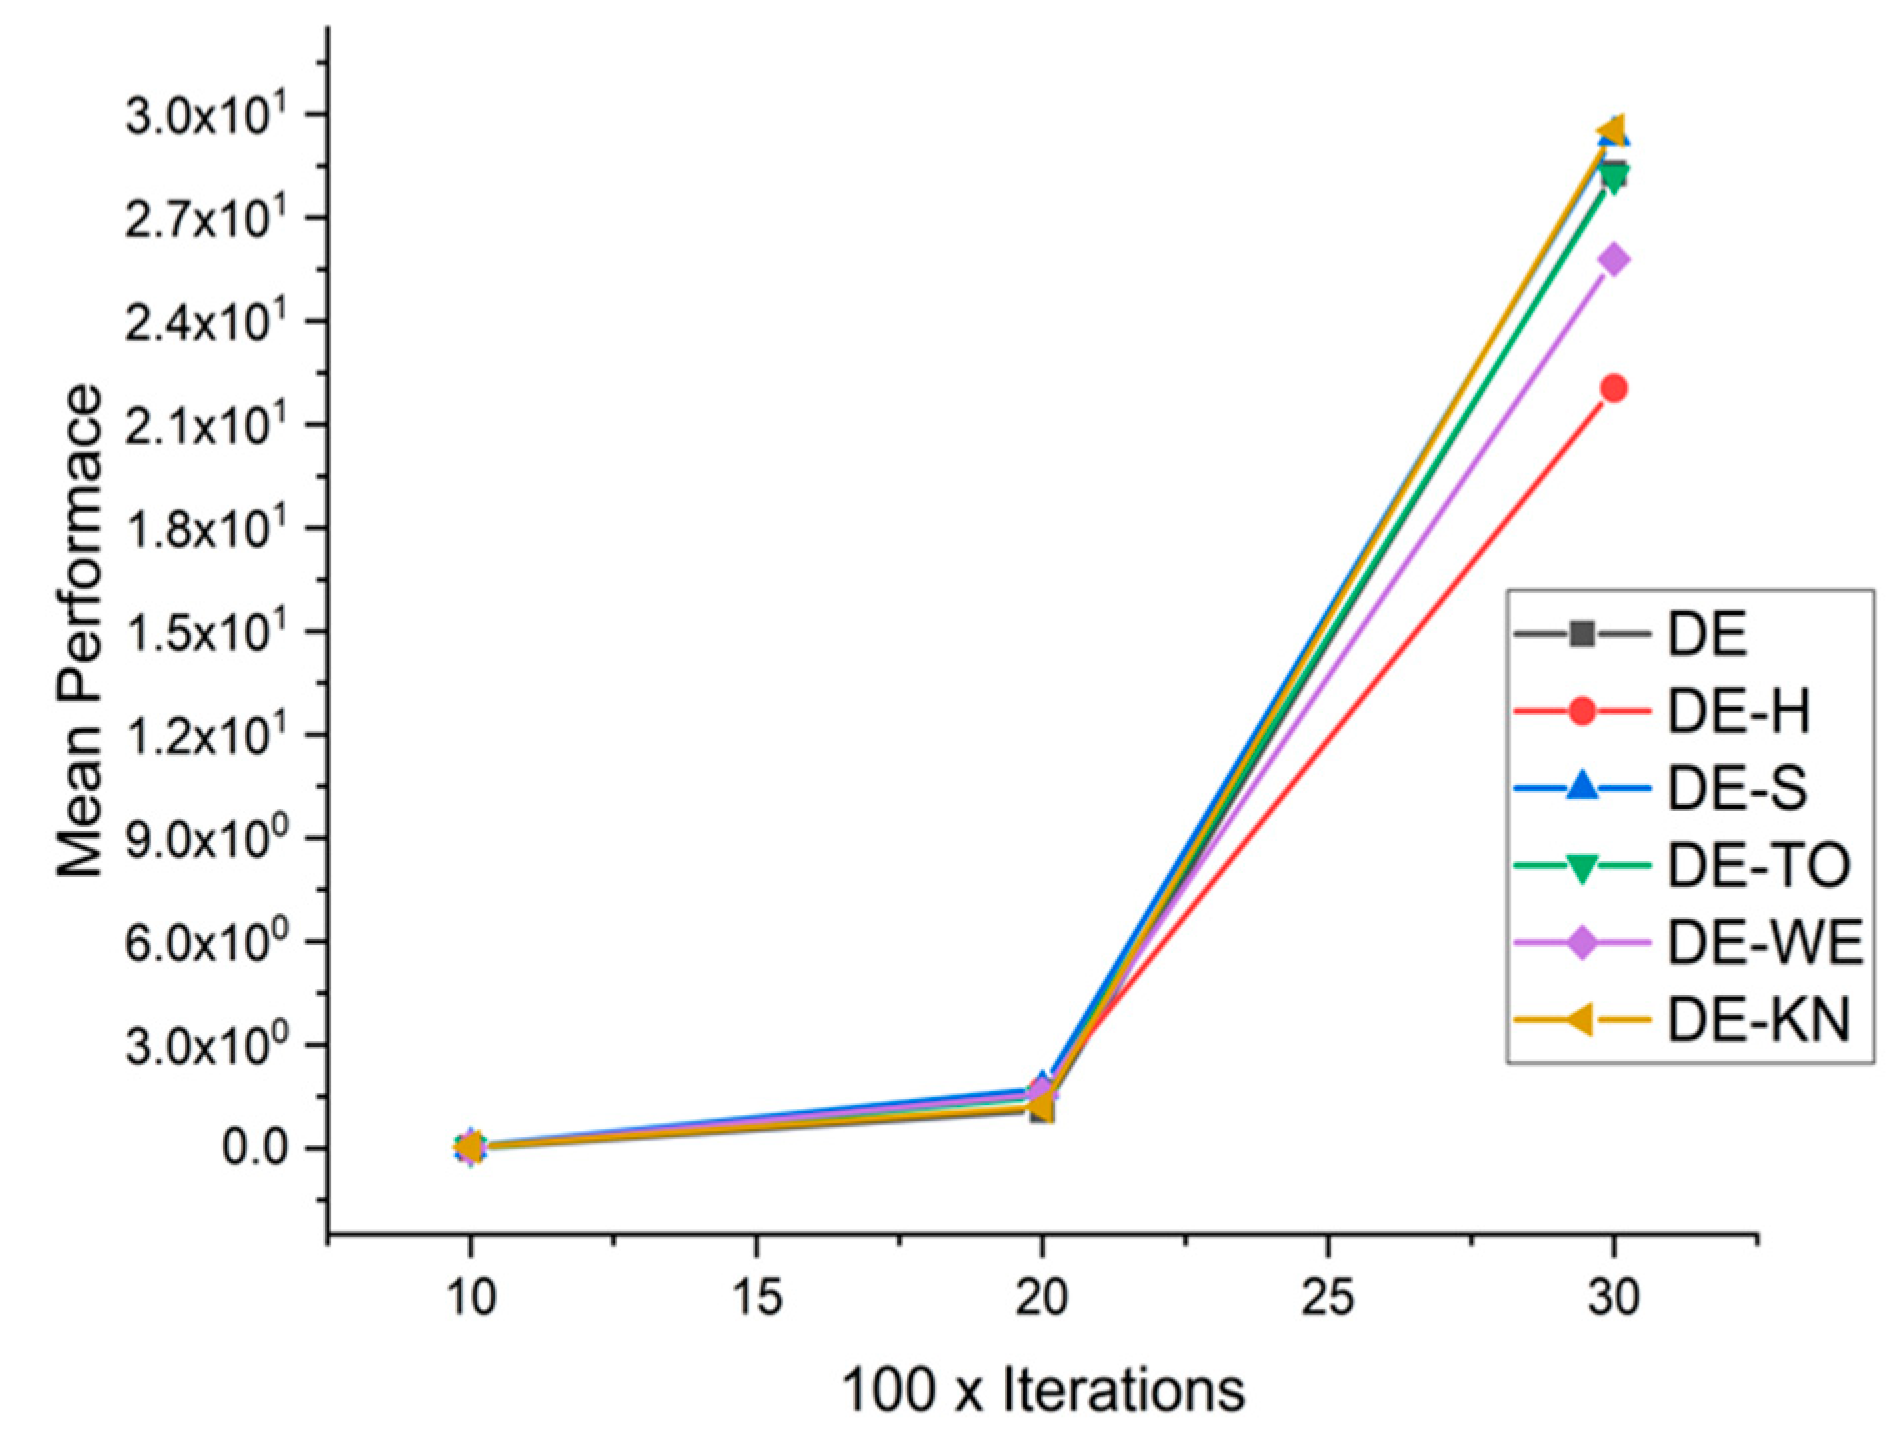
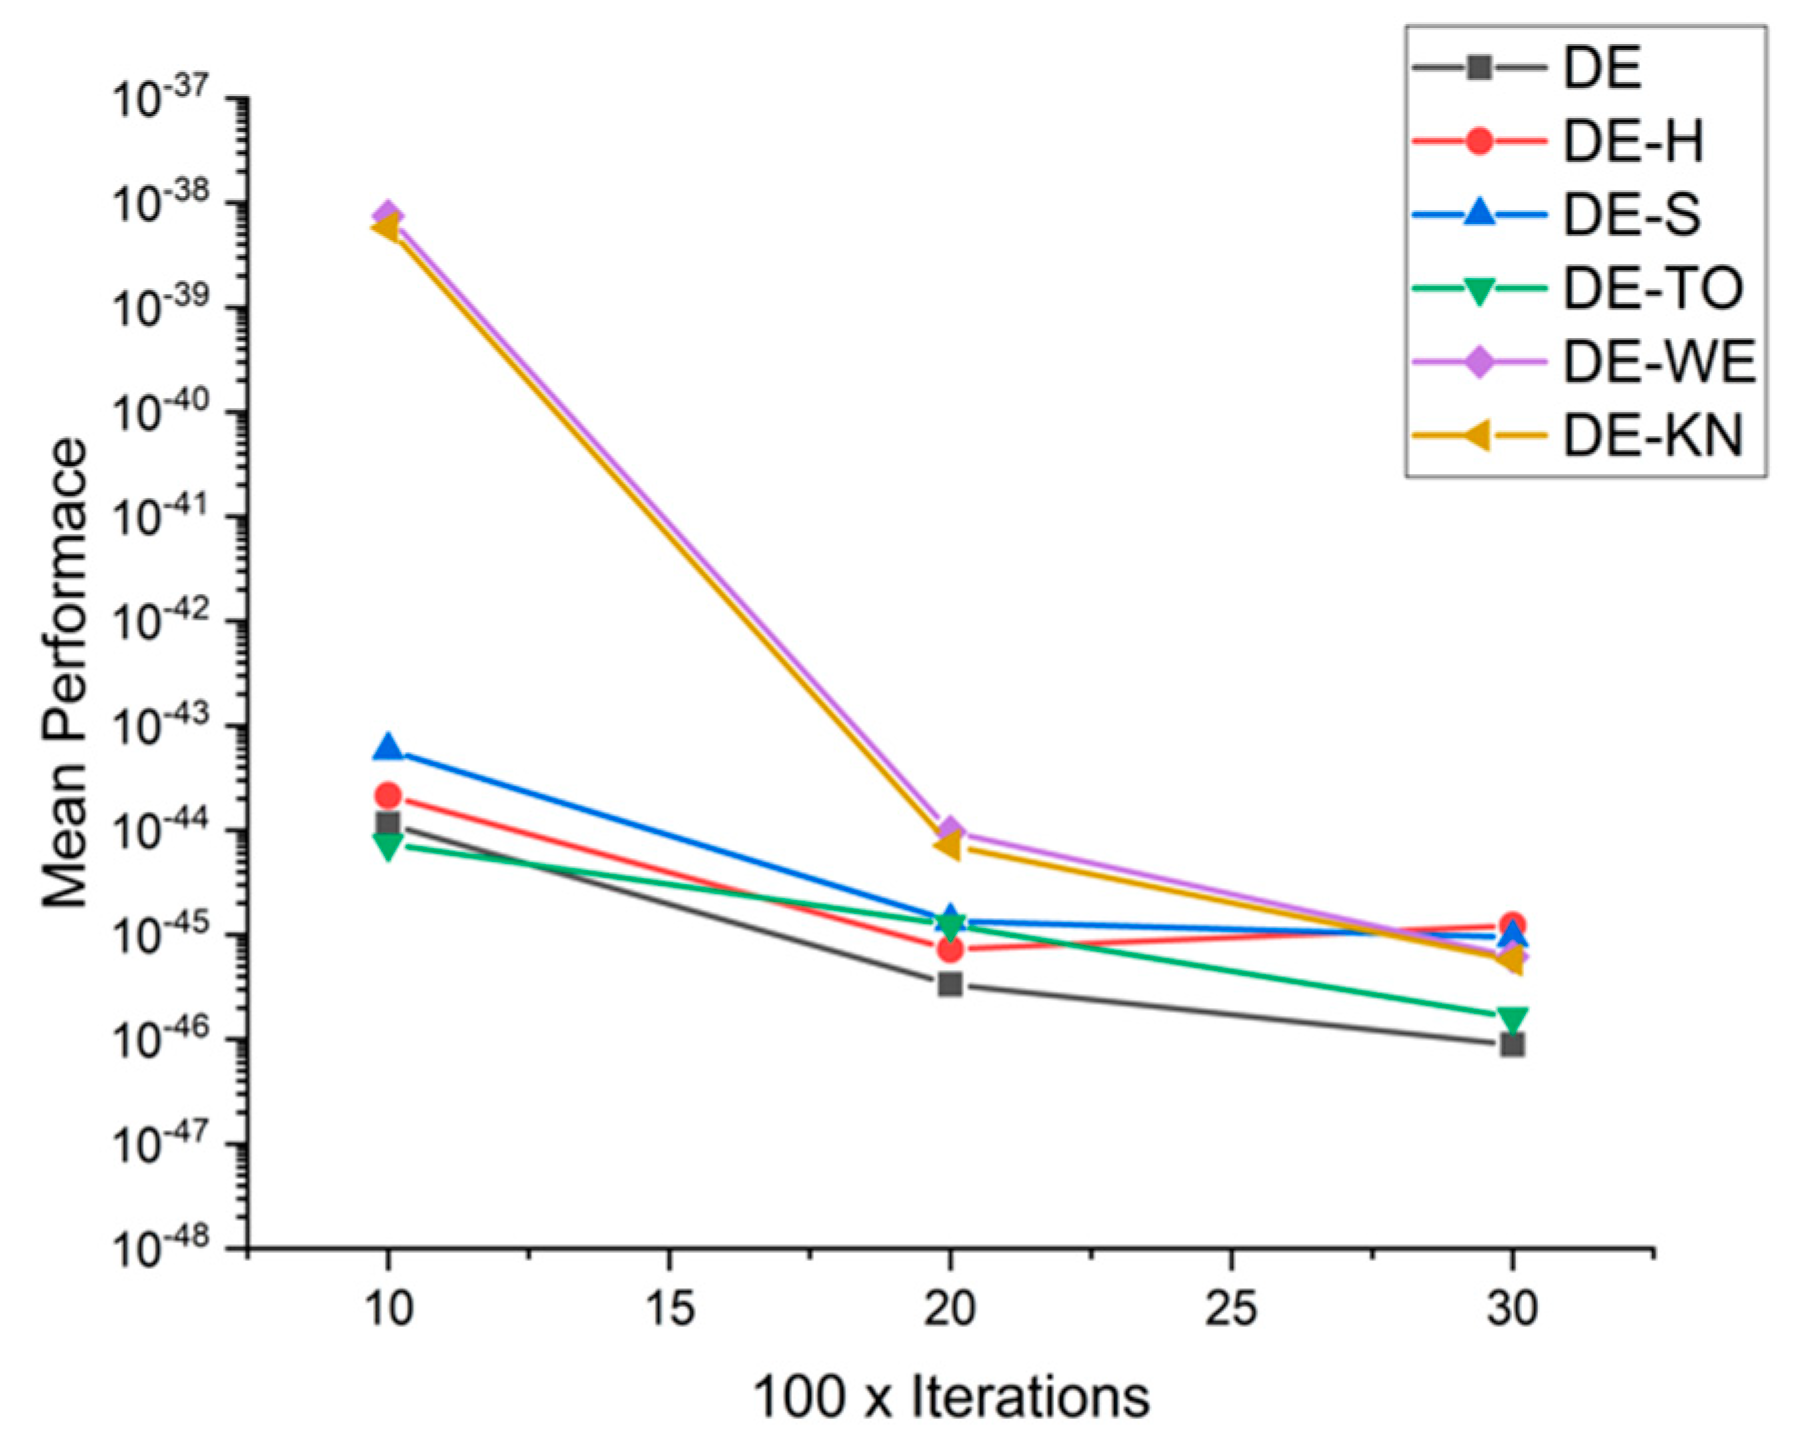
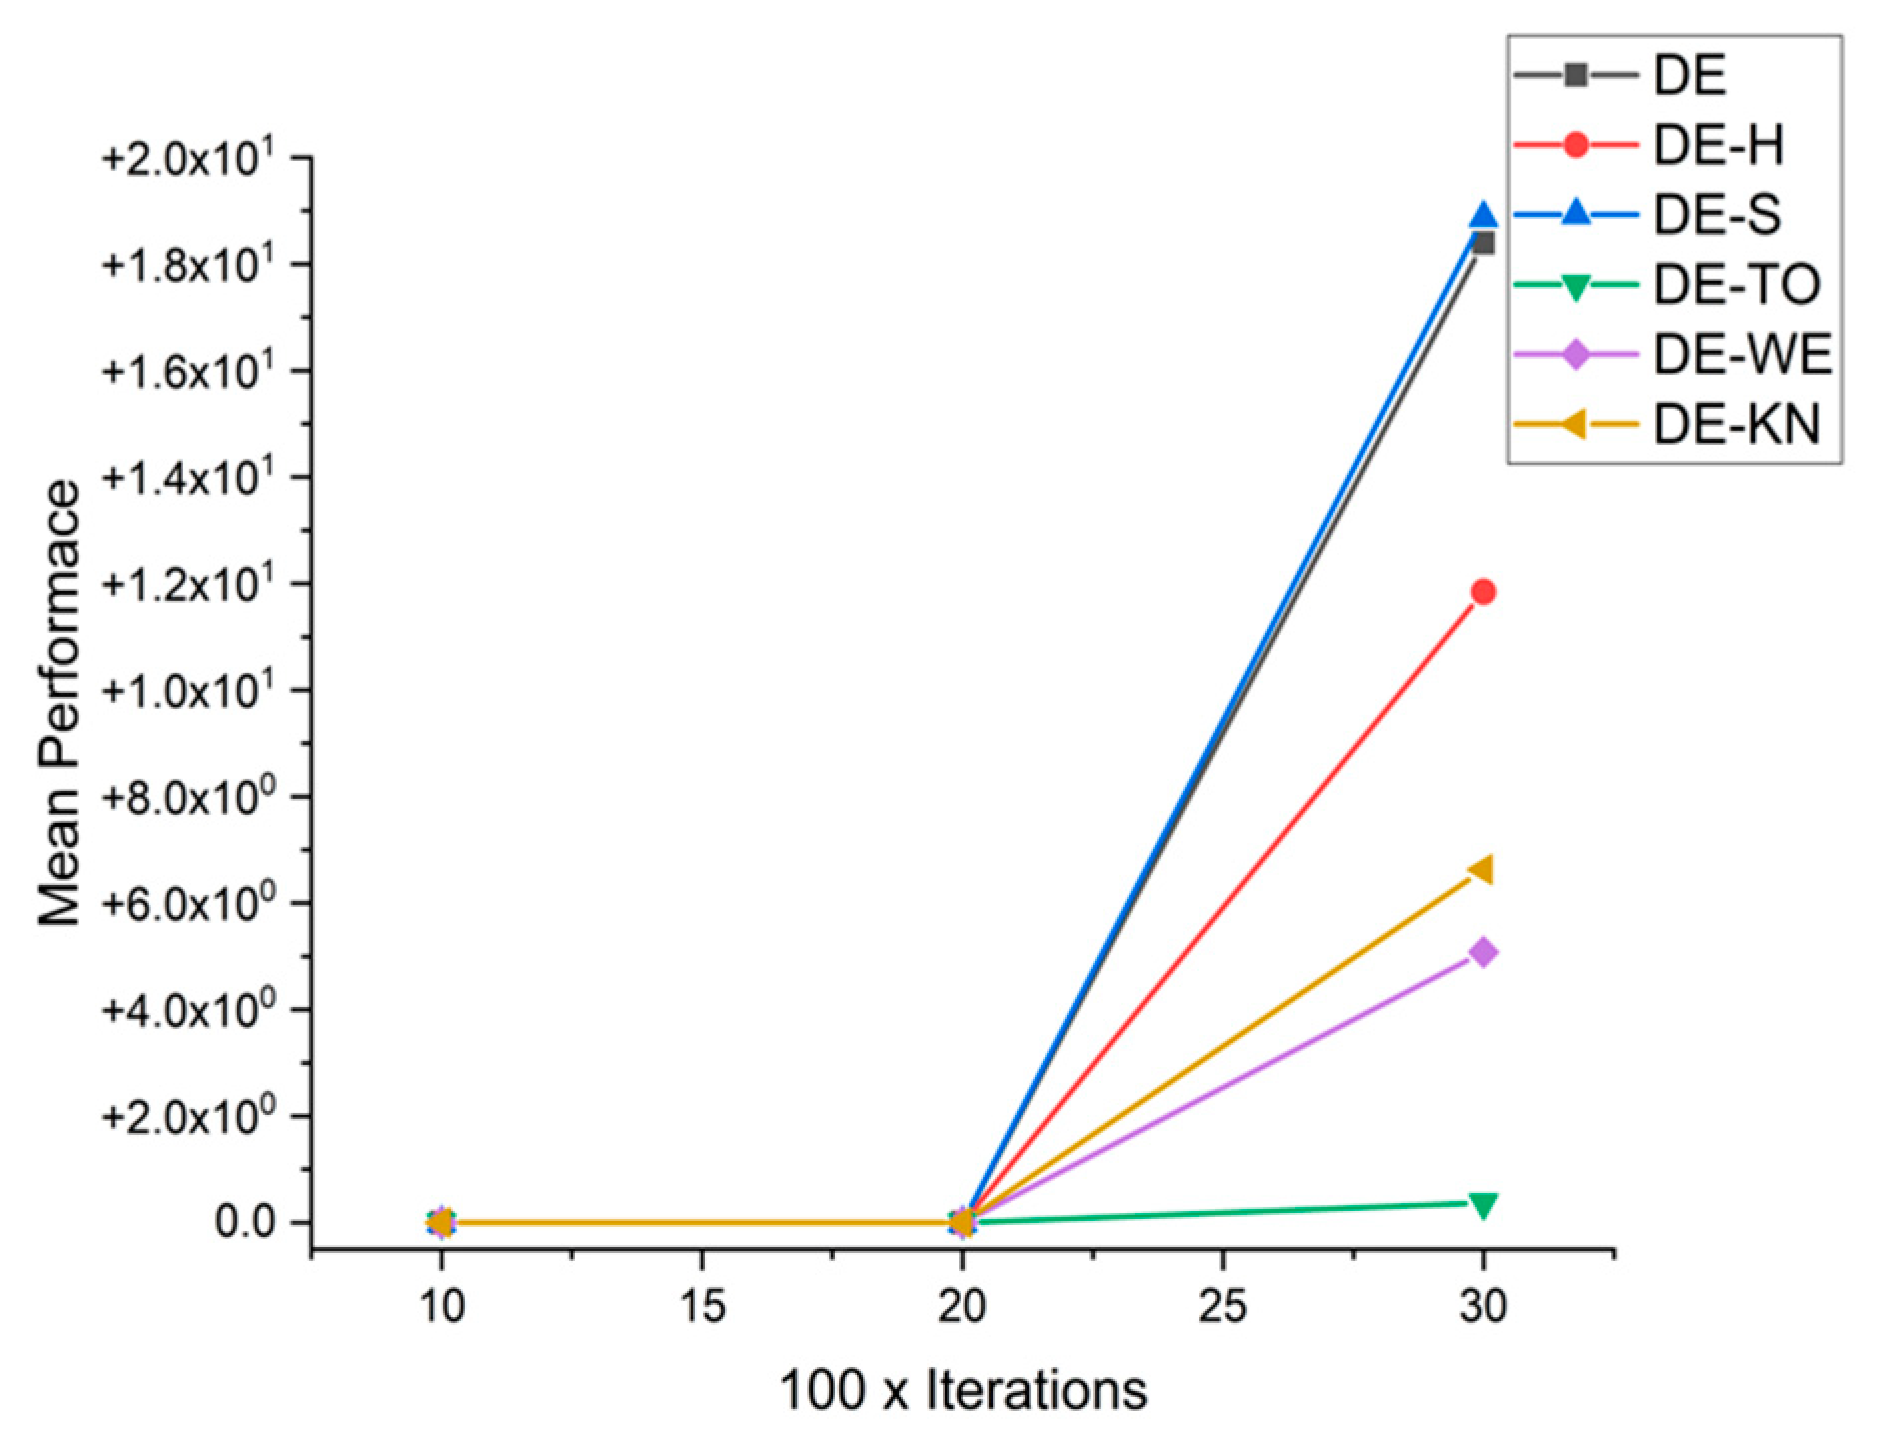
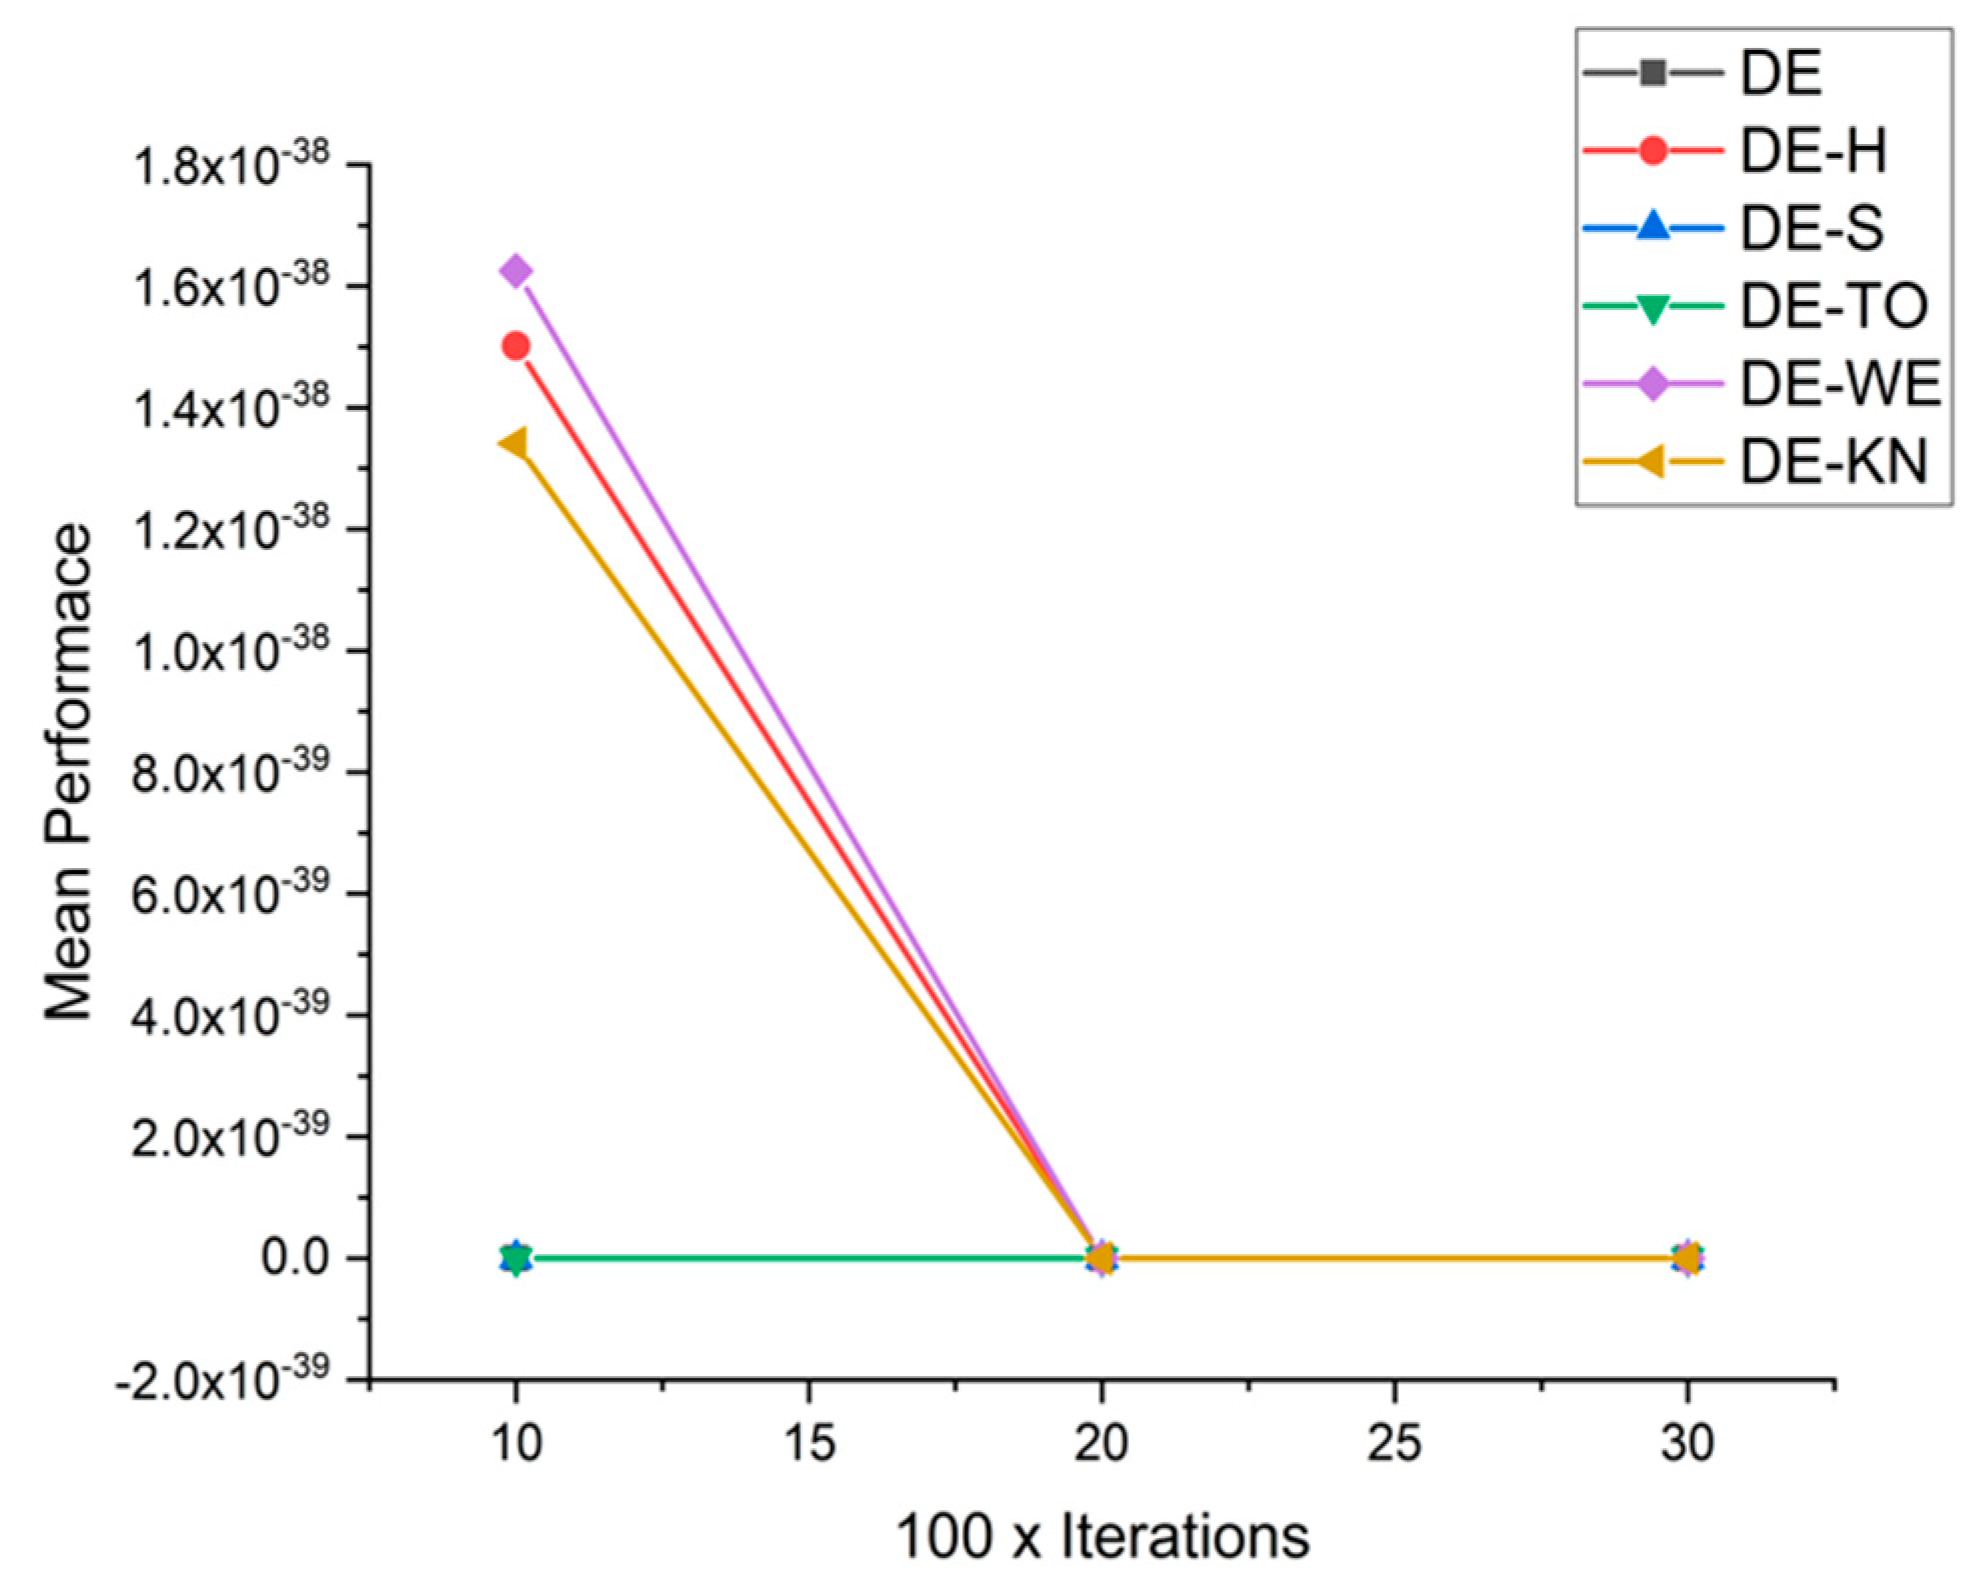
5.5. Results and Graphs on DE Approaches
The experimental simulation results on benchmark functions are shown in Table 6.
Table 6.
Comparative results for all DE-based approaches on 16 standard benchmark functions.
Table 6.
Comparative results for all DE-based approaches on 16 standard benchmark functions.
| Functions | DIM × Iter | DE | DE-H | DE-S | DE-TO | DE-WE | DE-KN |
|---|---|---|---|---|---|---|---|
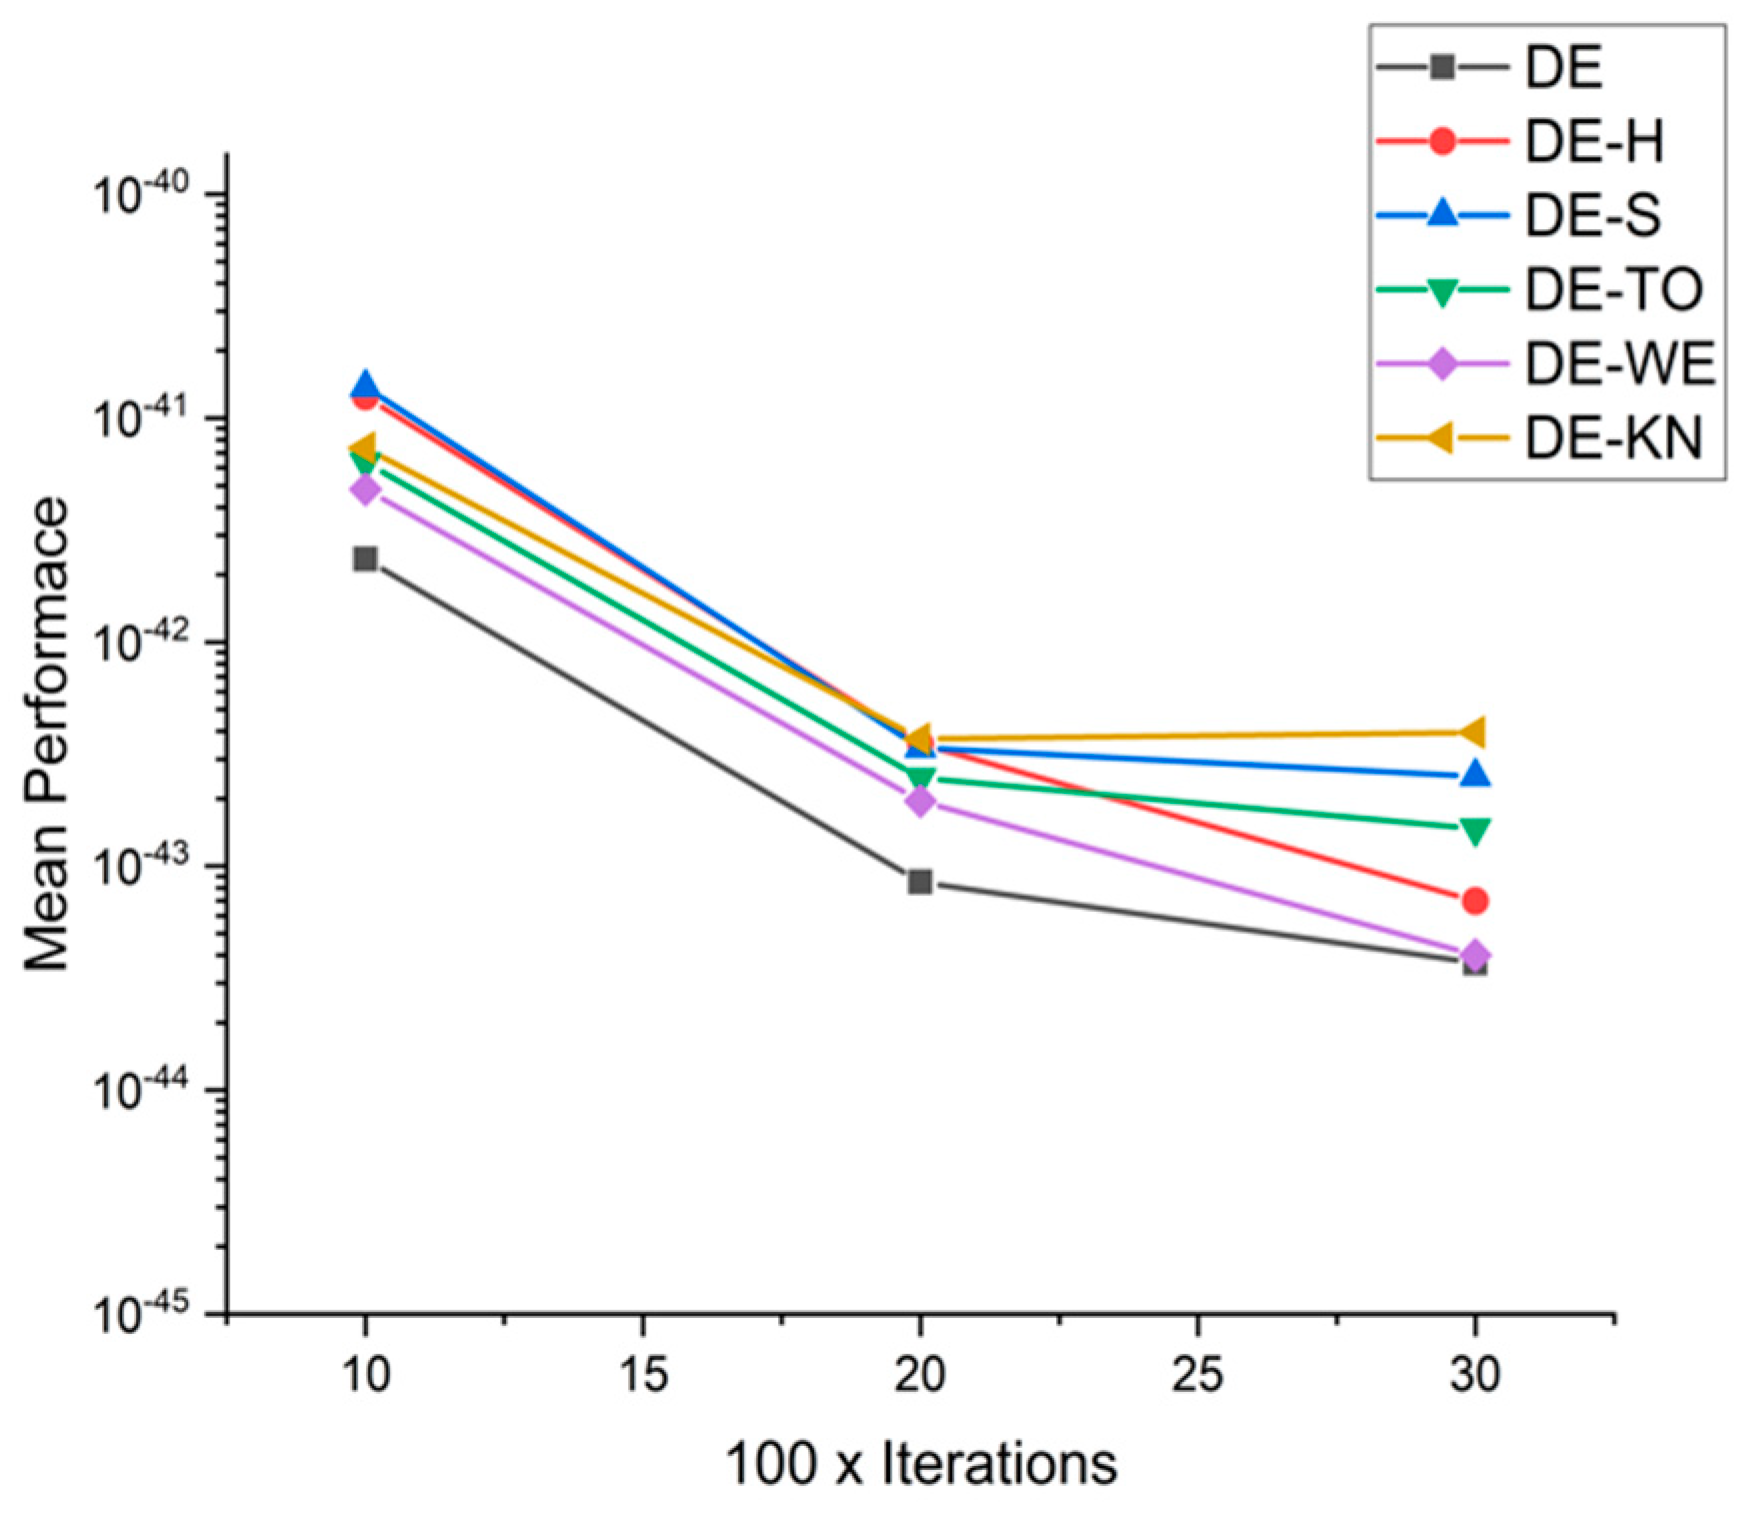
| F1 | 10 × 1000 | 1.1464 × 10−44 | 2.1338 × 10−44 | 5.8561 × 10−44 | 7.4117 × 10−45 | 7.4827 × 10−39 | 5.7658 × 10−39 |
| 20 × 2000 | 3.3550 × 10−46 | 7.2338 × 10−46 | 1.3545 × 10−45 | 1.2426 × 10−45 | 9.6318 × 10−45 | 7.1501 × 10−45 | |
| 30 × 3000 | 8.8946 × 10−47 | 1.2273 × 10−45 | 9.4228 × 10−46 | 1.6213 × 10−46 | 6.2007 × 10−46 | 5.7425 × 10−46 | |
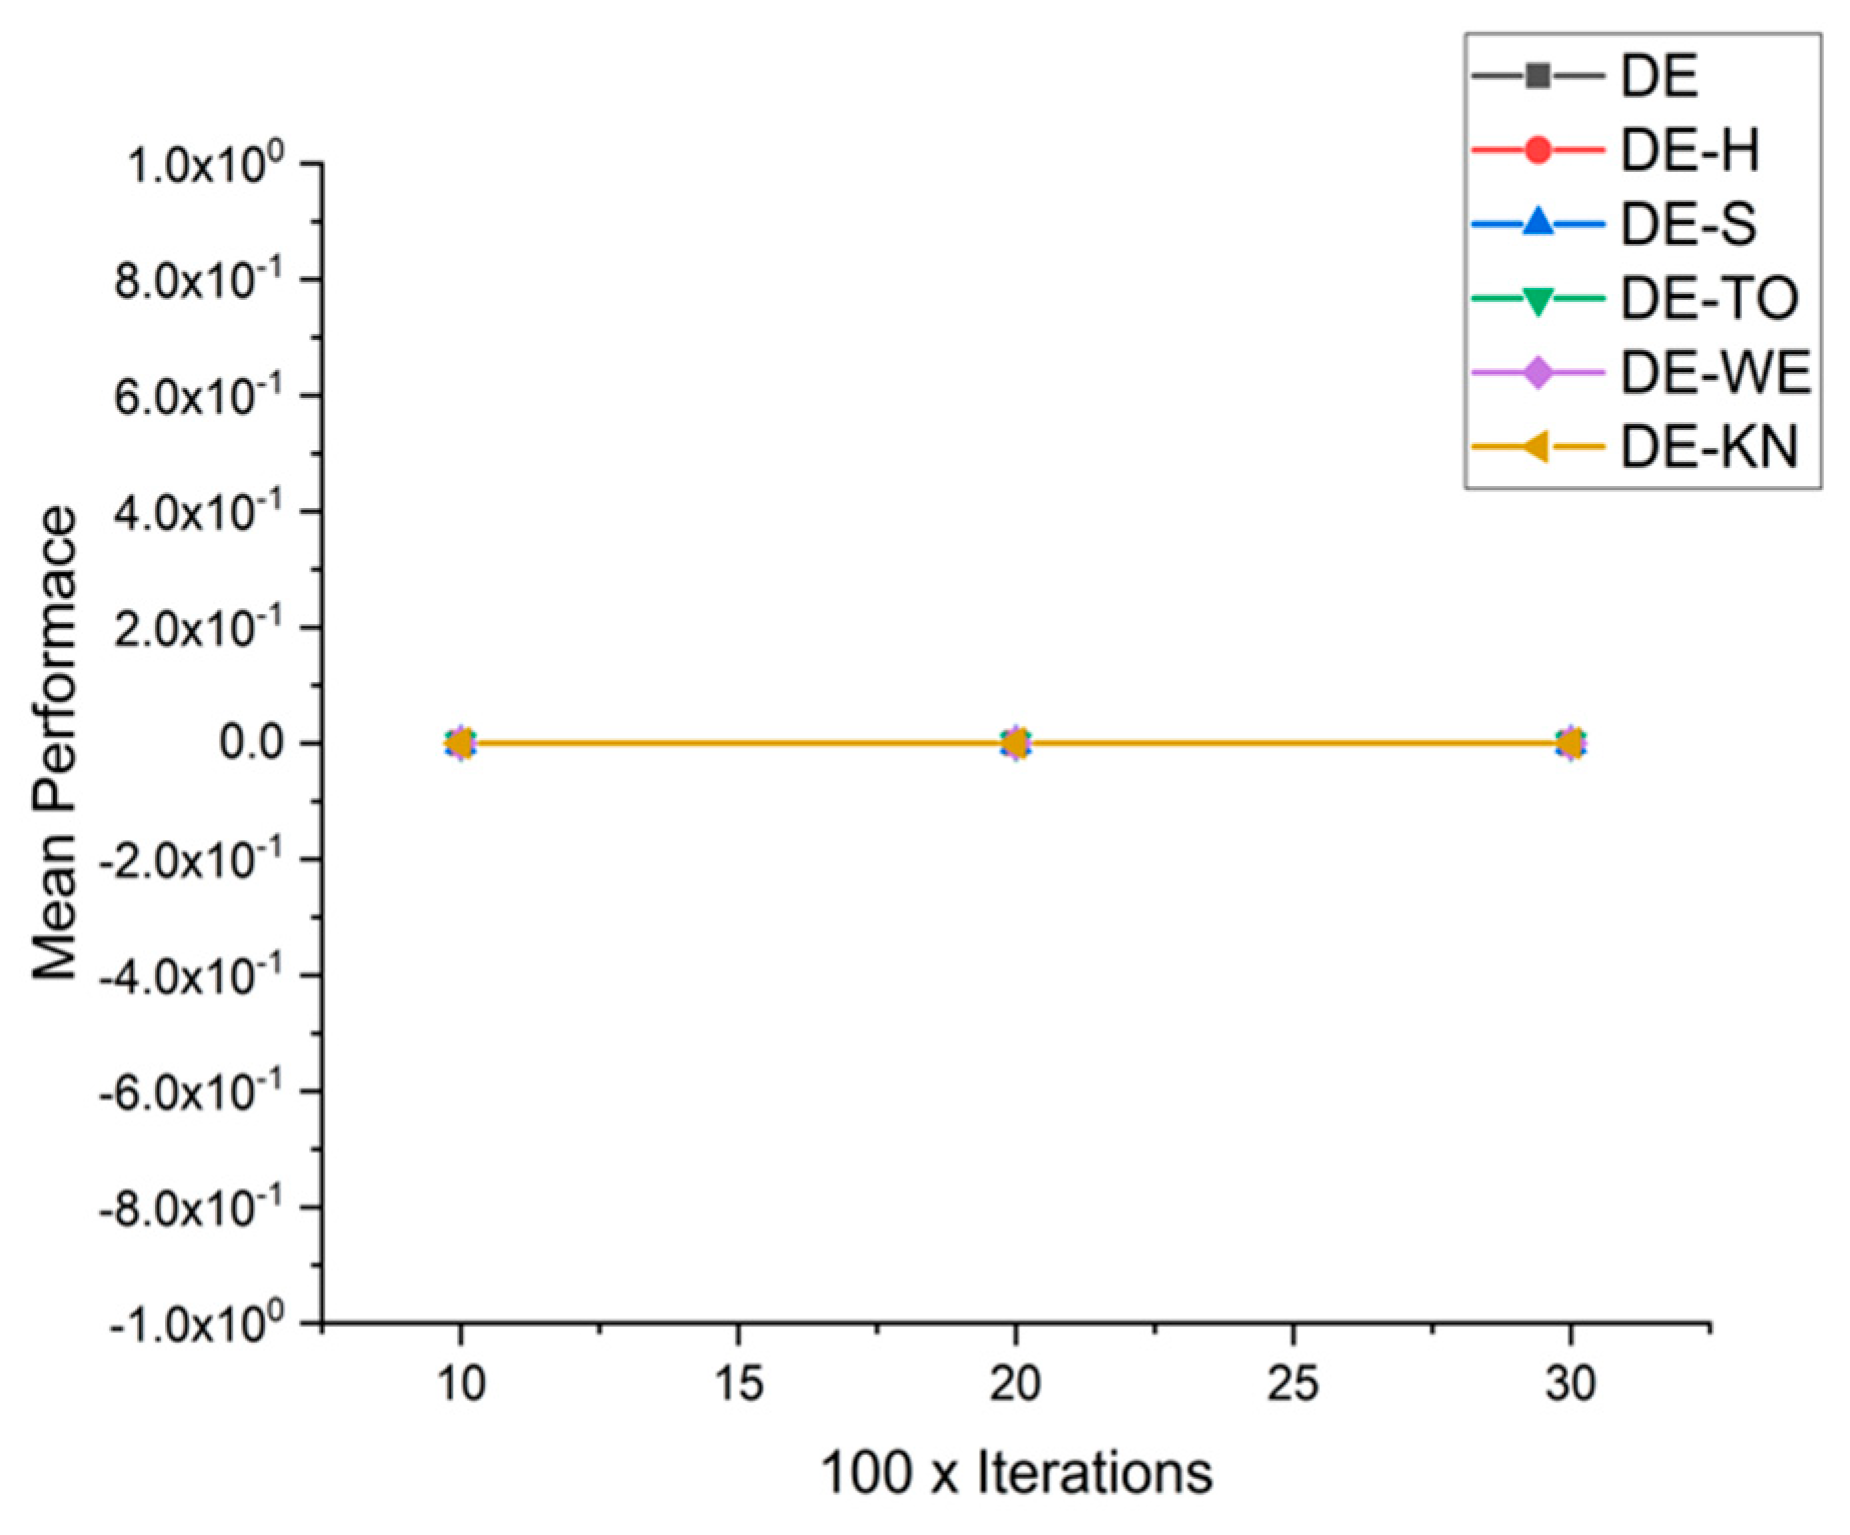
| F2 | 10 × 1000 | 0.0000 × 10+00 | 0.0000 × 10+00 | 0.0000 × 10+00 | 0.0000 × 10+00 | 0.0000 × 10+00 | 0.0000 × 10+00 |
| 20 × 2000 | 0.0000 × 10+00 | 0.0000 × 10+00 | 0.0000 × 10+00 | 0.0000 × 10+00 | 0.0000 × 10+00 | 0.0000 × 10+00 | |
| 30 × 3000 | 1.8392 × 10+01 | 1.1846 × 10+01 | 1.8871 × 10+01 | 3.7132 × 10−01 | 5.0821 × 10+00 | 6.6313 × 10+00 | |
| F3 | 10 × 1000 | 5.00325 × 10−44 | 1.5019 × 10−38 | 9.3956 × 10−44 | 4.7807 × 10−44 | 1.6251 × 10−38 | 1.3411 × 10−38 |
| 20 × 2000 | 2.56987 × 10−45 | 4.1485 × 10−44 | 1.5339 × 10−44 | 3.0262 × 10−45 | 9.5984 × 10−44 | 1.3606 × 10−43 | |
| 30 × 3000 | 1.01692 × 10−45 | 2.7349 × 10−45 | 4.0581 × 10−45 | 4.5726 × 10−45 | 4.5686 × 10−45 | 5.4659 × 10−45 | |
| F4 | 10 × 1000 | 5.81825 × 10−42 | 3.0950 × 10−36 | 2.2300 × 10−41 | 1.6903 × 10−41 | 1.1331 × 10−36 | 3.8869 × 10−36 |
| 20 × 2000 | 2.70747 × 10−43 | 1.0658 × 10−41 | 1.6730 × 10−42 | 1.3490 × 10−42 | 1.3094 × 10−41 | 6.0053 × 10−42 | |
| 30 × 3000 | 2.99887 × 10−43 | 1.4032 × 10−42 | 4.4442 × 10−42 | 5.9186 × 10−43 | 4.6922 × 10−43 | 1.4829 × 10−42 | |
| F5 | 10 × 1000 | 1.65318 × 10−43 | 4.7939 × 10−38 | 7.0329 × 10−43 | 4.8106 × 10−43 | 4.3219 × 10−38 | 3.5770 × 10−38 |
| 20 × 2000 | 1.39082 × 10−44 | 3.6325 × 10−43 | 4.2191 × 10−44 | 2.7448 × 10−44 | 5.8557 × 10−43 | 1.4008 × 10−43 | |
| 30 × 3000 | 6.07162 × 10−45 | 1.7557 × 10−44 | 1.6295 × 10−44 | 2.0582 × 10−44 | 8.6773 × 10−45 | 4.2285 × 10−44 | |
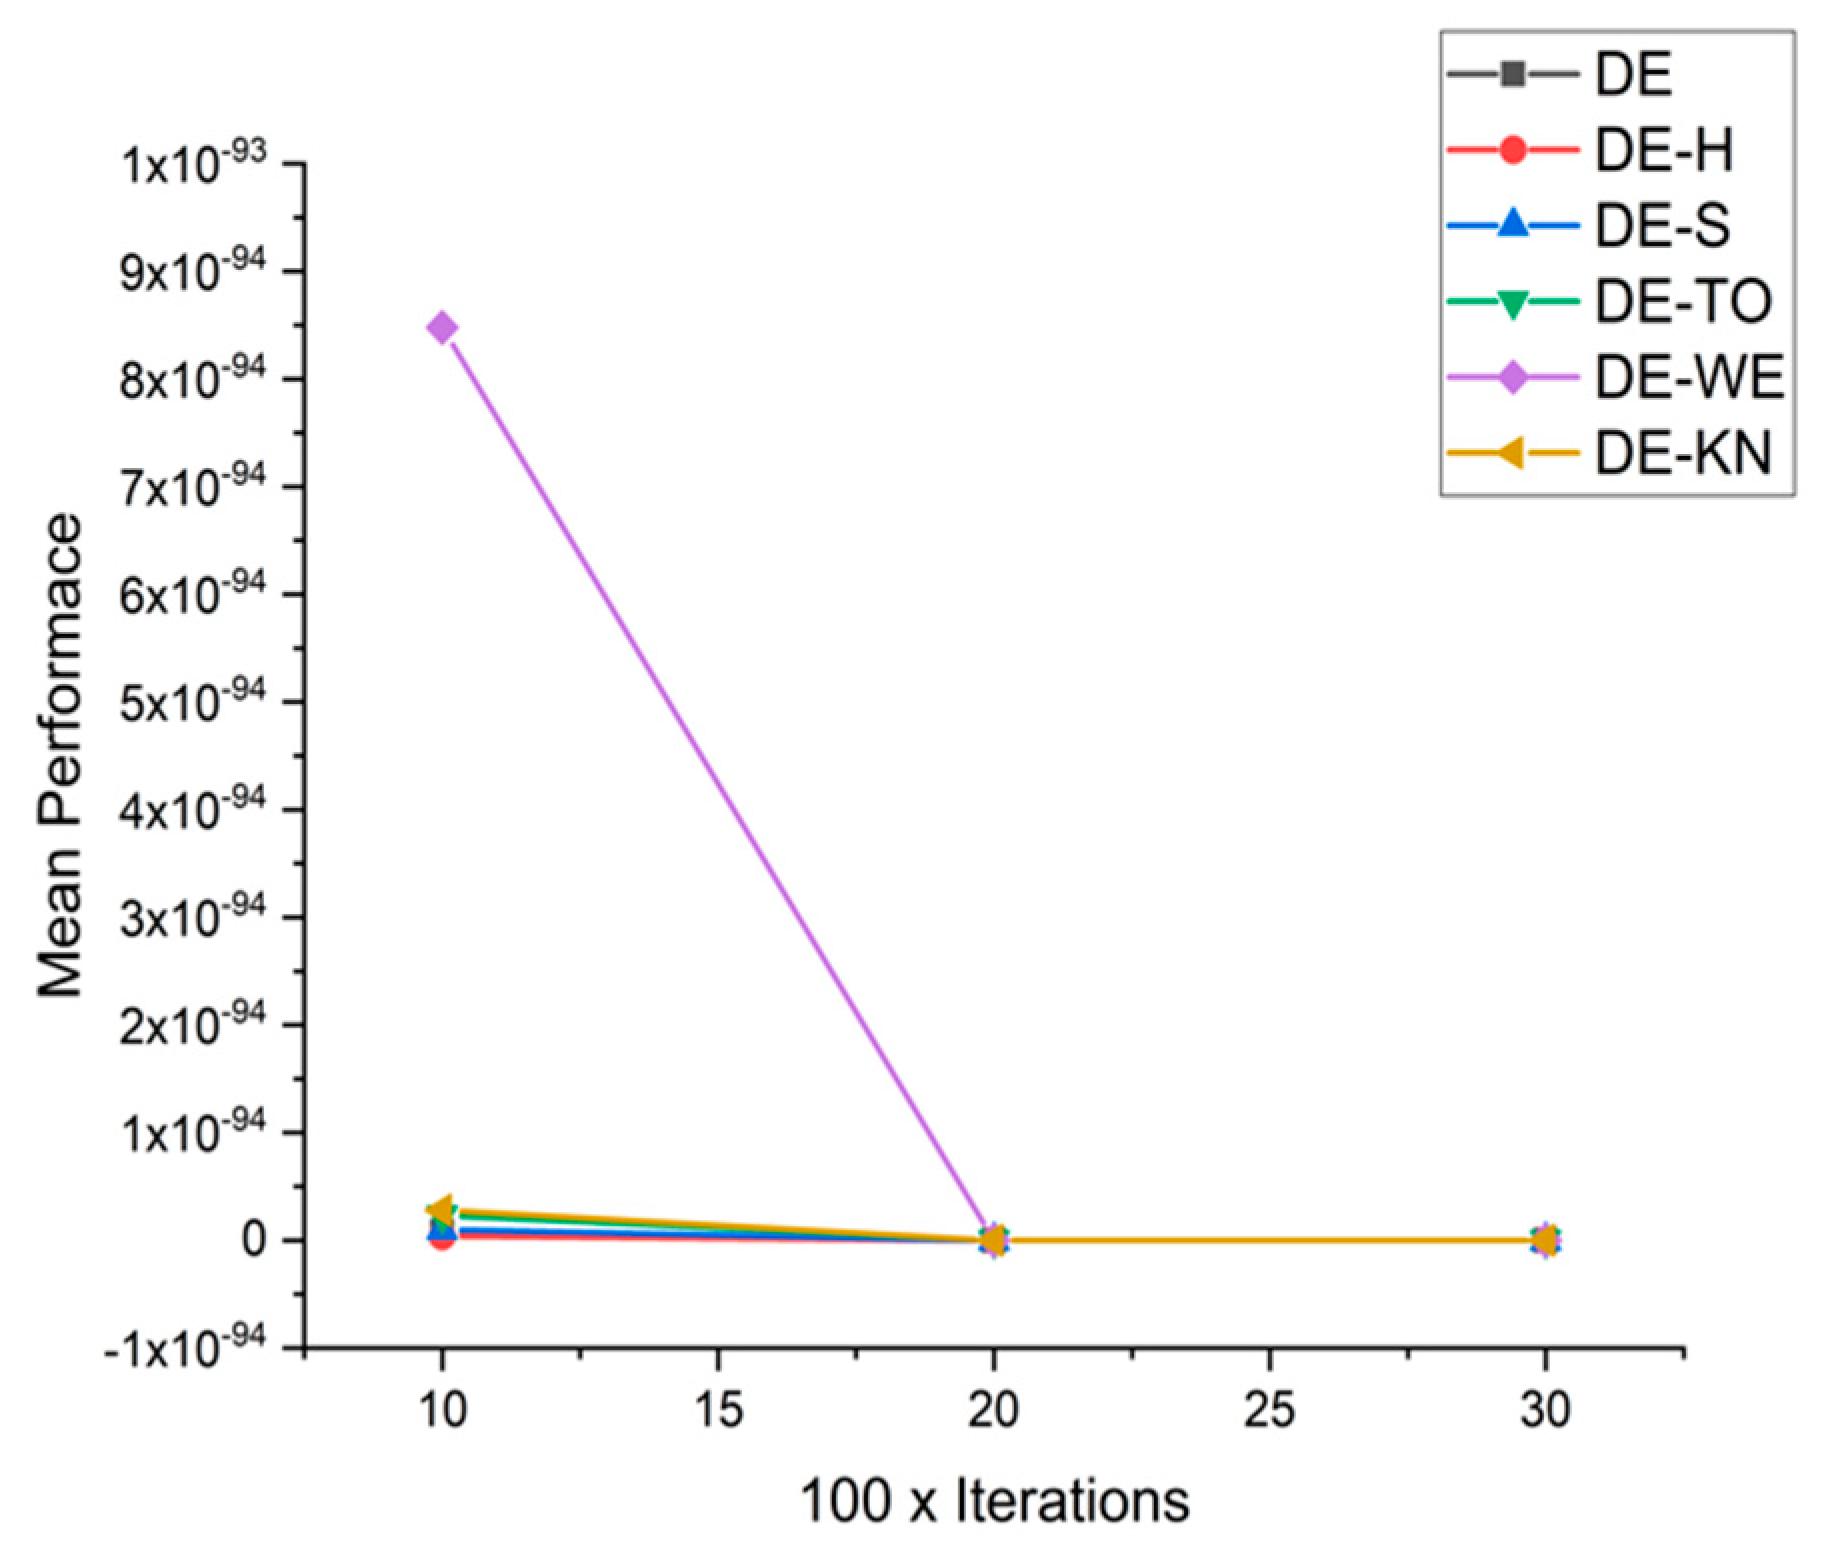
| F6 | 10 × 1000 | 7.8201 × 10−96 | 3.8819 × 10−96 | 9.7956 × 10−96 | 2.3292 × 10−95 | 8.4774 × 10−94 | 2.8037 × 10−95 |
| 20 × 2000 | 1.6847 × 10−125 | 8.6880 × 10−124 | 5.9005 × 10−122 | 8.7800 × 10−123 | 3.7438 × 10−124 | 1.3947 × 10−124 | |
| 30 × 3000 | 2.4533 × 10−140 | 1.5487 × 10−139 | 5.7211 × 10−138 | 4.4492 × 10−137 | 6.5749 × 10−140 | 3.4442 × 10−137 | |
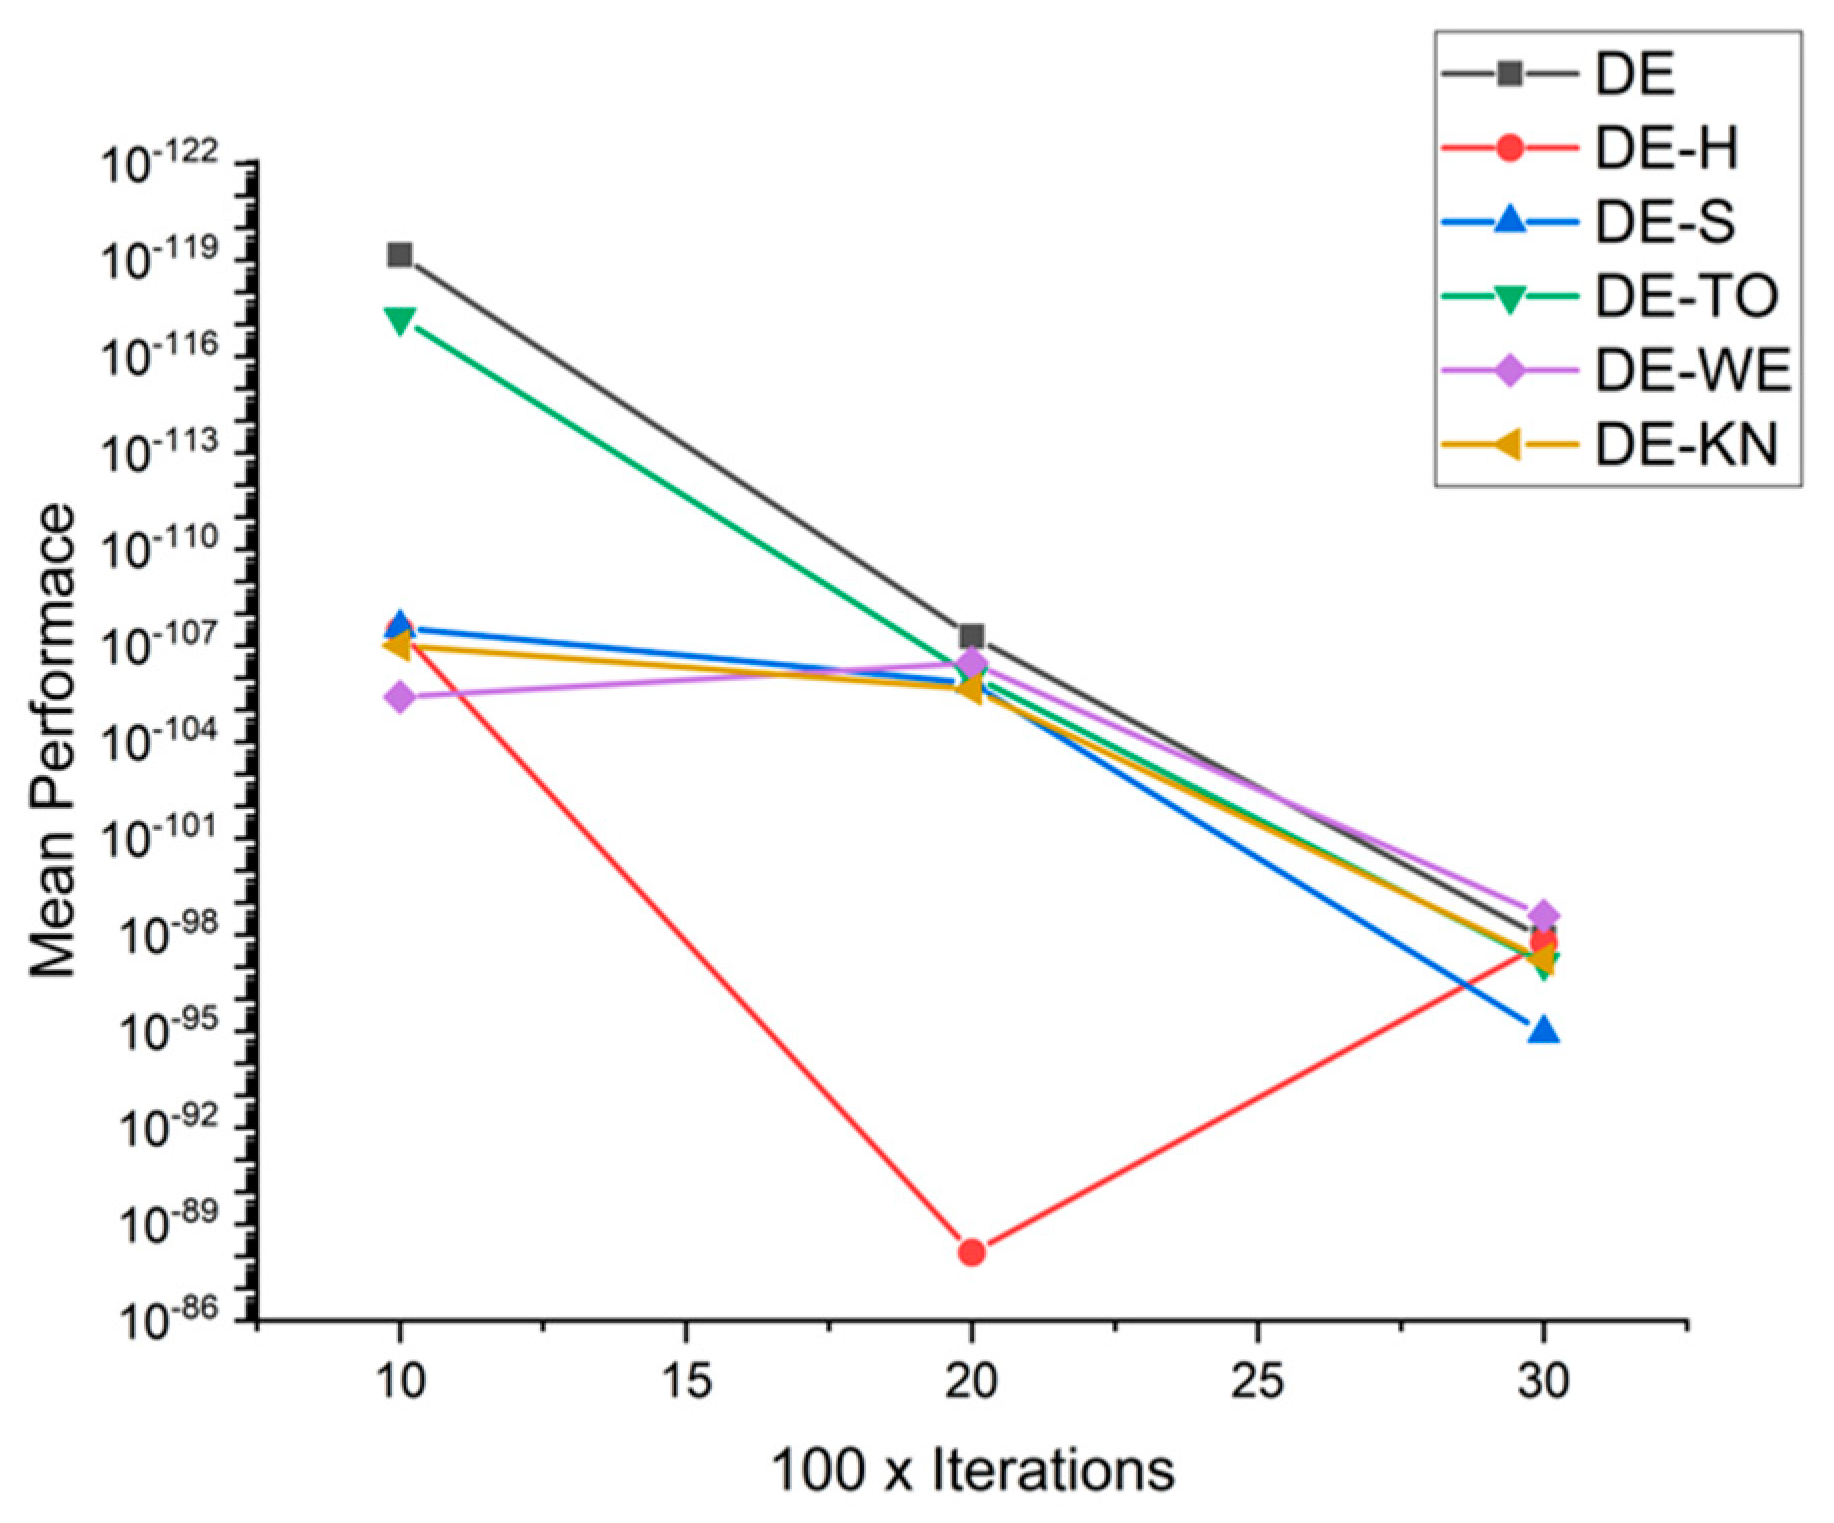
| F7 | 10 × 1000 | 8.0217 × 10−75 | 7.3243 × 10−67 | 5.7807 × 10−66 | 1.0243 × 10−73 | 1.9035 × 10−67 | 1.4359 × 10−65 |
| 20 × 2000 | 4.0682 × 10−71 | 1.5037 × 10−70 | 1.5747 × 10−69 | 1.0623 × 10−70 | 5.5546 × 10−70 | 2.3507 × 10−70 | |
| 30 × 3000 | 8.5895 × 10−68 | 6.6009 × 10−68 | 3.3919 × 10−67 | 2.6036 × 10−67 | 1.1587 × 10−67 | 2.1901 × 10−67 | |
| F8 | 10 × 1000 | 7.0221 × 10−120 | 3.4271 × 10−108 | 2.7718 × 10−108 | 6.3092 × 10−118 | 3.9423 × 10−106 | 9.9394 × 10−108 |
| 20 × 2000 | 5.2096 × 10−108 | 7.7158 × 10−89 | 1.4732 × 10−106 | 8.8720 × 10−107 | 3.4490 × 10−107 | 2.2539 × 10−106 | |
| 30 × 3000 | 1.2538 × 10−98 | 1.8071 × 10−98 | 1.1085 × 10−95 | 7.2462 × 10−98 | 2.5375 × 10−99 | 5.8040 × 10−98 | |
| F9 | 10 × 1000 | 0.0000 × 10+00 | 0.0000 × 10+00 | 0.0000 × 10+00 | 0.0000 × 10+00 | 0.0000 × 10+00 | 0.0000 × 10+00 |
| 20 × 2000 | 0.0000 × 10+00 | 0.0000 × 10+00 | 0.0000 × 10+00 | 0.0000 × 10+00 | 0.0000 × 10+00 | 0.0000 × 10+00 | |
| 30 × 3000 | 0.0000 × 10+00 | 0.0000 × 10+00 | 0.0000 × 10+00 | 0.0000 × 10+00 | 0.0000 × 10+00 | 0.0000 × 10+00 | |
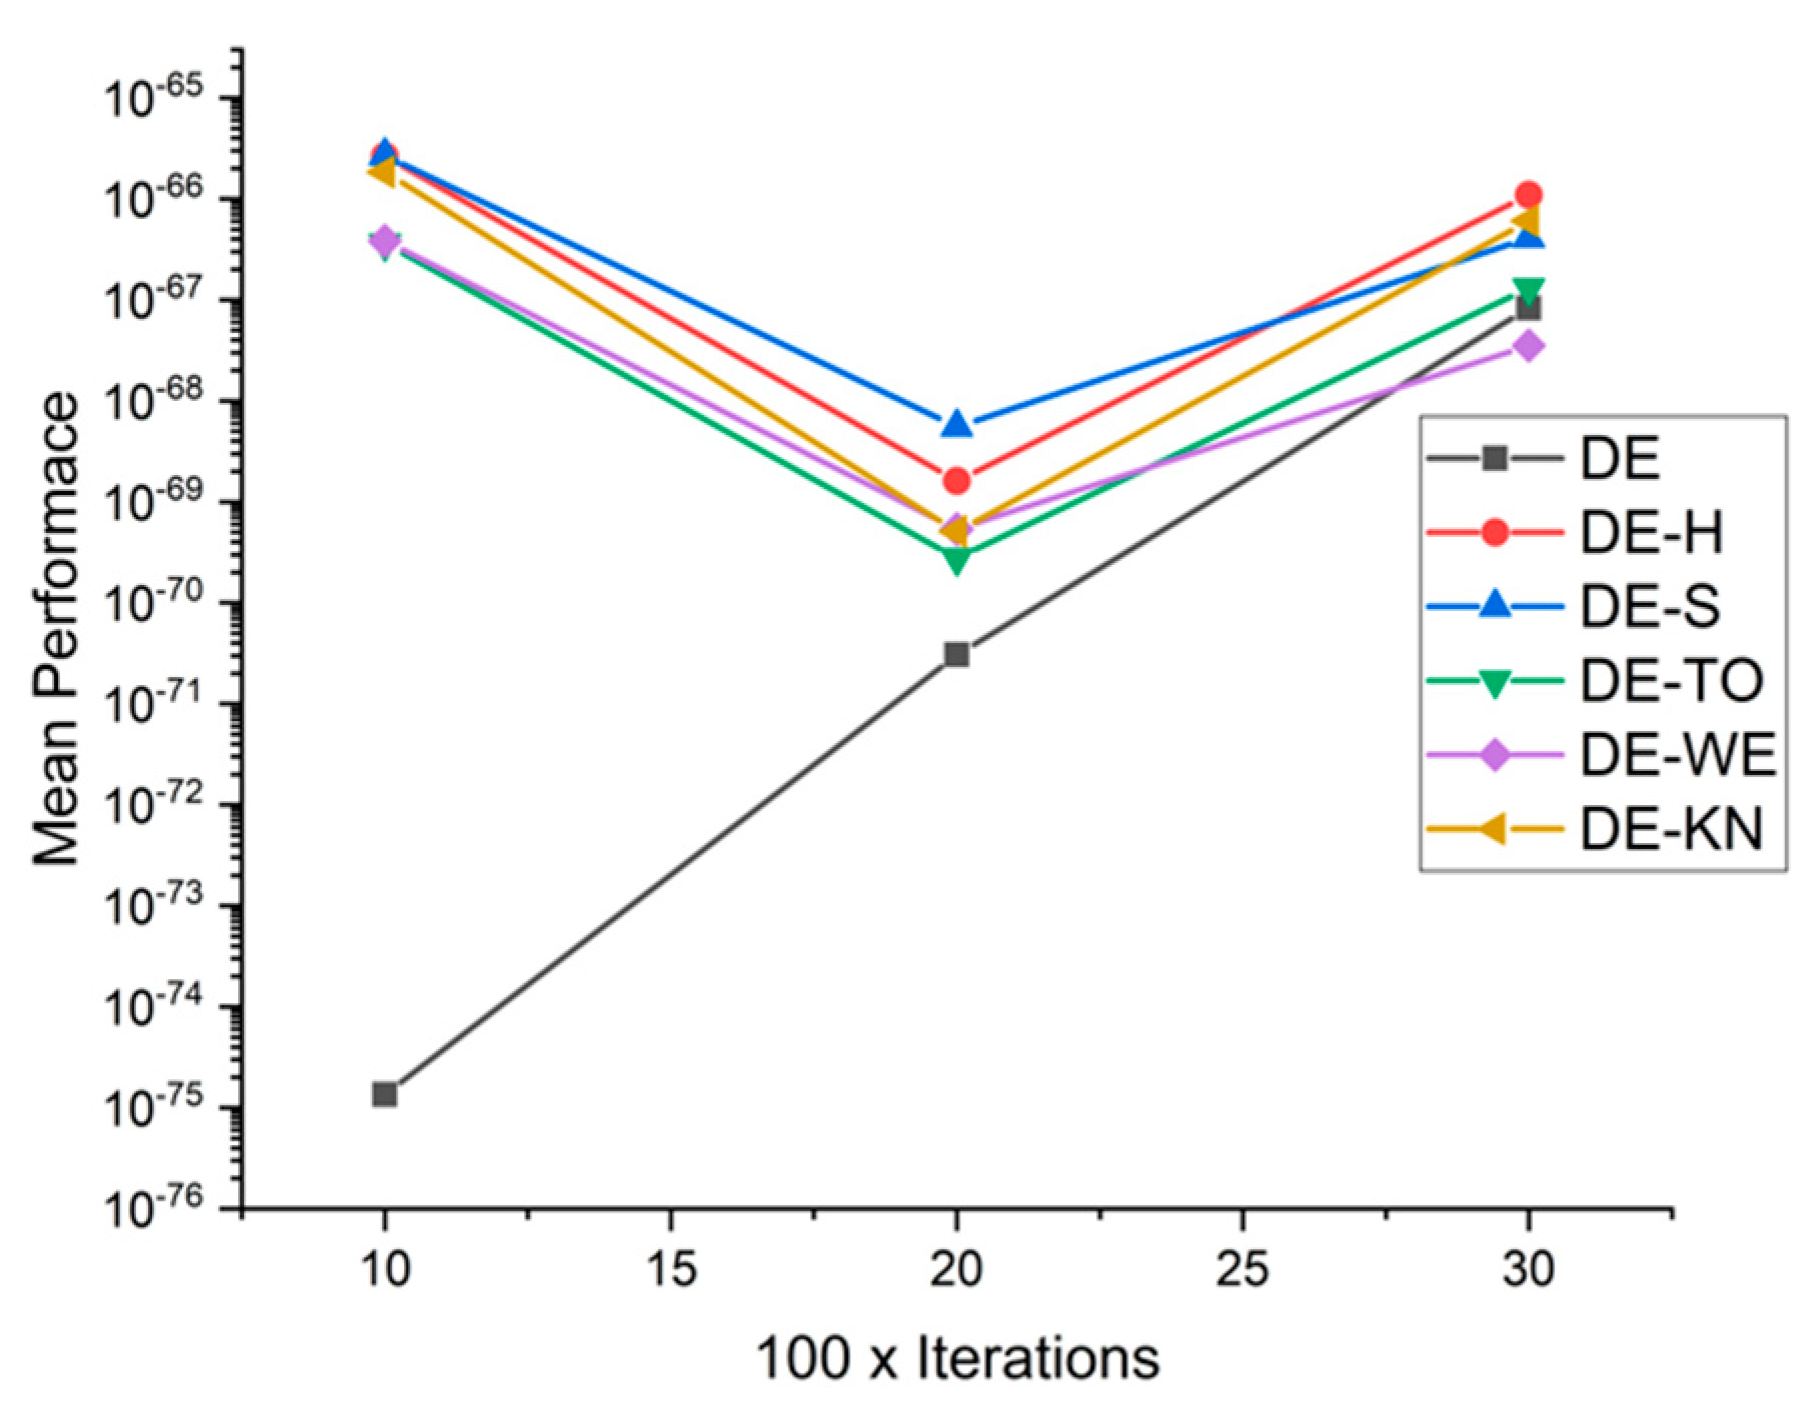
| F10 | 10 × 1000 | 1.3459 × 10−75 | 2.6493 × 10−66 | 2.6884 × 10−66 | 3.6168 × 10−67 | 3.8397 × 10−67 | 1.8408 × 10−66 |
| 20 × 2000 | 3.0478 × 10−71 | 1.6106 × 10−69 | 5.5253 × 10−69 | 2.7746 × 10−70 | 5.3662 × 10−70 | 5.0931 × 10−70 | |
| 30 × 3000 | 8.2514 × 10−68 | 1.0937 × 10−66 | 4.1120 × 10−67 | 1.3055 × 10−67 | 3.5397 × 10−68 | 6.0736 × 10−67 | |
| F11 | 10 × 1000 | 2.3417 × 10−42 | 1.2483 × 10−41 | 1.3726 × 10−41 | 6.3337 × 10−42 | 4.8161 × 10−42 | 7.3464 × 10−42 |
| 20 × 2000 | 8.4769 × 10−44 | 3.5140 × 10−43 | 3.3777 × 10−43 | 2.4721 × 10−43 | 1.9553 × 10−43 | 3.6961 × 10−43 | |
| 30 × 3000 | 3.6888 × 10−44 | 6.9938 × 10−44 | 2.5123 × 10−43 | 1.4710 × 10−43 | 4.0019 × 10−44 | 3.9503 × 10−43 | |
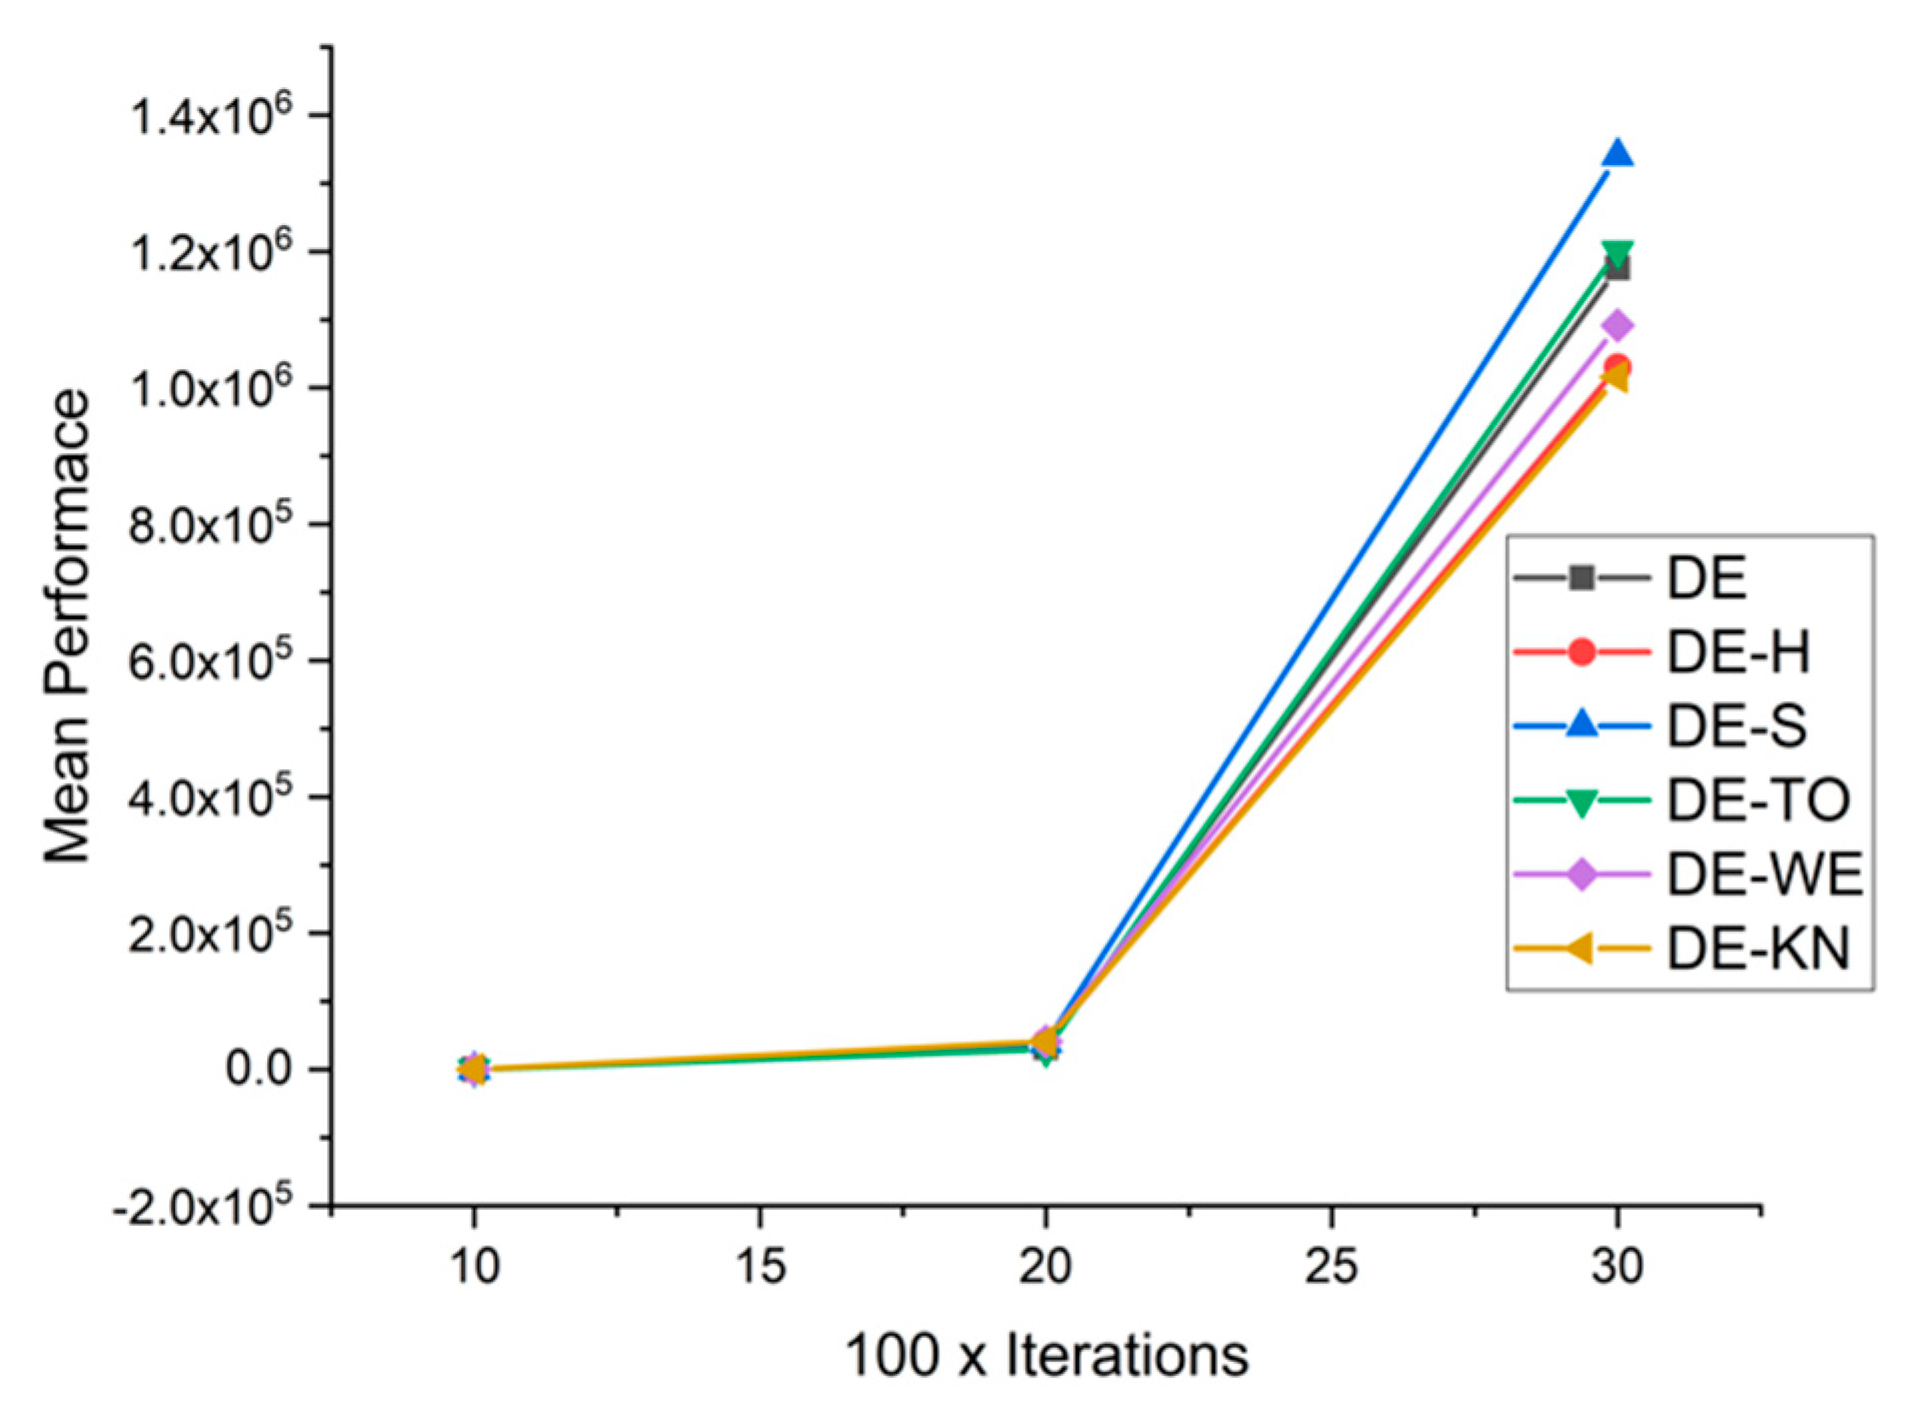
| F12 | 10 × 1000 | 2.3304 × 10+00 | 4.4354 × 10+00 | 3.4520 × 10+00 | 5.1229 × 10+00 | 3.8782 × 10+00 | 2.7840 × 10+00 |
| 20 × 2000 | 3.1768 × 10+04 | 3.9596 × 10+04 | 3.8814 × 10+04 | 2.9488 × 10+04 | 4.1181 × 10+04 | 4.0914 × 10+04 | |
| 30 × 3000 | 1.1760 × 10+06 | 1.0300 × 10+06 | 1.3402 × 10+06 | 1.2008 × 10+06 | 1.0916 × 10+06 | 1.0160 × 10+06 | |
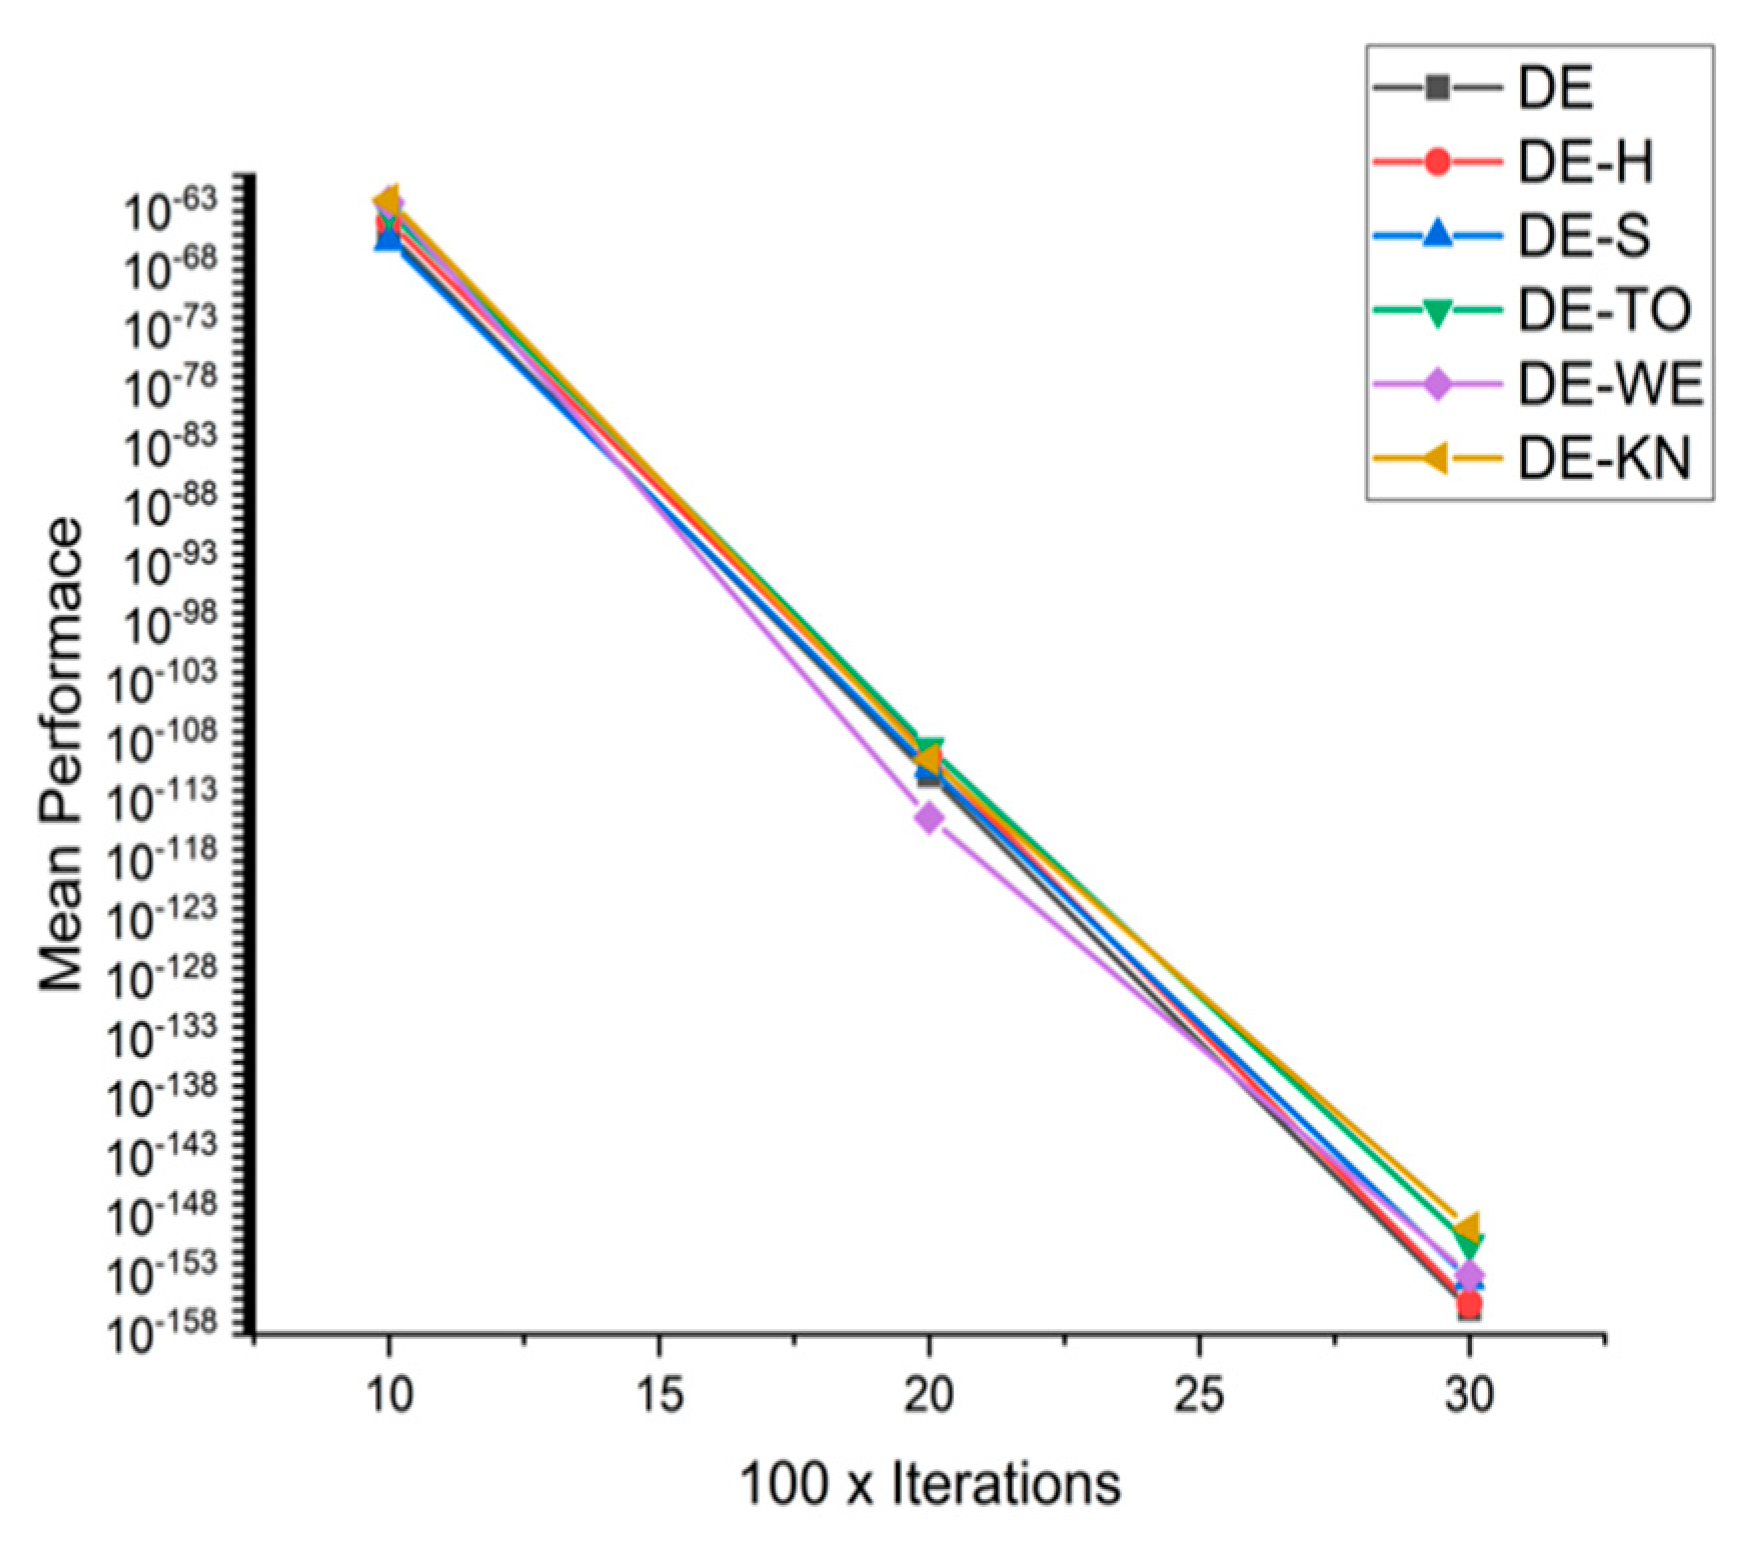
| F13 | 10 × 1000 | 1.3940 × 10−65 | 1.3756 × 10−64 | 3.1956 × 10−66 | 9.3609 × 10−64 | 5.4864 × 10−63 | 9.2695 × 10−63 |
| 20 × 2000 | 2.0163 × 10−111 | 8.5333 × 10−110 | 8.5260 × 10−111 | 3.9836 × 10−109 | 5.0102 × 10−115 | 4.4624 × 10−110 | |
| 30 × 3000 | 1.4146 × 10−156 | 4.3434 × 10−156 | 4.4702 × 10−154 | 4.3862 × 10−151 | 1.0781 × 10−153 | 1.0142 × 10−149 | |
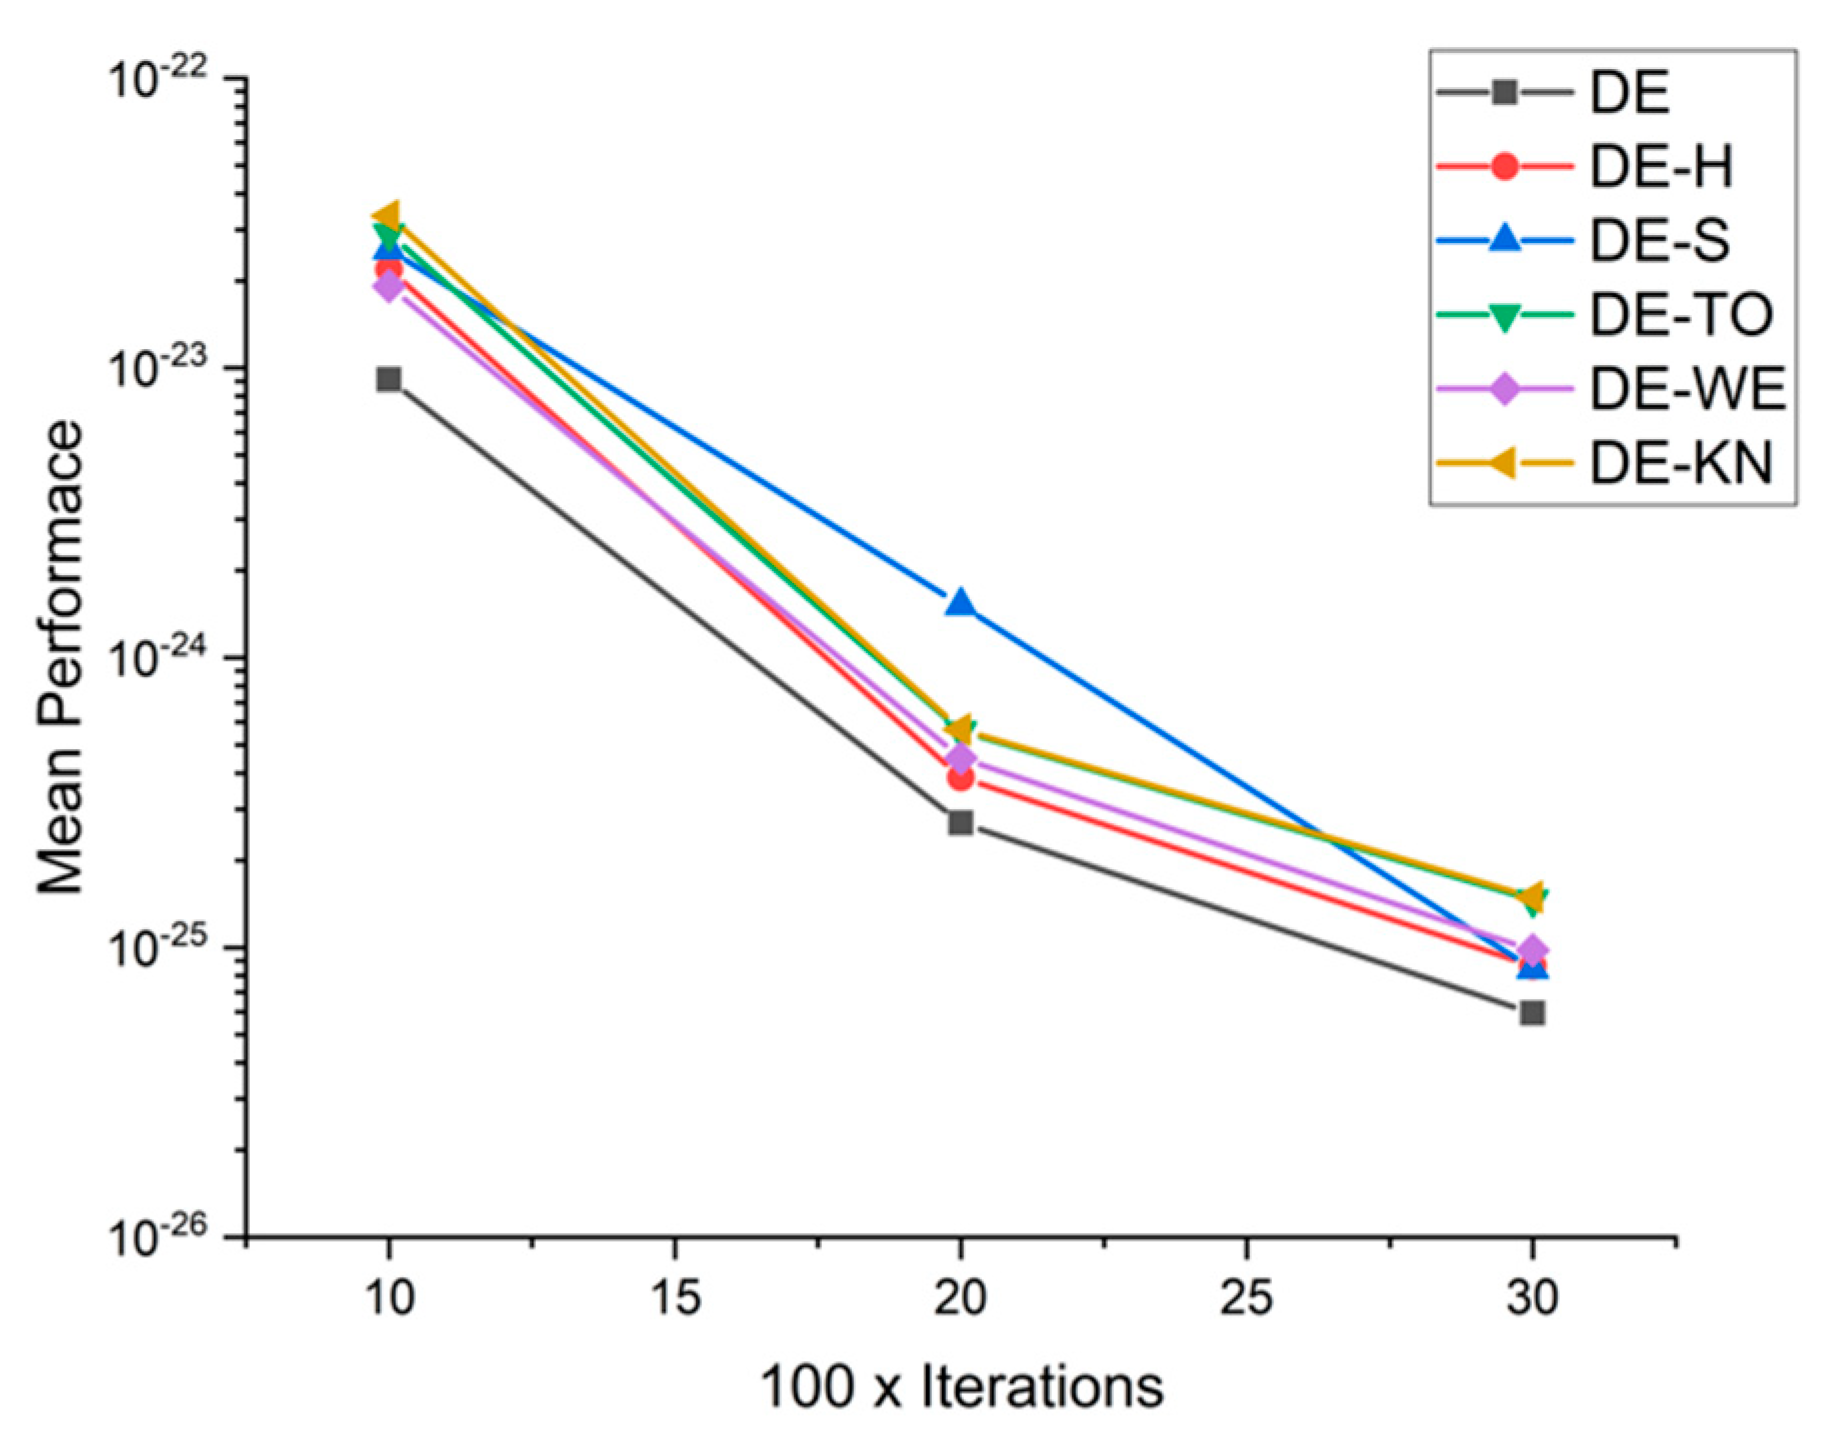
| F14 | 10 × 1000 | 9.1259 × 10⁻²⁴ | 2.1900 × 10⁻²³ | 2.5559 × 10⁻²³ | 2.9039 × 10⁻²³ | 1.9174 × 10⁻²³ | 3.3427 × 10⁻²³ |
| 20 × 2000 | 2.6867 × 10⁻²⁵ | 3.8631 × 10⁻²⁵ | 1.5177 × 10⁻²⁴ | 5.5714 × 10⁻²⁵ | 4.5049 × 10⁻²⁵ | 5.6503 × 10⁻²⁵ | |
| 30 × 3000 | 5.9241 × 10⁻²⁶ | 8.6401 × 10⁻²⁶ | 8.4348 × 10⁻²⁶ | 1.4630 × 10⁻²⁵ | 9.7932 × 10⁻²⁶ | 1.4921 × 10⁻²⁵ | |
| F15 | 10 × 1000 | 1.0493 × 10−185 | 4.0276 × 10−181 | 5.0331 × 10−182 | 3.1770 × 10−183 | 1.1698 × 10−180 | 2.6563 × 10−182 |
| 20 × 2000 | 2.9407 × 10−159 | 9.9152 × 10−159 | 2.1401 × 10−158 | 9.0345 × 10−156 | 3.8871 × 10−158 | 8.0144 × 10−160 | |
| 30 × 3000 | 4.6769 × 10−138 | 1.0737 × 10−137 | 7.0544 × 10−138 | 8.0376 × 10−138 | 4.9091 × 10−139 | 1.1054 × 10−137 | |
| F16 | 10 × 1000 | 1.8635 × 10−04 | 1.8109 × 10−02 | 4.9798 × 10−02 | 5.8605 × 10−04 | 1.4858 × 10−02 | 3.7220 × 10−02 |
| 20 × 2000 | 1.1032 × 10+00 | 1.6605 × 10+00 | 1.7157 × 10+00 | 1.4875 × 10+00 | 1.5697 × 10+00 | 1.2008 × 10+00 | |
| 30 × 3000 | 2.8283 × 10+01 | 2.2049 × 10+01 | 2.9388 × 10+01 | 2.8205 × 10+01 | 2.5794 × 10+01 | 2.9526 × 10+01 |
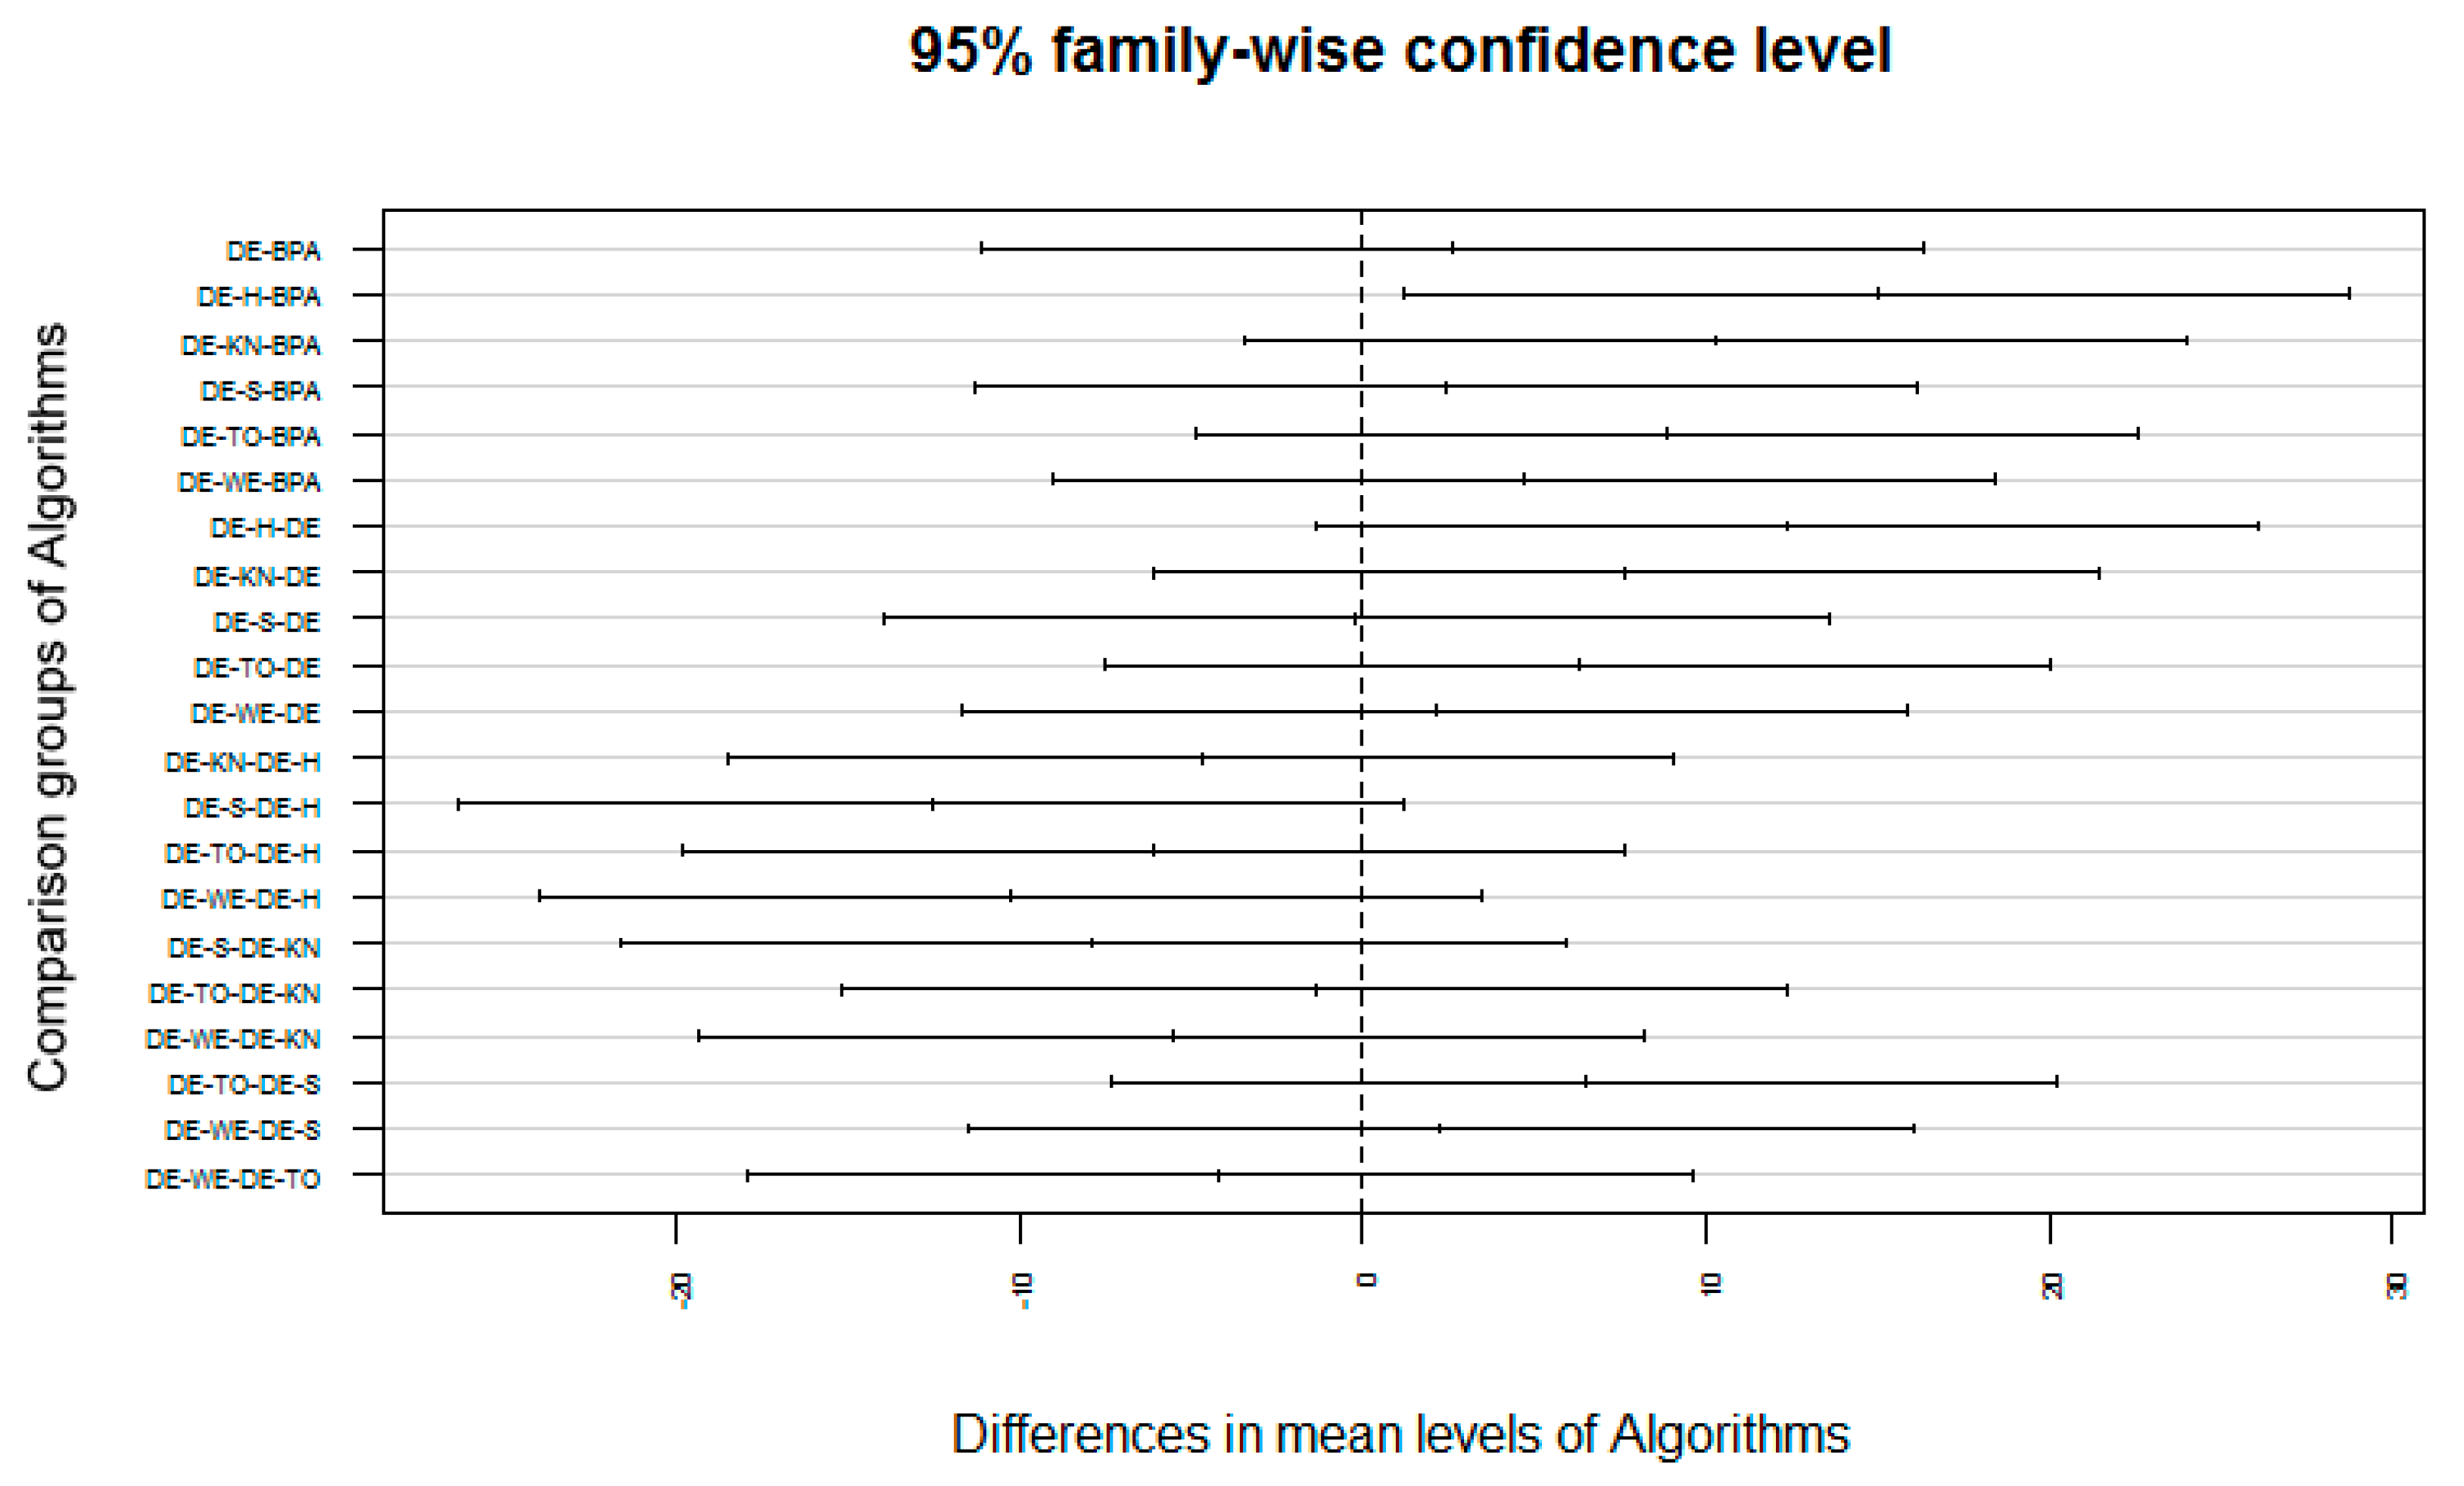
5.6. Friedman and Kruskal–Wallis Test on DE Approaches
In Table 7, the exhaustive statistical results are explained.
Table 7.
Mean ranks obtained by Kruskal–Wallis and Friedman test for all DE-based approaches.
Table 7.
Mean ranks obtained by Kruskal–Wallis and Friedman test for all DE-based approaches.
| Friedman Value | Kruskal-Wallis | |
|---|---|---|
| DE | 63.74 | 65.11 |
| DE-H | 59.31 | 60.41 |
| DE-S | 64.01 | 65.05 |
| DE-TO | 63.76 | 65.35 |
| DE-WE | 63.35 | 63.93 |
| DE-KN | 63.33 | 64.06 |
6. Comparison of PSO and DE Regarding Data Classification
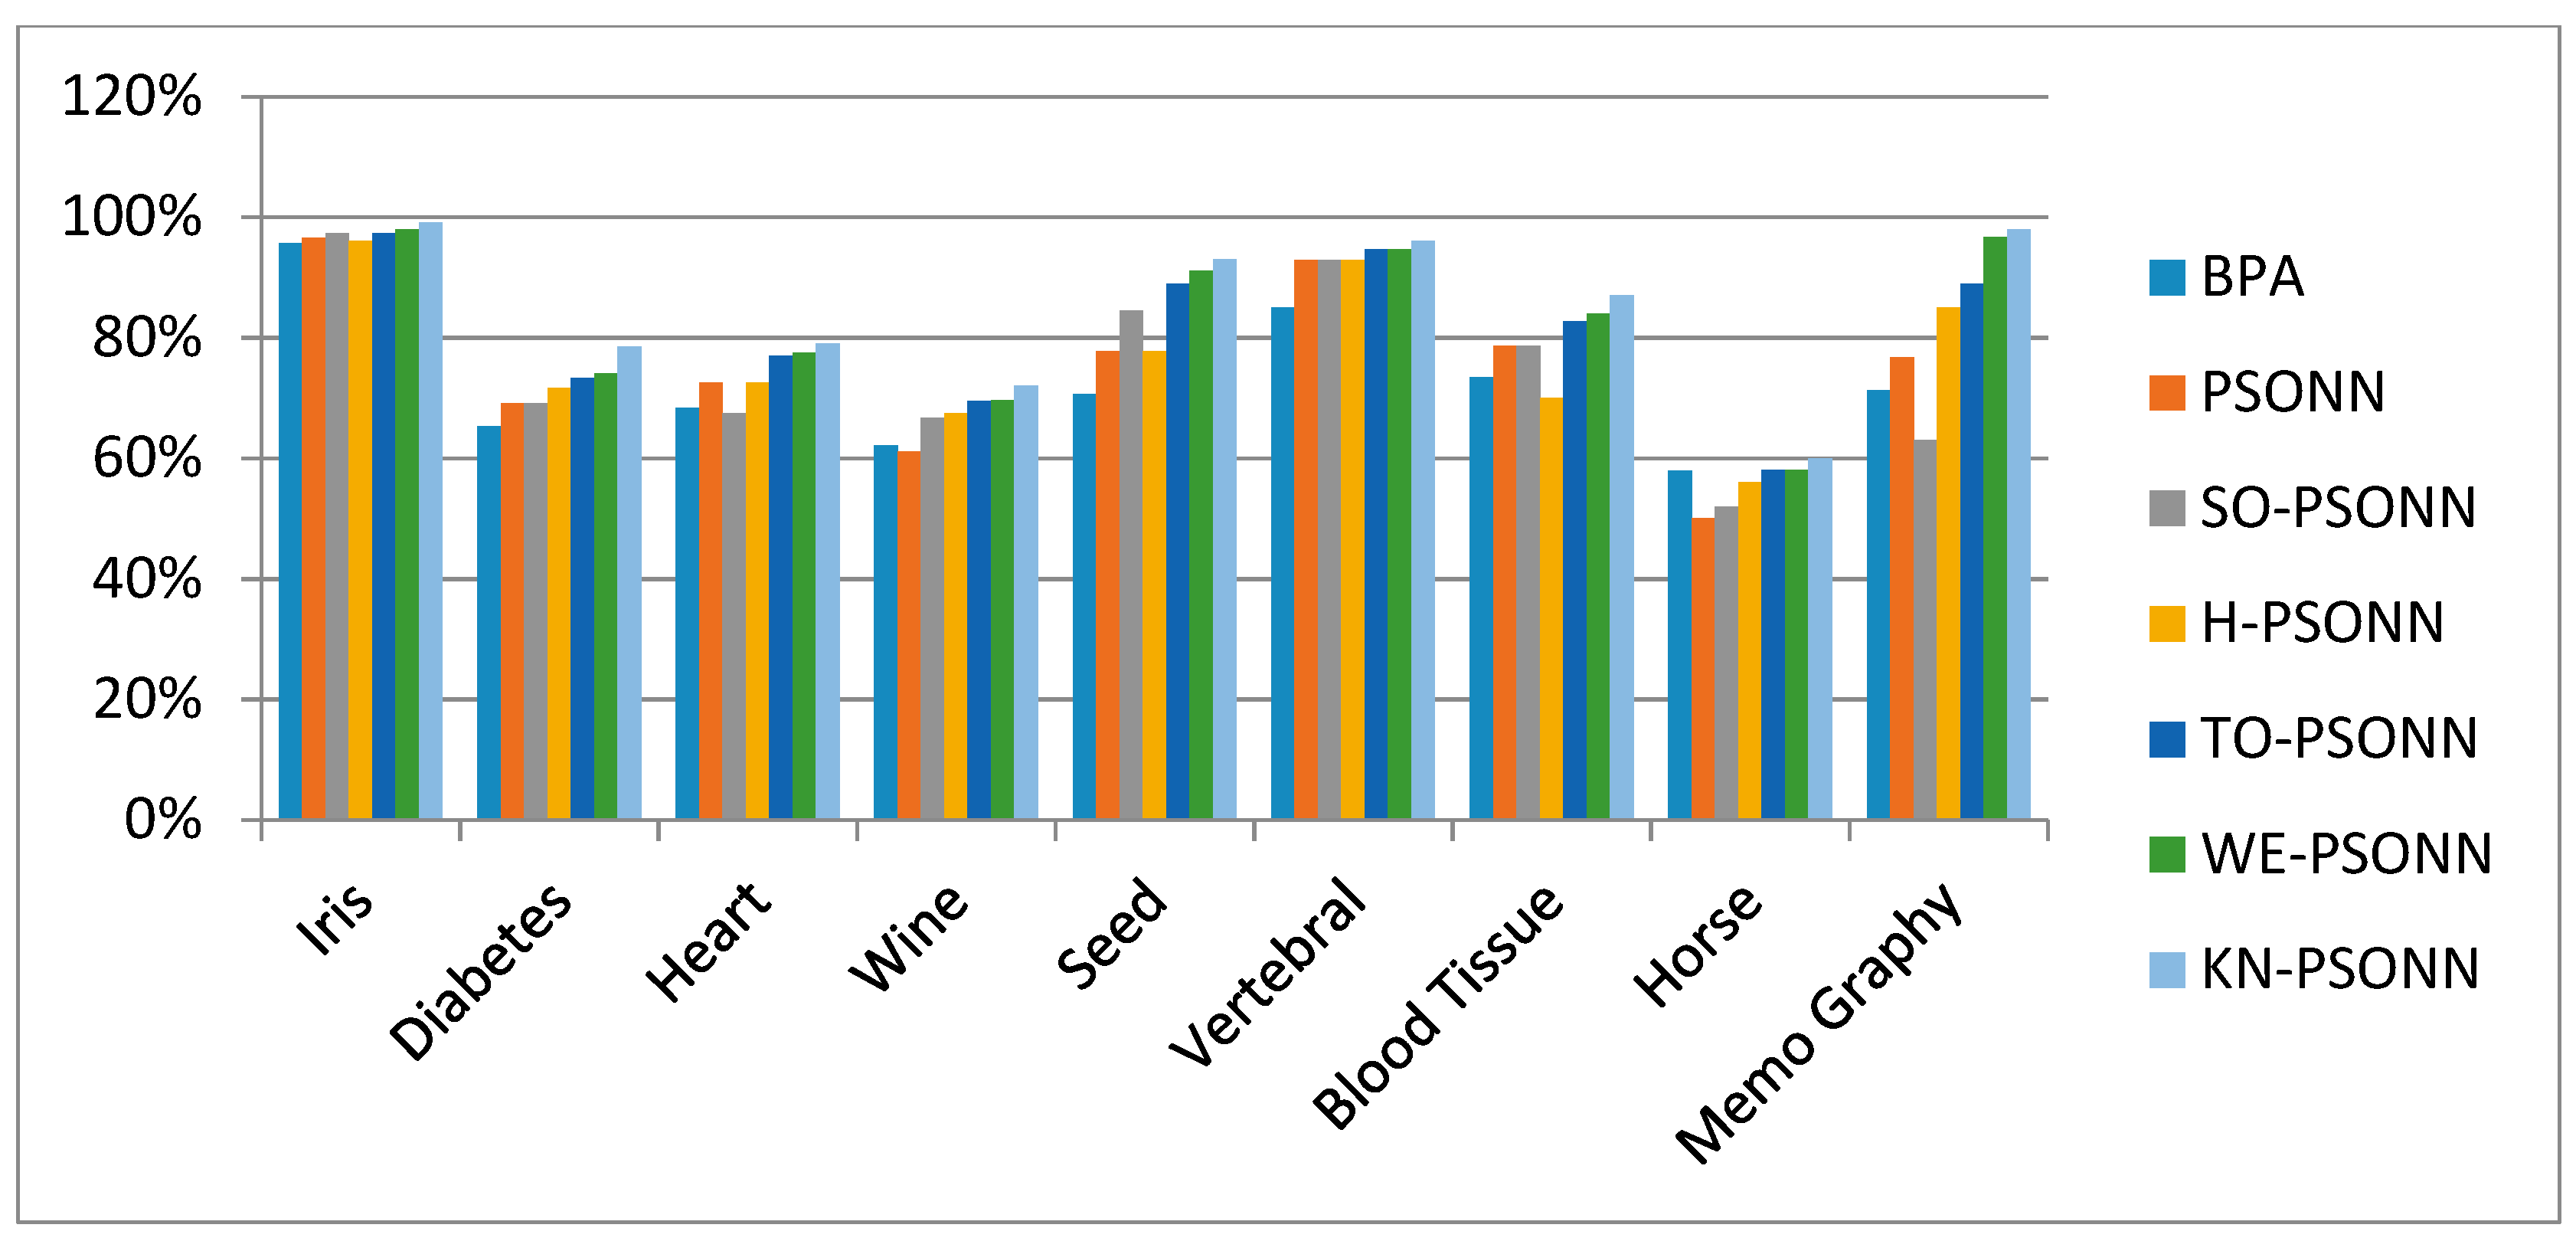
6.1. NN Classifications with PSO-Based Initialization Approaches
For further verification of performance of proposed algorithms TO-PSO, WE-PSO and KN-PSO, a comparative study for real-world benchmark data sets problem is tested for training of neural network. We have performed experiments using seven benchmark data sets (diabetes, heart, wine, seed, vertebral, blood tissue, and mammography) exerted from the world-famous machine-learning repository of University of California, Irvine (UCI). Training weights are initialized within interval [−50, 50]. Accuracy of feed-forward neural network is tested in the form of root mean squared error (RMSE). Table 8 shows the characteristics of the data sets used.
Table 8.
Characteristics of UCI benchmarks data set.
Discussion
Multilayer feed-forward neural network is trained with a backpropagation algorithm, standard PSO, SO-PSO, and H-PSO, and proposed TO-PSO, KN-PSO, and WE-PSO. Comparison of these training approaches was tested on real classification problem data sets taken from UCI repository. The crossvalidation method was used to compare the performances of different classification techniques. In the paper, k-fold crossvalidation method used for comparison of classification performances for the training of neural network with back propagation, standard PSO, SO-PSO, and H-PSO and proposed TO-PSO, KN-PSO, and WE-PSO is used. The k-fold crossvalidation method was proposed and used in the experimental with value k = 10. Data set was divided into 10 chunks, such that each chunk of data contains the same proportion of each class of data set. One chunk is used for testing, while nine chunks are used for the training phase. The experimental results of algorithms such as with backpropagation, standard PSO, SOPSO, and H-PSO and proposed TO-PSO, KN-PSO, and WE-PSO are compared with each other on seven well-known real data sets taken from UCI, and their performances are evaluated. In Table 9, the simulation results show that the training of neural network with KN-PSO algorithm out performs in accuracy and is capable of providing a better classification accuracy than the other traditional approaches. KN-PSO algorithm may be used effectively for data classification and statistical problems in the future as well. Figure 39 represents the accuracy graph for seven data sets.
Table 9.
Results of 10-fold classification rates of ANN-training methods in for seven data sets for accuracy.
Figure 39.
Classification Testing Accuracy Results.
The classification testing accuracy were imported from Microsoft Excel Spreadsheet to the software RStudio version 1.2.5001 (Boston, MA, USA) to get assurance of the winner approach statistically among all the other approaches. The testing accuracy of all seven variants of PSONN was analyzed by one-way ANOVA test and post hoc Tukey’s multicomparison test with a 0.05 significance level [55]. Table 10 depicts the results of one-way ANOVA of the testing accuracy of classification data. The significance value in Table 10 is 0.04639, which is less than 0.05, giving evidence that there is a significant difference among all variants of PSONN with a 95% confidence level. According to this, the variants of PSONN are significantly distinct from each other. Figure 40 represents the graph of one-way ANOVA results, which conclude that KN-PSONN significantly outperforms all other variants of PSONN. Figure 41 represents the results of multicomparisons of PSONN variants through post hoc Tukey’s test. The resultant graph depicts that KN-PSONN variant is significantly different from all other variants. According to the results of Figure 39, KN-PSONN is proved statistically different from all other approaches of PSONN with 95% confidence level.
Table 10.
One way ANOVA Test Results of PSO variants.
Figure 40.
Box plot visualization of the results achieved by the training of FFNN for all PSO-based initialization approaches and BPA for given data set of classification problem.
Figure 41.
Multicomparison post hoc Tukey test graph of all PSO-based initialization approaches and BPA.
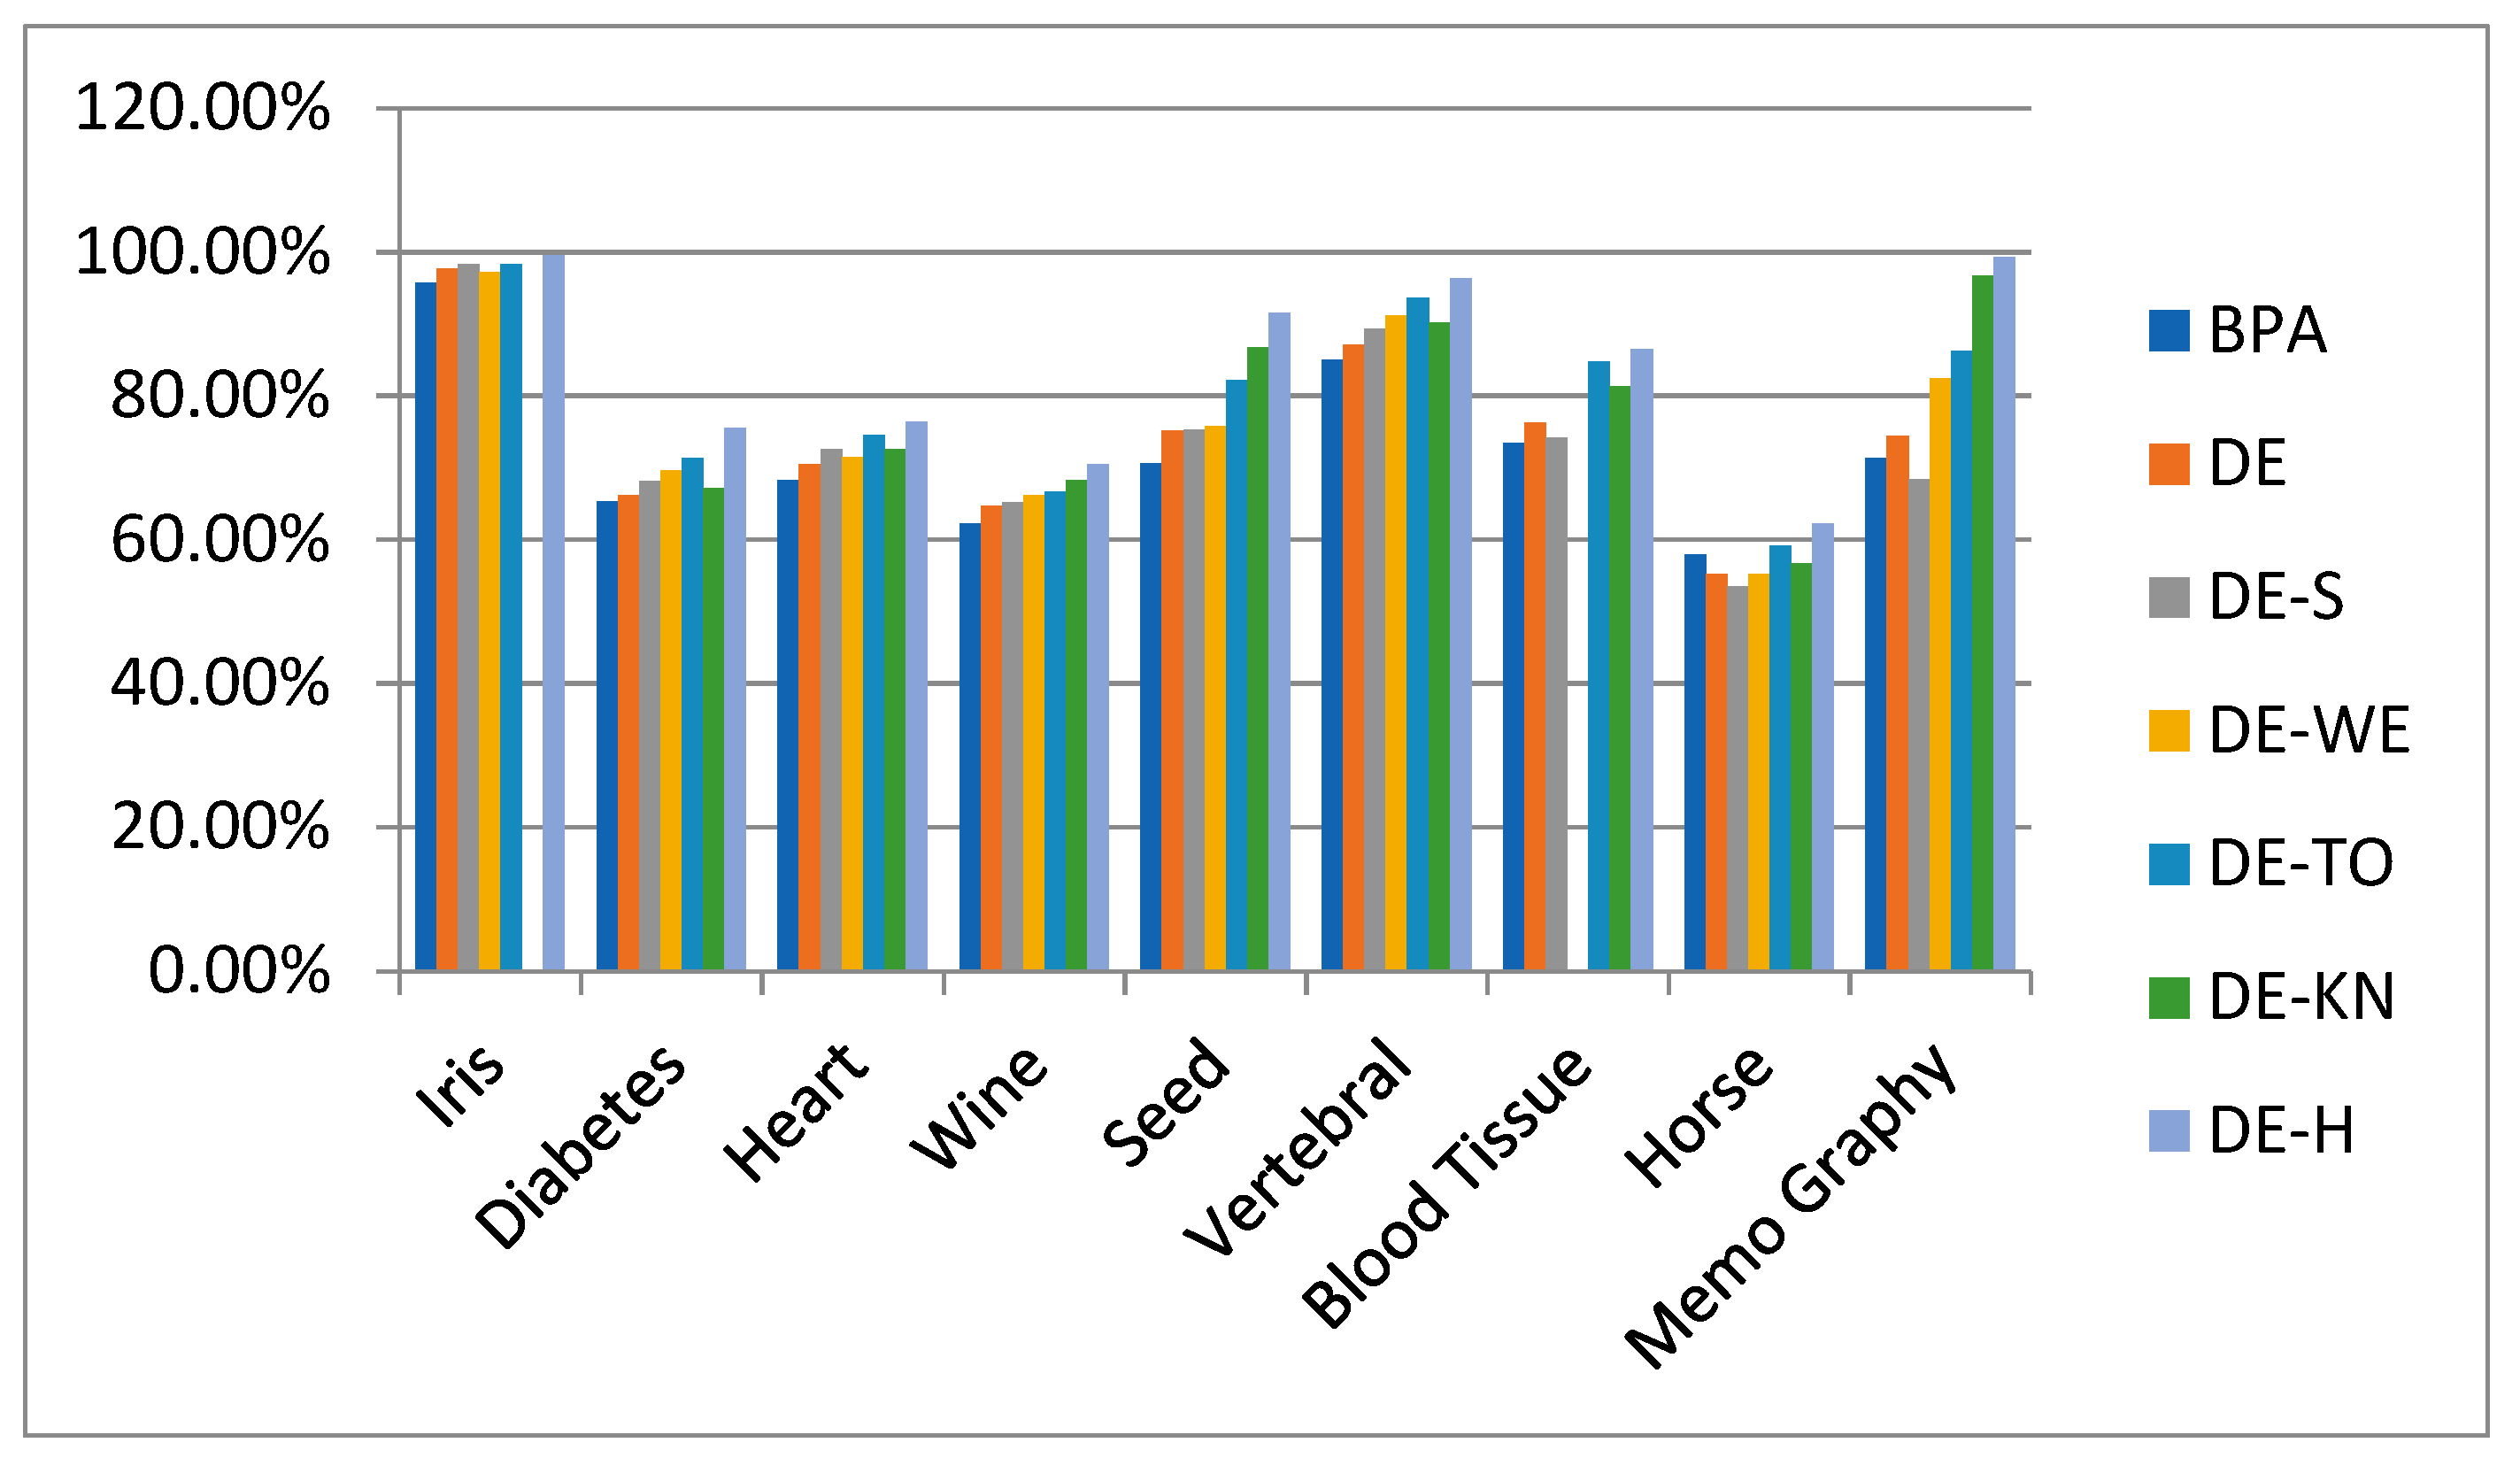
6.2. NN Classifications with DE-Based Initialization Approaches
The proposed approaches DE-KN, DE-TO, and DE-WE and family of low-discrepancy sequences are extremely suitable for tackling the global optimization problems. A comparative study for real-world benchmark data sets problem is tested for the training of neural network. We have performed experiments using seven benchmark data sets (diabetes, heart, wine, seed, vertebral, blood tissue, and mammography) exerted from the world-famous machine-learning repository of UCI. Training weights are initialized within the interval [−50, 50]. Accuracy of the feed-forward neural network is tested in the form of root mean squared error (RMSE)
Discussion
Multilayer feed-forward neural network is trained with a backpropagation algorithm, standard DE, DE-S, and DE-H and proposed DE-TO, DE-KN, and DE-WE. For this goal, we have prepared the multilayer feed-forward neural network utilizing the process of weight optimization. The performance of the DE, DE-S, DE-H, DE-TO, DE-KN, and DE-WE and state-of-the-art NN algorithms are examined on 10 well-known data sets which have been taken directly from the worldwide UCI repository of machine learning. The features of those informational indexes are given in Table 8. These features include the total units participated against each data set, the number of total input instances, the data set nature, and the number of classes against each data set, i.e., binary class problem or multiclass problem. The impact of increasing the number of target classes is independent, as the proposed strategy is purely concerned with weight optimization rather thanfeature selection or reducing high dimensionality. In addition, 10-fold cross-validation method has been carried out for the training and testing process. The experimental results of algorithms such as with backpropagation, standard DE, DE-S, DE-H, DE-WE, DE-TO, and DE-KN are compared with each other on seven well-known real data sets taken from UCI, and their performances are evaluated. In Table 11, the simulation results show that training of neural networks with DE-H algorithm outperforms in accuracy and is capable of providing better classification accuracy than the other traditional approaches. DE-H algorithm may be used effectively for data classification and statistical problems in the future as well. Figure 42 represents the accuracy graph for seven data sets
Table 11.
Results of 10-fold classification rates of ANN-training methods in for seven data sets for accuracy.
Figure 42.
Classification Testing Accuracy Results.
To prove the experimental results statistically, the testing accuracy of classification data sets were loaded to the software RStudio (1.2.5001 version). The classification results of seven approaches of DE were tested by the one-way ANOVA statistical test and post hoc Tukey’s pair-wise comparison statistical test using significance level 0.05 [19,55]. The findings of classification data set with one-way ANOVA are illustrated in Table 12, where the significance = 0.02043, which is less than the abovementioned threshold of significance level. The findings in Table 12 proved that there are significant dissimilarities in all variants of DE with 95% confidence level. Figure 43 demonstrates the graph of one-way ANOVA that gives the evidence that H-DE is significantly better than other approaches of DE. Figure 44 models the findings of pair-wise comparisons of DE approaches with post hoc Tukey’s statistical test. The simulated graph describes that H-DE approach is statistically significantly dissimilar as compared to other approaches of DE having 95% confidence level.
Table 12.
One way ANOVA test results of DE variants.
Figure 43.
Boxplot visualization of the results achieved by the training of FFNN for all DE-based initialization approaches and BPA for given data set of classification problem.
Figure 44.
Multicomparison post hoc Tukey test graph of DE variants.
7. Conclusions
This paper presents three novel pseudorandom initialization strategies called WELL sequence, Knuth sequence, and Torus sequence, which are used to initialize the population in the search space for PSO and DE algorithm. The experimental validation of proposed approaches by using the family of low-discrepancy sequences is tested on the comprehensive set of benchmark test functions and training of the artificial neural network. The simulation results reveal that the use of the family of low-discrepancy sequences maintains the diversity of the swarm, improves the convergence speed, and finds the better region of the swarm. The proposed families of low-discrepancy sequences contain higher diversity and enhance the local searching ability. The experimental results depict that the KN-PSO and H-DE have superior accuracy of convergence and avoid local optima in a better way. The proposed techniques are compared with a family of low-discrepancy sequences approaches for PSO and DE and also compared with traditional PSO and DE using random distribution and provide better results. The core objective of this research is applicable to other stochastic-based metaheuristic algorithms which develop the future direction of our work.
Author Contributions
Data curation, M.R.H.; Formal analysis, A.A.B.A.I.; Methodology, K.N.; Project administration, J.J.P.C.R.; Resources, D.B.R.; Writing—review & editing, W.H.B. All authors have read and agreed to the published version of the manuscript.
Funding
The manuscript APC is supported by Universiti Malaysia Sabah, Jalan UMS, 88400, KK, Malaysia. Furthermore, this work is partially funded by FCT/MCTES through national funds and when applicable co-funded EU funds under the Project UIDB/50008/2020; and by Brazilian National Council for Scientific and Technological Development - CNPq, via Grant No. 313036/2020-9.
Institutional Review Board Statement
Not applicable.
Informed Consent Statement
Not applicable.
Data Availability Statement
Not applicable.
Conflicts of Interest
The authors declare no conflict of interest.
References
- Yang, C.H.; Chang, H.W.; Ho, C.H.; Chou, Y.C.; Chuang, L.Y. Conserved PCR primer set designing for closely-related species to complete mitochondrial genome sequencing using a sliding window-based PSO algorithm. PLoS ONE 2011, 6, e17729. [Google Scholar] [CrossRef] [Green Version]
- Mahi, M.; Baykan, Ö.K.; Kodaz, H. A new hybrid method based on particle swarm optimization, ant colony optimization and 3-opt algorithms for traveling salesman problem. Appl. Soft Comput. 2015, 30, 484–490. [Google Scholar] [CrossRef]
- Rao, S.S. Engineering Optimization: Theory and Practice; John Wiley & Sons: Hoboken, NJ, USA, 2019. [Google Scholar]
- Zhang, G.; Lu, J.; Gao, Y. Multi-Level Decision Making: Models, Methods and Applications. 2015. Available online: https://www.springer.com/gp/book/9783662460580 (accessed on 15 April 2021).
- Beni, G.; Wang, J. Swarm Intelligence in Cellular Robotic Systems, in Robots and Biological Systems: Towards a New Bionics? Springer: New York, NY, USA, 1993; pp. 703–712. [Google Scholar]
- Acharya, J.; Mehta, M.; Saini, B. Particle swarm optimization based load balancing in cloud computing. In Proceedings of the 2016 International Conference on Communication and Electronics Systems (ICCES), Coimbatore, India, 21–22 October 2016. [Google Scholar]
- Zhang, Y.; Xiong, X.; Zhang, Q.D. An improved self-adaptive PSO algorithm with detection function for multimodal function optimization problems. Math. Probl. Eng. 2013, 2013, 1–8. Available online: https://econpapers.repec.org/article/hinjnlmpe/716952.htm (accessed on 15 April 2021). [CrossRef]
- Eberhart, R.; Kennedy, J. Particle swarm optimization. In Proceedings of the IEEE International Conference on Neural Networks, Perth, WA, Australia, 27 November–1 December 1995; pp. 1942–1948. [Google Scholar]
- Yang, X.-S. A new metaheuristic bat-inspired algorithm. In Nature Inspired Cooperative Strategies for Optimization (NICSO 2010); Springer: New York, NY, USA, 2010; pp. 65–74. [Google Scholar]
- Dorigo, M.; Di Caro, G. Ant colony optimization: A new meta-heuristic. In Proceedings of the 1999 Congress on Evolutionary Computation—CEC99, Washington, DC, USA, 6–9 July 1999; pp. 1470–1477, Cat. No. 99TH8406. [Google Scholar]
- Pham, D.T.; Ghanbarzadeh, A.; Koç, E.; Otri, S.; Rahim, S.; Zaidi, M. The bees algorithm—A novel tool for complex optimisation problems. In Intelligent Production Machines and Systems; Elsevier: Amsterdam, The Netherlands, 2006; pp. 454–459. [Google Scholar]
- Poli, R.; Kennedy, J.; Blackwell, T. Particle Swarm Optimization; Springer: New York, NY, USA, 2007; Volume 1, pp. 33–57. [Google Scholar]
- Bai, Q. Analysis of particle swarm optimization algorithm. Comput. Inf. Sci. 2010, 3, 180. [Google Scholar] [CrossRef] [Green Version]
- AlRashidi, M.R.; El-Hawary, M.E. A survey of particle swarm optimization applications in electric power systems. IEEE Trans. Evol. Comput. 2008, 13, 913–918. [Google Scholar] [CrossRef]
- Zhu, H.M.; Wu, Y.P. A PSO algorithm with high speed convergence. Control Decis. 2010, 25, 20–24. [Google Scholar]
- Chen, B.; Lei, H.; Shen, H.; Liu, Y.; Lu, Y. A hybrid quantum-based PIO algorithm for global numerical optimization. Sci. China Inf. Sci. 2019, 62, 1–12. [Google Scholar] [CrossRef] [Green Version]
- Shi, Y. Particle swarm optimization: Developments, applications and resources. In Proceedings of the 2001 Congress on Evolutionary Computation, Washington, DC, USA, 6–9 July 1999; pp. 81–86, Cat. No. 01TH8546. [Google Scholar]
- Chen, S.; Montgomery, J. Particle swarm optimization with thresheld convergence. In Proceedings of the 2013 IEEE Congress on Evolutionary Computation, Cancun, Mexico, 20–23 June 2013; pp. 510–516. [Google Scholar]
- Alam, M.N.; Das, B.; Pant, V. A comparative study of metaheuristic optimization approaches for directional overcurrent relays coordination. Electr. Power Syst. Res. 2015, 128, 39–52. [Google Scholar] [CrossRef]
- Lu, Z.; Hou, Z. Adaptive Mutation PSO Algorithm. Acta Electronca Sinica 3 2004, 32, 417–420. [Google Scholar]
- Rashedi, E.; Nezamabadi-Pour, H.; Saryazdi, S. GSA: A Gravitational Search Algorithm; Elsevier: Amsterdam, The Netherlands, 2009; Volume 179, pp. 2232–2248. [Google Scholar]
- Li, X.; Zhuang, J.; Wang, S.; Zhang, Y. A particle swarm optimization algorithm based on adaptive periodic mutation. In Proceedings of the 2008 Fourth International Conference on Natural Computation, Jinan, China, 18–20 October 2008; pp. 150–155. [Google Scholar]
- Song, M.-P.; Gu, G.-C. Research on particle swarm optimization: A review. In Proceedings of the 2004 International Conference on Machine Learning and Cybernetics, Shanghai, China, 26–29 August 2004; pp. 2236–2241, Cat. No. 04EX826. [Google Scholar]
- Maaranen, H.; Miettinen, K.; Penttinen, A. On Initial Populations of a Genetic Algorithm for Continuous Optimization Problems; Springer: New York, NY, USA, 2007; Volume 37, pp. 405–436. [Google Scholar]
- Pant, M.; Thangaraj, R.; Grosan, C.; Abraham, A. Improved particle swarm optimization with low-discrepancy sequences. In Proceedings of the 2008 IEEE Congress on Evolutionary Computation (IEEE World Congress on Computational Intelligence), Hong Kong, China, 1–6 June 2008; pp. 3011–3018. [Google Scholar]
- Parsopoulos, K.E.; Vrahatis, M.N. Initializing the particle swarm optimizer using the nonlinear simplex method. Adv. Intell. Syst. Fuzzy Syst. Evol. Comput. 2002, 216, 1–6. [Google Scholar]
- Richards, M.; Ventura, D. Choosing a starting configuration for particle swarm optimization. Neural Netw. 2004, 25, 2309–2312. [Google Scholar]
- Nguyen, X.H.; Nguyen, Q.U.; McKay, R.I. PSO with randomized low-discrepancy sequences. In Proceedings of the 9th Annual Conference on Genetic and Evolutionary Computation—GECCO ’07, New York, NY, USA, 7–11 July 2007; p. 173. [Google Scholar]
- Uy, N.Q.; Hoai, N.X.; McKay, R.I.; Tuan, P.M. Initialising PSO with randomised low-discrepancy sequences: The comparative results. In Proceedings of the 2007 IEEE Congress on Evolutionary Computation, Singapore, 25–28 September 2007; pp. 1985–1992. [Google Scholar]
- Thangaraj, R.; Pant, M.; Deep, K. Initializing PSO with probability distributions and low-discrepancy sequences: The comparative results. In Proceedings of the World Congress on Nature & Biologically Inspired Computing (NaBIC), Coimbatore, India, 9–11 December 2009; pp. 1121–1126. [Google Scholar] [CrossRef]
- Thangaraj, R.; Pant, M.; Abraham, A.; Badr, Y. Hybrid Evolutionary Algorithm for Solving Global Optimization Problems. In Proceedings of the International Conference on Hybrid Artificial Intelligence Systems, Salamanca, Spain, 10–12 June 2009. [Google Scholar]
- Pant, M.; Thangaraj, R.; Singh, V.P.; Abraham, A. Particle Swarm Optimization Using Sobol Mutation. In Proceedings of the 2008 First International Conference on Emerging Trends in Engineering and Technology, Nagpur, India, 16–18 July 2008; pp. 367–372. [Google Scholar]
- Du, J.; Zhang, F.; Huang, G.; Yang, J. A new initializing mechanism in Particle Swarm Optimization. In Proceedings of the 2011 IEEE International Conference on Computer Science and Automation Engineering, Shanghai, China, 10–12 June 2011; Volume 4, pp. 325–329. [Google Scholar]
- Murugan, P. Modified particle swarm optimisation with a novel initialisation for finding optimal solution to the transmission expansion planning problem. IET Gener. Transm. Distrib. 2012, 6, 1132–1142. [Google Scholar] [CrossRef]
- Yin, L.; Hu, X.-M.; Zhang, J. Space-based initialization strategy for particle swarm optimization. In Proceedings of the fifteenth Annual Conference Companion on Genetic and Evolutionary Computation Conference Companion—GECCO ’13 Companion, New York, NY, USA, 6–10 July 2013; pp. 19–20. [Google Scholar]
- Jensen, B.; Bouhmala, N.; Nordli, T. A Novel Tangent based Framework for Optimizing Continuous Functions. J. Emerg. Trends Comput. Inf. Sci. 2013, 4. [Google Scholar]
- Shatnawi, M.; Nasrudin, M.F.; Sahran, S. A new initialization technique in polar coordinates for Particle Swarm Optimization and Polar PSO. Int. J. Adv. Sci. Eng. Inf. Technol. 2017, 7, 242. [Google Scholar] [CrossRef]
- Bewoor, L.; Prakash, V.C.; Sapkal, S.U. Evolutionary Hybrid Particle Swarm Optimization Algorithm for Solving NP-Hard No-Wait Flow Shop Scheduling Problems. Algorithms 2017, 10, 121. [Google Scholar] [CrossRef] [Green Version]
- Zhang, J.R.; Zhang, J.; Lok, T.M.; Lyu, M.R. A hybrid particle swarm optimization–back-propagation algorithm for feedforward neural network training. Appl. Math. Comput. 2007, 185, 1026–1037. [Google Scholar] [CrossRef]
- Carvalho, M.; Ludermir, T.B. Particle swarm optimization of neural network architectures and weights. In Proceedings of the 7th International Conference on Hybrid Intelligent Systems (HIS 2007), Kaiserslautern, Germany, 17–19 September 2007; pp. 336–339. [Google Scholar]
- Mohammadi, N.; Mirabedini, S.J. Comparison of particle swarm optimization and backpropagation algorithms for training feed forward neural network. J. Math. Comput. Sci. 2014, 12, 113–123. [Google Scholar] [CrossRef]
- Albeahdili, H.M.; Han, T.; Islam, N.E. Hybrid algorithm for the optimization of training convolutional neural network. Int. J. Adv. Comput. Sci. Appl. 2015, 1, 79–85. [Google Scholar]
- Gudise, V.G.; Venayagamoorthy, G.K. Simplex differential evolution. Acta Polytech. Hung. 2009, 6, 95–115. [Google Scholar]
- Nakib, A.; Daachi, B.; Siarry, P. Hybrid Differential Evolution Using Low-Discrepancy Sequences for Image Segmentation. In Proceedings of the 2012 IEEE 26th International Parallel and Distributed Processing Symposium Workshops & PhD Forum, Shanghai, China, 21–25 May 2012; pp. 634–640. [Google Scholar]
- Tang, L.; Zhao, Y.; Liu, J. An Improved Differential Evolution Algorithm for Practical Dynamic Scheduling in Steelmaking-Continuous Casting Production. IEEE Trans. Evol. Comput. 2013, 18, 209–225. [Google Scholar] [CrossRef]
- Wang, L.; Zeng, Y.; Chen, T. Back propagation neural network with adaptive differential evolution algorithm for time series forecasting. Expert Syst. Appl. 2015, 42, 855–863. [Google Scholar] [CrossRef]
- Hou, Y.; Zhao, L.; Lu, H. Fuzzy neural network optimization and network traffic forecasting based on improved differential evolution. Future Gener. Comput. Syst. 2018, 81, 425–432. [Google Scholar] [CrossRef]
- Panigrahi, S.; Bhoi, A.K.; Karali, Y. A modified differential evolution algorithm trained pi-sigma neural network for pattern classification. Int. J. Soft Comput. Eng. 2013, 3, 133–136. [Google Scholar]
- Matsumoto, M.; Nishimura, T. Mersenne twister: A 623-dimensionally equidistributed uniform pseudo-random number generator. ACM Trans. Model. Comput. Simul. TOMACS 1998, 8, 3–30. [Google Scholar] [CrossRef] [Green Version]
- Sobol’, I. On the distribution of points in a cube and the approximate evaluation of integrals. USSR Comput. Math. Math. Phys. 1967, 7, 86–112. [Google Scholar] [CrossRef]
- Halton, J.H. Algorithm 247: Radical-inverse quasi-random point sequence. Commun. ACM 1964, 7, 701–702. [Google Scholar] [CrossRef]
- Panneton, F.; L’Ecuyer, P.; Matsumoto, M. Improved long-period generators based on linear recurrences modulo 2. ACM Trans. Math. Softw. 2006, 32, 1–16. [Google Scholar] [CrossRef]
- Knuth, D.E. The Art of Computer Programming; Addison-Wesley: Reading, MA, USA, 1973; Volume 2, p. 51. [Google Scholar]
- Williams, H.C.; Nikulin, V.V.; Shafarevich, I.R.; Reid, M. Geometries and Groups. Math. Gaz. 1989, 73, 257. [Google Scholar] [CrossRef]
- Ulusoy, U. Application of ANOVA to image analysis results of talc particles produced by different milling. Powder Technol. 2008, 188, 133–138. [Google Scholar] [CrossRef]
Publisher’s Note: MDPI stays neutral with regard to jurisdictional claims in published maps and institutional affiliations. |
© 2021 by the authors. Licensee MDPI, Basel, Switzerland. This article is an open access article distributed under the terms and conditions of the Creative Commons Attribution (CC BY) license (https://creativecommons.org/licenses/by/4.0/).