1. Introduction
Optical glasses are widely used in optical and aerospace applications. However, they are very brittle and have low fracture toughness, thus being prone to micro-cracks developing in the subsurface layers during conventional grinding processes. The maximum depth of subsurface cracks has a significant effect on the machining quality and even efficiency of the following processing [
1]; thus, correct prediction of the maximum subsurface cracks depth is important for controlling the subsurface damage and overall grinding process efficiency.
UVAG has clear technical advantages in substantially reducing the average cutting force and quantity of micro-cracks [
2]. However, inducing high-frequency vibrations and modifying abrasive grain motion significantly change the stresses at the contact area between the abrasive grains and the glass material compared to conventional grinding [
3]. This directly affects the grinding force and dynamic impulse and the formation and propagation of subsurface cracks.
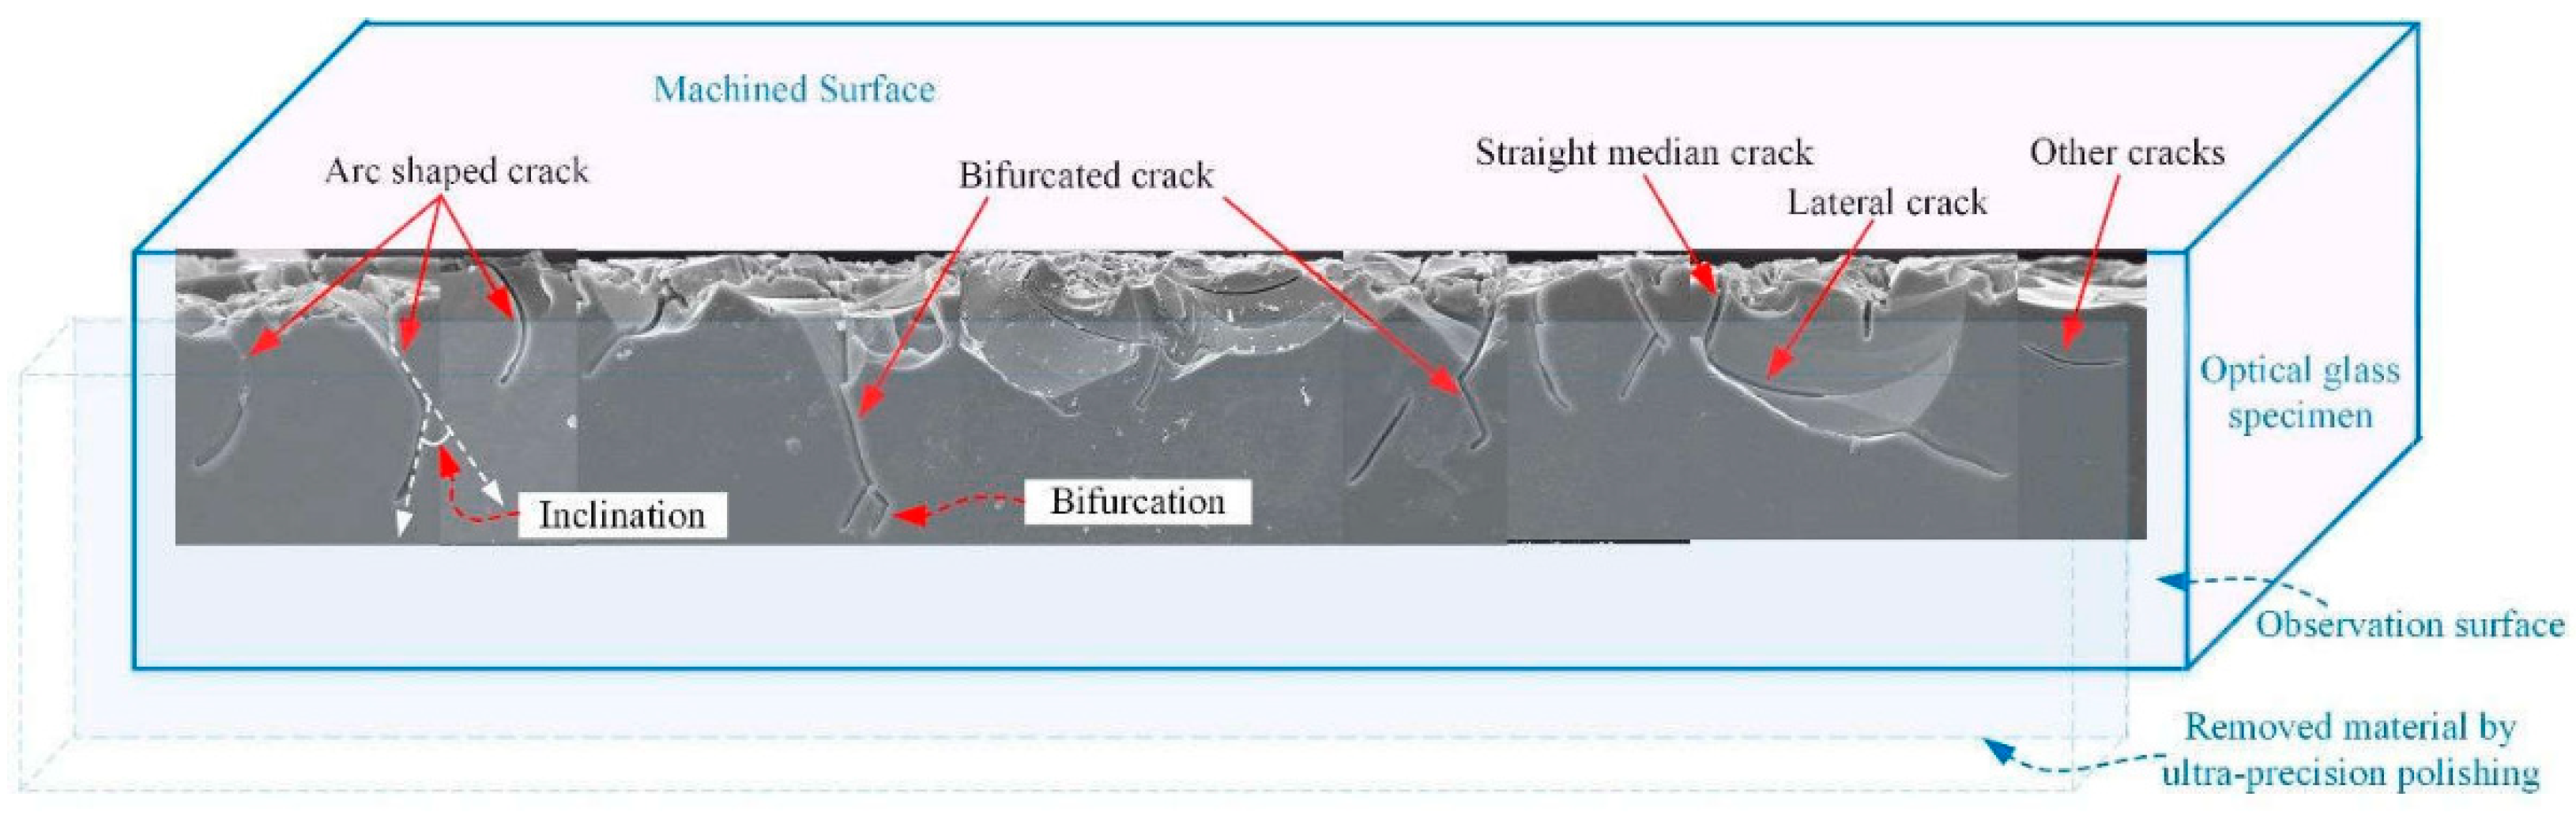
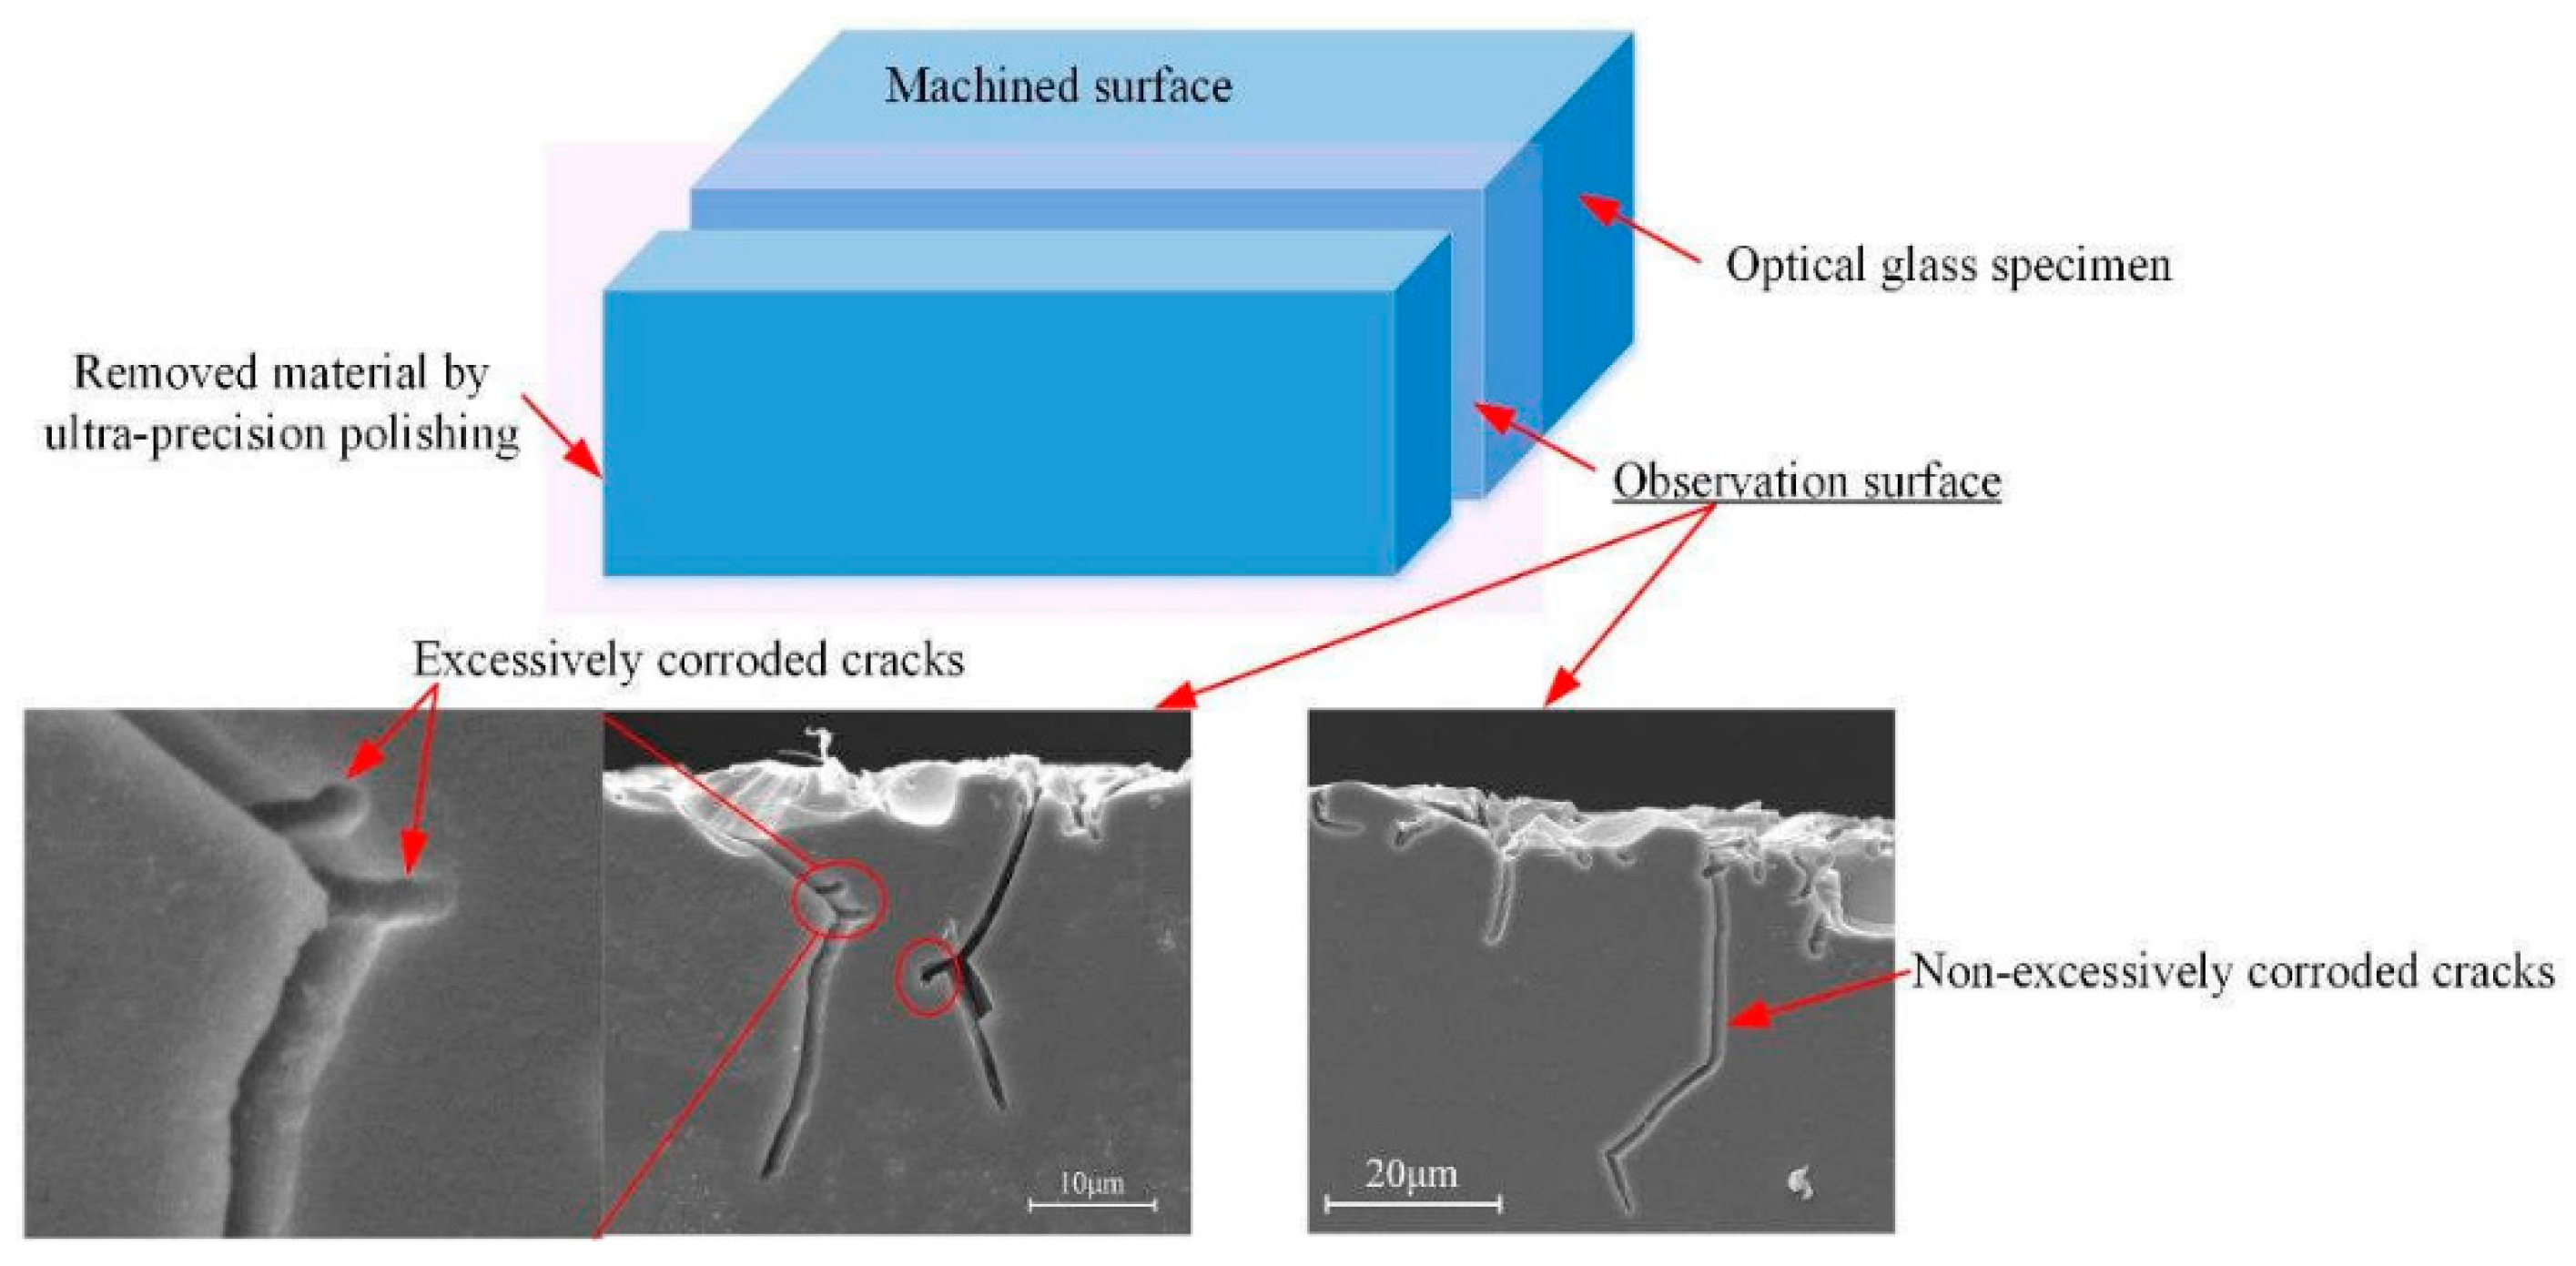
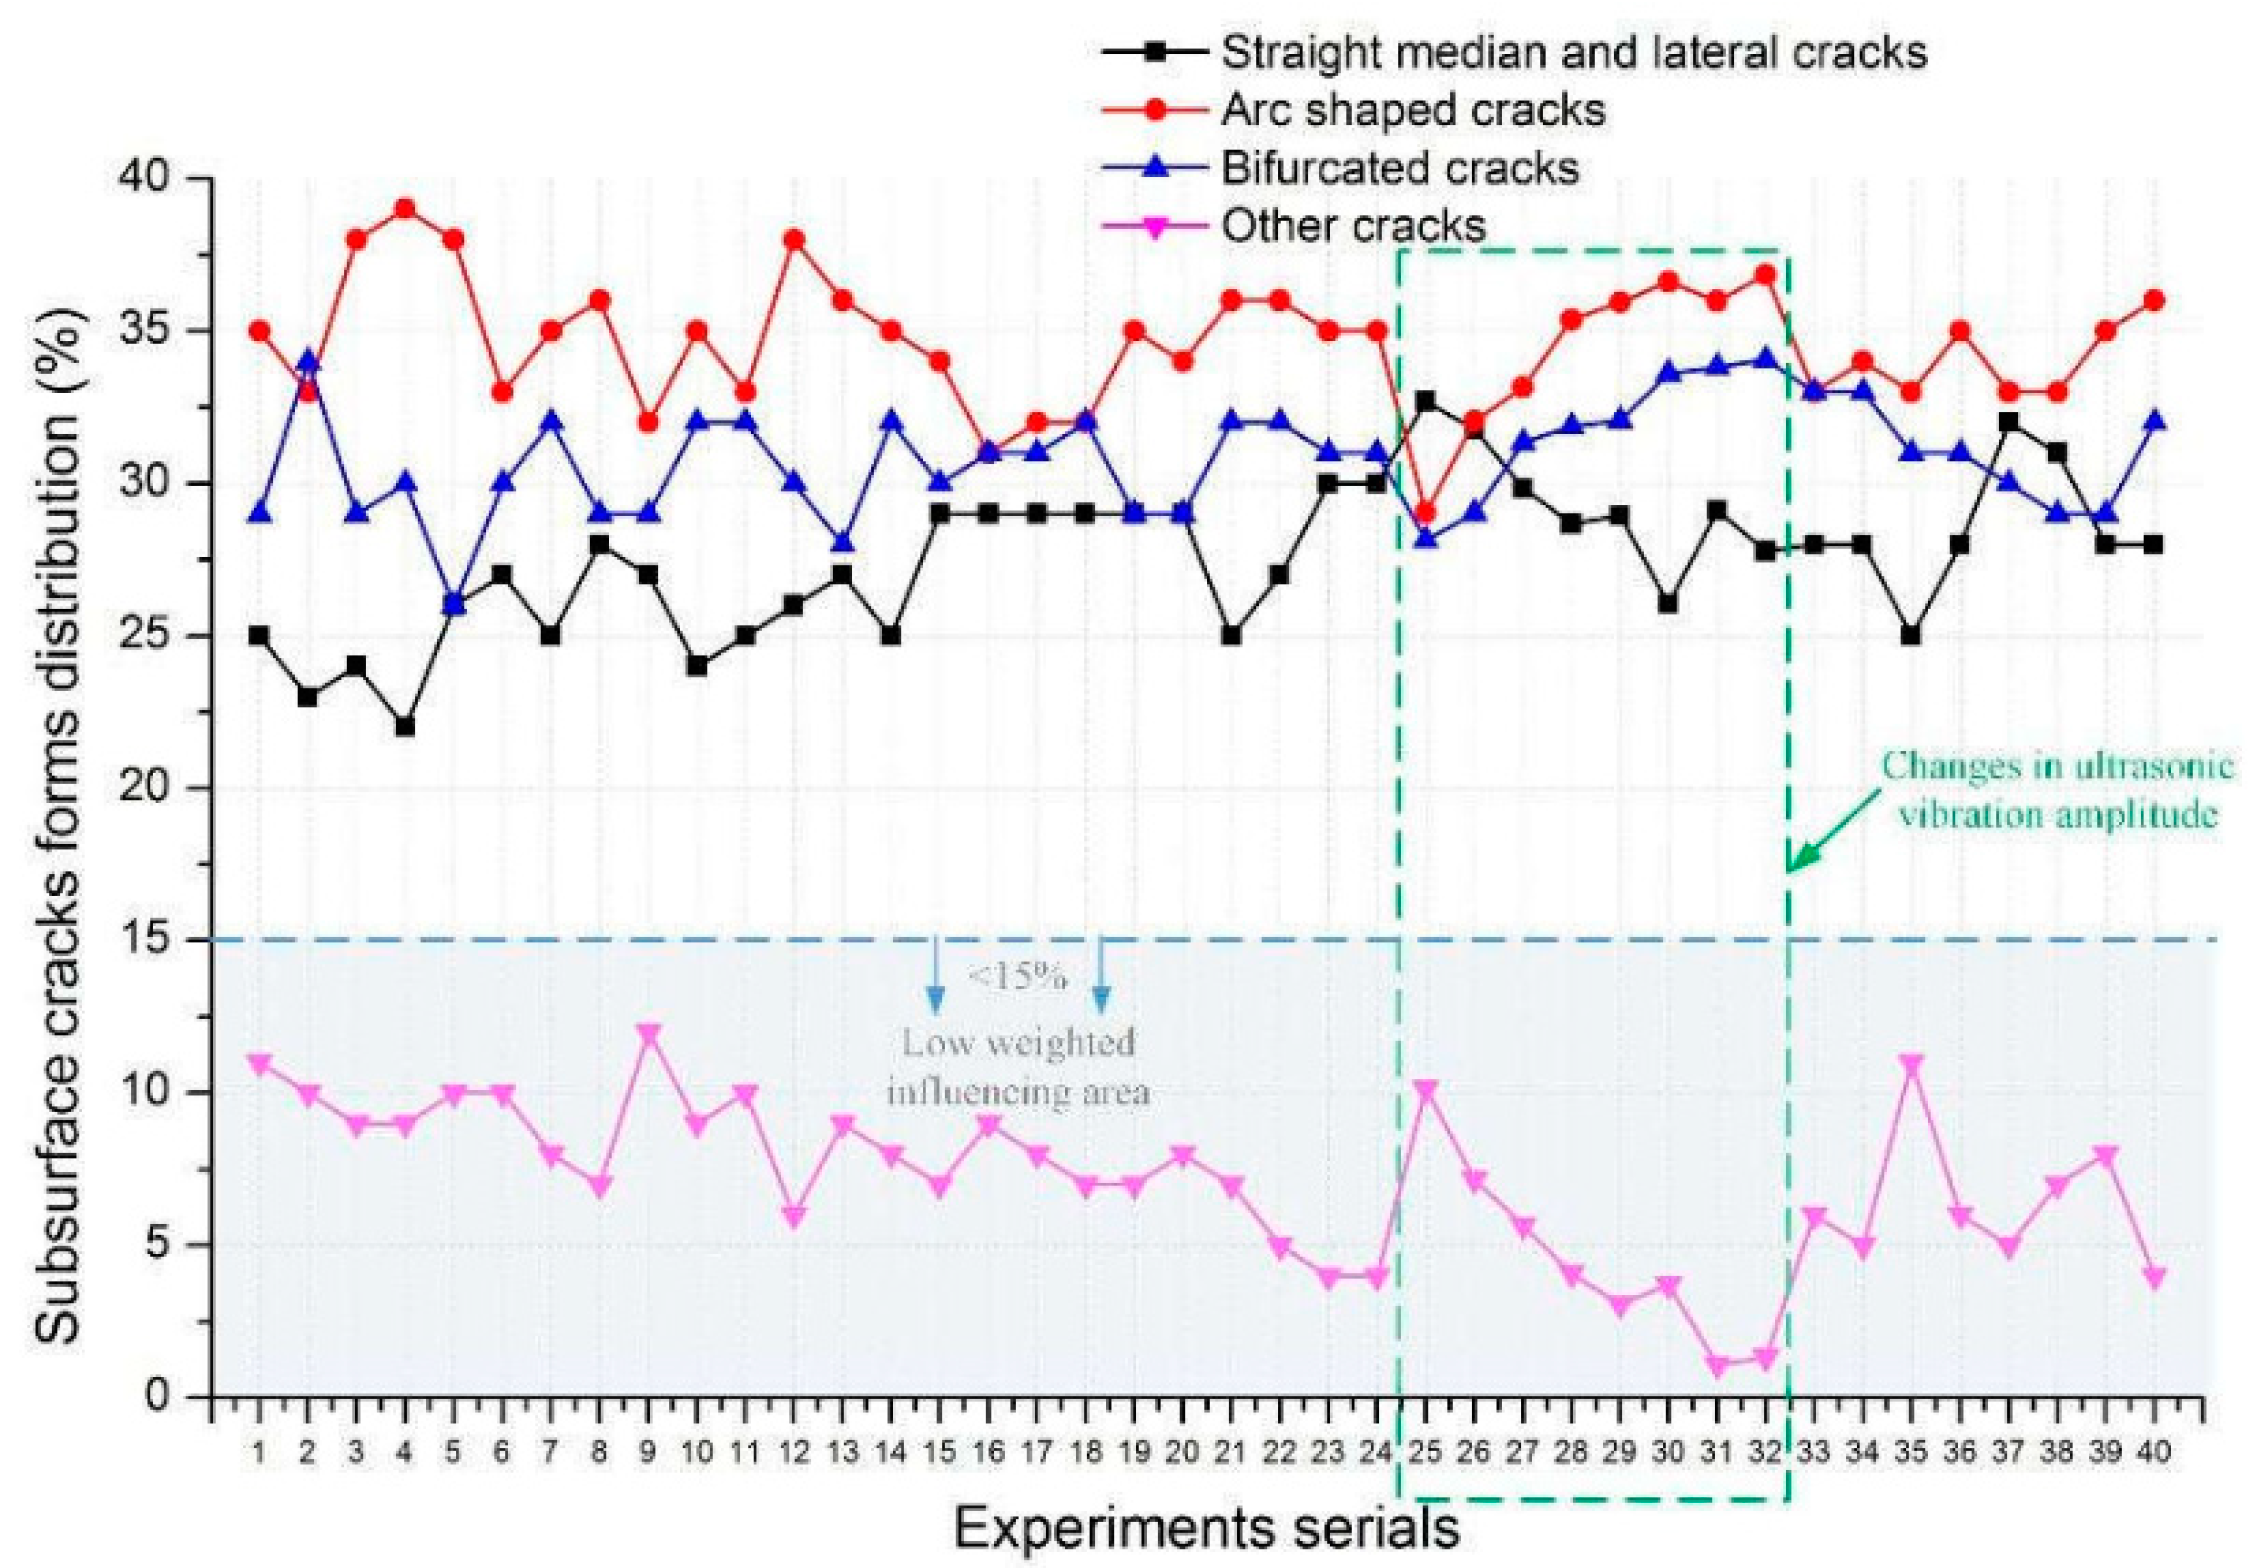
The subsurface cracks may not propagate in a single form. Furthermore, abrasive grains used on the grinding wheel are of different varieties and their shapes are random. Thus, the subsurface cracks in UVAG of the optical glasses often exhibit diverse forms and are numerous. Due to the different influencing factors of the grinding loads, the quantities and distributions of multiple cracks forms are also significantly different. This may lead to uncertainty in estimating the crack maximum propagation depth. Hence, predicting the maximum subsurface crack depth while considering the different effects of the process parameters is of great significance.
During the past decade, research has focused on the formation and prediction of subsurface cracks, and a number of useful results have been obtained. Fouad [
4] analyzed the effects of process parameters on subsurface crack depth; the changing law of subsurface damage was also researched by changing each parameter. However, it proved hard to evaluate these effects using the adopted approach. Li [
5] developed a regression model for subsurface crack depth (SSCD) estimation by combining theoretical mechanical analysis and experimental approach, but the scratching tests conducted in this work differed from the practical machining, as the abrasive grains used in the latter are often random in shape and quantity. There are also many useful studies on the prediction of SSCD by using simulations [
6] and regression analysis [
7]. To develop an analytical approach, Yu [
8] used the damage-zone analysis method and verified the accuracy of the proposed model experimentally. To investigate the maximum subsurface crack depth (MSSCD), Lv [
9] researched the critical formation conditions of MSSCD by conducting a double indentation test. Based on the mechanical analysis of indentation test results, Esmaeilzare [
10] and Yao [
11] analyzed the relationship between the MSSCD and surface roughness and drew a similar conclusion that the two parameters had the same trends. However, some important actual machining factors were not considered, such as the different influences of various crack forms and process parameters. Li [
12] developed an analytical SSCD model based on the analysis of crack sizes and microscopic asperity (Rz). However, the crack forms considered in that work were strictly limited to the median and lateral cracks, whereas subsurface cracks often vary in both shape and size [
13]. Li innovatively researched the fracture behavior and the threshold load in radial crack propagation by conducting a nanoindentation test [
14]. Pansare pointed an easily visible technique for authentication of epoxy composites by using UV visible and IR light, which may provide new methods for investigating the subsurface cracks in grinding of optical glasses [
15].
It can be concluded from the above literature survey that few reports provide a deeper understanding of multiple subsurface crack forms in the actual UVAG process. Since the formation of the crack with maximum depth can be different from those in scratching or indentation tests, it is necessary to investigate the distribution of multiple crack forms and their relation to the maximum depth crack. The effect of changing each parameter on the subsurface crack propagation and MSSCD is quite different. The different influences of those factors should be fully considered in the prediction of MSSCD, but only a few relevant studies are available.
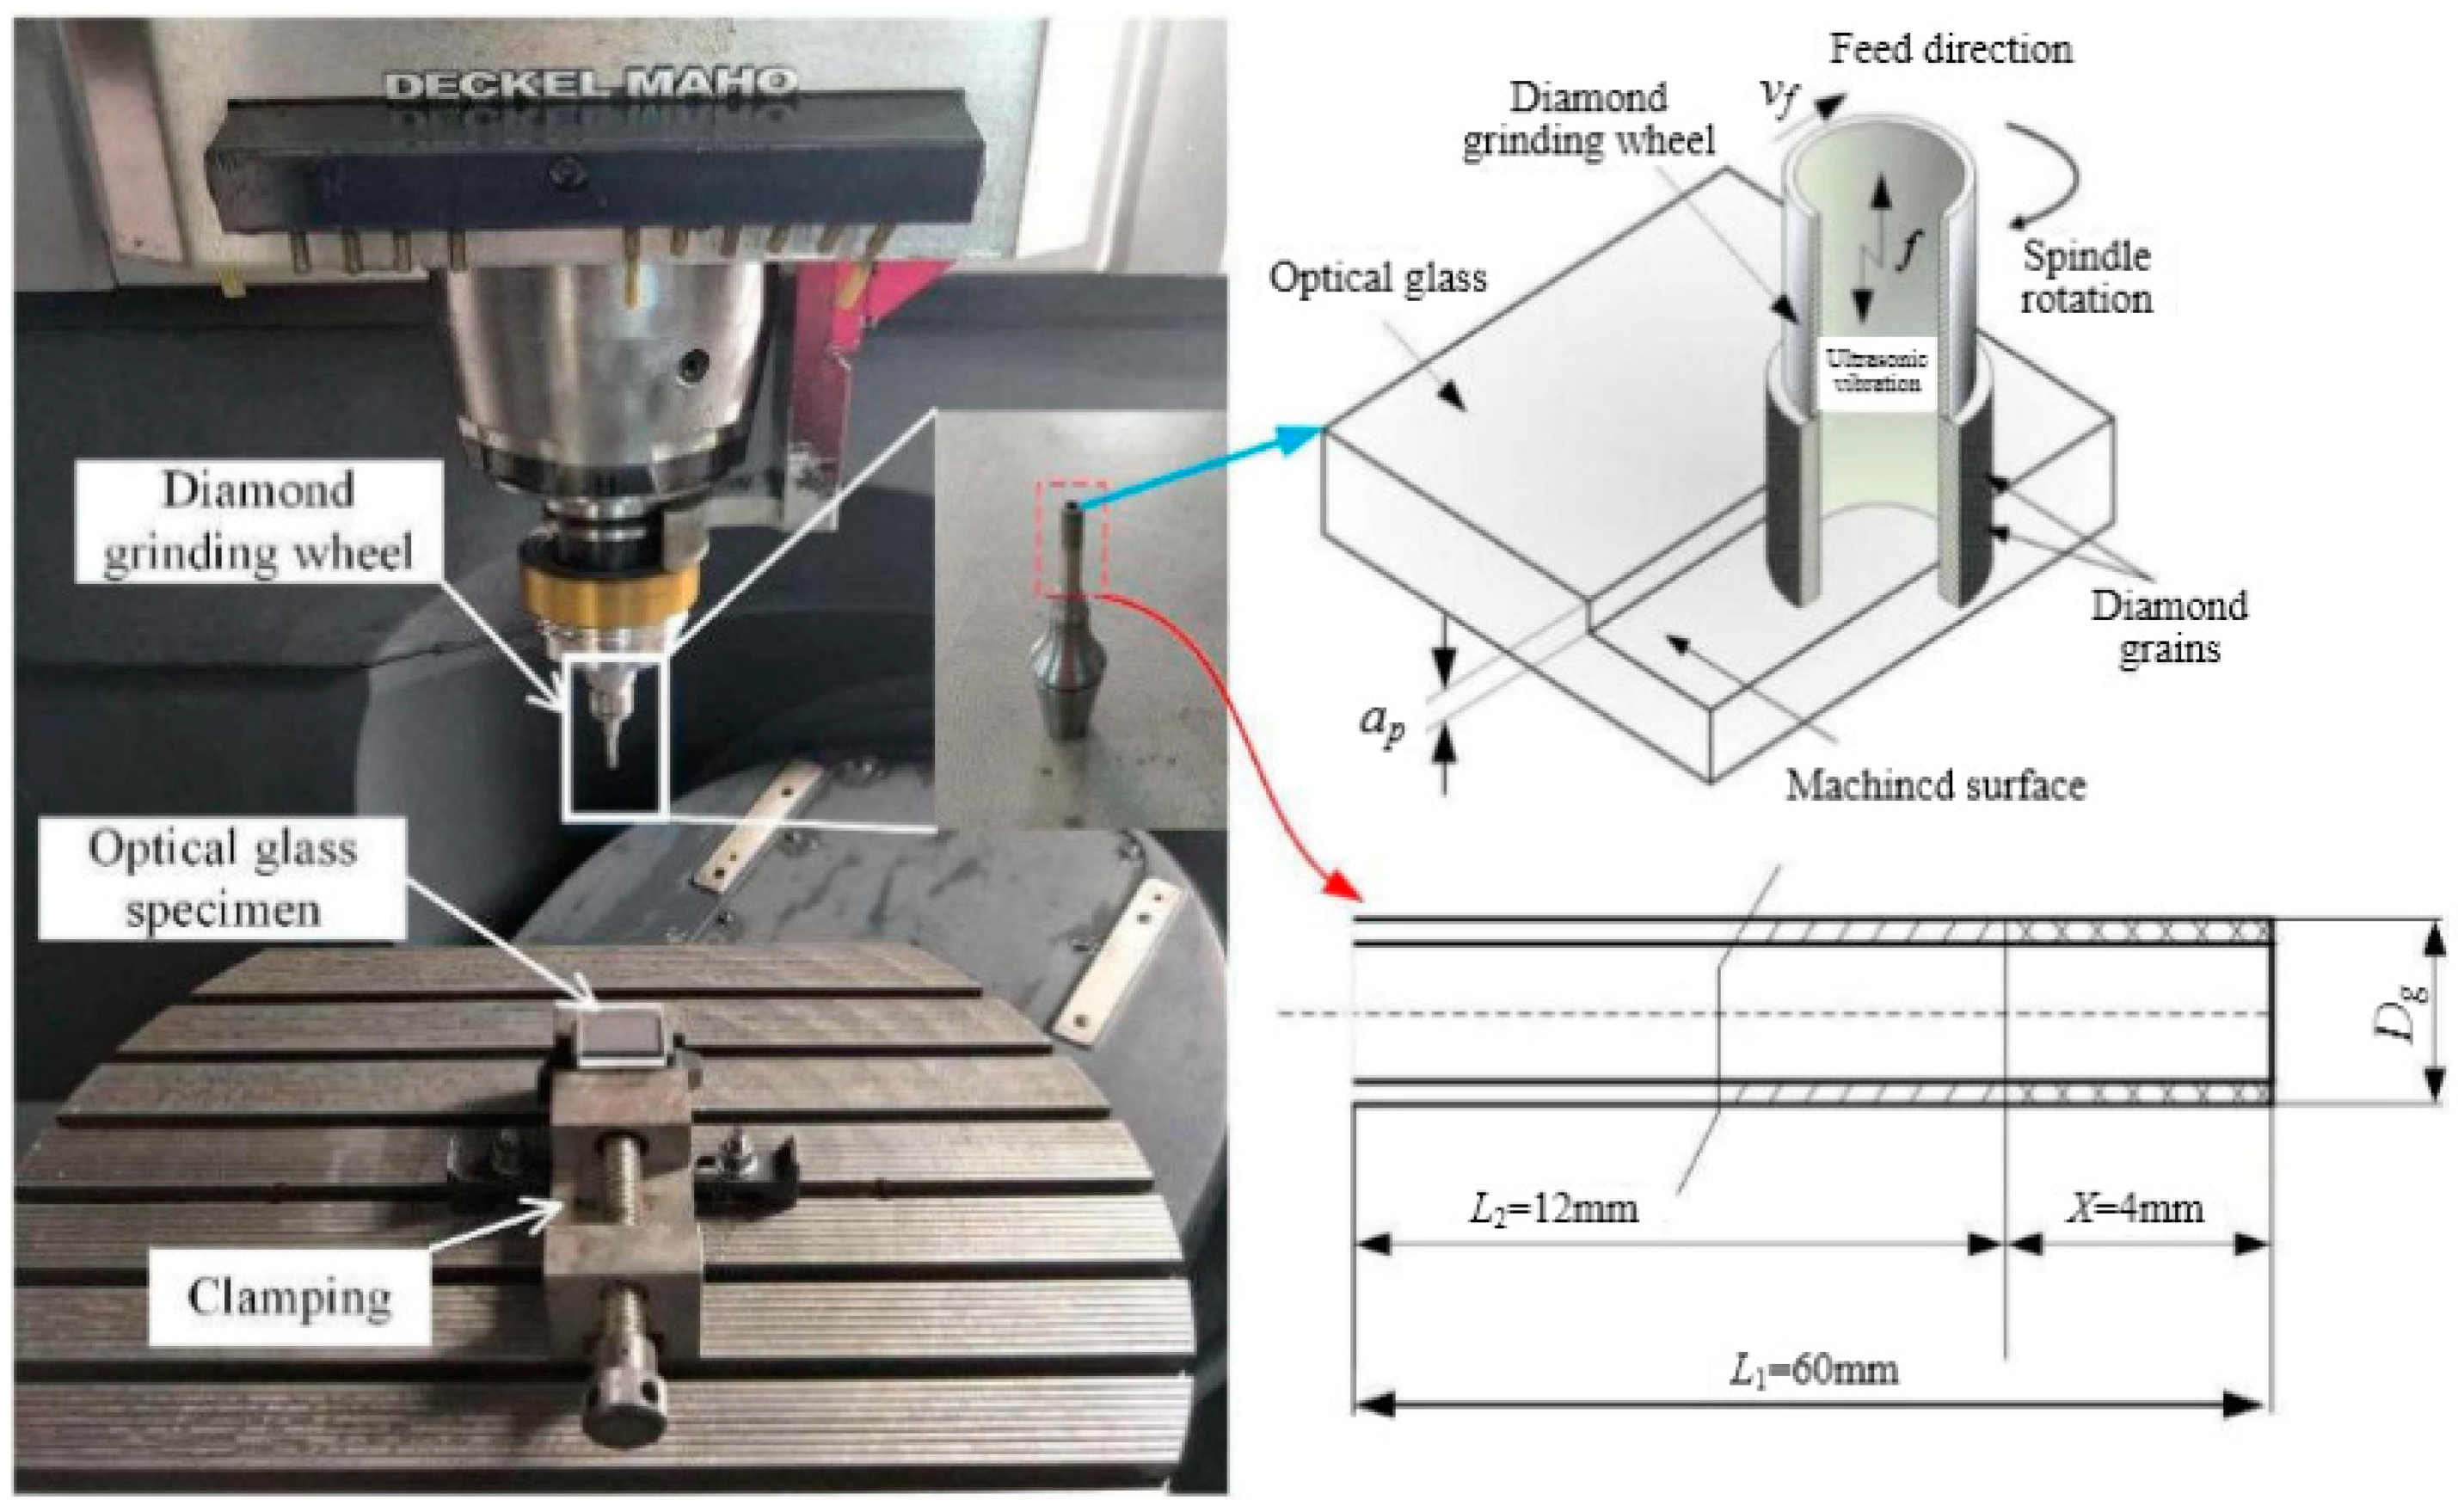
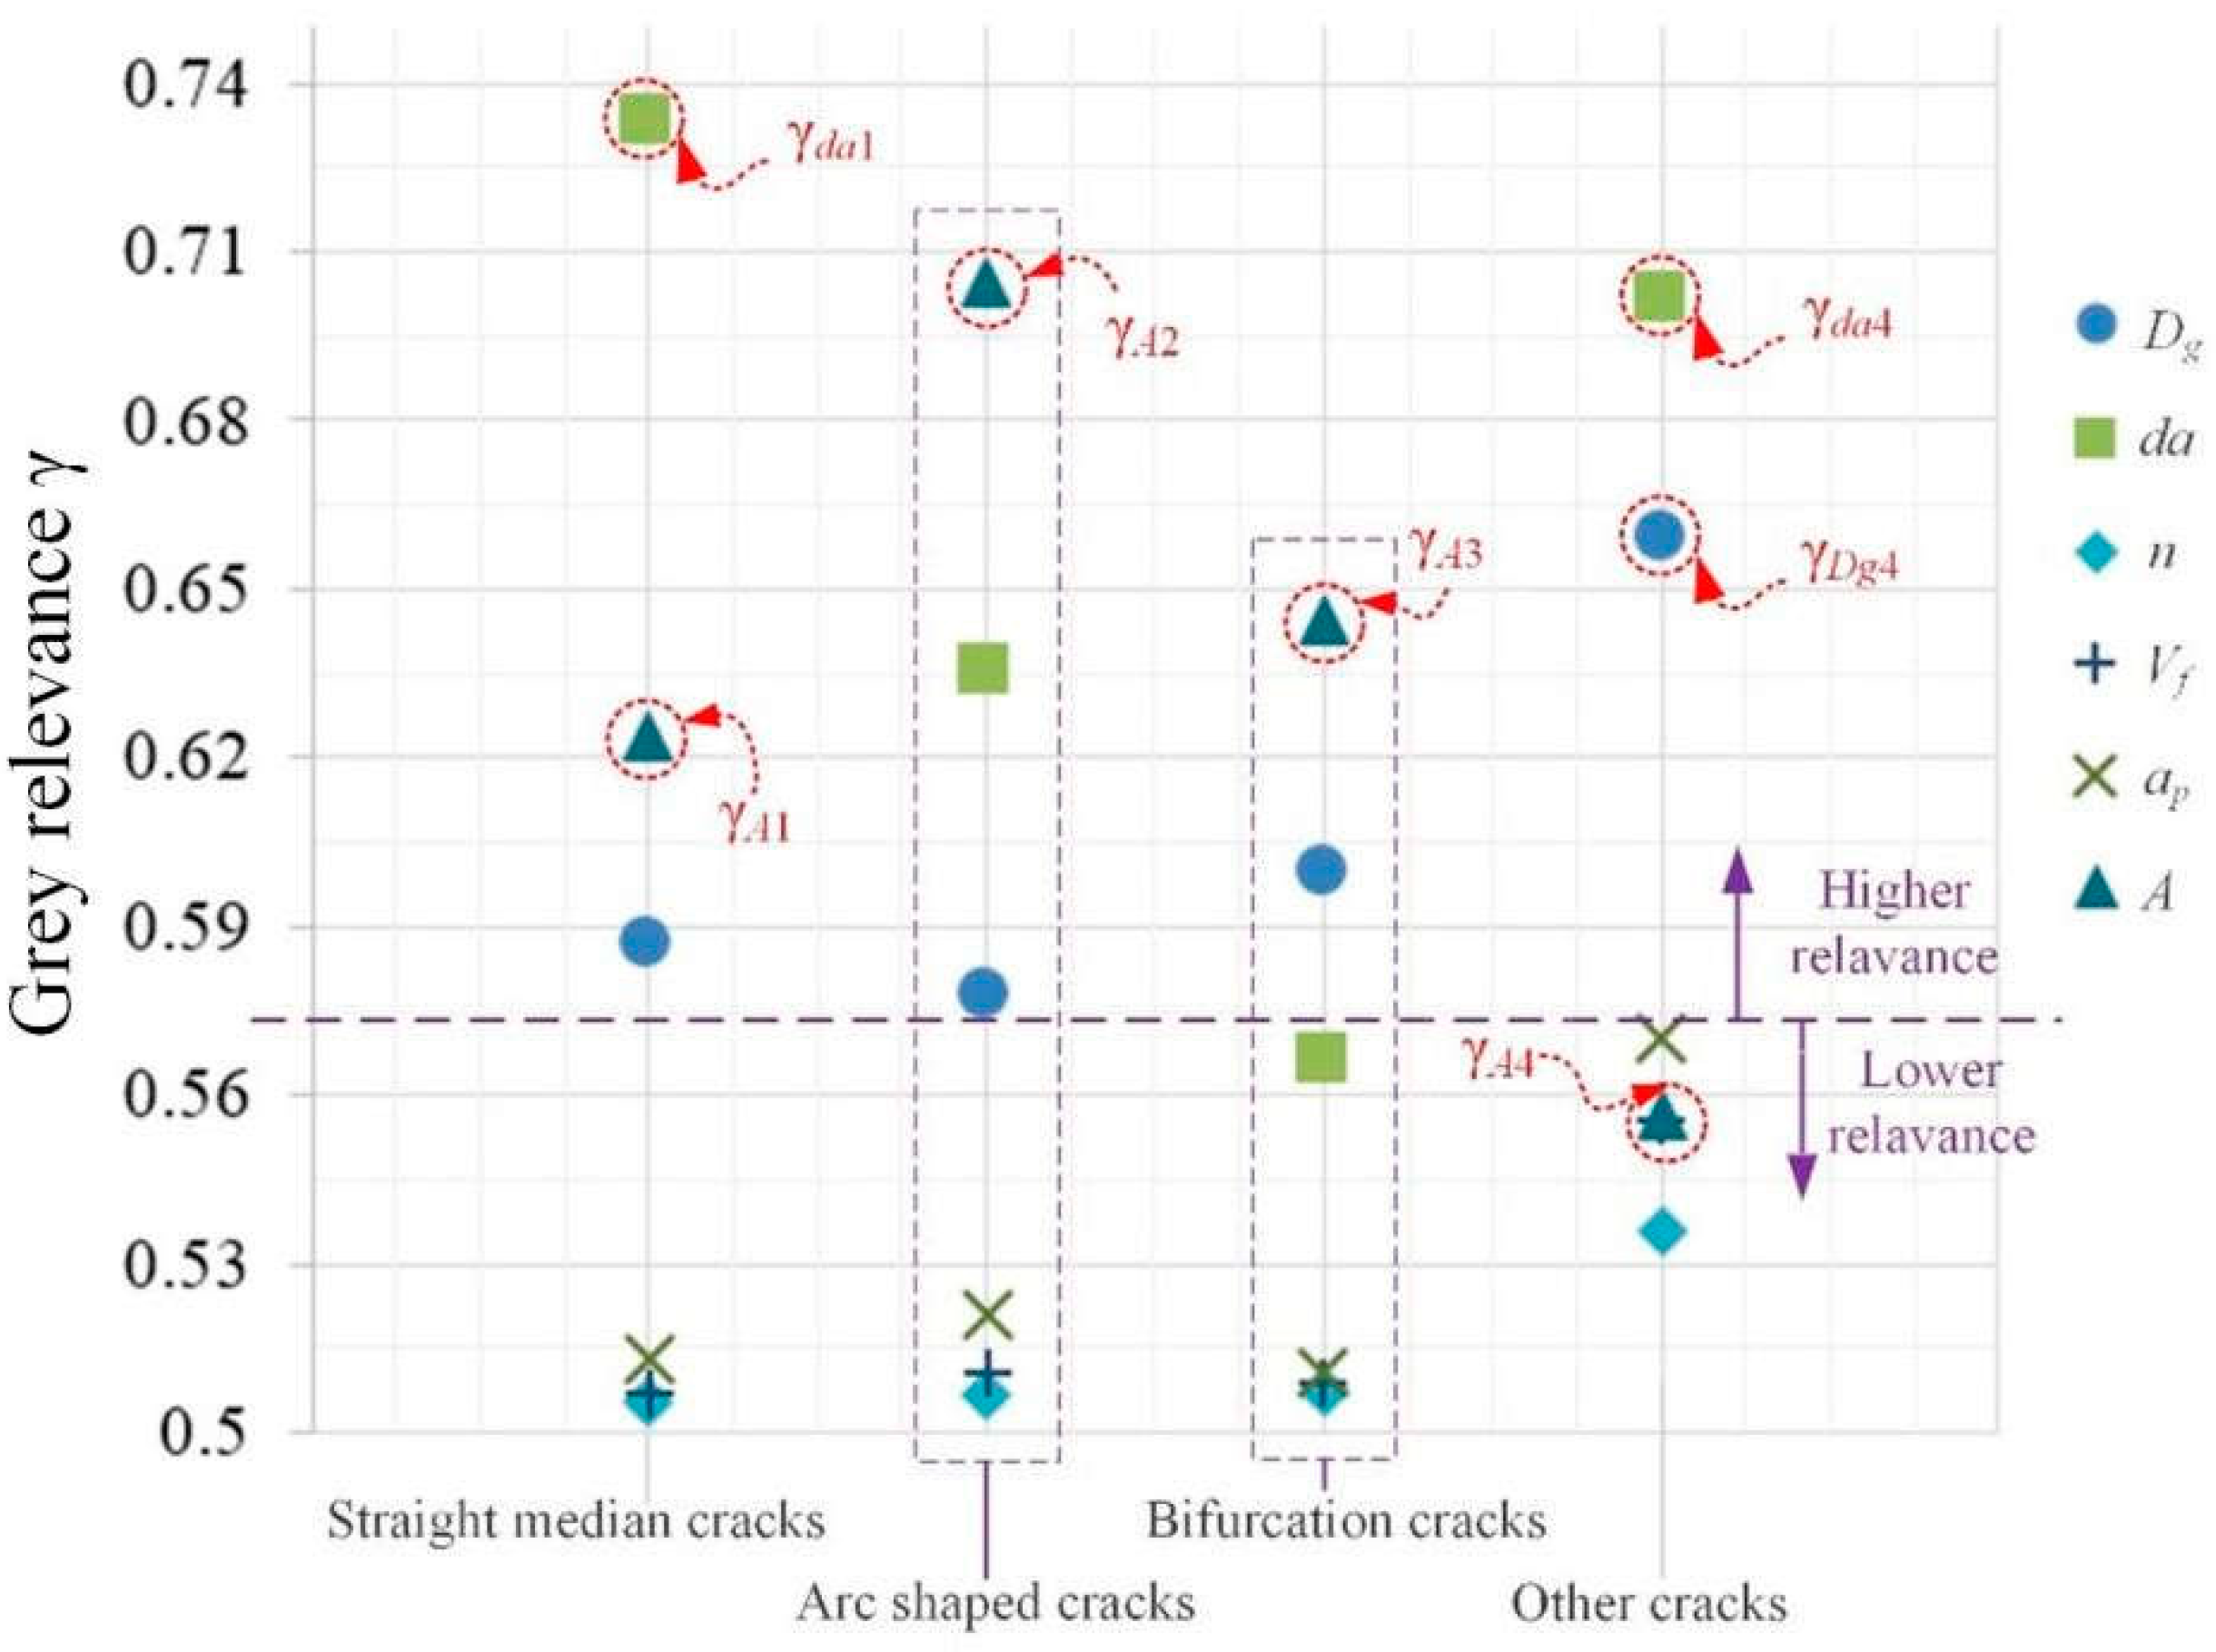
In this paper, the varying effects of each grinding process parameter and the ultrasonic vibration amplitude on the subsurface crack forms and distributions were innovatively investigated using the grey relational analysis, and the strengths of all influencing factors were determined. A prediction model for the MSSCD was developed using the weighted least square support vector machine (WLS-SVM) method. To validate the prediction accuracy of the proposed model, ultrasonic-vibration-assisted grinding experiments were conducted on BK7 optical glass samples.
4. Validation of Proposed Model
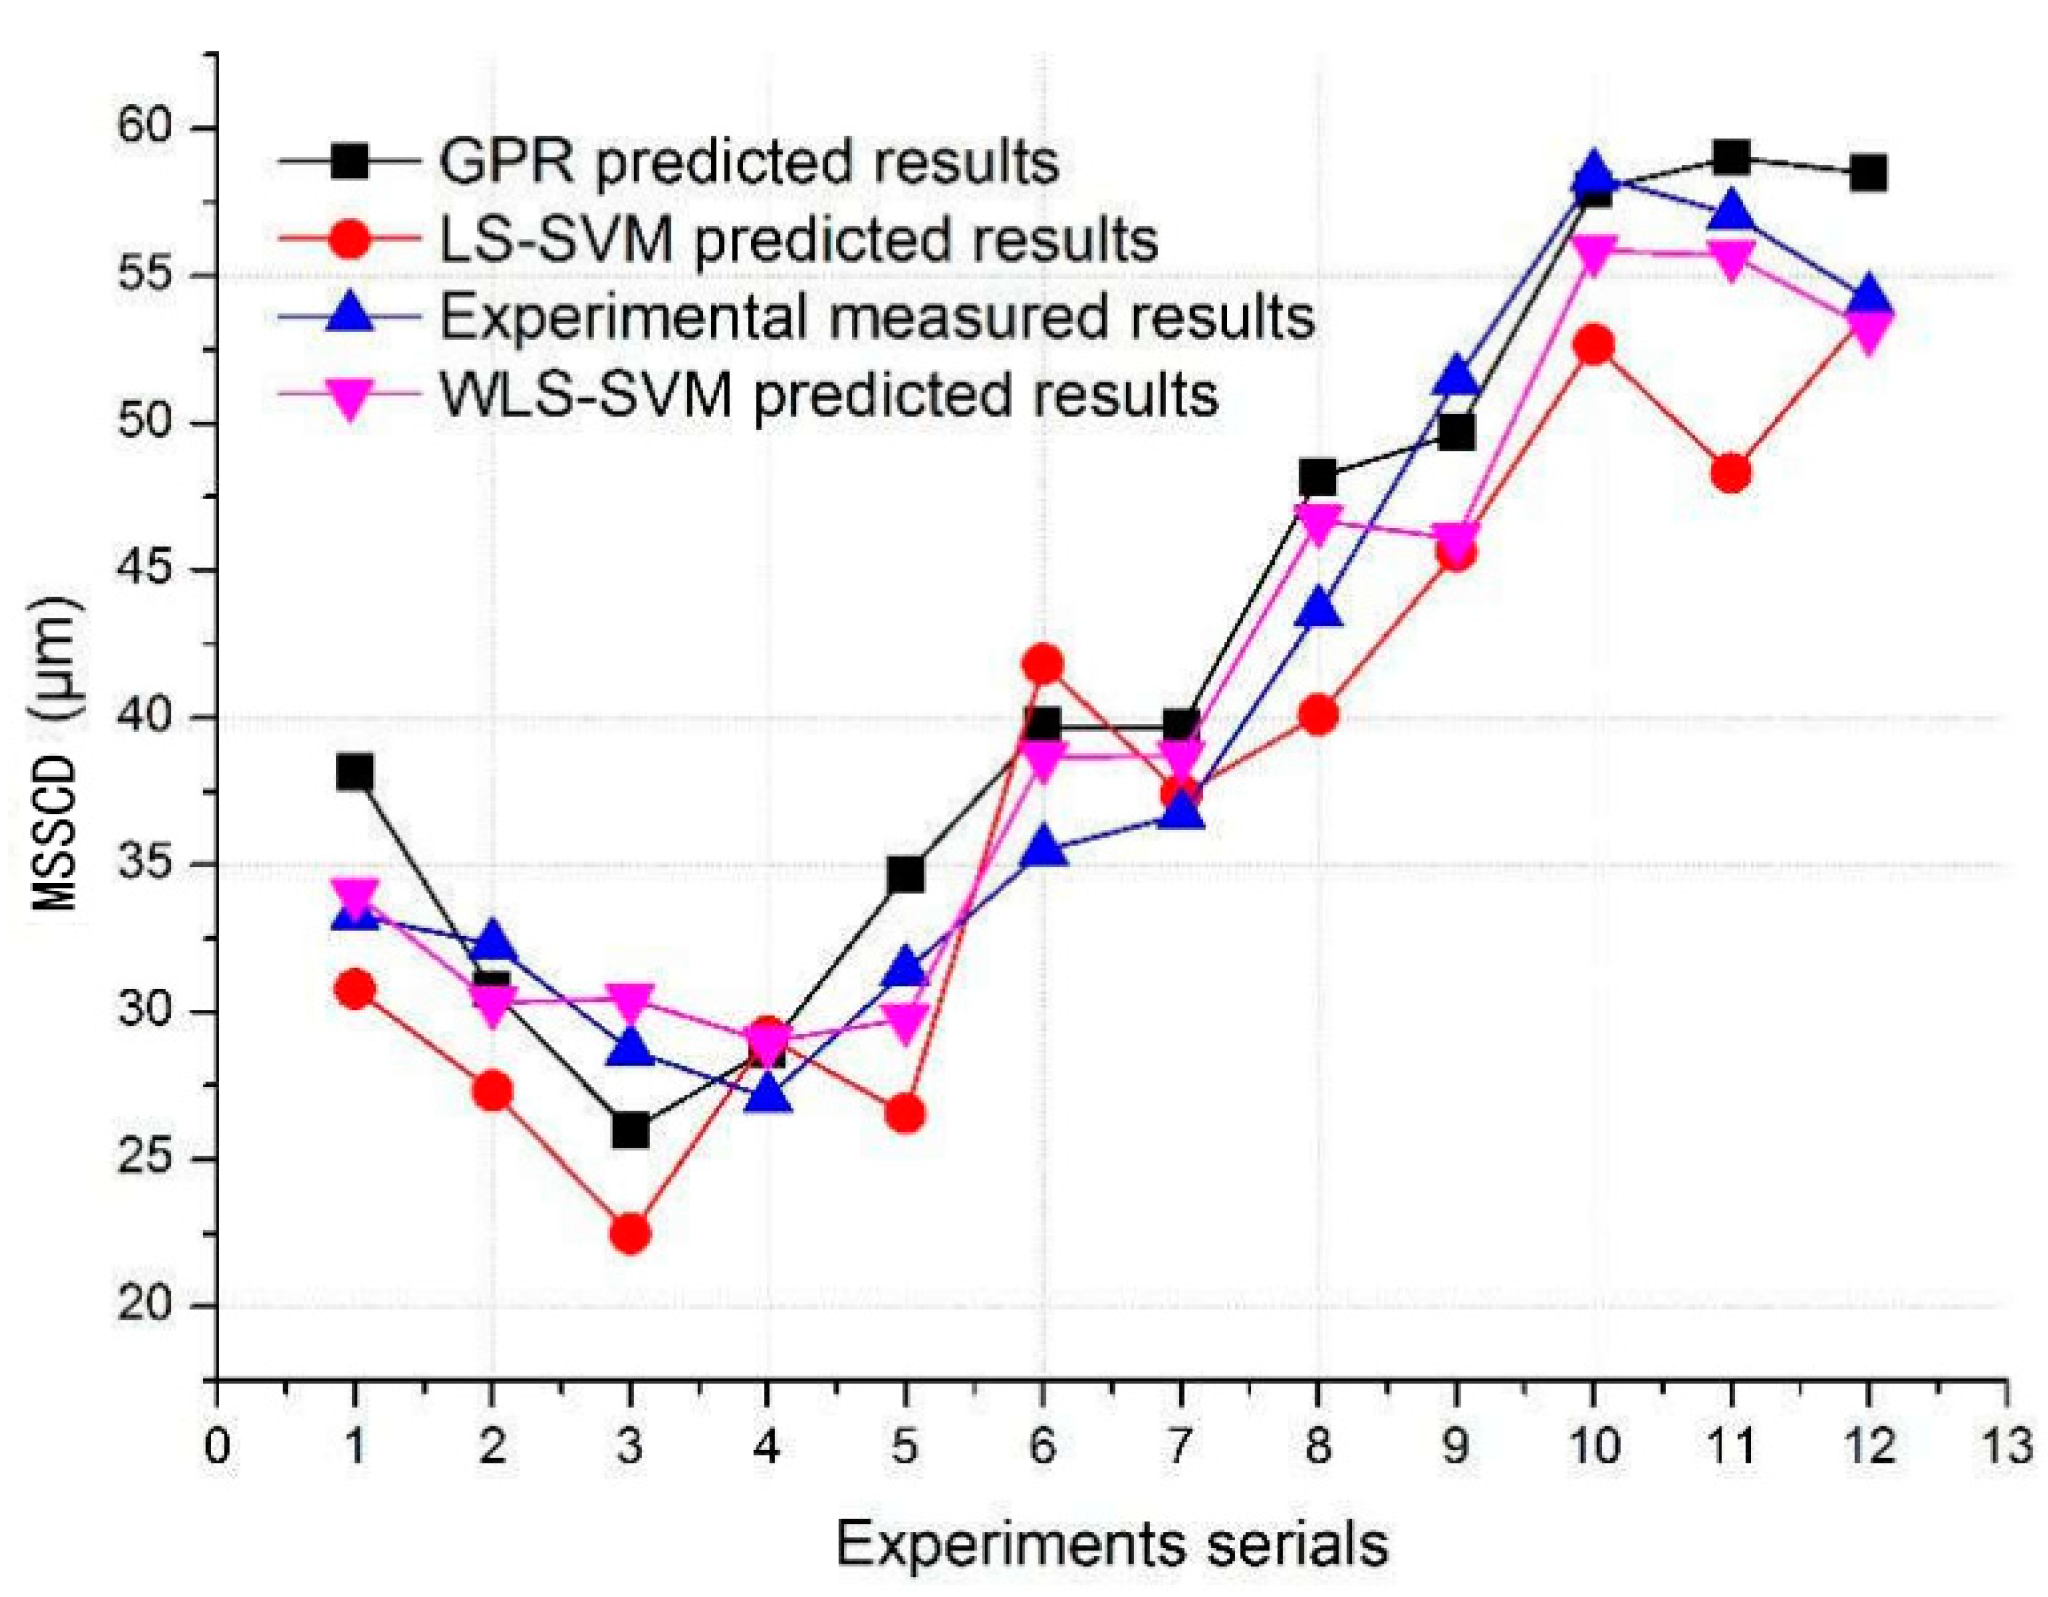
To validate the proposed model, 12 groups of ultrasonic-vibration-assisted grinding experiments on BK7 optical glass samples were carried out. The experimental specifications are shown in
Table 5. In order to comprehensively validate the prediction accuracy of the proposed model, the least square support vector machine (LS-SVM) and Gaussian process regression (GPR) method were both used to develop the prediction model for the
MSSCD. The prediction results are shown in
Figure 8.
To evaluate the accuracy of the model, it is necessary to calculate the error between the predicted and experimental results, which can be defined as follows:
The average relative error (
EAc) of prediction results can be expressed as follows:
From
Figure 8, it can be seen that all three types of prediction results have a similar trend as the experimentally measured values. Among them, 75% of LS-SVM predicted results are smaller than measured results, and 67% of GPR-based prediction results are bigger than the experimental results. That is, the LS-SVM and GPR models cannot match the experimental training data well, which causes most of the predicted results to deviate to one side. It can be easily seen from
Figure 8 that half of the WLS-SVM prediction results are bigger than experimental results, which means all the WLS-SVM predicted results are evenly distributed about the actual measurement data.
Table 6 shows the specific relative errors calculated by Equations (16) and (17). It can be seen from
Table 6 that the LS-SVM method without weighting factors has the biggest maximum relative error (21.72%, validation experiment 11), while that of the proposed model is the smallest (10.54%). This is likely because the essence of LS-SVM is to solve the convex quadratic programming problem and obtain its optimal global solution; the LS-SVM and GPR method both are well adapted to solve the problems of small sample data: non-linearity. However, when isolated nodes exist in training data which were caused by the differential influences of training input data on the output data, the prediction accuracy would decrease. Another possible reason is the spindle rotation speed in validation experiment 11 differed significantly from the other experiments, i.e., the diameter of grinding wheel and average diameter of abrasive grains in validation experiment 11 were both the largest of all. Since any combination of process parameters is treated as coordinates in a high dimensional space, the LS-SVM model could not accurately fit the three extreme values of coordinates. According to the influence strengths listed in
Table 4, the influence strength of spindle rotation speed is the smallest; thus, the proposed improved WLS-SVM model could reduce the disturbance of this process parameter combination.
Furthermore, the proposed model has the smallest average relative error (5.59%). A plausible reason for this is that the proposed model can better account for the different effects of the six process parameters and can fit the experimental validation data more accurately. The minimum relative error of the proposed model is the largest (1.8%) but is still considered acceptable. The predicted MSSCD values are in good agreement with the experimental results, which proves the high prediction accuracy of the proposed model.


