1. Introduction
The production of parts of non-circular cross-sections in machining is no longer a domain of milling. Such components can be efficiently produced by turning with the use of lathes fitted with an additional drive. This technology can be based on a rotating tool as in polygon turning [
1,
2] or a tool with feed motion operating in one [
3,
4,
5] or multiple axes [
6]. An example of such a process can be the manufacturing of middle-convex and varying ellipse pistons (MCVEP) widely used in diesel engines, which ensure better strain conditions and guidance quality than circular pistons [
7]. Other solutions concern polygonal shafts fabricated without halting the turning process. Driven tools with feed motion referred to as Fast Tool Servos (FTS) are usually controlled by electronic cams that couple the tool linear position with the part angular position following a strict mathematical relation. The technological requirements set for such tools usually exceed the dynamic capabilities of conventional servo drives (e.g., with an electric engine and ball-screw transmission) due to the difficulties with synchronizing the tool’s high-frequency reciprocating motion with the rotational speed of the spindle. Linear motion drives are a group that can potentially solve the dynamics issues to some extent. The solutions featuring high dynamics include the Voice Coil Motor (VCM) [
8,
9] or piezoelectric actuators. The latter is in the form of stacks and is characterized by high force, rigidity and dynamics. However, they exhibit a limited travel distance which is mostly related to the size of the stack, what can be troublesome in some physical application due to the limited available workspace in the machine. Solid flexures [
3,
4,
5,
6,
7,
10,
11,
12,
13,
14,
15,
16] reinforcement frames acting as rhomboids that enable achieving a millimeter long travel range but at the cost of deteriorating other performance parameters, especially force and rigidity.
An important feature of a piezoelectric drive is its hysteresis which affects the positioning accuracy while operating in an open-loop system. The hysteresis error can amount from several to over a dozen percent of the travel range of a drive unit with a piezoelectric stack. For open-loop systems, predictive methods based on inverse hysteresis models are used to minimize that phenomenon. The commonly used solutions include the Preisach model [
17] or its modifications [
18,
19,
20], models developed based on a physical analysis or phenomenological approach Jiles-Atherton [
21,
22], Bouc-Wen [
23,
24], Duhem [
25,
26] or NARMAX [
27,
28], direct [
29] or geometric models [
30]. A feedback loop in the form of an external position sensor is often used in FTS drives. Most common solutions include contactless laser or Eddy current transducers, or strain gauges used fitted directly within the piezoelectric stack.
The FTS drives can serve numerous functions in manufacturing. Their most important benefits include the high operating frequency, which enables active damping of the vibrations generated during the processing [
15] or generating additional precise tool motion [
31]. They can also offer a primary cutting motion for surface microtexturing [
4]. The high positioning accuracy along with the high resolution of the FTS piezoelectric drive is a good base for designing ultra-precise cutting tools [
3,
5,
6,
7,
10,
11,
12,
13,
14,
15,
16].
The FTS drives described in the literature are dedicated devices developed for a specific task, which enables obtaining drive operating at frequencies of 40–600 Hz [
3,
7,
11,
16], or even above 2 kHz [
10,
12] and positioning accuracy less than 0.3 µm [
3,
10,
16]. The aforementioned studies usually cover mathematical models of the drives, including FEM-based models, and provide primary dynamic specifications for the drive units, i.e., frequency specifications, their step responses, and responses to forced excitation deriving from the actual processing conditions. However, they usually do not enable working with various tool holders due to their designs. In addition, it must be emphasized that their designs are highly specialized as the drives are often integrated with tools as opposed to the solution presented in this study, in which a commercially available piezoelectric drive unit was adapted. This allowed for retrofitting a conventional turning lathe with the FTS drive unit relatively inexpensively to produce non-circular contours of complex shapes. The drive was designed to enable mounting of various tool holders while keeping in mind that changes in their weight will affect the drive frequency specification. Preliminary testing of the proposed tool design and verification involving the turning of non-circular contours for various operating frequencies were conducted. Then, in order to quantify the results of as-machined geometries [
32,
33], a coordinate measuring machine (CMM) was used to conduct an off-line determination of the machining accuracy as well as to verify if the online measurement system provides the fidelitous measurements of as-turned contour geometry.
2. Materials and Methods
2.1. Design of FTS Drive and Test Stand
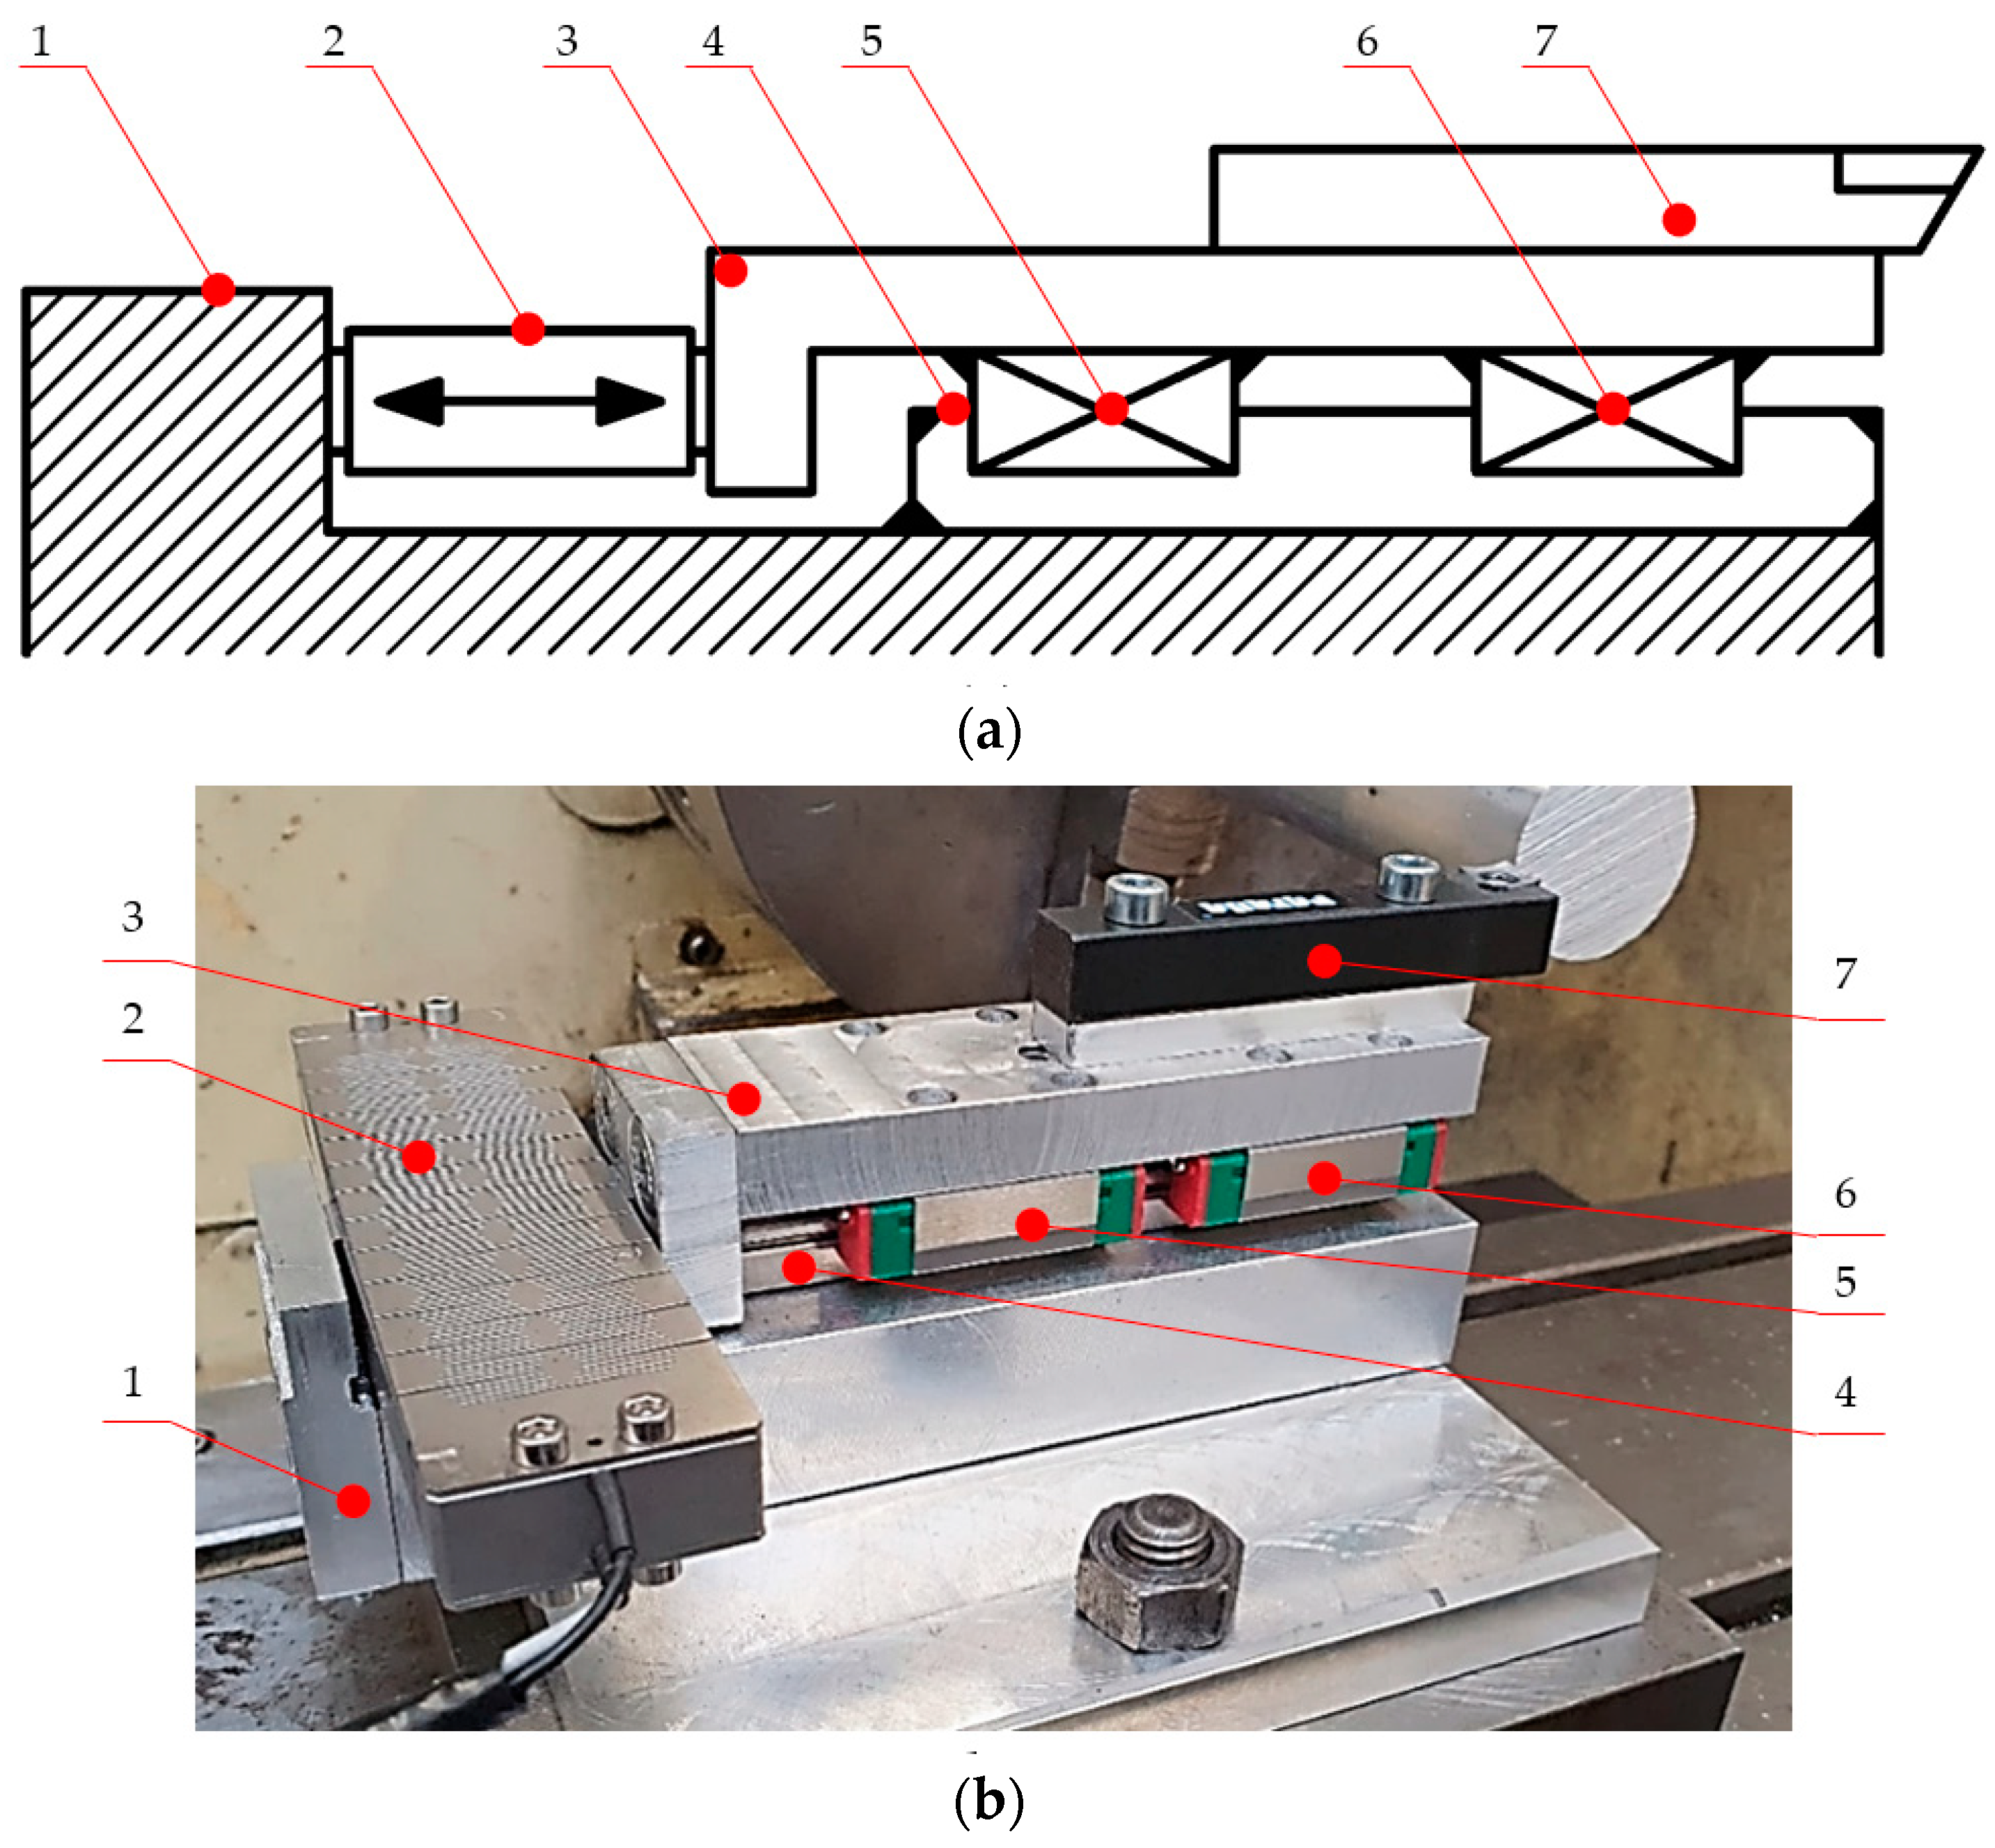
The developed drive intended for non-circular turning was designed based on the PiezoMove P-602.8SL series unit from PI-Ceramic including the E-625.SR dedicated servo amplifier. The drive is a piezoelectric stack equipped with a motion amplifier integrated with flexure guides. The feedback loop included a strain gauge integrated with the stack. The travel range amounted to 1000 µm with a linearity error of 1.5%, as stated by the manufacturer. The force generated by the drive unit was 100 N in the pushing and 5 N in the pulling direction. The drive unit with the mounted turning tool was attached to the carriage using mounting screws. The carriage could move along the EGR15-T guide rail with two EGH15CA carriages from Hiwin. The entire assembly was placed in the turret of the TUM-35D conventional turning lathe from Famot Pleszew (currently part of DMG MORI Group) in a manner ensuring that the height of the turret and the piezoelectrically driven tool corresponded to the height of the conventional tool. The kinematic diagram and the overview of the drive are presented in
Figure 1.
The angular position of the lathe spindle was monitored using the MHK-40 incremental encoder from Megatron, the outputs of which were connected to the counter inputs of the Siemens S7-1200 PLC controller. Based on the current angle and machined geometry, the controller calculated and sent the corresponding voltage signal to the servo drive. The FTS position was registered by optoNCDT ILD-1700-10 (NCDT) laser sensor from Micro Epsilon, the input of which was connected to the MGC+ measurement amplifier from HBM. The design of control and measuring systems are presented in
Figure 2.
2.2. FTS Position Error Compensation
Prior to turning tests, it was necessary to linearize the FTS positioning characteristics, which were unfavorably influenced by the piezoelectric inherent non-linearity and by errors from the DAC (digital/analog converter) of PLC. The compensation procedure involved, firstly, conducting a positioning accuracy test with the use of the Renishaw XL80 interferometer in accordance with ISO-230-2 standard for linear axes with a length not exceeding 2000 mm (test consisted of five bidirectional measurement cycles), with a travel range of 0 ÷ 1000 µm, stop intervals of 100 µm. An additional overrun of 100 µm for the first and last positions within the range was assumed. The measured deviations between real and set positions are shown in
Figure 3a. A 6th order polynomial relation was found to fit best (
R2 = 0.9897) when regressed mean values of measured positions for all 11 individual locations. The positioning compensation polynomial took the following form:
Ultimately, the signal controlling the FTS position was the difference between the preset value and the polynomial value for the preset value of
x. The positioning accuracy tests were repeated after implementing the FTS error compensation. The results of the positioning accuracy test prior to and after compensation acc. to ISO-230-2: mean reversal error
, range of mean bidirectional positioning error
M, systematic positioning error
E, positioning repeatability
R and positioning error
A are presented in
Table 1.
Compensation of the non-linear positioning characteristics of the piezoelectric drive and PLC allowed for significant reduction of errors and improving accuracy (
Figure 3b). The polynomial model included in the compensation method facilitated the substantial change in the values of the mean bidirectional positioning error
M, systematic positioning error
E, and positioning error
A, which is presented in
Table 1.
The next preparatory step was to designate the drive frequency response. The position measurements were conducted using the XL80 interferometer for a sine curve with an amplitude of 10 V and frequency range from 1 to 100 Hz. Then, the amplitudes from 10 consecutive periods were averaged for each conducted measurement. The test results are presented in
Figure 4.
For a frequency lower than 8 Hz, the drive position amplitude is constant and equal to 1000 µm. This limit is consistent with the manufacturer’s specification. Above that frequency, the amplitude starts to decline with the dynamics of 4320 µm per decade for a frequency below 20 Hz and 590 µm per decade above this frequency. This phenomenon limits the maximum cutting depth of the tool for the machining of complex geometries at a high cutting speed.
2.3. Verification Tests
The developed device was verified by assessing the dimensional accuracy of machined shapes. The objective of those tests was to measure the deviation of the contour obtained in the turning process with the use of the FTS from an ideal shape for various spindle rotational speeds and geometries. The shapes taken into account in the tests (
Figure 5) were generated by superimposing the sinusoidal movement of the tool on the base circle with a frequency that is a multiplication of the spindle rotation frequency. A change in the spindle rotational speed and in the contour shape influence piezoelectric drive operating frequency (
Table 2). The machined material was 6082 aluminum in a form of a shaft of 35 mm diameter. Each attempt featured a recording of the excitation signal for the FTS. The tool position was measured using the laser transducer. When the machining was completed, the geometries of the samples were measured using the DEA Global 7.7.5 coordinate measuring machine (Hexagon Metrology). Its maximum permissible error for length measurement MPE
E was ±(1.5 +
L/333) µm, where
L is the measured length expressed in mm and the maximum permissible Error for probing MPE
P was equal to 1.5 µm.
2.4. Measurement Data Processing
The data obtained from the tool position measurement while turning and the verification measurements of the obtained shapes with the use of the coordinate measuring machine differed not only in terms of the registration method but also in structure (deemed as the method of structuring data in a file) as well as in the number of samples due to different sampling rate and domain (angle and time). The laser transducer recorded the tool position over time during processing at a rate of 2600 samples/s. The resulting data from the coordinate measuring machine constitutes a set of coordinates corresponding to the sample cross-section. In order to compare the results, it was necessary to unify their structure. The first step was to convert the coordinates stored in the measurement files from cartesian into polar coordinates. In the case of the CMM measurements, the angular interval in the polar coordinates was not constant. Therefore, the next step was to oversample the measurements to obtain the same number of measurement points in both data sets. The spline interpolation algorithm was used for this purpose. Then, in order to keep only the harmonics describing the surface waviness in the signal, a digital low-pass filter was applied to the limit frequency equal to fifty times the base harmonic (of the nominal shape). The examples of deviation as a function of angular orientation prior to and after applying the filter for the as-measured contour are presented in
Figure 6.
Finally, the results were compared using the best fit algorithm to align the measurement data to the reference considering the measurement contour center displacement by angle ψ and radius
r and contour rotation by angle
β. The algorithm assumes obtaining the minimum width of the deviation from the nominal profile zone defined as the difference between the largest and smallest deviations. The examples of data prior to and after alignment are presented in
Figure 7.
3. Results
The test results, demonstrating the deviations between the reference profile and its actual representation obtained from the measurement during the processing and reference measurements using the CMM, are presented as plots of the magnified 20× or 50× error superimposed on the reference contour in polar coordinates and in the domain of angle α in Cartesian coordinates specified for all samples. From visual inspection of the graphs, it can be noticed that the measurement conducted during the processing remains similar and differs only slightly from the CMM results. These differences are quantified statistically. The plots corresponding to the measurement of samples S1.2, S2.3, and S4.2 are presented in
Figure 8,
Figure 9 and
Figure 10, respectively.
The discrepancies in the deviation measurement result from the assumed measurement technique and its accuracy. It must be noted that the tool position measurement while processing is influenced by additional errors that are caused by phenomena occurring during the processing, e.g., vibration in the machine tool, tool holder, shaft and lathe, build-up edge effect, etc.
Table 3 and
Figure 11 present the statistical measures for the geometric deviations for both measurement methods
eCMM (from off-line coordinate measurement machine) and
eNCDT (from on-line laser transducer): arithmetic mean
m, standard deviation
s, minimum
min, first quartile
Q1, median
Me/
Q2, third quartile
Q3, and the maximum value.
For sample no. S1.4, the tool position recorded by the optical laser NCDT sensor was influenced by a gross error due to the contamination of the sensor face with dirt. These results were excluded from further considerations in this work. The maximum mean shape deviation recorded during the tests amounted to 34.29 µm, its standard deviation amounted to 35.10 µm. The maximum and minimum deviations were 82.86 µm and −60.61 µm, respectively. It can be noticed that variation in differences between both measurement techniques grow with FTS operating frequency when it exceeds 9 Hz, which is the limit operational frequency of the piezoelectric drive.
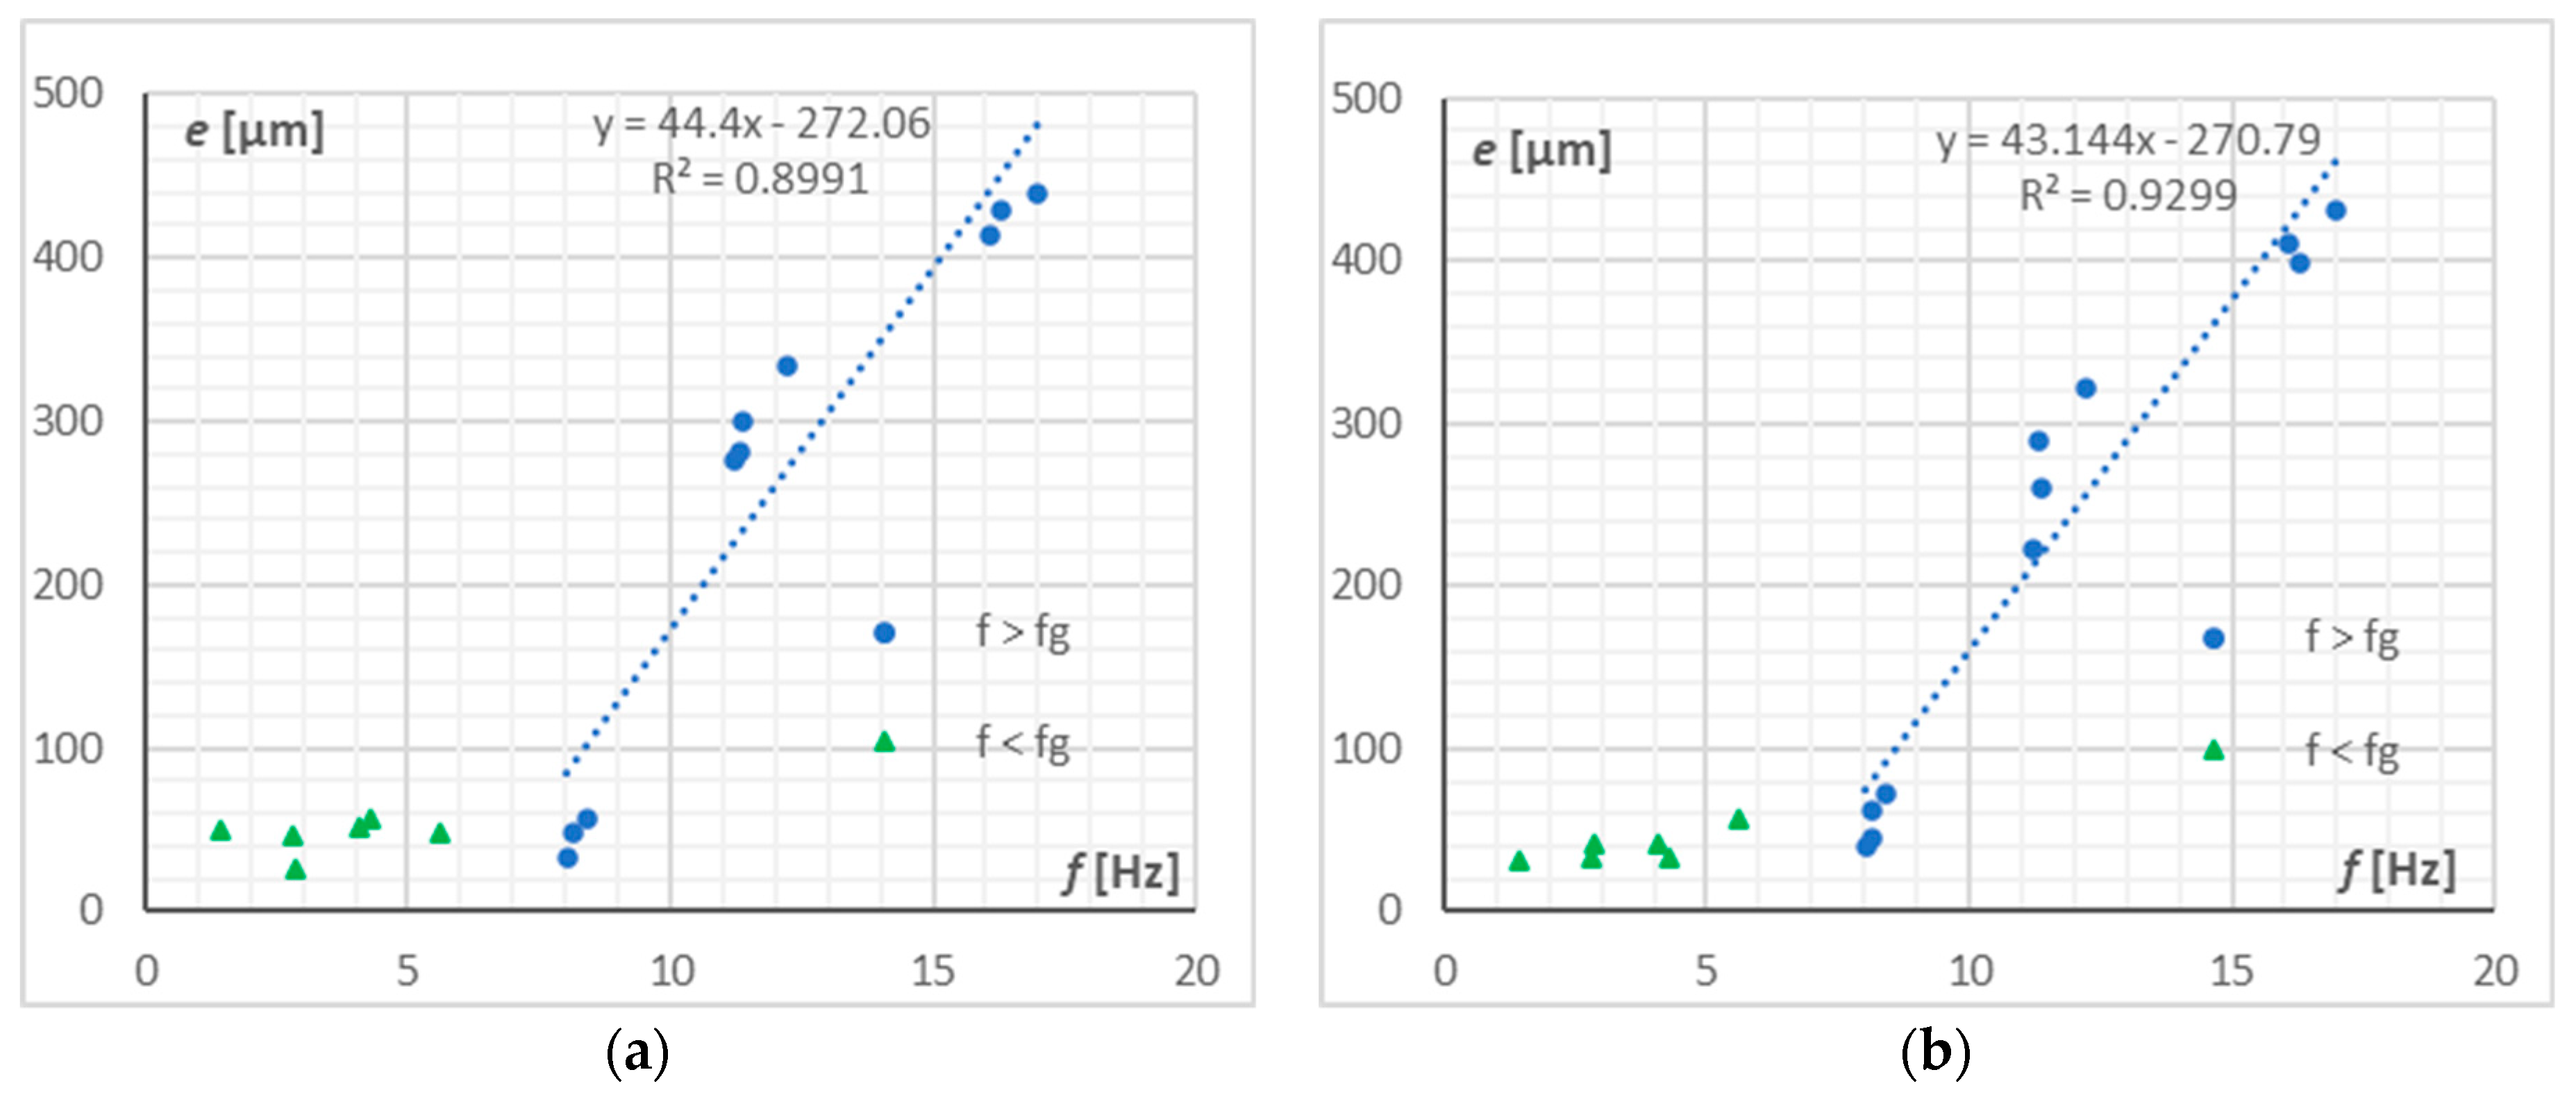
The obtained profile deviation from an ideal shape and the standard deviation from the mean were designated for each measurement series. The data are visualized in the form of two groups. The first, tagged with green triangle markers, includes test results for which the FTS operating frequency did not exceed the limit frequency
fg equal to 9 Hz. The second group, tagged with blue circles, includes the results for which the frequency exceeded the limit value. The results are presented in
Figure 12 and
Figure 13.
The results demonstrate a strong correlation between the frequency and the profile deviations for trials conducted at operating frequency f higher than the limit frequency fg. Depending on the measurement method, the determination coefficient R2 for the line profile offset is higher than 0.8991 and its minimum value of standard deviation amounts to 0.9191. The linear growth in the error is potentially caused by system inertia which is critical for higher frequency and the limitation of the piezoelectric stack.
Due to the use of a conventional turning lathe (with a limited number of spindle speed settings), for frequencies higher than the limit, the obtained FTS operating frequencies are grouped around three values: 8.2, 11.5, and 16.5 Hz. Changes in the drive amplitude of motion Δ
x were registered for these frequencies and compared with the profile deviations
averaged for the specified frequency ranges. The results are presented in
Table 4.
For the trials conducted at the frequency below the limit value, both the profile shape deviation and the standard deviation were approximately constant and no correlations between them and the frequency were observed. The mean values
, maximum values
emax, and their standard deviations s
e for both the profile deviation and its SD are presented in
Table 5.
For the FTS drive operating frequency—lower than the limit frequency—the mean values, maximum values, and standard deviation for both the profile deviation and its standard deviation are similar in numbers. Therefore, the determination coefficient
R2 was designated for the results obtained using the optical transducer testing the tool position during processing and compared with the results obtained during the coordinate measuring machine test. This test was aimed at checking whether the online tool position measurement during processing can be the basis for a preliminary determination of the obtained profile deviation. The results in the form of a plot are presented in
Figure 14.
Despite the fact that the spindle position measurement during the processing is influenced by errors deriving from the turning process (vibration, build-up edge, etc.), the measurement allows for the satisfactory determination of as-machined contour geometry without additional off-line measurements (e.g., by CMM). This is confirmed by the high determination coefficients R2 showing linear relation between profile errors measured on- and offline.
4. Discussion
Machining of non-circular contours is possible with the use of lathes, but the tool must be additionally driven and controlled while processing in order to obtain the assumed shape. Conventional tool feed drives do not provide sufficient dynamics due to the high weight of the entire assembly. This niche is filled by FTS used commonly in this type of application, but they are strictly specialized solutions. They are usually built on the basis of a stacked piezoelectric drive with a backlash-free transmission to which the cutting tool is directly mounted. Such a solution provides high dynamic parameters but limits the possibility of changing the tool type, and due to the dedicated structure, it can be characterized by a high price. The use of general-purpose components (piezoelectric drive, linear guides, and universal tool holders) allows building a device for manufacturing non-round shapes, but fulfilling its task for limited cutting speeds.
An additional aim of the research was to check whether it is possible to estimate the deviation of the part contour based on registering the position of the tool during machining. In this study, it was found that positioning accuracy A of the drive after its compensation (including the analog control circuit) does not exceed 2.533 µm, which is a value close to the linearity of the drive characteristic declared by the manufacturer. The results of the contour deviation do not exceed 40 µm.
The results obtained during the verification tests allow for the conclusion that it is possible to equip a conventional turning lathe with the FTS to produce parts of non-circular contours. The tested configuration allowed for maintaining the profile deviation in relation to the nominal shape of e = 39.8 µm with the standard deviation of se = 9.9 µm for the drive operating frequency lower than the limit frequency. After exceeding the limit frequency, the drive travel range Δx contributed to an increased deviation from the ideal geometry. The values provided in the context of using a conventional turning lathe should be considered satisfactory. In the analyzed cases, the deviations tested with a laser sensor demonstrated high convergence with the results obtained when conducting the tests with a coordinate measuring machine—the determination coefficient R2 for the linear regression between the errors calculated for those two methods was 0.987. This fact enables the assumption that such a measurement can quickly and inexpensively allow estimation of as-machined geometry of contour without additional off-line measurements.
The main limitation of this study was the use of a conventional lathe. The construction of the spindle drive does not allow continuous control of its speed. The use of an asynchronous motor as the main drive additionally influences the actual rotational speed, which deviates from the setting. Maintaining the assumed nominal diameter of the shape has also proved problematic due to the manual control of the lathe.
Future research will focus on eliminating the most problematic components of the test stand by replacing the conventional lathe with a modern numerical machine tool in order to increase the possibility of controlling the spindle speed, using a faster control system, and extending the research plan with surface texturing. In addition, the plan includes testing with the use of a device intended for measuring shape offsets, i.e., a form tester.
All things considered, it is possible to manufacture non-circular contours using a conventional lathe and an FTS drive, but the accuracy of the parts obtained in this way is limited by the operating frequency of the piezoelectric stack. From the practical perspective, it is possible to estimate this deviation on the basis of in-situ measurements carried out during this technological operation.
5. Conclusions
The detailed conclusions of this work are as follows:
It is possible to retrofit a conventional lather with an FTS drive, which is made of commercially available components to turn non-circular shapes.
The maximum operational frequency of the developed drive was 8 Hz.
The maximum shape offset was found to be 39.8 µm, which is acceptable for not ultra-precise applications. The error can be potentially reduced if a modern CNC lathe is used instead of a conventional machine.
It is possible to use the laser measurement of the FTS position during machining in order to reliably estimate the accuracy of manufactured parts of non-circular contours. The test results between CMM and laser sensor exhibit a strong correlation between each other (R2 = 0.9868) when regressed linearly.
Author Contributions
Conceptualization, M.P., W.P. methodology, M.P., B.G.; software, M.P.; validation, M.P.; formal analysis, M.P., B.G.; investigation, M.P., B.G., W.P.; resources, M.P., B.G.; data curation, M.P.; writing—original draft preparation, M.P.; writing—review and editing, M.P., B.G.; visualization, M.P.; supervision, M.P. All authors have read and agreed to the published version of the manuscript.
Funding
This research was funded by the Polish Ministry of Science and Education as a part of research subsidy, project number: 0614/SBAD/1547.
Institutional Review Board Statement
Not applicable.
Informed Consent Statement
Not applicable.
Data Availability Statement
The data presented in this study are openly available in Zenodo at doi:10.5281/zenodo.5206383.
Acknowledgments
We would like to thank Tomasz Bartkowiak for his thoughtful comments during the research and for proofreading the manuscript.
Conflicts of Interest
Authors declare no conflict of interest.
References
- Ghionea, A.; Catrina, D.; Predincea, N.; Parpală, L. Generation Features of Polygonal Areas on Lathes. Recent 2009, 10, 281–284. [Google Scholar]
- Razumov, M.; Grechukhin, A.; Pykhtin, A. Determination of Shape Errors during Polygonal Turning of Polyhedrons with an Odd Number of Faces. Procedia Eng. 2016, 150, 844–848. [Google Scholar] [CrossRef]
- Woronko, A.; Huang, J.; Altintas, Y. Piezoelectric tool actuator for precision machining on conventional CNC turning centers. Precis. Eng. 2003, 27, 335–345. [Google Scholar] [CrossRef]
- Kurniawan, R.; Ko, T.J. A study of surface texturing using piezoelectric tool holder actuator on conventional CNC turning. Int. J. Precis. Eng. Manuf. 2013, 14, 199–206. [Google Scholar] [CrossRef]
- Ma, H.; Hu, D.; Zhang, K. A fast tool feeding mechanism using piezoelectric actuators in noncircular turning. Int. J. Adv. Manuf. Technol. 2005, 27, 254–259. [Google Scholar] [CrossRef]
- Yang, J.; Rao, P.; Chen, B.; Ding, H.; Ai, W. Form error on-line estimation and compensation for non-circular turning process. Int. J. Mech. Sci. 2020, 184, 105847. [Google Scholar] [CrossRef]
- Wang, H.; Yang, S. Design and control of a fast tool servo used in noncircular piston turning process. Mech. Syst. Signal Process. Piezoelectric Technol. 2013, 36, 87–94. [Google Scholar] [CrossRef]
- Tao, Y.; Chen, Y.-L.; Hu, P.; Ju, B.-F.; Du, H. Development of a voice coil motor based fast tool servo with a function of self-sensing of cutting forces. Precis. Eng. 2020, 65, 130–137. [Google Scholar] [CrossRef]
- Trumper, D.L.; Lu, X. Fast Tool Servos: Advances in Precision, Acceleration, and Bandwidth; Kimura, F., Horio, K., Eds.; Towards Synthesis of Micro-/Nano-Systems; Springer: London, UK, 2007; pp. 11–19. [Google Scholar] [CrossRef]
- Zhu, W.-H.; Jun, M.; Altintas, Y. A fast tool servo design for precision turning of shafts on conventional CNC lathes. Int. J. Mach. Tools Manuf. 2001, 41, 953–965. [Google Scholar] [CrossRef]
- Tian, Y.; Shirinzadeh, B.; Zhang, D. A flexure-based mechanism and control methodology for ultra-precision turning operation. Precis. Eng. 2009, 33, 160–166. [Google Scholar] [CrossRef]
- Zhao, D.; Zhu, Z.; Huang, P.; Guo, P.; Zhu, L.; Zhu, Z. Development of a piezoelectrically actuated dual-stage fast tool servo. Mech. Syst. Signal Process. 2020, 144, 106873. [Google Scholar] [CrossRef]
- Xu, W.; Wu, Y. Piezoelectric actuator for machining on macro-to-micro cylindrical components by a precision rotary motion control. Mech. Syst. Signal Process. 2019, 114, 439–447. [Google Scholar] [CrossRef]
- Sosnicki, O.; Pages, A.; Pacheco, C.; Maillard, T. Servo piezo tool SPT400MML for the fast and precise machining of free forms. Int. J. Adv. Manuf. Technol. 2010, 47, 903–910. [Google Scholar] [CrossRef]
- Aggogeri, F.; Al-Bender, F.; Brunner, B.; Elsaid, M.; Mazzola, M.; Merlo, A.; Ricciardi, D.; de la O Rodriguez, M.; Salvi, E. Design of piezo-based AVC system for machine tool applications. Mech. Syst. Signal Process. Piezoelectric Technol. 2013, 36, 53–65. [Google Scholar] [CrossRef]
- Choi, K.-B.; Lee, J.J.; Hata, S. A piezo-driven compliant stage with double mechanical amplification mechanisms arranged in parallel. Sens. Actuators A Phys. 2010, 161, 173–181. [Google Scholar] [CrossRef]
- Preisach, F. Über die magnetische Nachwirkung. Eur. Phys. J. A 1935, 94, 277–302. [Google Scholar] [CrossRef]
- Nguyen, P.-B.; Choi, S.-B.; Song, B.-K. A new approach to hysteresis modelling for a piezoelectric actuator using Preisach model and recursive method with an application to open-loop position tracking control. Sens. Actuators A Phys. 2018, 270, 136–152. [Google Scholar] [CrossRef]
- Liu, X.; Wang, Y.; Geng, J.; Chen, Z. Modeling of hysteresis in piezoelectric actuator based on adaptive filter. Sens. Actuators A Phys. 2013, 189, 420–428. [Google Scholar] [CrossRef]
- Dong, Y.; Hu, H.; Wang, H. Identification and experimental assessment of two-input Preisach model for coupling hysteresis in piezoelectric stack actuators. Sens. Actuators A Phys. 2014, 220, 92–100. [Google Scholar] [CrossRef]
- Jiles, D.C.; Atherton, D.L. Theory of the magnetisation process in ferromagnets and its application to the magnetomechanical effect. J. Phys. D Appl. Phys. 1984, 17, 1265–1281. [Google Scholar] [CrossRef]
- Leite, J.V.; Sadowski, N.; Kuo-Peng, P.; Benabou, A. Minor loops calculation with a modified Jiles-Atherton hysteresis model. JMOE 2009, 8, 49S–55S. [Google Scholar] [CrossRef]
- Rakotondrabe, M. Bouc–Wen Modeling and Inverse Multiplicative Structure to Compensate Hysteresis Nonlinearity in Piezoelectric Actuators. IEEE Trans. Autom. Sci. Eng. 2010, 8, 428–431. [Google Scholar] [CrossRef]
- Wang, G.; Chen, G.; Bai, F. Modeling and identification of asymmetric Bouc–Wen hysteresis for piezoelectric actuator via a novel differential evolution algorithm. Sens. Actuators A Phys. 2015, 235, 105–118. [Google Scholar] [CrossRef]
- Fuad Mohammad Naser, M.; Ikhouane, F. Characterization of the Hysteresis Duhem Model. In Proceedings of the IFAC Proceedings Volumes, 5th IFAC Workshop on Periodic Control Systems, Caen, France, 3–5 July 2013; Volume 46, pp. 29–34. [Google Scholar] [CrossRef]
- Wang, G.; Chen, G. Identification of piezoelectric hysteresis by a novel Duhem model based neural network. Sens. Actuators A Phys. 2017, 264, 282–288. [Google Scholar] [CrossRef]
- Deng, L.; Tan, Y. Modeling hysteresis in piezoelectric actuators using NARMAX models. Sens. Actuators A Phys. 2009, 149, 106–112. [Google Scholar] [CrossRef]
- Li, W.; Chen, X. Compensation of hysteresis in piezoelectric actuators without dynamics modeling. Sens. Actuators A Phys. 2013, 199, 89–97. [Google Scholar] [CrossRef]
- Lallart, M.; Li, K.; Yang, Z.; Zhou, S.; Wang, W. Simple and efficient inverse hysteretic model and associated experimental procedure for precise piezoelectric actuator control and positioning. Sens. Actuators A Phys. 2020, 301, 111674. [Google Scholar] [CrossRef]
- Milecki, A.; Pelic, M. Application of geometry based hysteresis modelling in compensation of hysteresis of piezo bender actuator. Mech. Syst. Signal Process. 2016, 78, 4–17. [Google Scholar] [CrossRef]
- Brehl, D.E.; Dow, T.A. Review of vibration-assisted machining. Precis. Eng. 2008, 32, 153–172. [Google Scholar] [CrossRef]
- Gapinski, B.; Rucki, M. The roundness deviation measurement with CMM. In Proceedings of the 2008 IEEE International Workshop on Advanced Methods for Uncertainty Estimation in Measurement, Sardinia, Italy, 21–22 July 2008; pp. 108–111. [Google Scholar] [CrossRef]
- Gapinski, B.; Wieczorowski, M. Measurement of Diameter and Roundness on Incomplete Outline of Element with Three-lobbing Deviation. Procedia Eng. 2014, 69, 247–254. [Google Scholar] [CrossRef][Green Version]
Figure 1.
Overview of the proposed FTS drive: (a) kinematic diagram, (b) actual drive mounted on the lathe turret: (1) base, (2) piezoelectric drive unit, (3) support frame, (4) guide rail, (5) carriage 1, (6) carriage 2, (7) turning tool holder.
Figure 1.
Overview of the proposed FTS drive: (a) kinematic diagram, (b) actual drive mounted on the lathe turret: (1) base, (2) piezoelectric drive unit, (3) support frame, (4) guide rail, (5) carriage 1, (6) carriage 2, (7) turning tool holder.
Figure 2.
Design of the control and measuring systems for turning tests.
Figure 2.
Design of the control and measuring systems for turning tests.
Figure 3.
Results of the positioning accuracy tests according to ISO-320-2 standard: (a) non-compensated drive; (b) compensated drive. Please note that “s” stands for standard deviation and ×1 represents the average value. All the terms used in this figure are according to the ISO standard.
Figure 3.
Results of the positioning accuracy tests according to ISO-320-2 standard: (a) non-compensated drive; (b) compensated drive. Please note that “s” stands for standard deviation and ×1 represents the average value. All the terms used in this figure are according to the ISO standard.
Figure 4.
Drive frequency response—amplitude of position as a function of frequency for sine excitations.
Figure 4.
Drive frequency response—amplitude of position as a function of frequency for sine excitations.
Figure 5.
Contour shapes of i-th base harmonic considered in the turning trials: (a) I = 1; (b) I = 2; (c) I = 3; (d) I = 4.
Figure 5.
Contour shapes of i-th base harmonic considered in the turning trials: (a) I = 1; (b) I = 2; (c) I = 3; (d) I = 4.
Figure 6.
Shape deviation in mm as a function of angular orientation of the machined part: (a) unfiltered; (b) filtered at cut-off equal to 50 upr (undulations per revolution).
Figure 6.
Shape deviation in mm as a function of angular orientation of the machined part: (a) unfiltered; (b) filtered at cut-off equal to 50 upr (undulations per revolution).
Figure 7.
Adaptation of real data to the theoretical nominal outline: (a) prior to adaptation; (b) after adaptation.
Figure 7.
Adaptation of real data to the theoretical nominal outline: (a) prior to adaptation; (b) after adaptation.
Figure 8.
Measurement results for sample no. S1.2: (a) shape deviation e in polar coordinates magnified by 50×; (b) shape offset e in the domain of rotation angle α.
Figure 8.
Measurement results for sample no. S1.2: (a) shape deviation e in polar coordinates magnified by 50×; (b) shape offset e in the domain of rotation angle α.
Figure 9.
Measurement results for sample no. S2.3: (a) shape deviation e in polar coordinates magnified by 50×; (b) shape offset e in the domain of rotation angle α.
Figure 9.
Measurement results for sample no. S2.3: (a) shape deviation e in polar coordinates magnified by 50×; (b) shape offset e in the domain of rotation angle α.
Figure 10.
Measurement results for sample no. S4.2: (a) shape deviation e in polar coordinates magnified by 20×; (b) shape offset e in the domain of rotation angle α.
Figure 10.
Measurement results for sample no. S4.2: (a) shape deviation e in polar coordinates magnified by 20×; (b) shape offset e in the domain of rotation angle α.
Figure 11.
Box-and-whisker plot for particular samples (arranged according to increasing frequency). Box size indicates 25th and 75th percentiles.
Figure 11.
Box-and-whisker plot for particular samples (arranged according to increasing frequency). Box size indicates 25th and 75th percentiles.
Figure 12.
Line profile shape offset in the domain of the drive unit’s operating frequency: (a) NCDT; (b) coordinate measuring machine CMM.
Figure 12.
Line profile shape offset in the domain of the drive unit’s operating frequency: (a) NCDT; (b) coordinate measuring machine CMM.
Figure 13.
Outline shape offset standard deviation in the domain of the drive unit’s operating frequency: (a) NCDT; (b) coordinate measuring machine CMM.
Figure 13.
Outline shape offset standard deviation in the domain of the drive unit’s operating frequency: (a) NCDT; (b) coordinate measuring machine CMM.
Figure 14.
Correlation of the profile deviation to ideal geometry measured offline and online during the turning process: (a) deviation of profile shape; (b) standard deviation of profile shape.
Figure 14.
Correlation of the profile deviation to ideal geometry measured offline and online during the turning process: (a) deviation of profile shape; (b) standard deviation of profile shape.
Table 1.
Results of the positioning accuracy tests according to ISO-320-2.
Table 1.
Results of the positioning accuracy tests according to ISO-320-2.
| Measure | Before Compensation | After Compensation |
|---|
| Mean reversal error [µm] | −0.345 | −0.164 |
Range of mean bidirectional
positioning error M [µm] | 12.786 | 1.951 |
| Systematic positioning error E [µm] | 13.842 | 1.464 |
| Positioning repeatability R [µm] | 2.405 | 1.600 |
| Positioning error A [µm] | 14.570 | 2.533 |
Table 2.
Settings for as-set spindle speed n, as-measured speed nR, and the operating frequency of the piezo element during turning with the i-th order harmonic.
Table 2.
Settings for as-set spindle speed n, as-measured speed nR, and the operating frequency of the piezo element during turning with the i-th order harmonic.
| Sample | i | n [1/min] | nR [1/min] | fR [Hz] |
|---|
| S1.1 | 1 | 80 | 85.2 | 1.42 |
| S1.2 | 1 | 160 | 168.6 | 2.81 |
| S1.3 | 1 | 224 | 244.2 | 4.07 |
| S1.4 | 1 | 315 | 339.6 | 5.66 |
| S1.5 | 1 | 450 | 481.8 | 8.03 |
| S1.6 | 1 | 630 | 682.2 | 11.37 |
| S2.1 | 2 | 80 | 85.2 | 2.84 |
| S2.2 | 2 | 160 | 168.3 | 5.61 |
| S2.3 | 2 | 224 | 244.5 | 8.15 |
| S2.4 | 2 | 315 | 339.6 | 11.32 |
| S2.5 | 2 | 450 | 482.1 | 16.07 |
| S3.1 | 3 | 80 | 85.4 | 4.27 |
| S3.2 | 3 | 160 | 168.4 | 8.42 |
| S3.3 | 3 | 224 | 244.4 | 12.22 |
| S3.4 | 3 | 315 | 340 | 17 |
| S4.1 | 4 | 80 | 85.35 | 5.69 |
| S4.2 | 4 | 160 | 168.45 | 11.23 |
| S4.3 | 4 | 224 | 244.5 | 16.3 |
Table 3.
Statistical measures for the shape offset difference e in the measurement methods.
Table 3.
Statistical measures for the shape offset difference e in the measurement methods.
| Sample | f [Hz] | eCMM-eNCDT [μm] |
|---|
Mean
m | Standard Deviation s | Min | Quartile Q1 | Median
Me/Q2 | Quartile
Q3 | Max |
|---|
| S1.1 | 1.42 | 9.91 | 133.48 | −10.00 | −4.86 | 9.99 | 22.74 | 31.39 |
| S1.2 | 2.81 | 4.56 | 55.58 | −20.00 | −0.24 | 2.76 | 9.23 | 17.60 |
| S1.3 | 4.07 | 4.30 | 83.97 | −27.03 | −0.19 | 5.57 | 9.88 | 18.45 |
| S1.4 | 5.66 | −134.85 | 574.01 | −372.50 | −170.09 | −163.32 | −127.04 | 1.90 |
| S1.5 | 8.03 | 1.65 | 48.87 | −15.00 | −2.39 | 1.08 | 4.84 | 18.47 |
| S1.6 | 11.37 | −2.26 | 411.24 | −101.48 | −28.22 | −1.48 | 21.19 | 109.16 |
| S2.1 | 2.84 | 8.33 | 90.92 | −10.00 | 1.71 | 4.63 | 14.14 | 29.26 |
| S2.2 | 5.61 | 4.00 | 146.58 | −18.03 | −8.98 | 0.63 | 18.11 | 33.55 |
| S2.3 | 8.15 | 0.27 | 65.29 | −15.78 | −4.59 | 0.01 | 5.20 | 14.81 |
| S2.4 | 11.32 | −7.84 | 350.91 | −59.50 | −33.03 | −24.39 | 17.02 | 82.86 |
| S2.5 | 16.07 | 4.13 | 272.14 | −31.10 | −21.10 | −6.64 | 31.83 | 64.43 |
| S3.1 | 4.27 | 9.73 | 149.39 | −17.27 | −4.85 | 11.45 | 23.55 | 37.11 |
| S3.2 | 8.42 | 7.23 | 165.61 | −22.64 | −8.13 | 7.04 | 21.92 | 40.84 |
| S3.3 | 12.22 | −4.41 | 307.93 | −56.47 | −28.39 | −16.32 | 24.57 | 67.21 |
| S3.4 | 17.00 | 10.11 | 202.33 | −60.00 | −2.57 | 9.80 | 26.70 | 45.70 |
| S4.1 | 8.15 | −13.55 | 269.07 | −60.61 | −38.95 | −10.38 | 10.48 | 31.50 |
| S4.2 | 11.23 | −2.05 | 200.78 | −48.46 | −19.70 | 1.17 | 12.74 | 40.55 |
| S4.3 | 16.30 | 34.29 | 242.67 | −12.65 | 16.33 | 29.70 | 56.37 | 88.92 |
Table 4.
Comparison of the averaged line profile shape offsets with amplitude values from the frequency specification.
Table 4.
Comparison of the averaged line profile shape offsets with amplitude values from the frequency specification.
| f [Hz] | [µm] | Δx [µm] |
|---|
| 8.2 | 55 | −10 |
| 11.5 | 274 | −140 |
| 16.5 | 413 | −420 |
Table 5.
Line profile offset standard deviations and the line profile offset standard deviation for attempts with the frequency lower than the limit value.
Table 5.
Line profile offset standard deviations and the line profile offset standard deviation for attempts with the frequency lower than the limit value.
| Parameter | | NCDT [µm] | CMM [µm] |
|---|
| Line profile shape deviation | | 46.7 | 39.8 |
| emax | 56.4 | 57.6 |
| se | 10.3 | 9.9 |
| Standard deviation | | 12.2 | 10.1 |
| emax | 15.5 | 11.7 |
| se | 3.1 | 1.4 |
| Publisher’s Note: MDPI stays neutral with regard to jurisdictional claims in published maps and institutional affiliations. |
© 2021 by the authors. Licensee MDPI, Basel, Switzerland. This article is an open access article distributed under the terms and conditions of the Creative Commons Attribution (CC BY) license (https://creativecommons.org/licenses/by/4.0/).


