
Solidification/Stabilization of Contaminated Soil in a South Station of the Khurmala Oil Field in Kurdistan Region, Iraq


Abstract
:1. Introduction
2. Scope
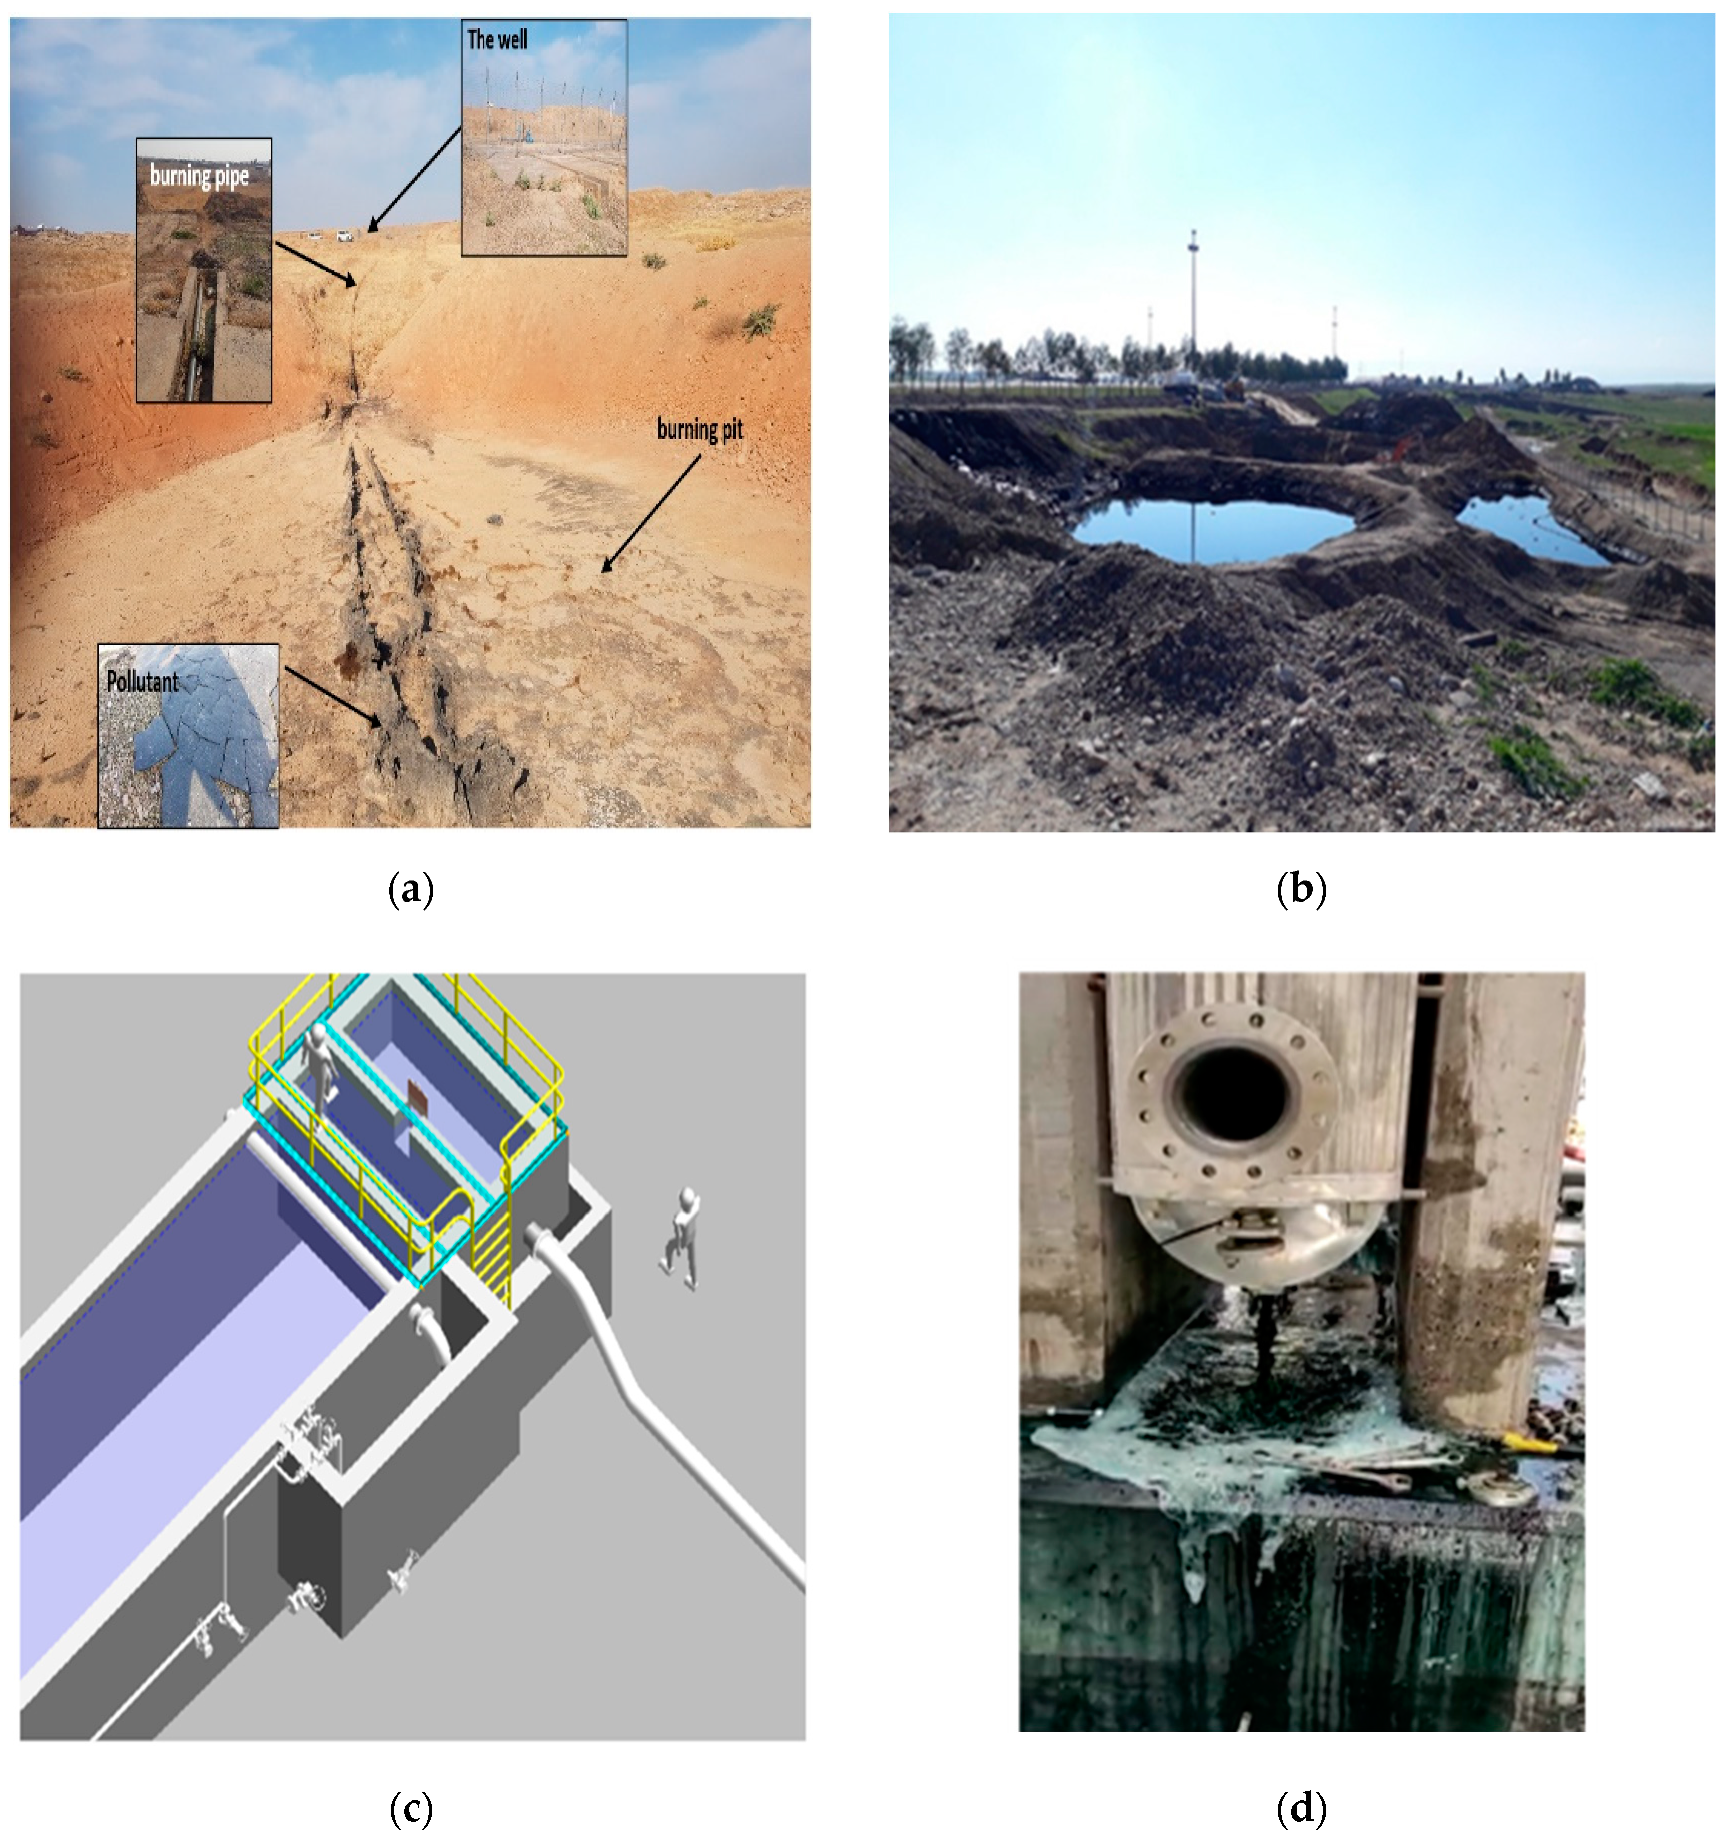
- Burning pit: This is a pit that is prepared to collect the crude oil that is tested and drained during oil well testing through a special pipe called the burning pipe. A check is necessary to determine the quantity and quality of crude oil, utilizing a test point and a flow meter attached to the burning pipe, as shown in Figure 1a.
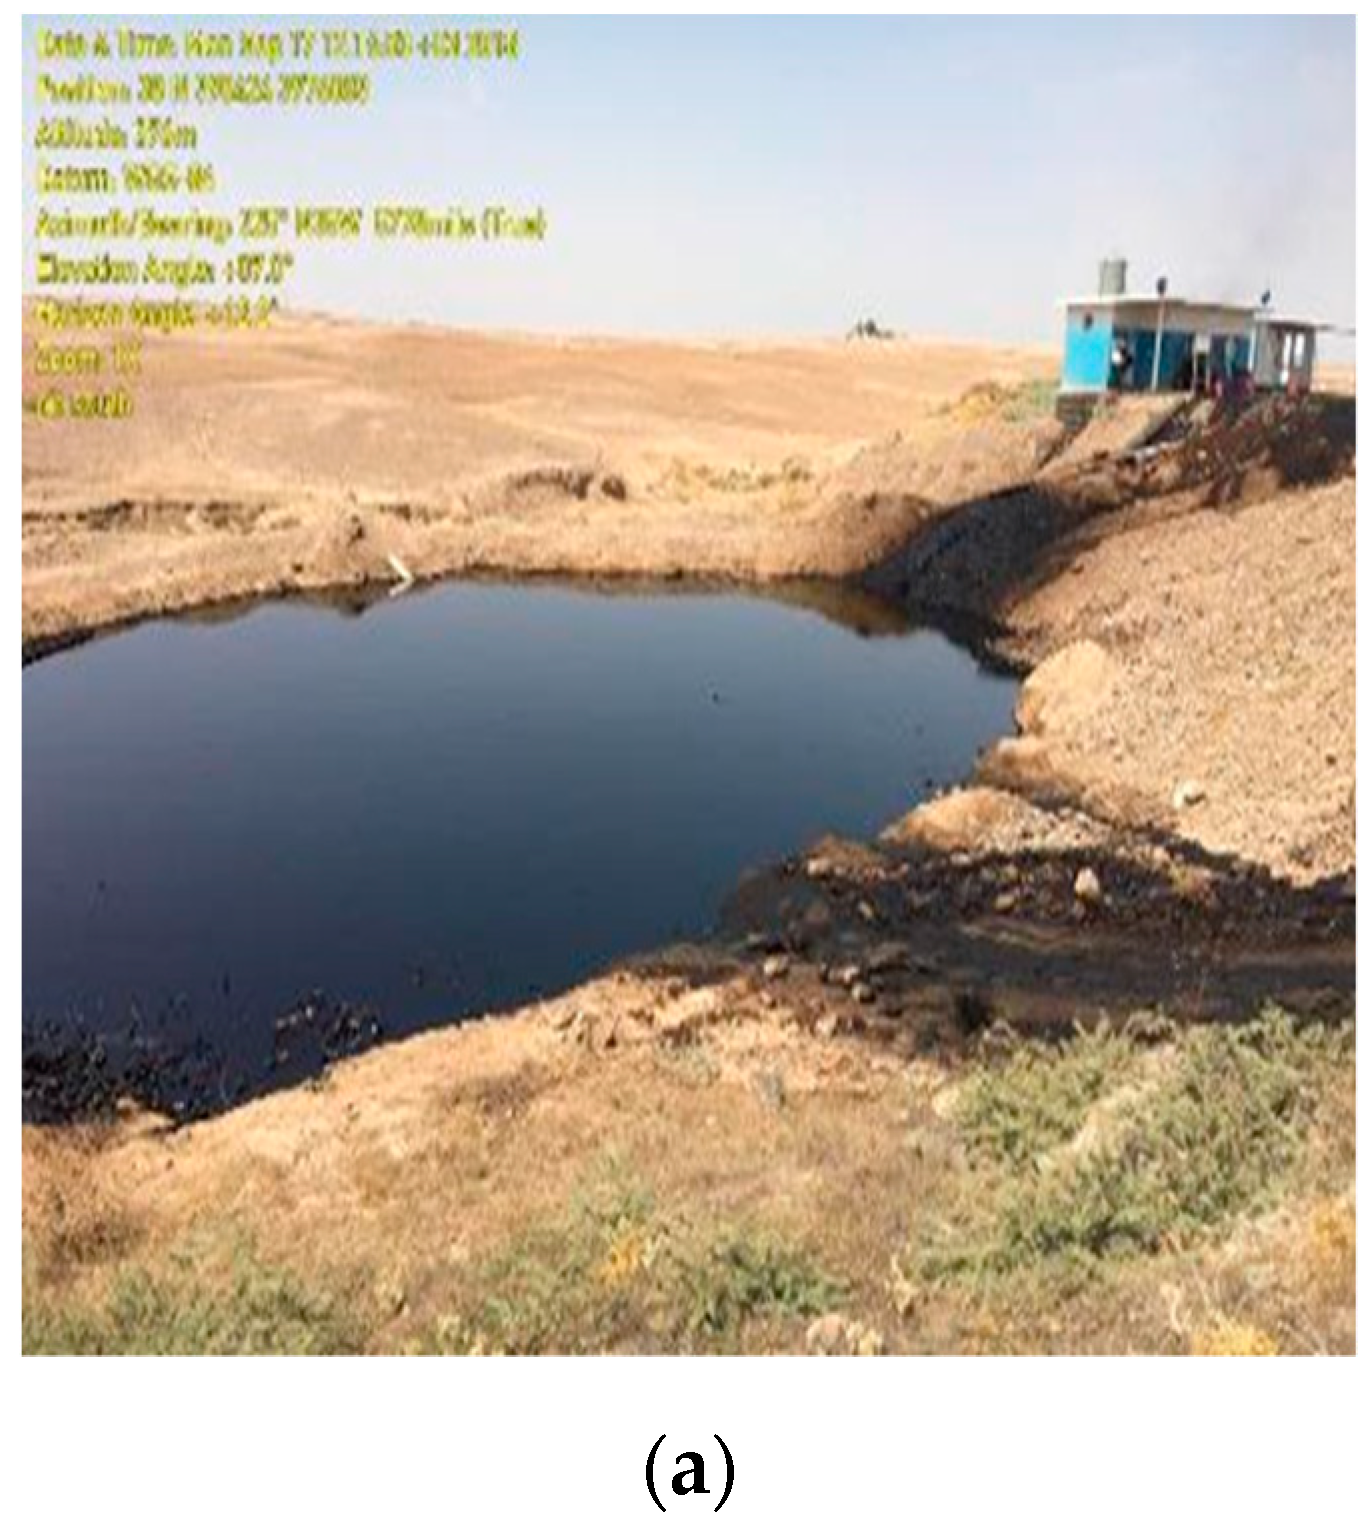
- Random pit: If the pipeline is not accessible for a particular location, the alternative is unloading. The oil in the tankers must be tested. The tested oil then has to be randomly handled. The tested oil is dealt with by disposal in a designated pit called the random pit, as shown in Figure 1b, from which oil can leak into the soil from the older pits. Therefore, these old pits must be remedied. Fortunately, in the Khurmala oil field, a particular separator system is currently used. An oil–water separator system is designed to isolate total quantities of oil and suspended solids from the oil refinery wastewater effluents. This system is based on preventing any leakage into the surrounding and underground soil under Health Safety and Environmental regulations (HSE), as shown in Figure 1c.
- The absence of a closed drain system in the facilities (including pumps, equipment, pipes, and valves) frequently causes various oil leakage accidents, which can cause severe pollution to the surrounding soil, as shown in Figure 1d. These problems can be controlled through the use of close drain systems linked to a piping system connected to a particular basin for this leakage. Unfortunately, this system is not currently in use at the Khurmala oil station.
- Flow lines under or above the ground that transport crude oil from the well to stations are subjected to corrosion due to H2S if a corrosion inhibiter is not used, leading to holes in these pipes, causing oil leakage and then soil contamination.
3. Materials and Methods
3.1. Materials
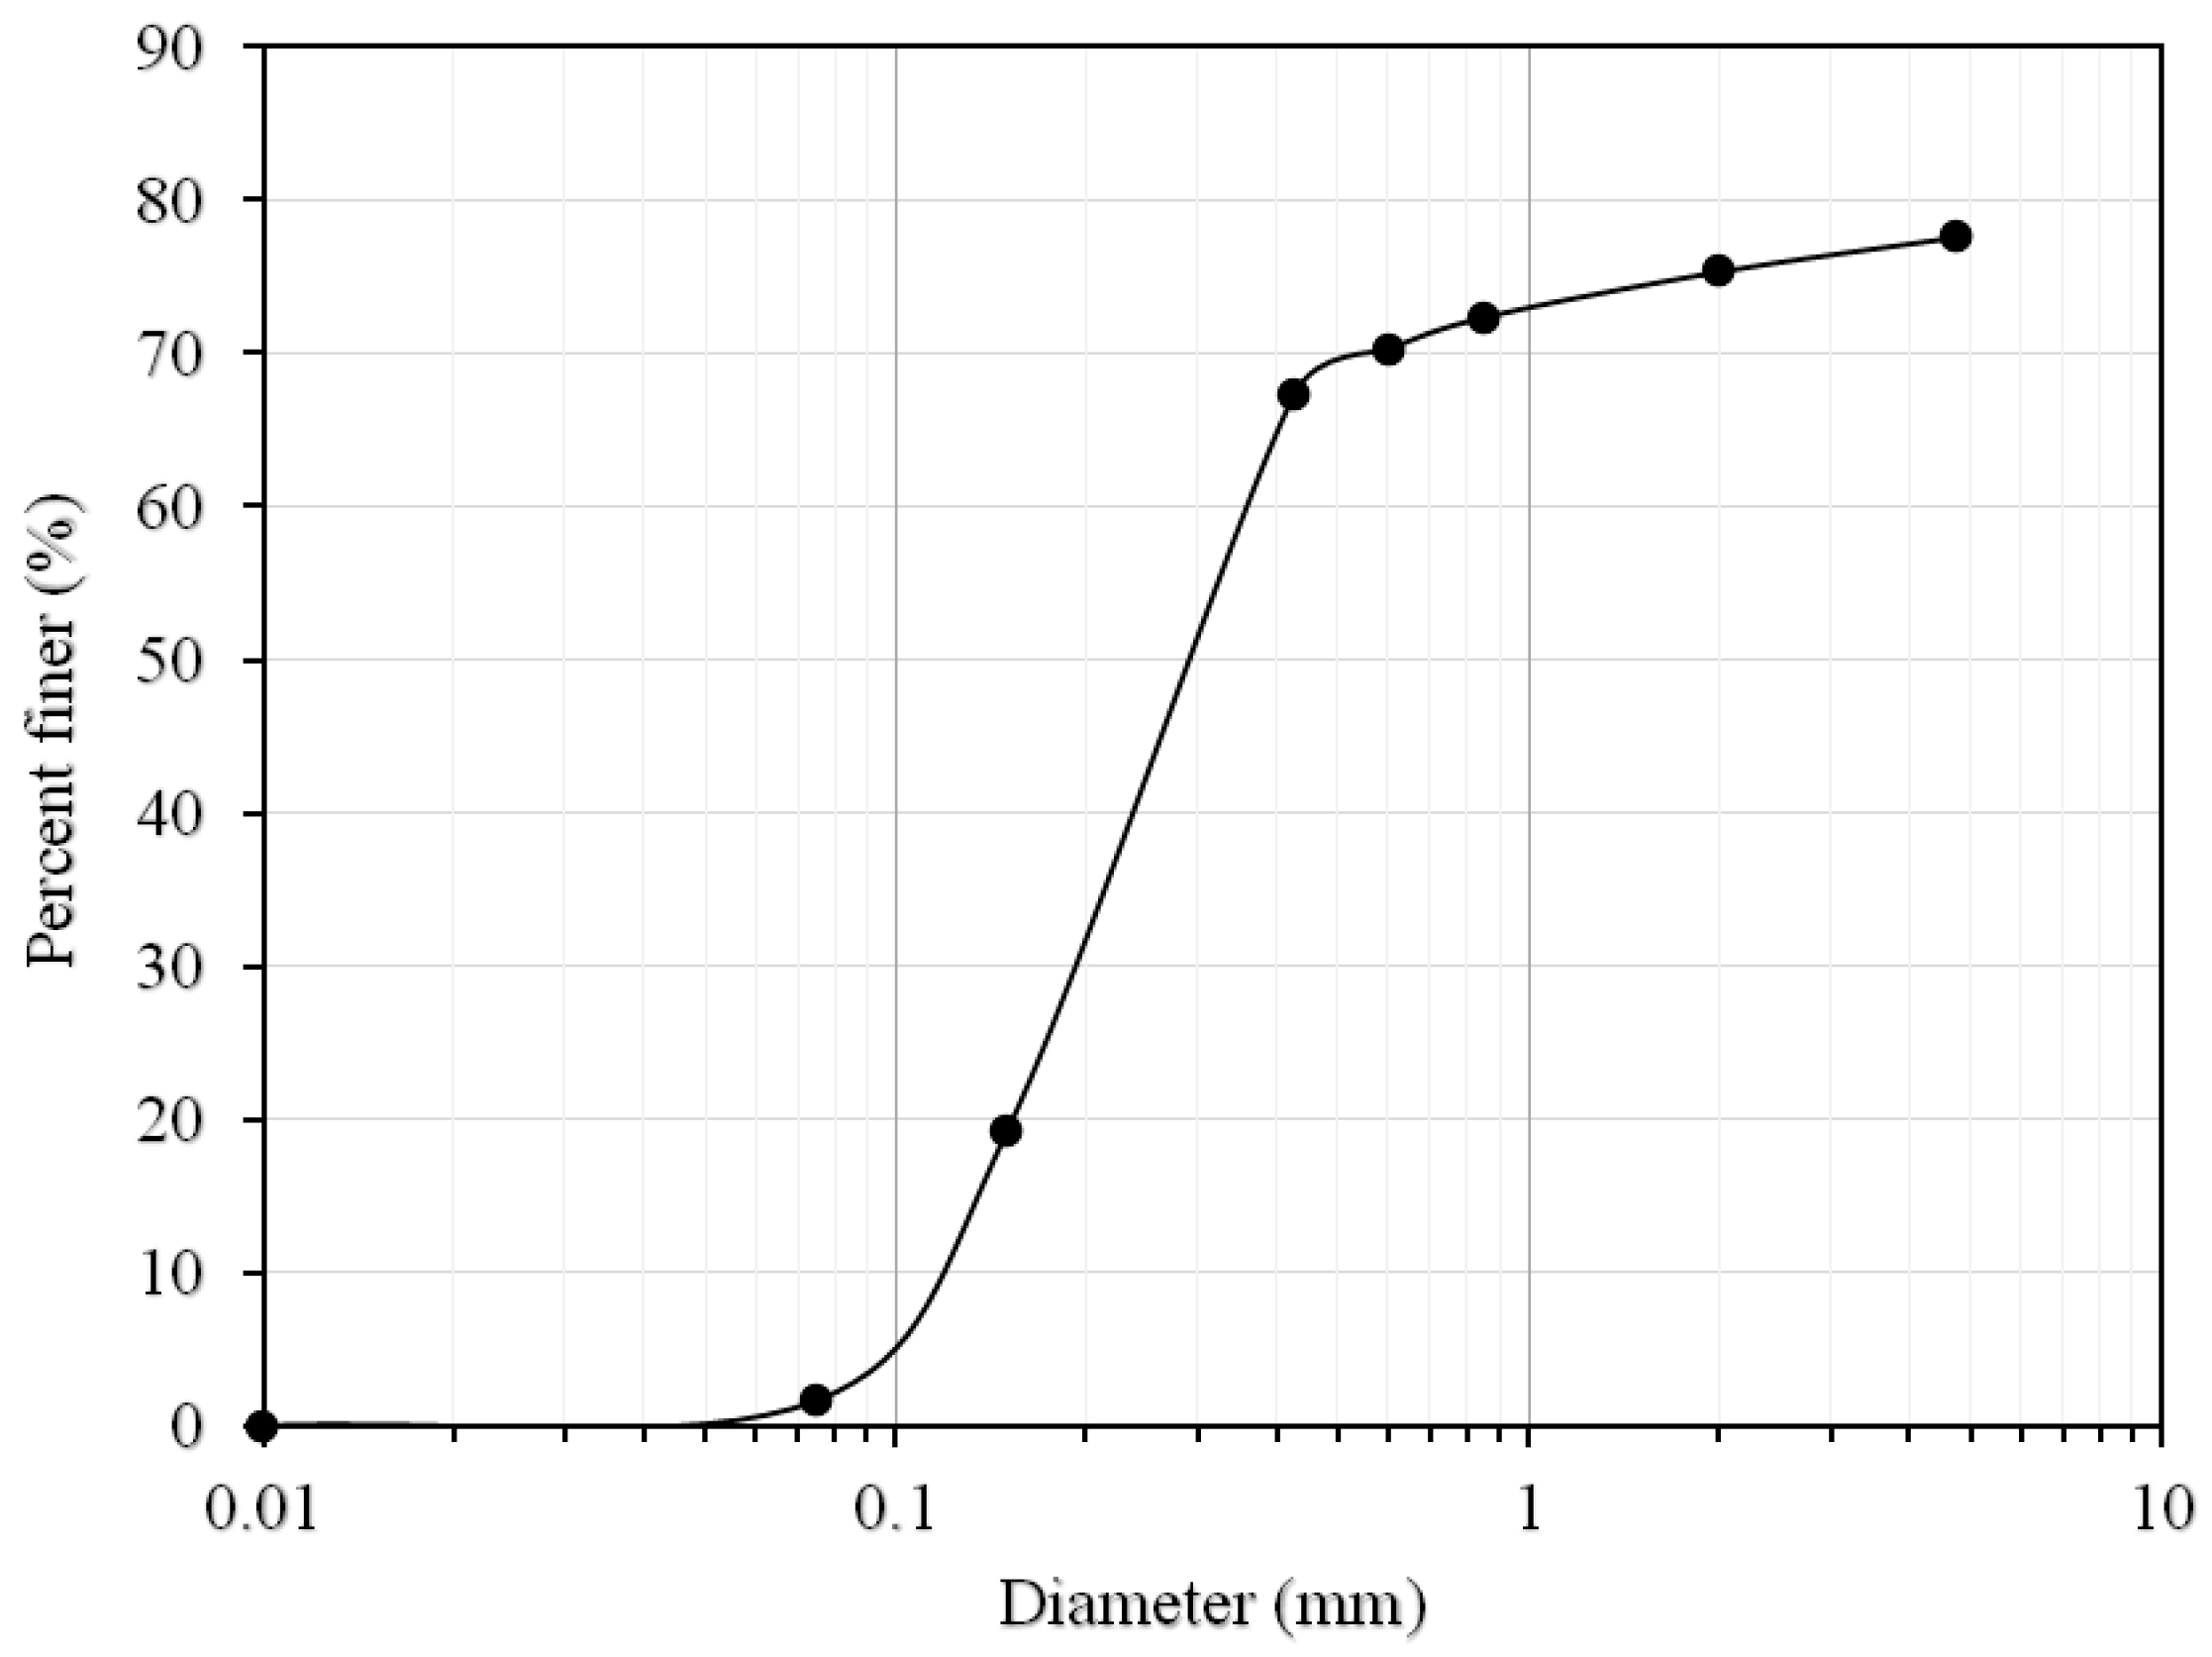
3.1.1. Soil
3.1.2. Crude Oil
3.1.3. Cement
3.2. The Solidification/Stabilization Process of Pollutant Soil in the Field
- Improve soil handling and physical characteristics;
- Minimize available surface area for the movement or loss of pollutants and limit fluid movement by the total hard matrix volume;
- Minimize the solubility of the contaminant into the amount of contaminated soil.
- International drilling fluids and engineering services, a Qmax solutions company, waste management division, provided services of remediating and encapsulating all the pit’s wastes, such as oily sludge and contaminated soil waste.
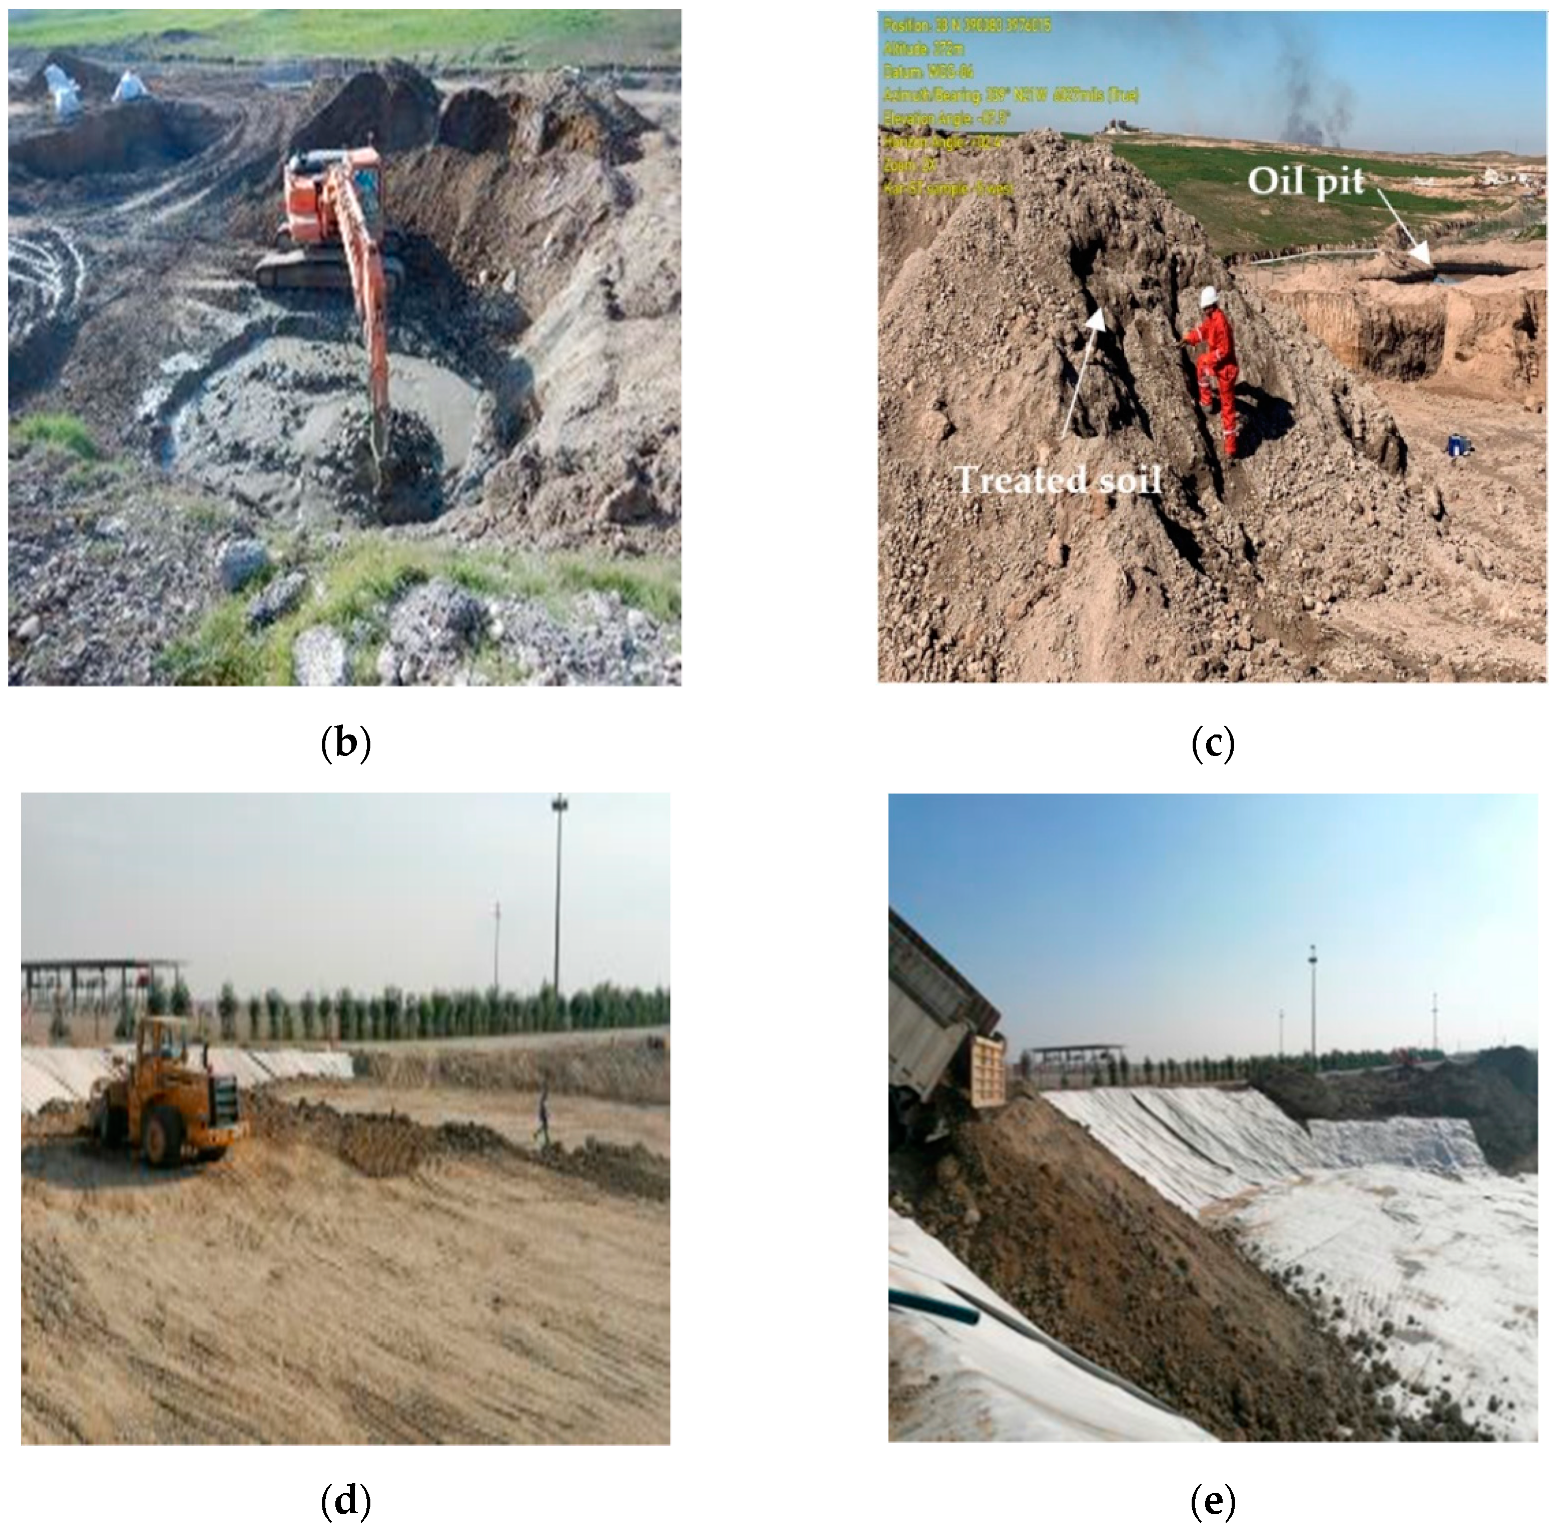
- The remediation involves remediating the contaminated oil pit, reserve pit (Figure 3a), and overflow pit at the south production station, located at Khurmala Site, in the Erbil City.
- The equipment and machinery were mobilized to the southern production plant site on 15 January 2019.
- The contaminated soil in the oil pit was first treated by digging and treating all the soil contaminated with the existing crude oil (Figure 3b). The total volume of treated soil reached 2980 m3.
- The treated soil was stored beside the oil pit (Figure 3c) to be backfilled, after reconstructing and lining the pit, and prepared as a construction earth material.
- When the test results of the oil pit’s bottom and sides showed that it was cleaned of contaminant, the pit was reconstructed and lined up with a geosynthetic clay layer with high-density polyethylene liner to be backfilled with remediated soil (Figure 3d).
- The oil pit was backfilled with treated soil, covered with a GCL liner on the top (Figure 3e), then backfilled to 3.5 m of fresh soil from the area around the pit, leveled, and compacted to the natural ground level.
- The site underwent general clean-up and restoration. The procedures of the treatment are illustrated in Figure 3.
3.3. The Solidification/Stabilization Process of Pollutant Soil in the Laboratory
3.4. Laboratory Test Program
4. Results and Discussion
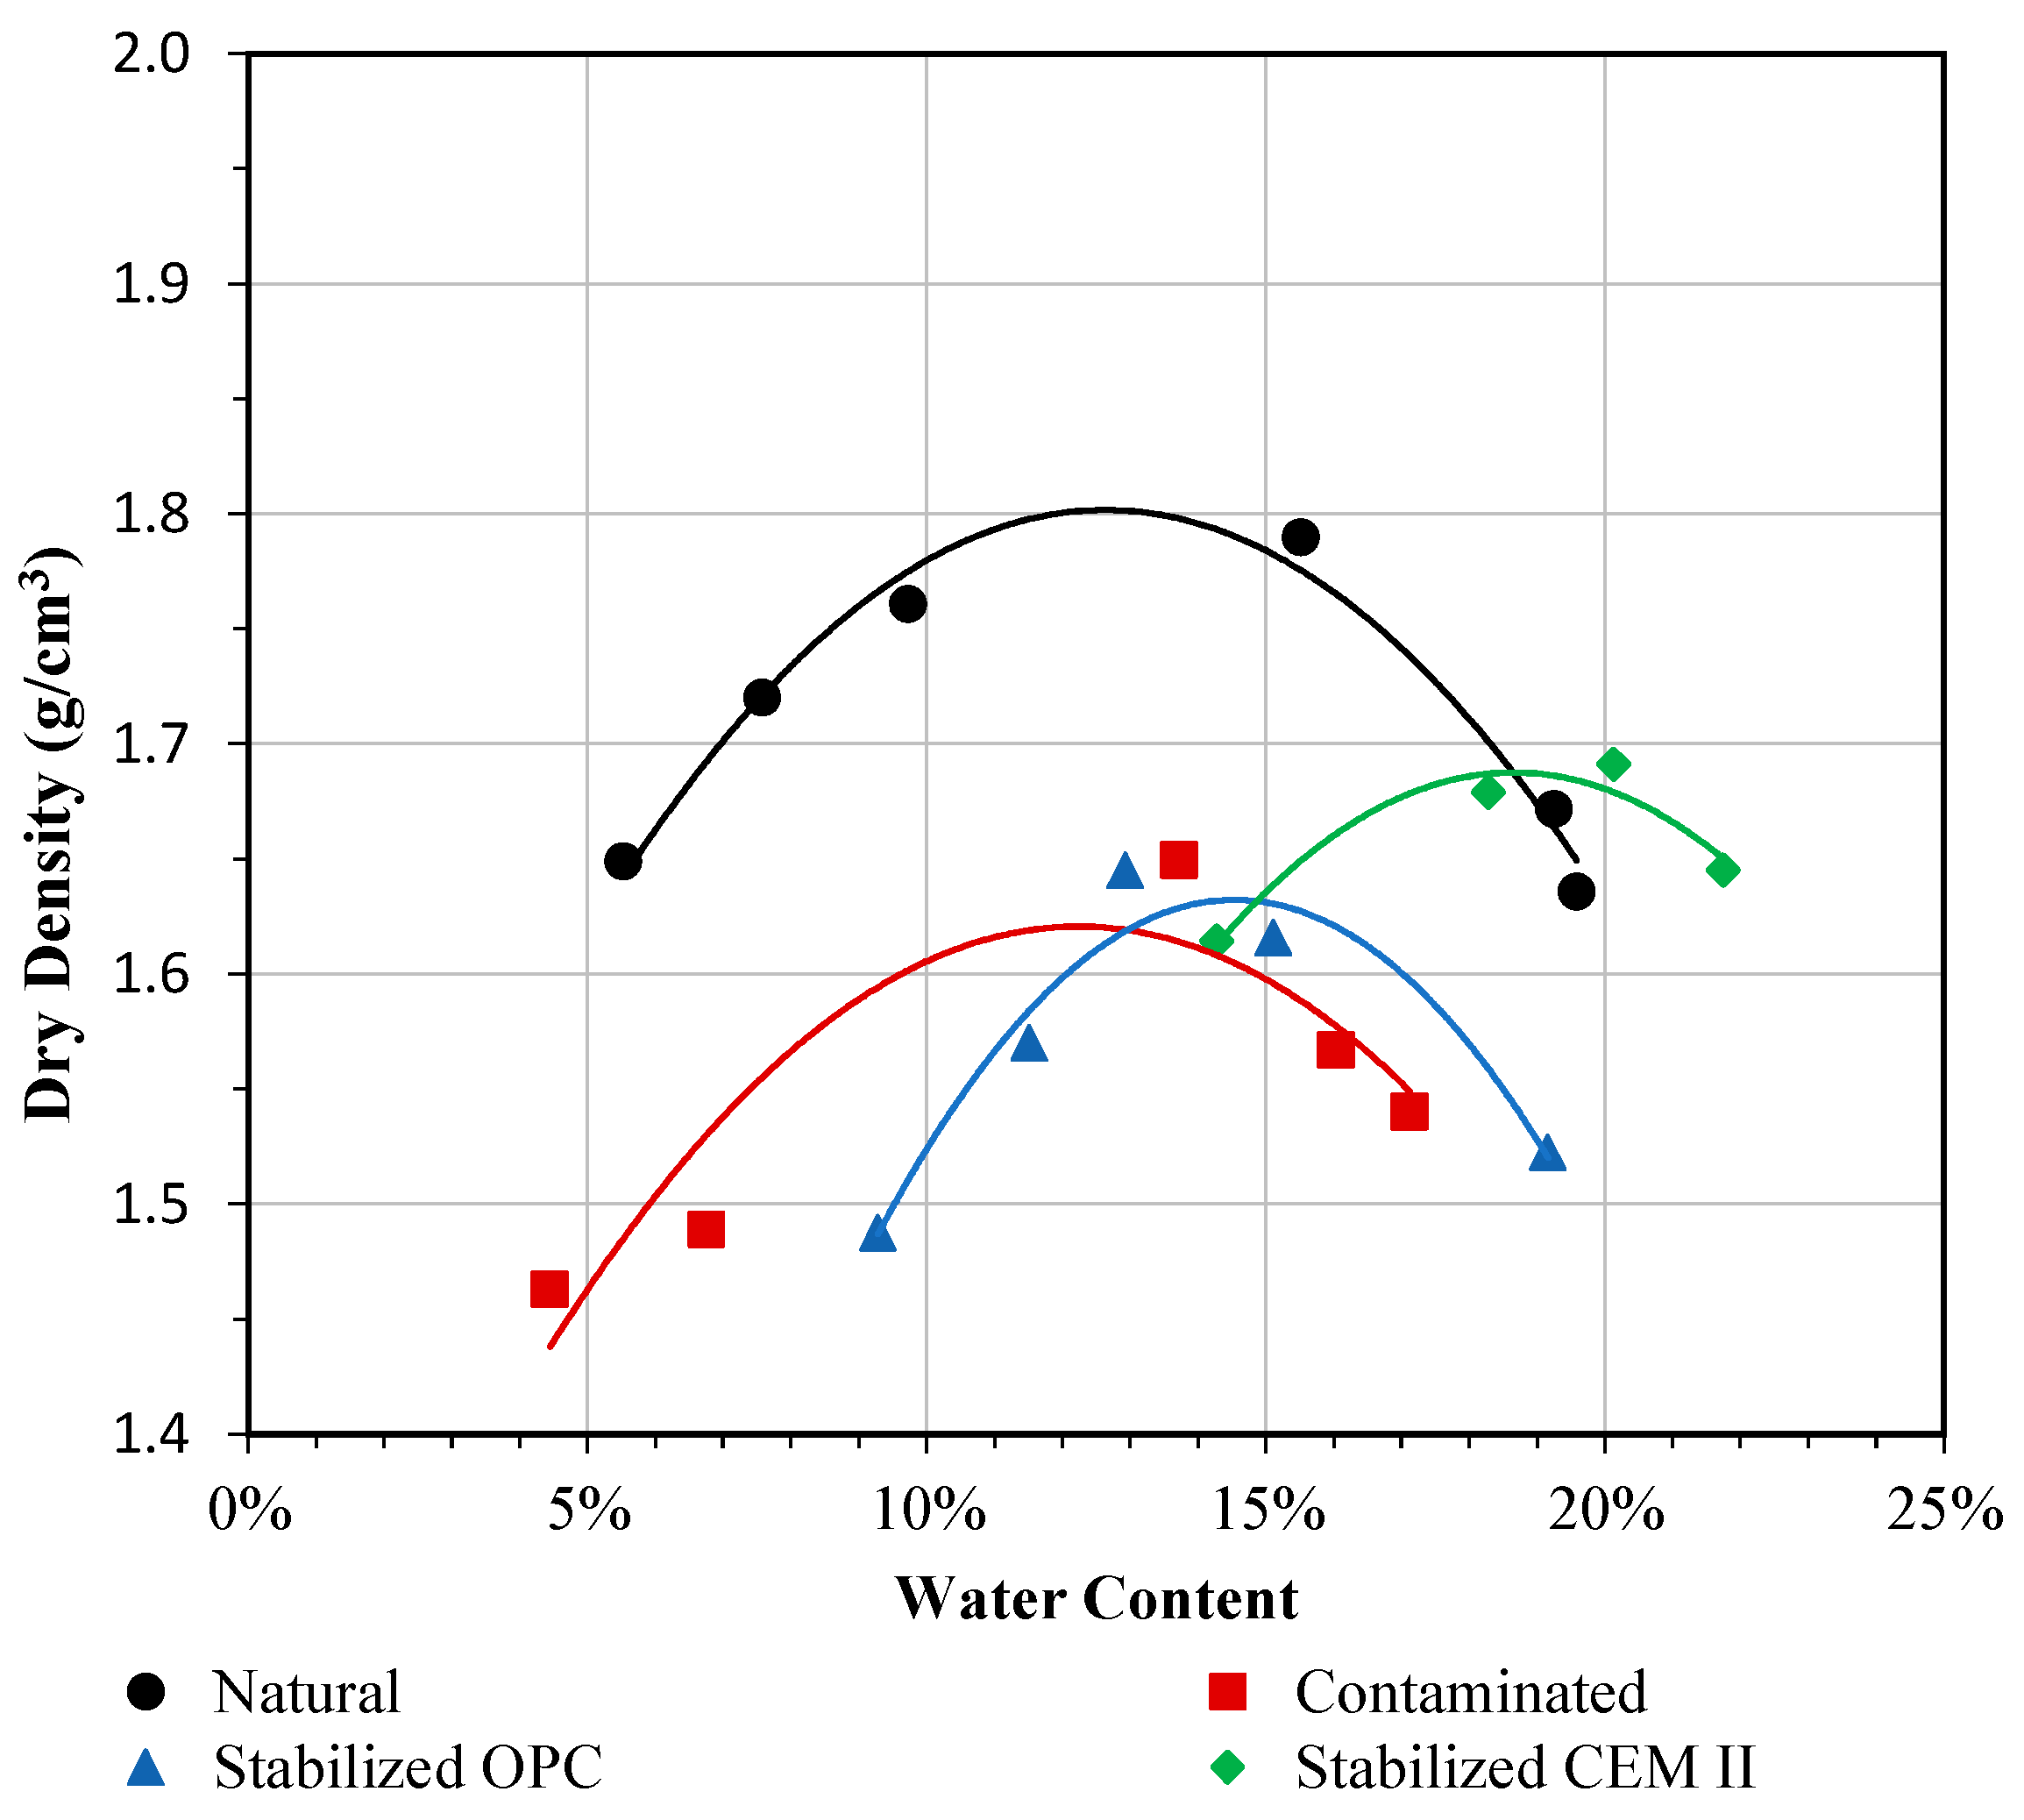
4.1. Compaction Test Results
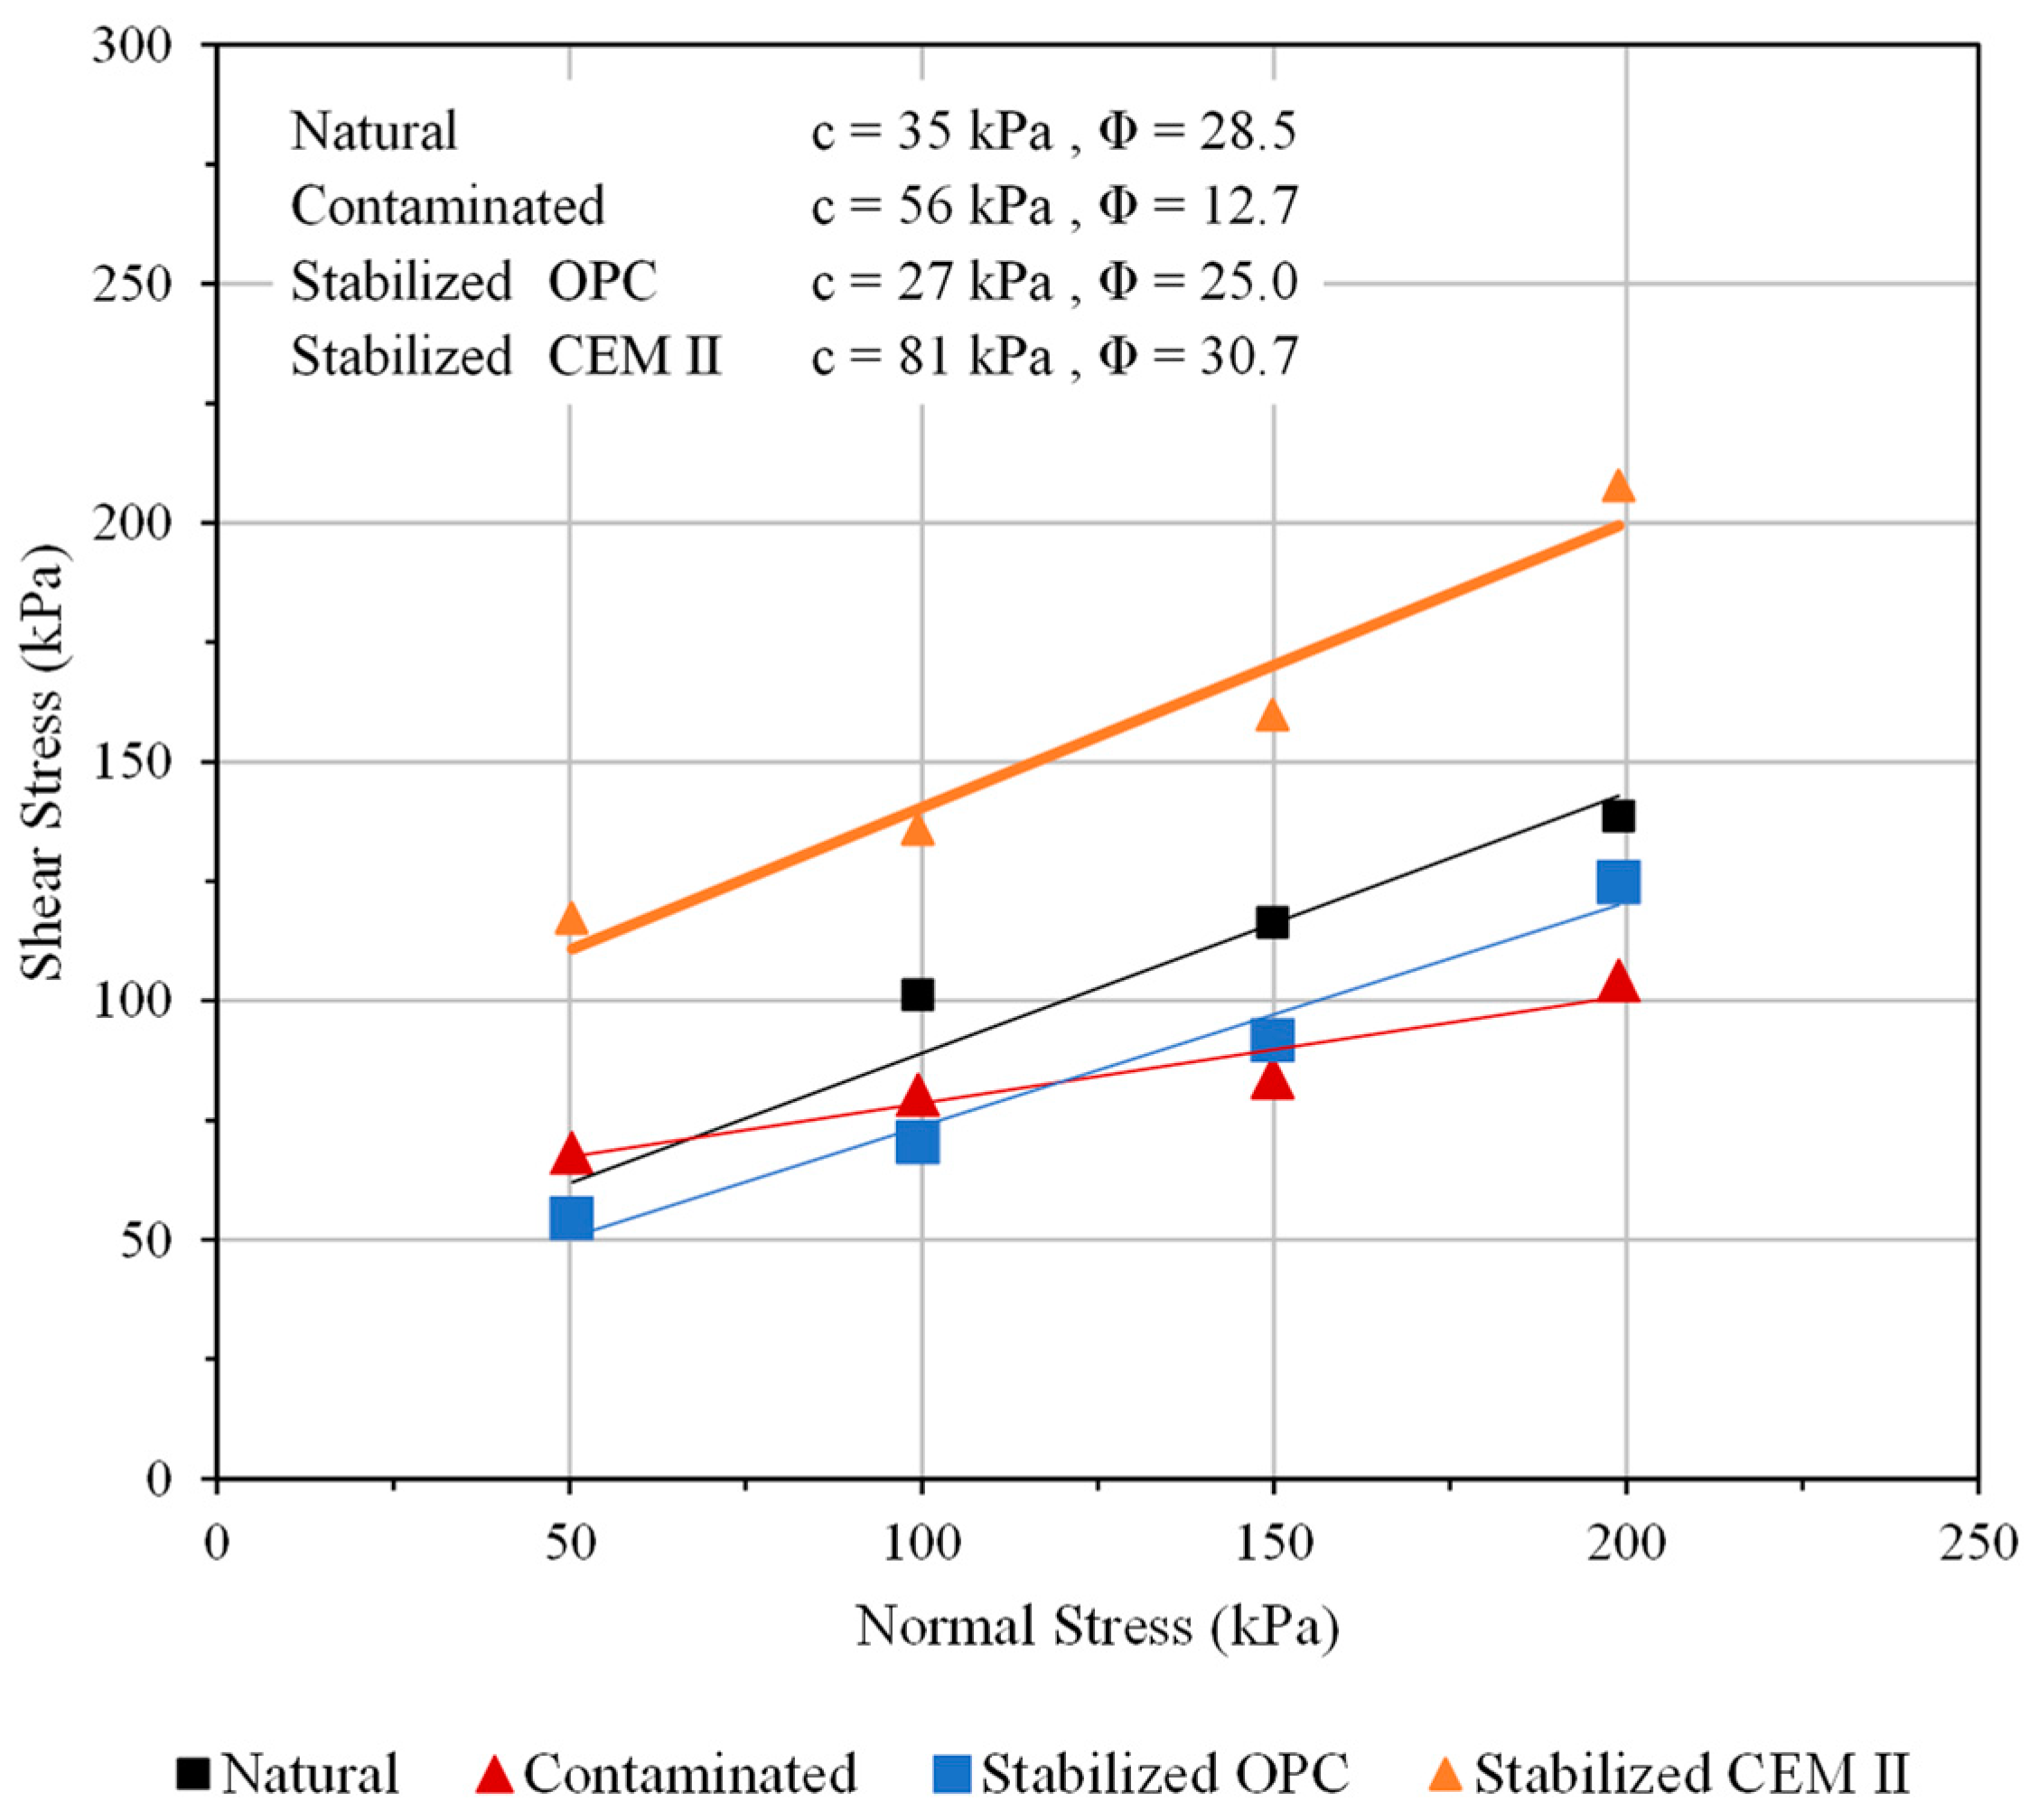
4.2. Direct Shear Test Results
4.3. Permeability Tests
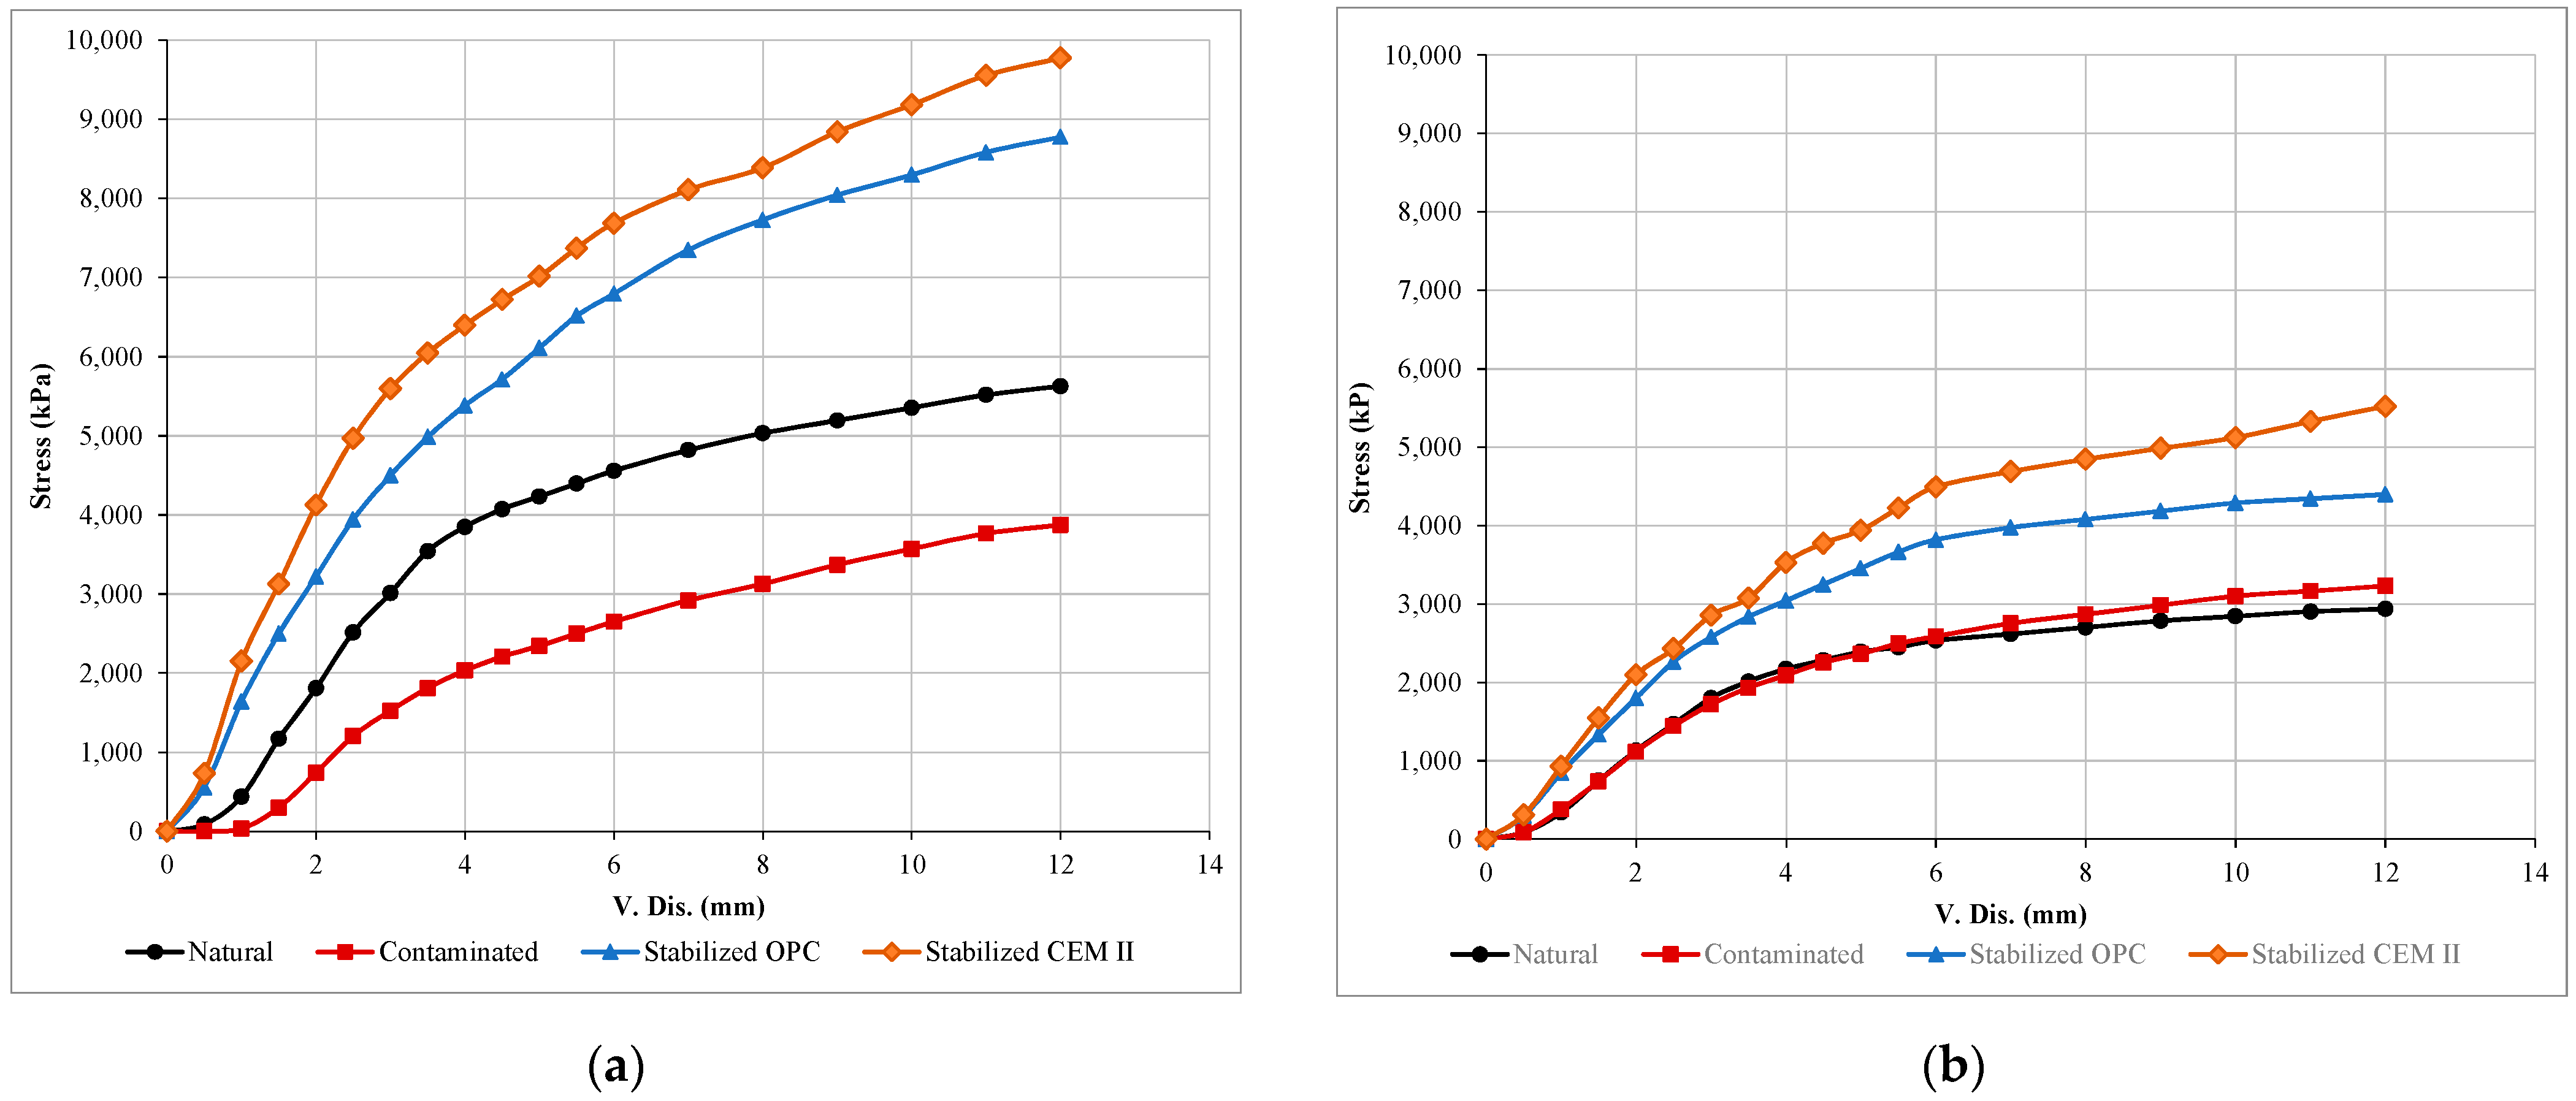
4.4. CBR Tests
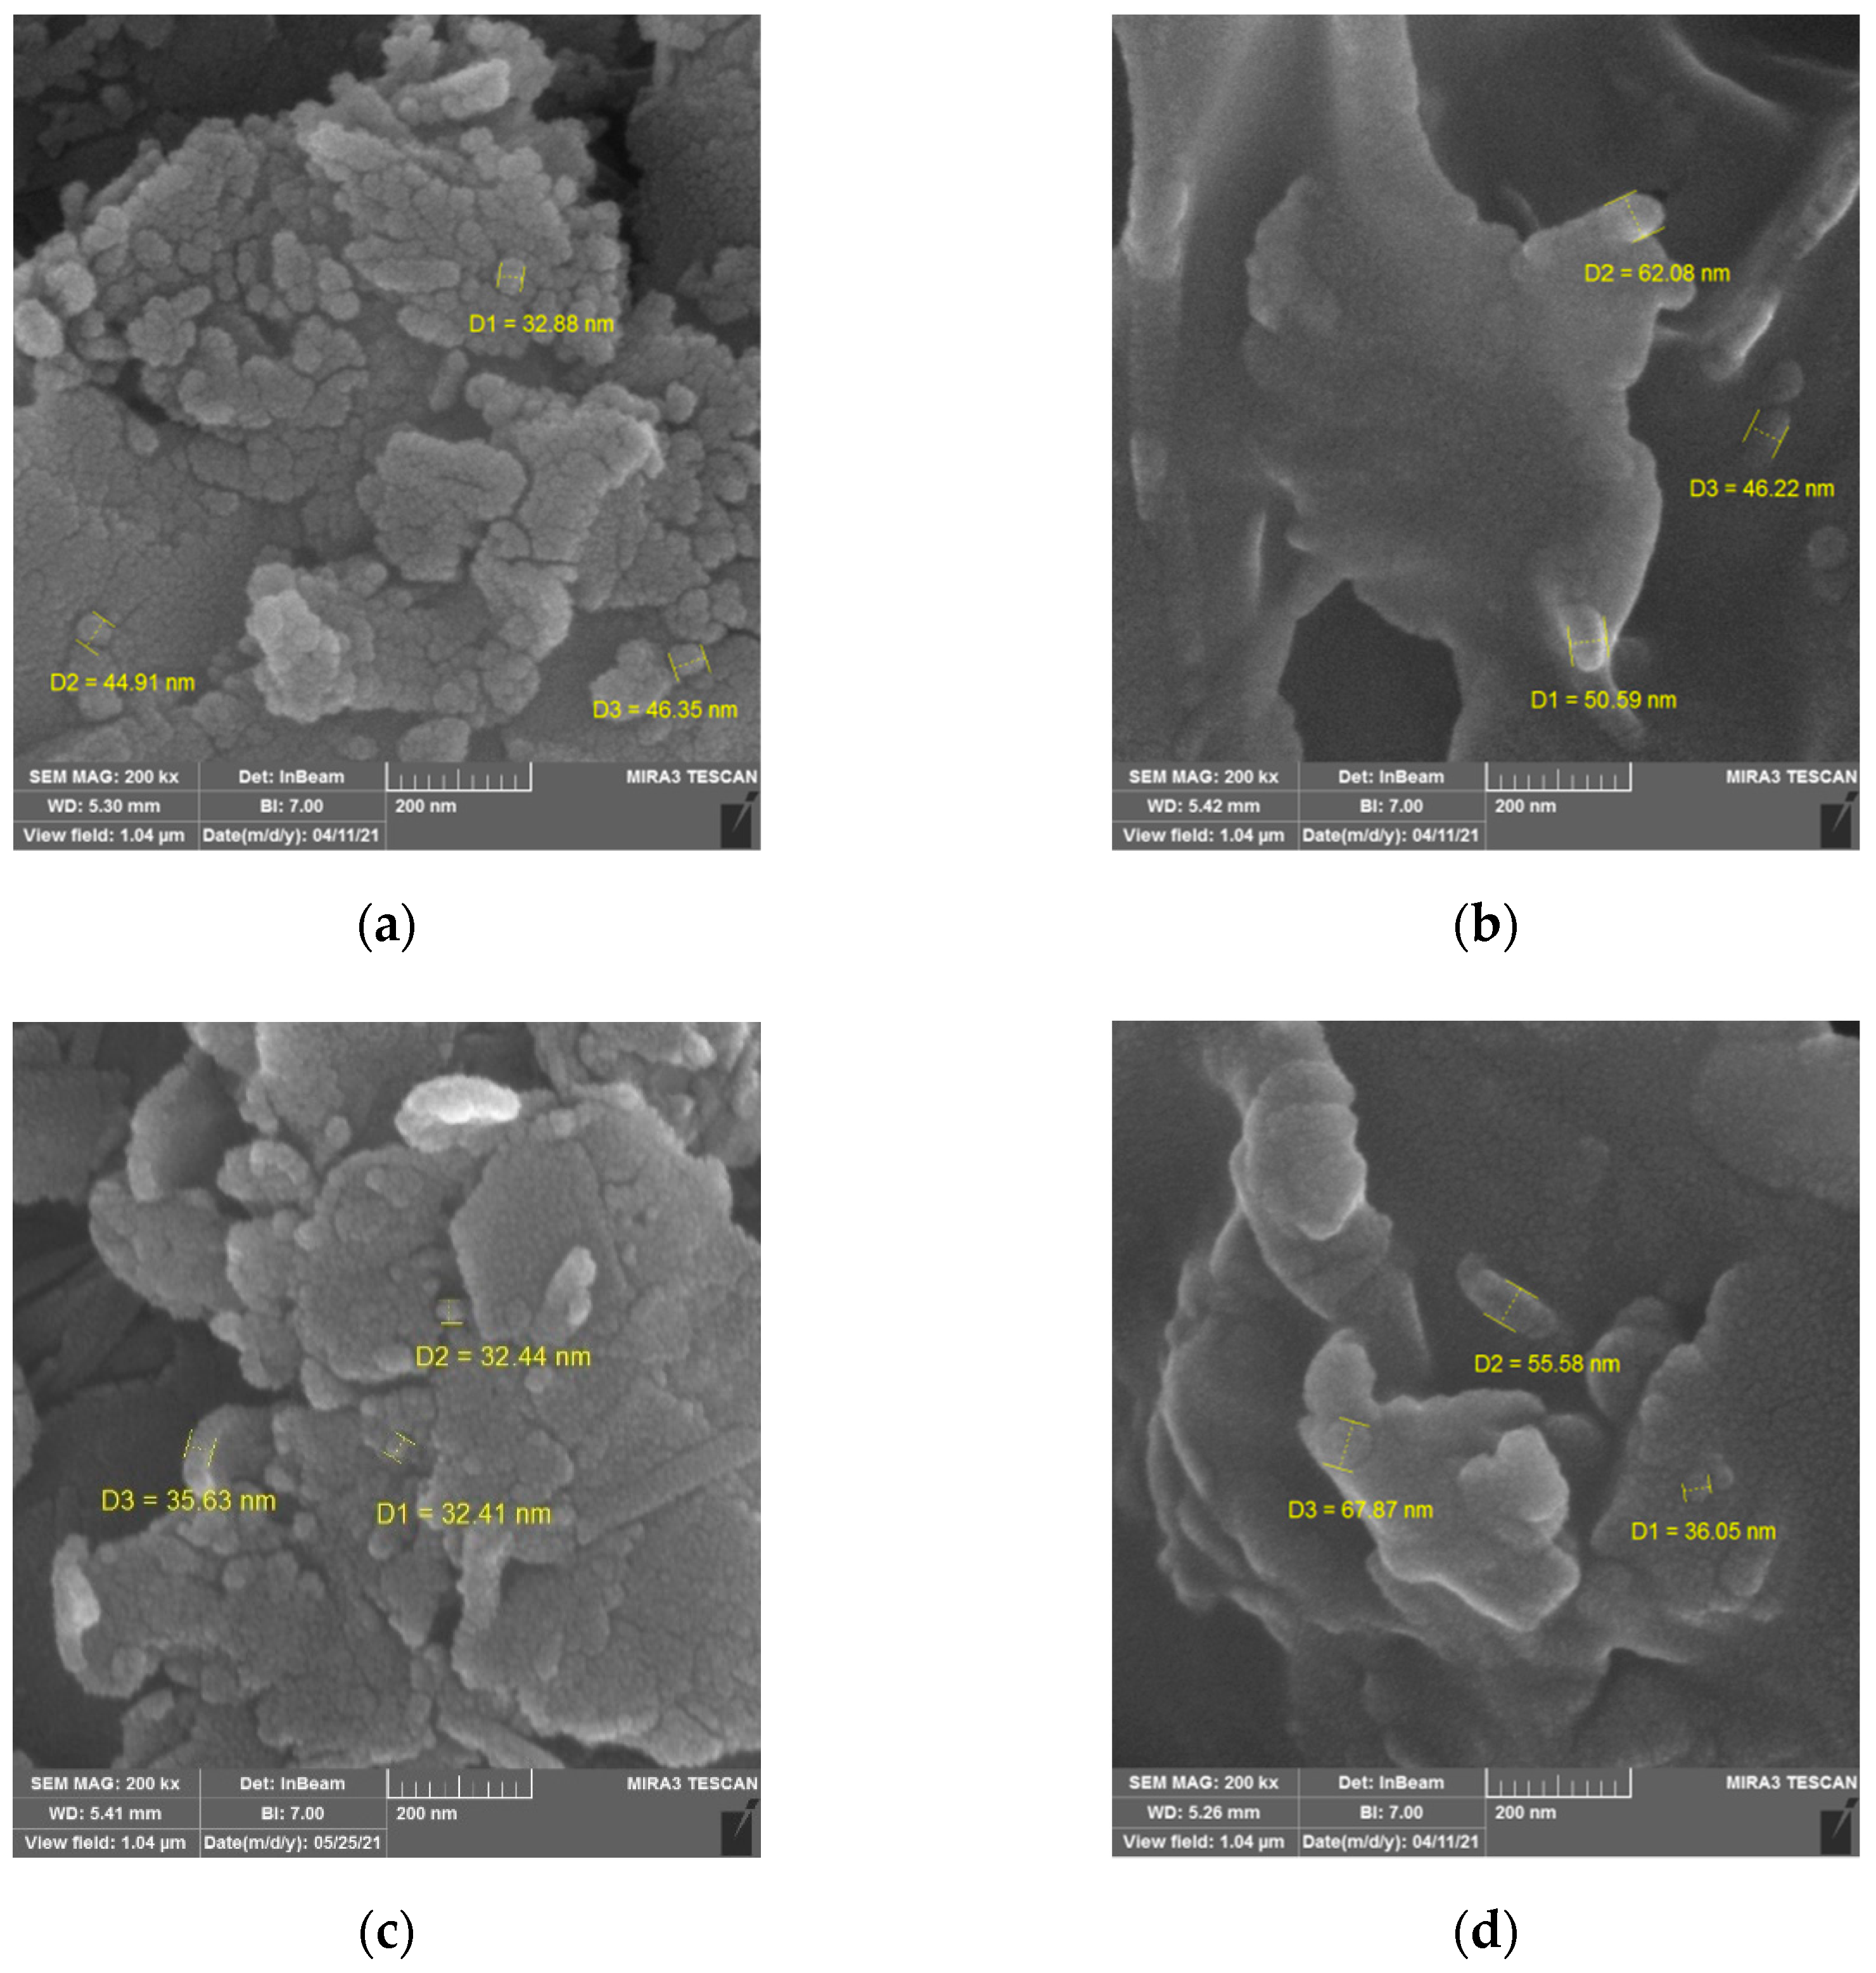
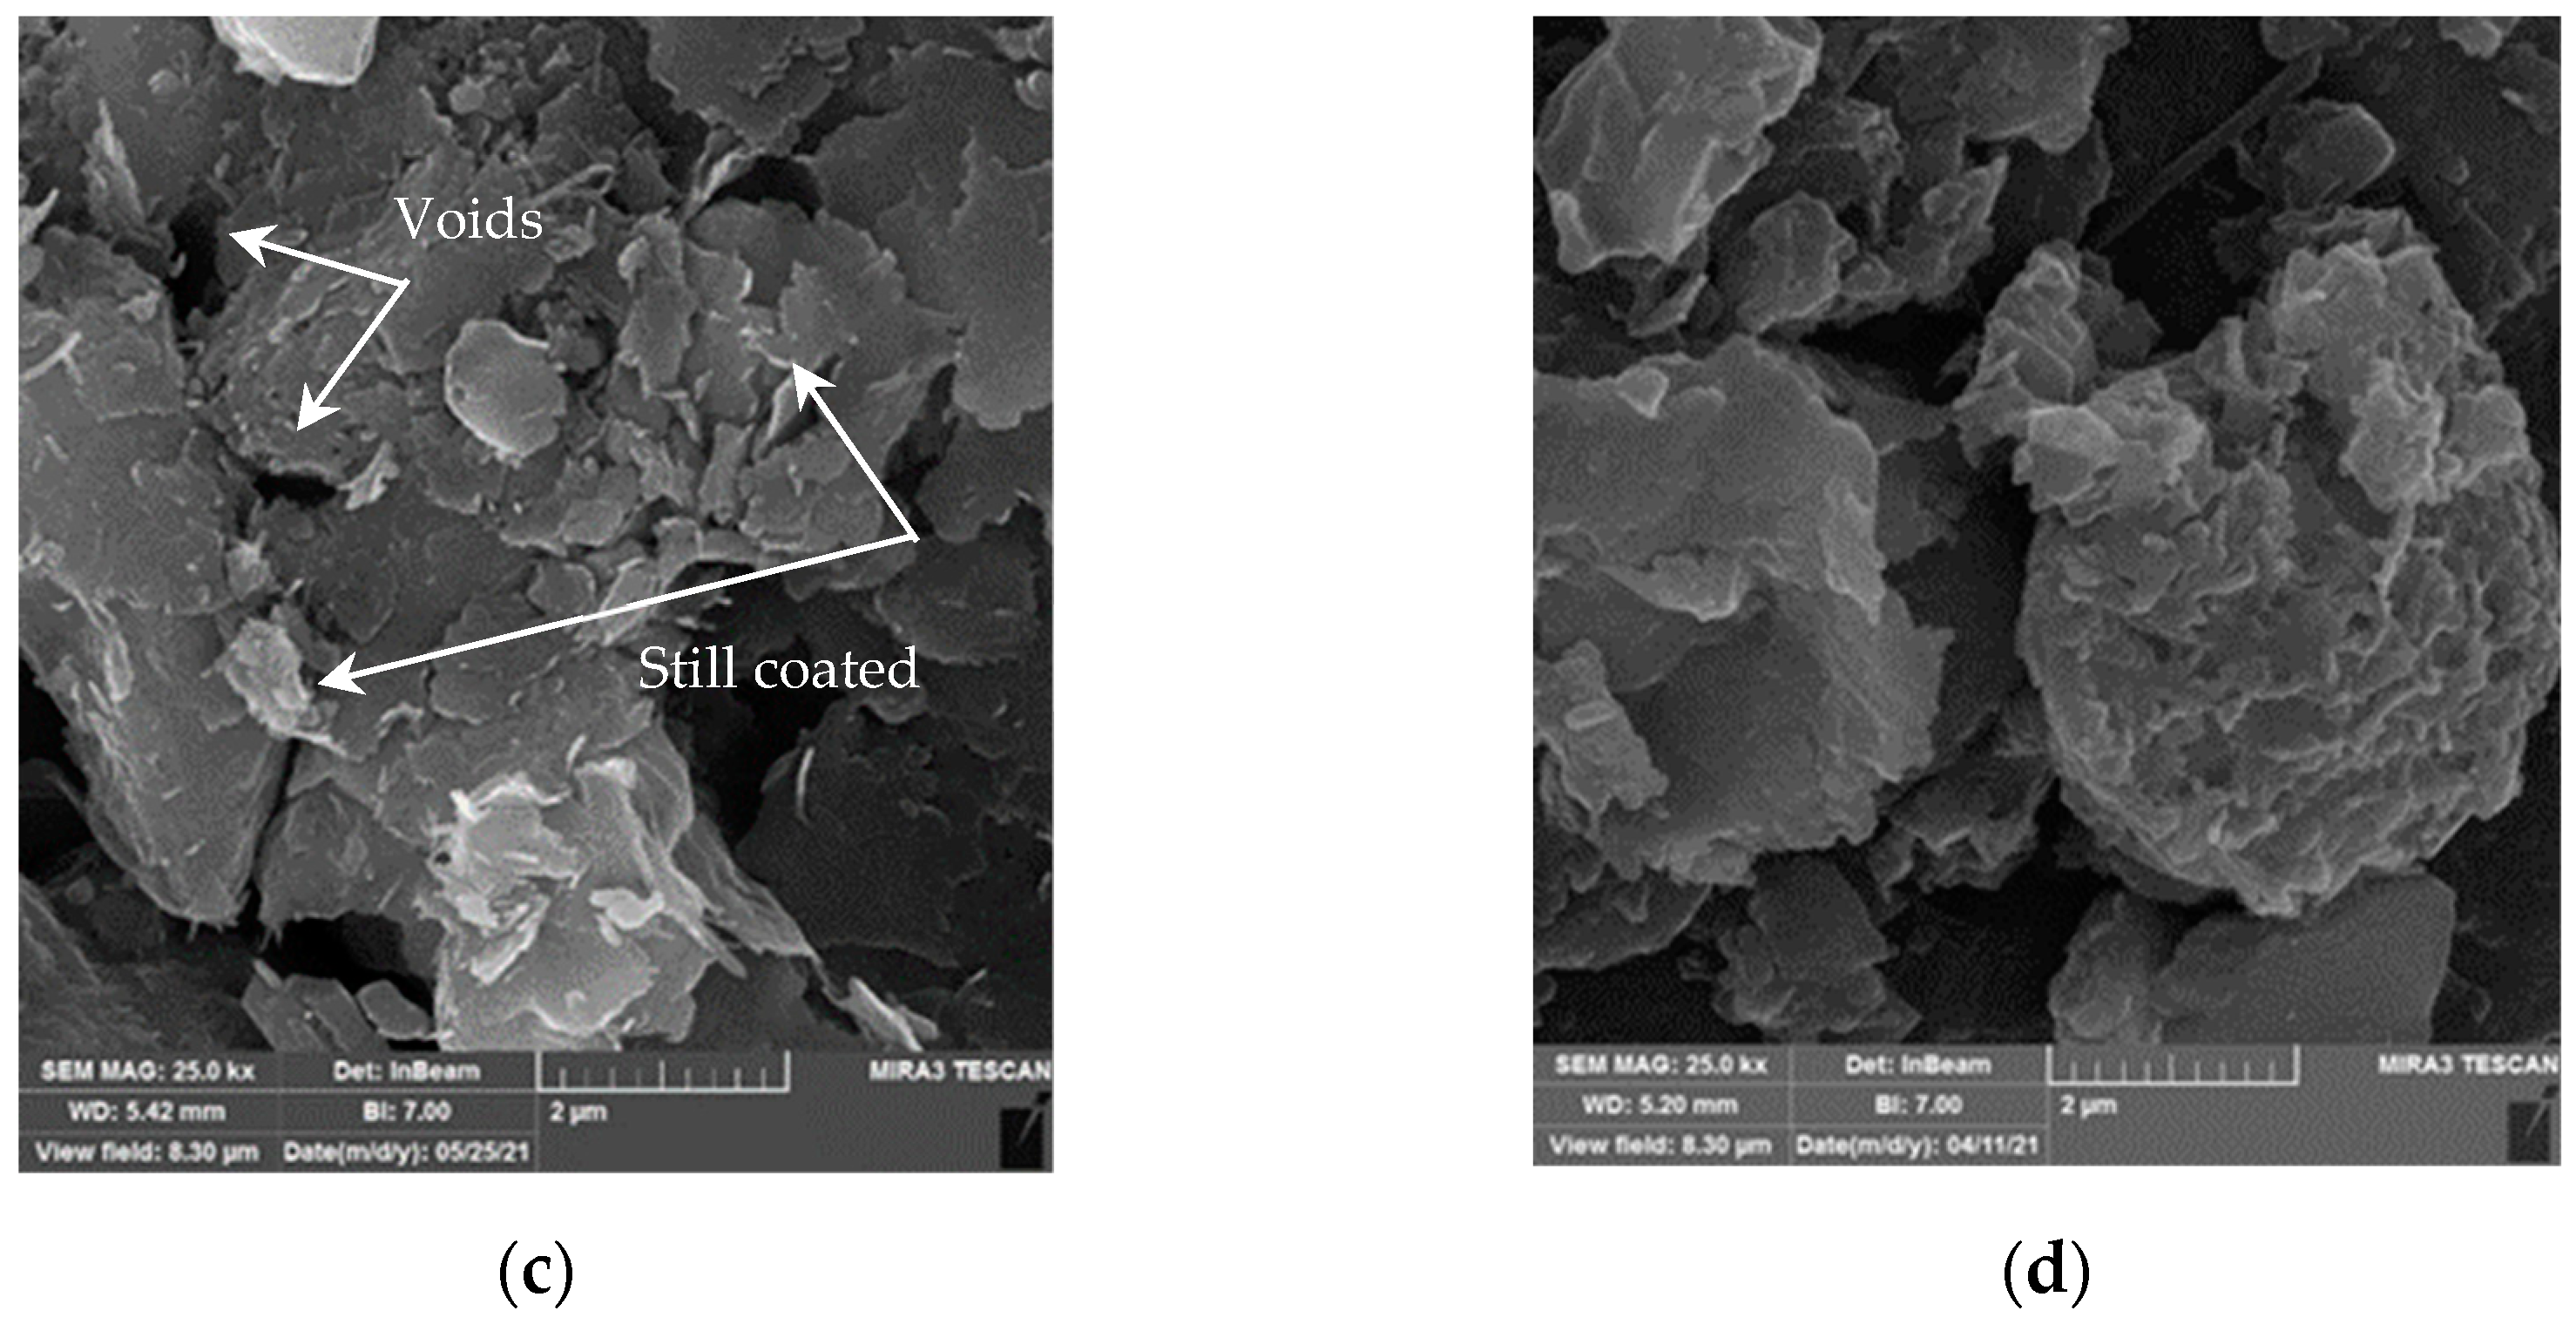
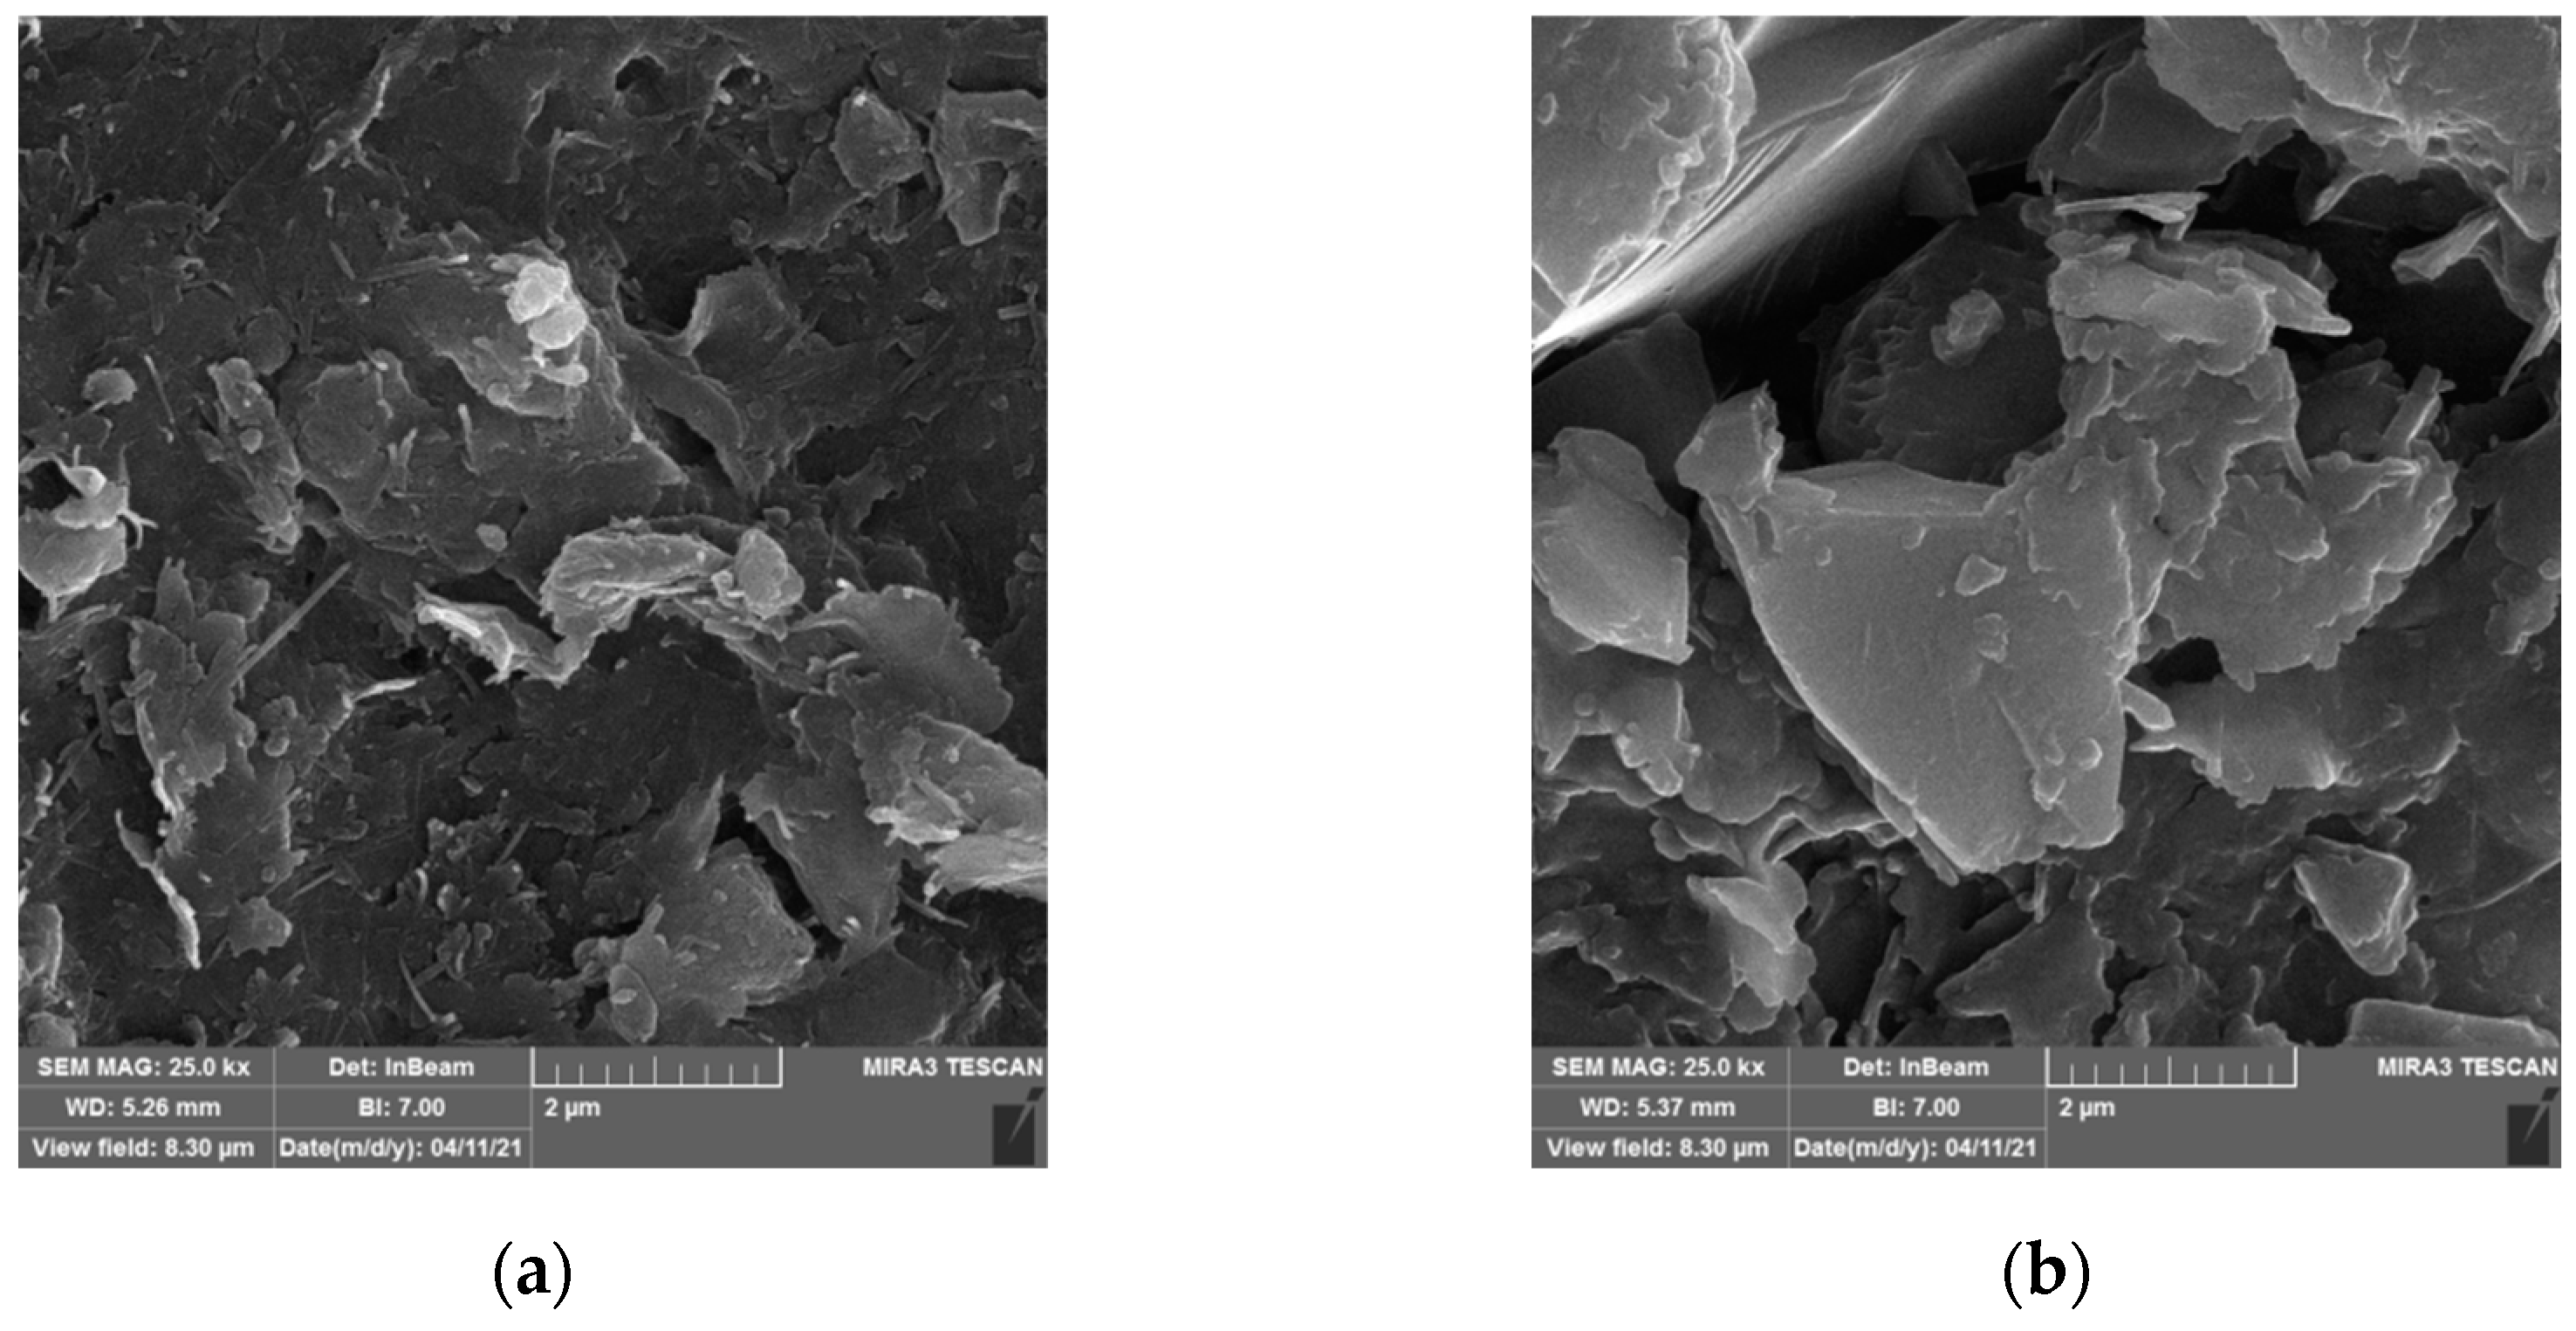
4.5. SEM Analysis
4.6. Chemical Tests
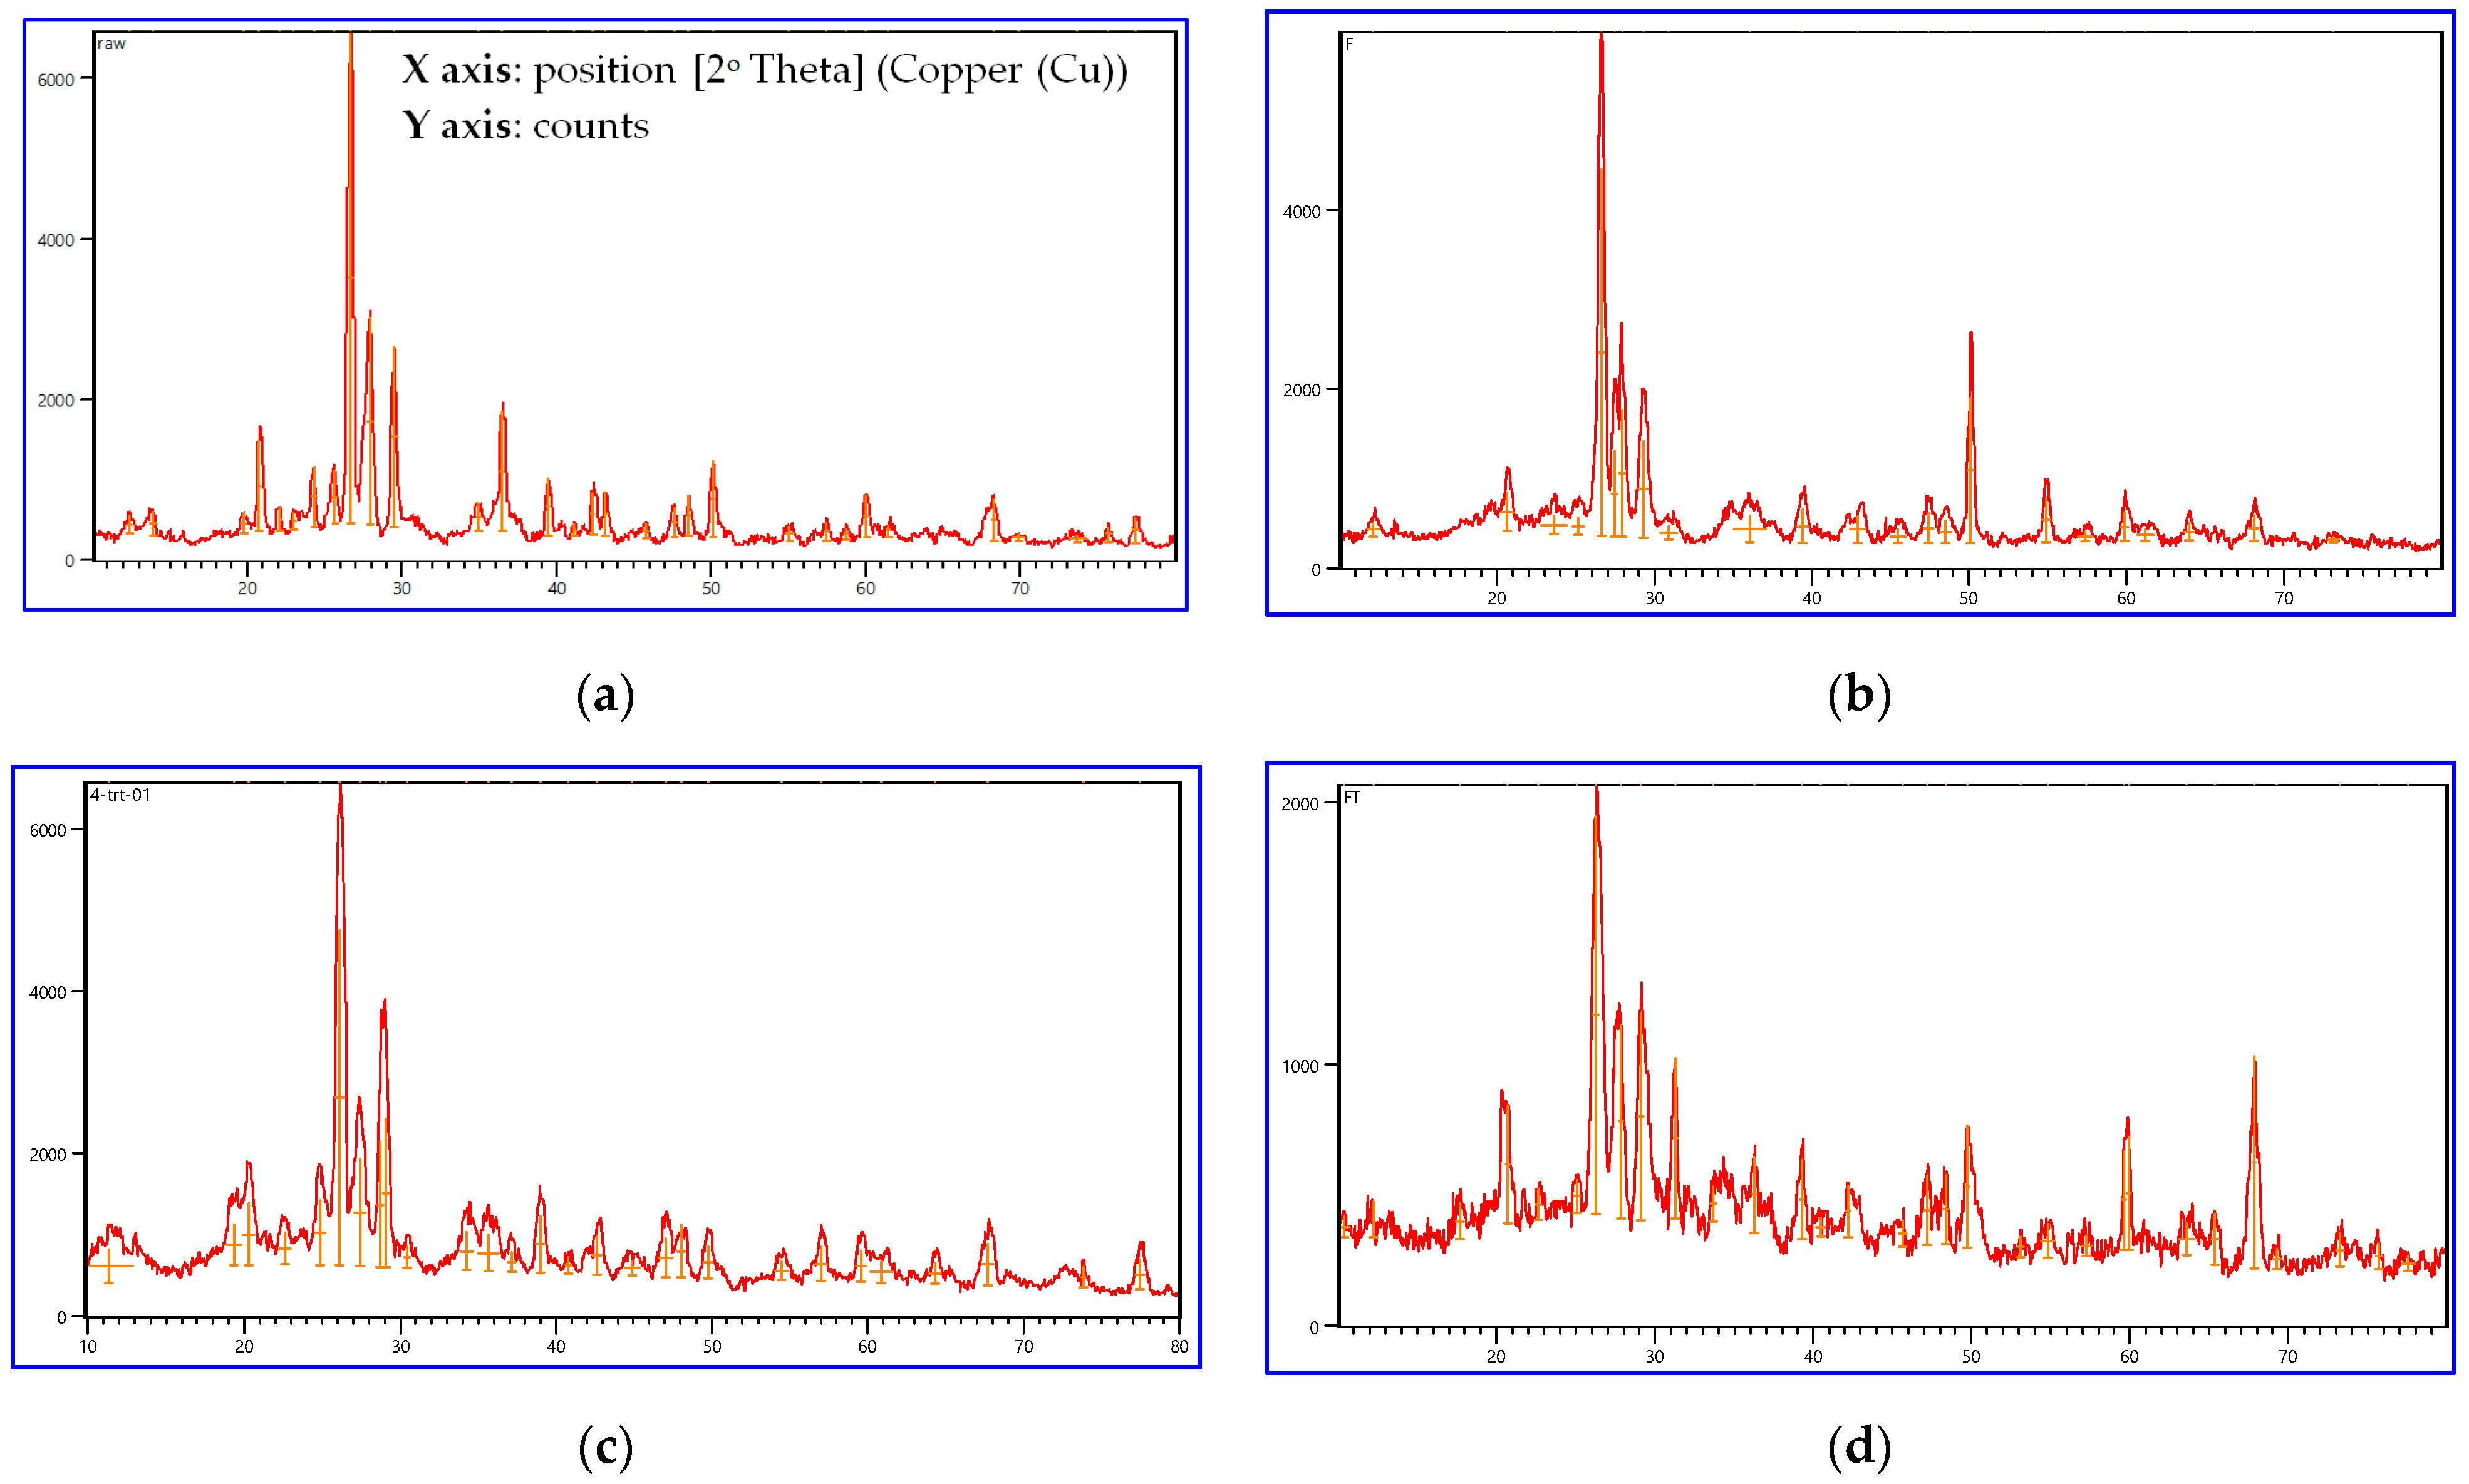
4.7. XRD Tests
5. Conclusions
- The disposal of crude oil resulted in soil contamination at the Khurmala oil field.
- Compaction characteristics and CBR values deteriorated with the presence of crude oil content. At the same time, when the contaminated soil was treated with a stabilization agent containing both types of cement (i.e., CEM II and OPC), an increase in the MDD and OMC and CBR values was observed, but the best result was achieved with CEM II.
- The greatest improvement in the shear strength parameters (c′ and Φ′) was achieved when the contaminated soil was treated using CEM II.
- Generally, the contamination of sandy soil with crude oil induced a permeability reduction, and a further decrease in permeability was detected as the soil solidified with cement.
- A substantial reduction in the oil and grease of the treated soil was achieved using CEM II, compared to soils treated with OPC. The SEM results confirm this.
- The solidification/stabilization (S/S) method provides an effective remediation method for processing waste to produce a safe, dry material acceptable for onsite burial. The application of the S/S process via utilizing cement has an influential role in strengthening the geotechnical characteristics for the contamination of soils with crude oil.
- The remediation of contaminated soil with crude oil utilizing CEM II resulted in a larger improvement compared to when using OPC.
Author Contributions
Funding
Institutional Review Board Statement
Informed Consent Statement
Data Availability Statement
Conflicts of Interest
References
- Wang, M.; Zhang, B.; Li, G.; Wu, T.; Sun, D. Efficient Remediation of Crude Oil-Contaminated Soil Using a Solvent/Surfactant System. RSC Adv. 2019, 9, 2402–2411. [Google Scholar] [CrossRef] [Green Version]
- Urum, K.; Pekdemir, T.; Çopur, M. Screening of Biosurfactants for Crude Oil Contaminated Soil Washing. J. Environ. Eng. Sci. 2005, 4, 487–496. [Google Scholar] [CrossRef]
- Shah, S.J.; Shroff, A.V.; Patel, J.V.; Tiwari, K.C.; Ramakrishnan, D. Stabilization of Fuel Oil Contaminated Soil—A Case Study. Geotech. Geol. Eng. 2003, 21, 415–427. [Google Scholar] [CrossRef]
- Cheng, L.; Shahin, M.A. Stabilisation of Oil-Contaminated Soils Using Microbially Induced Calcite Crystals by Bacterial Flocs. Geotech. Lett. 2017, 7, 146–151. [Google Scholar] [CrossRef]
- Rao, S.M.; Rao, S.S. Ground Heave from Caustic Soda Solution Spillage—A Case Studt. Soils Found. 1994, 34, 13–18. [Google Scholar] [CrossRef] [Green Version]
- Rahman, Z.A.; Hamzah, U.; Taha, R.; Ithnain, N.S.; Ahmad, N. Influence of Oil Contamination on Geotechnical Properties of Basaltic Residual Soil. Am. J. Appl. Sci. 2010, 7, 954–961. [Google Scholar] [CrossRef] [Green Version]
- Meegoda, J.N.; Chen, B.; Gunasekera, S.D.; Pederson, P. Compaction Characteristics of Contaminated Soils-Reuse as a Road Base Material. Geotech. Spec. Publ. 1998, 79, 195–209. [Google Scholar]
- Ratnaweera, P.; Meegoda, J.N. Shear Strength and Stress-Strain Behavior of Contaminated Soils. Geotech. Test. J. 2006, 29, 133–140. [Google Scholar] [CrossRef]
- Khamehchiyan, M.; Hossein Charkhabi, A.; Tajik, M. Effects of Crude Oil Contamination on Geotechnical Properties of Clayey and Sandy Soils. Eng. Geol. 2007, 89, 220–229. [Google Scholar] [CrossRef]
- Estabragh, A.R.; Beytolahpour, I.; Moradi, M.; Javadi, A.A. Consolidation Behavior of Two Fine-Grained Soils Contaminated by Glycerol and Ethanol. Eng. Geol. 2014, 178, 102–108. [Google Scholar] [CrossRef]
- Akinwumi, I.I.; Diwa, D.; Obianigwe, N. Effects of Crude Oil Contamination on the Index Properties, Strength and Permeability of Lateritic Clay. Int. J. Appl. Sci. Eng. Res. 2014, 3, 816–824. [Google Scholar] [CrossRef]
- Wang, Y.; Feng, J.; Lin, Q.; Lyu, X.; Wang, X.; Wang, G. Effects of Crude Oil Contamination on Soil Physical and Chemical Properties in Momoge Wetland of China. Chin. Geogr. Sci. 2013, 23, 708–715. [Google Scholar] [CrossRef]
- Oluremi, J.; Osuolale, O. Oil Contaminated Soil as Potential Applicable Material in Civil Engineering Construction. J. Environ. Earth Sci. Int. J. 2014, 4, 87–100. [Google Scholar]
- Kermani, M.; Ebadi, T. The Effect of Oil Contamination on the Geotechnical Properties of Fine-Grained Soils. Soil Sediment Contam. 2012, 21, 655–671. [Google Scholar] [CrossRef]
- Evgin, E.; Das, B.M. Mechanical Behavior of an Oil Contaminated Sand. In Proceedings of the Mediterranean Conference on Environmental Geotechnology, Izmir, Turkey, 25–27 May 1992; pp. 101–108. [Google Scholar]
- Alfach, M.T.; Wilkinson, S. Effect of Crude-Oil-Contaminated Soil on the Geotechnical Behaviour of Piles Foundation. Geotech. Res. 2020, 7, 76–89. [Google Scholar] [CrossRef] [Green Version]
- Nasehi, S.A.; Uromeihy, A.; Nikudel, M.R.; Morsali, A. Influence of Gas Oil Contamination on Geotechnical Properties of Fine and Coarse-Grained Soils. Geotech. Geol. Eng. 2016, 34, 333–345. [Google Scholar] [CrossRef]
- Khosravi, E.; Ghasemzadeh, H.; Sabour, M.R.; Yazdani, H. Geotechnical Properties of Gas Oil-Contaminated Kaolinite. Eng. Geol. 2013, 166, 11–16. [Google Scholar] [CrossRef]
- Yan, G.; Cai, B.; Chen, C.; Yue, Y.; Wang, Q.; Deng, H.; Liu, S.; Guo, S. Bioremediation of Crude Oil Contaminated Soil. Pet. Sci. Technol. 2015, 33, 717–723. [Google Scholar] [CrossRef]
- Gao, Y.C.; Guo, S.H.; Wang, J.N.; Li, D.; Wang, H.; Zeng, D.H. Effects of Different Remediation Treatments on Crude Oil Contaminated Saline Soil. Chemosphere 2014, 117, 486–493. [Google Scholar] [CrossRef]
- Kang, C.U.; Kim, D.H.; Khan, M.A.; Kumar, R.; Ji, S.E.; Choi, K.W.; Paeng, K.J.; Park, S.; Jeon, B.H. Pyrolytic Remediation of Crude Oil-Contaminated Soil. Sci. Total Environ. 2020, 713, 136498. [Google Scholar] [CrossRef]
- Russell, D.L. Remediation Manual for Petroleum Contaminated Sites; CRC Press, Taylor & Francis Group: Lancaster, UK, 1992; ISBN 9780877628767. [Google Scholar]
- Balba, M.T.; Al-Awadhi, N.; Al-Daher, R. Bioremediation of Oil-Contaminated Soil: Microbiological Methods for Feasibility Assessment and Field Evaluation. J. Microbiol. Methods 1998, 32, 155–164. [Google Scholar] [CrossRef]
- Moon, D.H.; Grubb, D.G.; Reilly, T.L. Stabilization/Solidification of Selenium-Impacted Soils Using Portland Cement and Cement Kiln Dust. J. Hazard. Mater. 2009, 168, 944–951. [Google Scholar] [CrossRef] [PubMed]
- Estabragh, A.R.; Khatibi, M.; Javadi, A.A. Effect of Cement on Treatment of a Clay Soil Contaminated with Glycerol. J. Mater. Civ. Eng. 2016, 28, 04015157. [Google Scholar] [CrossRef] [Green Version]
- Alpaslan, B.; Yukselen, M.A. Remediation of Lead Contaminated Soils by Stabilization/Solidification. Water Air Soil Pollut. 2002, 133, 253–263. [Google Scholar] [CrossRef]
- Dermatas, D.; Meng, X. Utilization of Fly Ash for Stabilization/Solidification of Heavy Metal Contaminated Soils. Eng. Geol. 2003, 70, 377–394. [Google Scholar] [CrossRef]
- Akinwumi, I.I.; Booth, C.A.; Diwa, D.; Mills, P. Cement Stabilisation of Crude-Oil-Contaminated Soil. Proc. Inst. Civ. Eng. Geotech. Eng. 2016, 169, 336–345. [Google Scholar] [CrossRef]
- Yu, C.; Liao, R.; Zhu, C.; Cai, X.; Ma, J. Test on the Stabilization of Oil-Contaminated Wenzhou Clay by Cement. Adv. Civ. Eng. 2018, 2018, 9675479. [Google Scholar] [CrossRef] [Green Version]
- Wang, J.; Guo, Y.; Shang, J.Q.A. Portland Cement Stabilization of Canadian Mature Fine Oil Sands Tailings. Environ. Geotech. 2021, 8, 1–43. [Google Scholar] [CrossRef]
- Taylor, P.; Nasr, A.M.A. Utilisation of Oil-Contaminated Sand Stabilised with Cement Kiln Dust in the Construction of Rural Roads. Int. J. Pavement Eng. 2014, 15, 889–905. [Google Scholar] [CrossRef]
- Graettinger, A.J.; Johnson, P.W.; Sunkari, P.; Duke, M.C.; Al-rawas, A.; Hassan, H.F.; Taha, R. Stabilization of Oil-Contaminated Soils Using Cement and Cement by-Pass Dust. Manag. Environ. Qual. Int. J. 2005, 16, 670–680. [Google Scholar] [CrossRef]
- ASTM. Annual Book of ASTM Soil and Rock; ASTM: West Consh, PA, USA, 2017. [Google Scholar]
- ASTM D4007-11e1. Standard Test Method for Water and Sediment in Crude Oil by the Centrifuge Method (Laboratory Procedure); ASTM Int.: West Consh, PA, USA, 2016. [Google Scholar]
- ASTM D4294-16e1. Standard Test Method for Sulfur in Petroleum and Petroleum Products by Energy Dispersive X-Ray Fluorescence Spectrometry; ASTM Int.: West Consh, PA, USA, 2016. [Google Scholar]
- ASTM D3230-19. Standard Test Method for Salts in Crude Oil (Electrometric Method); ASTM Int.: West Consh, PA, USA, 2019. [Google Scholar]
- ASTM D1298-12b. Standard Test Method for Density, Relative Density, or API Gravity of Crude Petroleum and Liquid Petroleum Products by Hydrometer Method; ASTM Int.: West Consh, PA, USA, 2017. [Google Scholar]
- ASTM D7042-21. Standard Test Method for Dynamic Viscosity and Density of Liquids by Stabinger Viscometer (and the Calculation of Kinematic Viscosity); ASTM Int.: West Consh, PA, USA, 2021. [Google Scholar]
- Head, K.H.; Epps, R.J. Manual of Soil Laboratory Testing, 3rd ed.; Whittles Publishing, CRC Press, Taylor & Francis Group: Boca Raton, FL, USA, 2011. [Google Scholar]
- Al-Sanad, H.A.; Eid, W.K.; Ismael, N.F. Closure to “Geotechnical Properties of Oil-Contaminated Kuwaiti Sand” by Hasan A. Al-Sanad, Walid K. Eid, and Nabil F. Ismael. J. Geotech. Eng. 1996, 122, 787–788. [Google Scholar] [CrossRef]
- Shin, E.C.; Omar, M.T.; Tahmaz, A.A.; Das, B.M. Shear Strength and Hydraulic Conductivity of Oil-Contaminated Sand. In the Fourth International Congress on Environmental Geotechnics; de Mello, L.G., Almeida, M., Eds.; Balkema Publishers: Rio de Janeiro, Brazil, 2002; pp. 9–13. [Google Scholar]
- Ghaly, A.M. Strength Remediation of Oil Contaminated Sands. In The 17th International Conference on Solid Waste Technology and Management; Zandi, I., Mersky, R.L., Shieh, W.K., Eds.; Widener University: Philadelphia, PA, USA, 2001; pp. 289–298. [Google Scholar]
- Abousnina, R.M.; Manalo, A.; Shiau, J.; Lokuge, W. Effects of Light Crude Oil Contamination on the Physical and Mechanical Properties of Fine Sand. Soil Sediment Contam. 2015, 24, 833–845. [Google Scholar] [CrossRef]
- Wang, L. Cementitious Stabilization of Soils in the Presence of Sulfate. Ph.D. Thesis, Louisiana State University, Baton Rouge, LA, USA, 2002. [Google Scholar]
- Prusinski, J.R.; Bhattacharja, S. Effectiveness of Portland Cement and Lime in Stabilizing Clay Soils. Transp. Res. Rec. 1998, 1652, 215–227. [Google Scholar] [CrossRef]
- Ural, N. The Significance of Scanning Electron Microscopy (SEM) Analysis on the Microstructure of Improved Clay: An Overview. Open Geosci. 2021, 13, 197–218. [Google Scholar] [CrossRef]
- Ergozhin, Y.; Dzhusipbekov, U.; Teltayev, B.; Nurgalieva, G.; Shakirova, A.; Khudaibergenova, K.; Izmailova, G.; Yelshibayev, N. Crude Oil Contaminated Soil: Its Neutralization and Use. Sustainability 2020, 12, 3087. [Google Scholar] [CrossRef] [Green Version]
- Bol, P.; Kuany, G.; Zhou, X.; Abdelhafeez, I.A.; Abdelhafez, A.A. Oil Contaminated Soil, Global Environmental Impact (Overview). Int. J. Curr. Sci. Eng. 2019, 1, 124–129. [Google Scholar]
- Wang, S.; Xu, Y.; Lin, Z.; Zhang, J.; Norbu, N.; Liu, W. The Harm of Petroleum-Polluted Soil and Its Remediation Research. AIP Conf. Proc. 2017, 1864, 020222. [Google Scholar] [CrossRef] [Green Version]
- Trejos-Delgado, C.; Cadavid-Restrepo, G.E.; Hormaza-Anaguano, A.; Agudelo, E.A.; Barrios-Ziolo, L.; Loaiza-Usuga, J.C.; Cardona-Gallo, S.A. Oil Bioremediation in a Tropical Contaminated Soil Using a Reactor. An. Acad. Bras. Cienc. 2020, 92, 1–18. [Google Scholar] [CrossRef]
- Jabbarov, Z.; Abdrakhmanov, T.; Pulatov, A.; Kováčik, P.; Pirmatov, K. Change in the Parameters of Soils Contaminated by Oil and Oil Products. Agriculture 2019, 65, 88–98. [Google Scholar] [CrossRef] [Green Version]
- Kohli, R.; Mittal, K.L. Developments in Surface Contamination and Cleaning; Elsevier: Amsterdam, The Netherlands, 2019; Chapter three; pp. 23–105. ISBN 9780128160817. [Google Scholar]
- Aziz, S.Q. Landfill Leachate Treatment Using Powdered Activated Carbon Augmented Sequencing Batch Reactor (SBR) Process. Ph.D. Thesis, Universiti Sains Malaysia, Gelugor, Malaysia, 2011. [Google Scholar]


| Soil Properties | Natural Soil | Standard | |
|---|---|---|---|
| Natural moisture content | w (%) | 2.4 | ASTM D2216 [33] |
| Specific Gravity | Gs | 2.67 | ASTM D854 [33] |
| Grain size | Gravel (%) | 19.51 | ASTM D421-85(2007) [33] ASTM D2217-85 R98 [33] |
| Sand (%) | 66.05 | ||
| Fines (%) | 14.45 | ||
| Cu | 3.47 | ||
| Cc | 1.06 | ||
| Soil classification | USCS | SM | ASTM D2487 [33] |
| AASHTO | A-2-4 | ||
| Maximum dry unit weight | γd max (kN/m3) | 17.6 | ASTM D698 [33] |
| Optimum moisture content | (%) | 12.6 | |
| Angle of internal friction | Φ | 28.56° | ASTM D3080 [33] |
| Cohesion | C (kPa) | 34.5 | |
| Coefficient of permeability | k (cm/s) | 3.47 × 10⁻⁵ | ASTM D2434 [33] ASTM D5084 [33] |
| CBR | Unsoaked CBR % | 41.883 | ASTM D1883 [33] |
| Soaked CBR % | 25.257 | ||
| Parameter | Unit | Value |
|---|---|---|
| pH | 7.7 | |
| Electrical conductivity | µmho/cm | 703 |
| Alkalinity | mg/L | 39 |
| Carbonate | mg/L | 0 |
| Bicarbonate | mg/L | 39 |
| Sulfate | mg/L | 104 |
| Chloride | mg/L | 132 |
| Total organic carbon | % | 0.43 |
| Oil and Grease | % | 0.52 |
| Test | H2S (ppm) | BS&W * (%) | Total Sulphur (%) | Salt (ptb) ** | Density (kg/m3) | API Gravity (at 15.6 °C) | Viscosity (mm2/s) |
|---|---|---|---|---|---|---|---|
| Standard | UOP 163 | ASTM D4007 [34] | ASTM D4294 [35] | ASTM D3230 [36] | ASTM D1298 [37] | ASTM D1298 [37] | ASTM D7042 [38] |
| Results | 41.3 | 0.6 | 2.22 | 229 | 863.1 | 32.29 | 12.8 |
| Chemical Analysis | Results (%) | |
|---|---|---|
| CEM II | OPC | |
| SiO2 | 20.04 | 20.17 |
| CaO | 61.84 | 63.11 |
| Al2O3 | 4.37 | 4.22 |
| Fe2O3 | 3.71 | 3.78 |
| MgO | 3.48 | 3.82 |
| SO3 | 2.67 | 2.08 |
| Insoluble Material | 0.32 | 0.59 |
| Loss of Ignition | 3.05 | 1.55 |
| Lime Saturation Factor | 0.87 | 0.96 |
| C3A | 5.3 | 4.79 |
| C3S | 42.09 | 63.94 |
| C2S | 25.72 | 9.79 |
| C4AF | 11.28 | 11.5 |
| Soil Properties | Natural Soil | Contaminated Soil | Treatment Soil with CEM II | Treatment Soil with OPC | |
|---|---|---|---|---|---|
| Coefficient of permeability | k (cm/s) | 3.47 × 10⁻⁵ | 7.34 × 10⁻⁶ | 4.55 × 10⁻⁸ | 4.87 × 10⁻⁶ |
| Soil Identification | Maximum Dry Unit Weight (kN/m3) | Optimum Moisture Content % | CBR % | |
|---|---|---|---|---|
| Unsoaked | Soaked | |||
| Natural Soil | 17.60 | 12.6 | 41.88 | 25.25 |
| Contaminated Soil | 15.89 | 12.2 | 26.24 | 23.72 |
| Treatment Soil with CEM II | 16.55 | 18.7 | 75.16 | 38.26 |
| Treatment Soil with OPC | 16.01 | 14.5 | 60.35 | 34.68 |
| Parameter | Unit | Results | |||
|---|---|---|---|---|---|
| Natural | Contaminated | Stabilized with CEM II | Stabilized with OPC | ||
| pH | 7.7 | 7.9 | 7.1 | 12.74 | |
| Electrical conductivity | µmho/cm | 703 | 599 | 3160 | 4710 |
| Alkalinity | mg/L | 39 | 87 | 106 | 87 |
| Carbonate | mg/L | 0 | 0 | 0 | 87 |
| Bicarbonate | mg/L | 39 | 87 | 106 | 0 |
| Sulfate | mg/L | 104 | II52 | 1320 | 20 |
| Chloride | mg/L | 132 | 104 | 65 | 52 |
| Total organic carbon | % | 0.43 | 11.7 | 0.8 | 8.2 |
| Oil and Grease | % | 0.52 | 14 | 0.96 | 9.8 |
| Soil Type | Compound Name and Chemical Formula | ||||||||
|---|---|---|---|---|---|---|---|---|---|
| Silicon Oxide | Calcium Carbonate | Albite Low | Calcium Aluminum Silicate | Aluminum Calcium Silicon | Magnesium Aluminum Silicate | Iron Silicate Hydroxide | Magnesium Dialuminium Disilicide–U1 | Sodium Aluminum Silicate Hydrate | |
| SiO2 | CaCO3 | Al1 NaO8 Si3 | Ca Al2 Si2 O8 | Al2 Ca3 Si2 | Mg2 Al4 Si5 O18 | Fe3 Si2 O5 (OH)4 | Al2 Mg Si2 | Na3 Al3 Si3 O12 (H2O)1.8 | |
| Natural | 76 | 73 | 66 | ||||||
| Contaminated | 82 | 74 | 61 | ||||||
| Stabilized OPC | 66 | - | 53 | 41 | |||||
| Stabilized CEM II | 71 | 69 | 54 | 69 | 66 | ||||
Publisher’s Note: MDPI stays neutral with regard to jurisdictional claims in published maps and institutional affiliations. |
© 2021 by the authors. Licensee MDPI, Basel, Switzerland. This article is an open access article distributed under the terms and conditions of the Creative Commons Attribution (CC BY) license (https://creativecommons.org/licenses/by/4.0/).
Share and Cite
Abdulhamid, S.N.; Hasan, A.M.; Aziz, S.Q. Solidification/Stabilization of Contaminated Soil in a South Station of the Khurmala Oil Field in Kurdistan Region, Iraq. Appl. Sci. 2021, 11, 7474. https://doi.org/10.3390/app11167474
Abdulhamid SN, Hasan AM, Aziz SQ. Solidification/Stabilization of Contaminated Soil in a South Station of the Khurmala Oil Field in Kurdistan Region, Iraq. Applied Sciences. 2021; 11(16):7474. https://doi.org/10.3390/app11167474
Chicago/Turabian StyleAbdulhamid, Sazan Nariman, Ahmed Mohammed Hasan, and Shuokr Qarani Aziz. 2021. "Solidification/Stabilization of Contaminated Soil in a South Station of the Khurmala Oil Field in Kurdistan Region, Iraq" Applied Sciences 11, no. 16: 7474. https://doi.org/10.3390/app11167474
APA StyleAbdulhamid, S. N., Hasan, A. M., & Aziz, S. Q. (2021). Solidification/Stabilization of Contaminated Soil in a South Station of the Khurmala Oil Field in Kurdistan Region, Iraq. Applied Sciences, 11(16), 7474. https://doi.org/10.3390/app11167474