
Morphological Foot Model for Temperature Pattern Analysis Proposed for Diabetic Foot Disorders

 , ,
, ,  , and
, and
Abstract
:1. Introduction
2. Materials and Methods
2.1. Image Acquisition
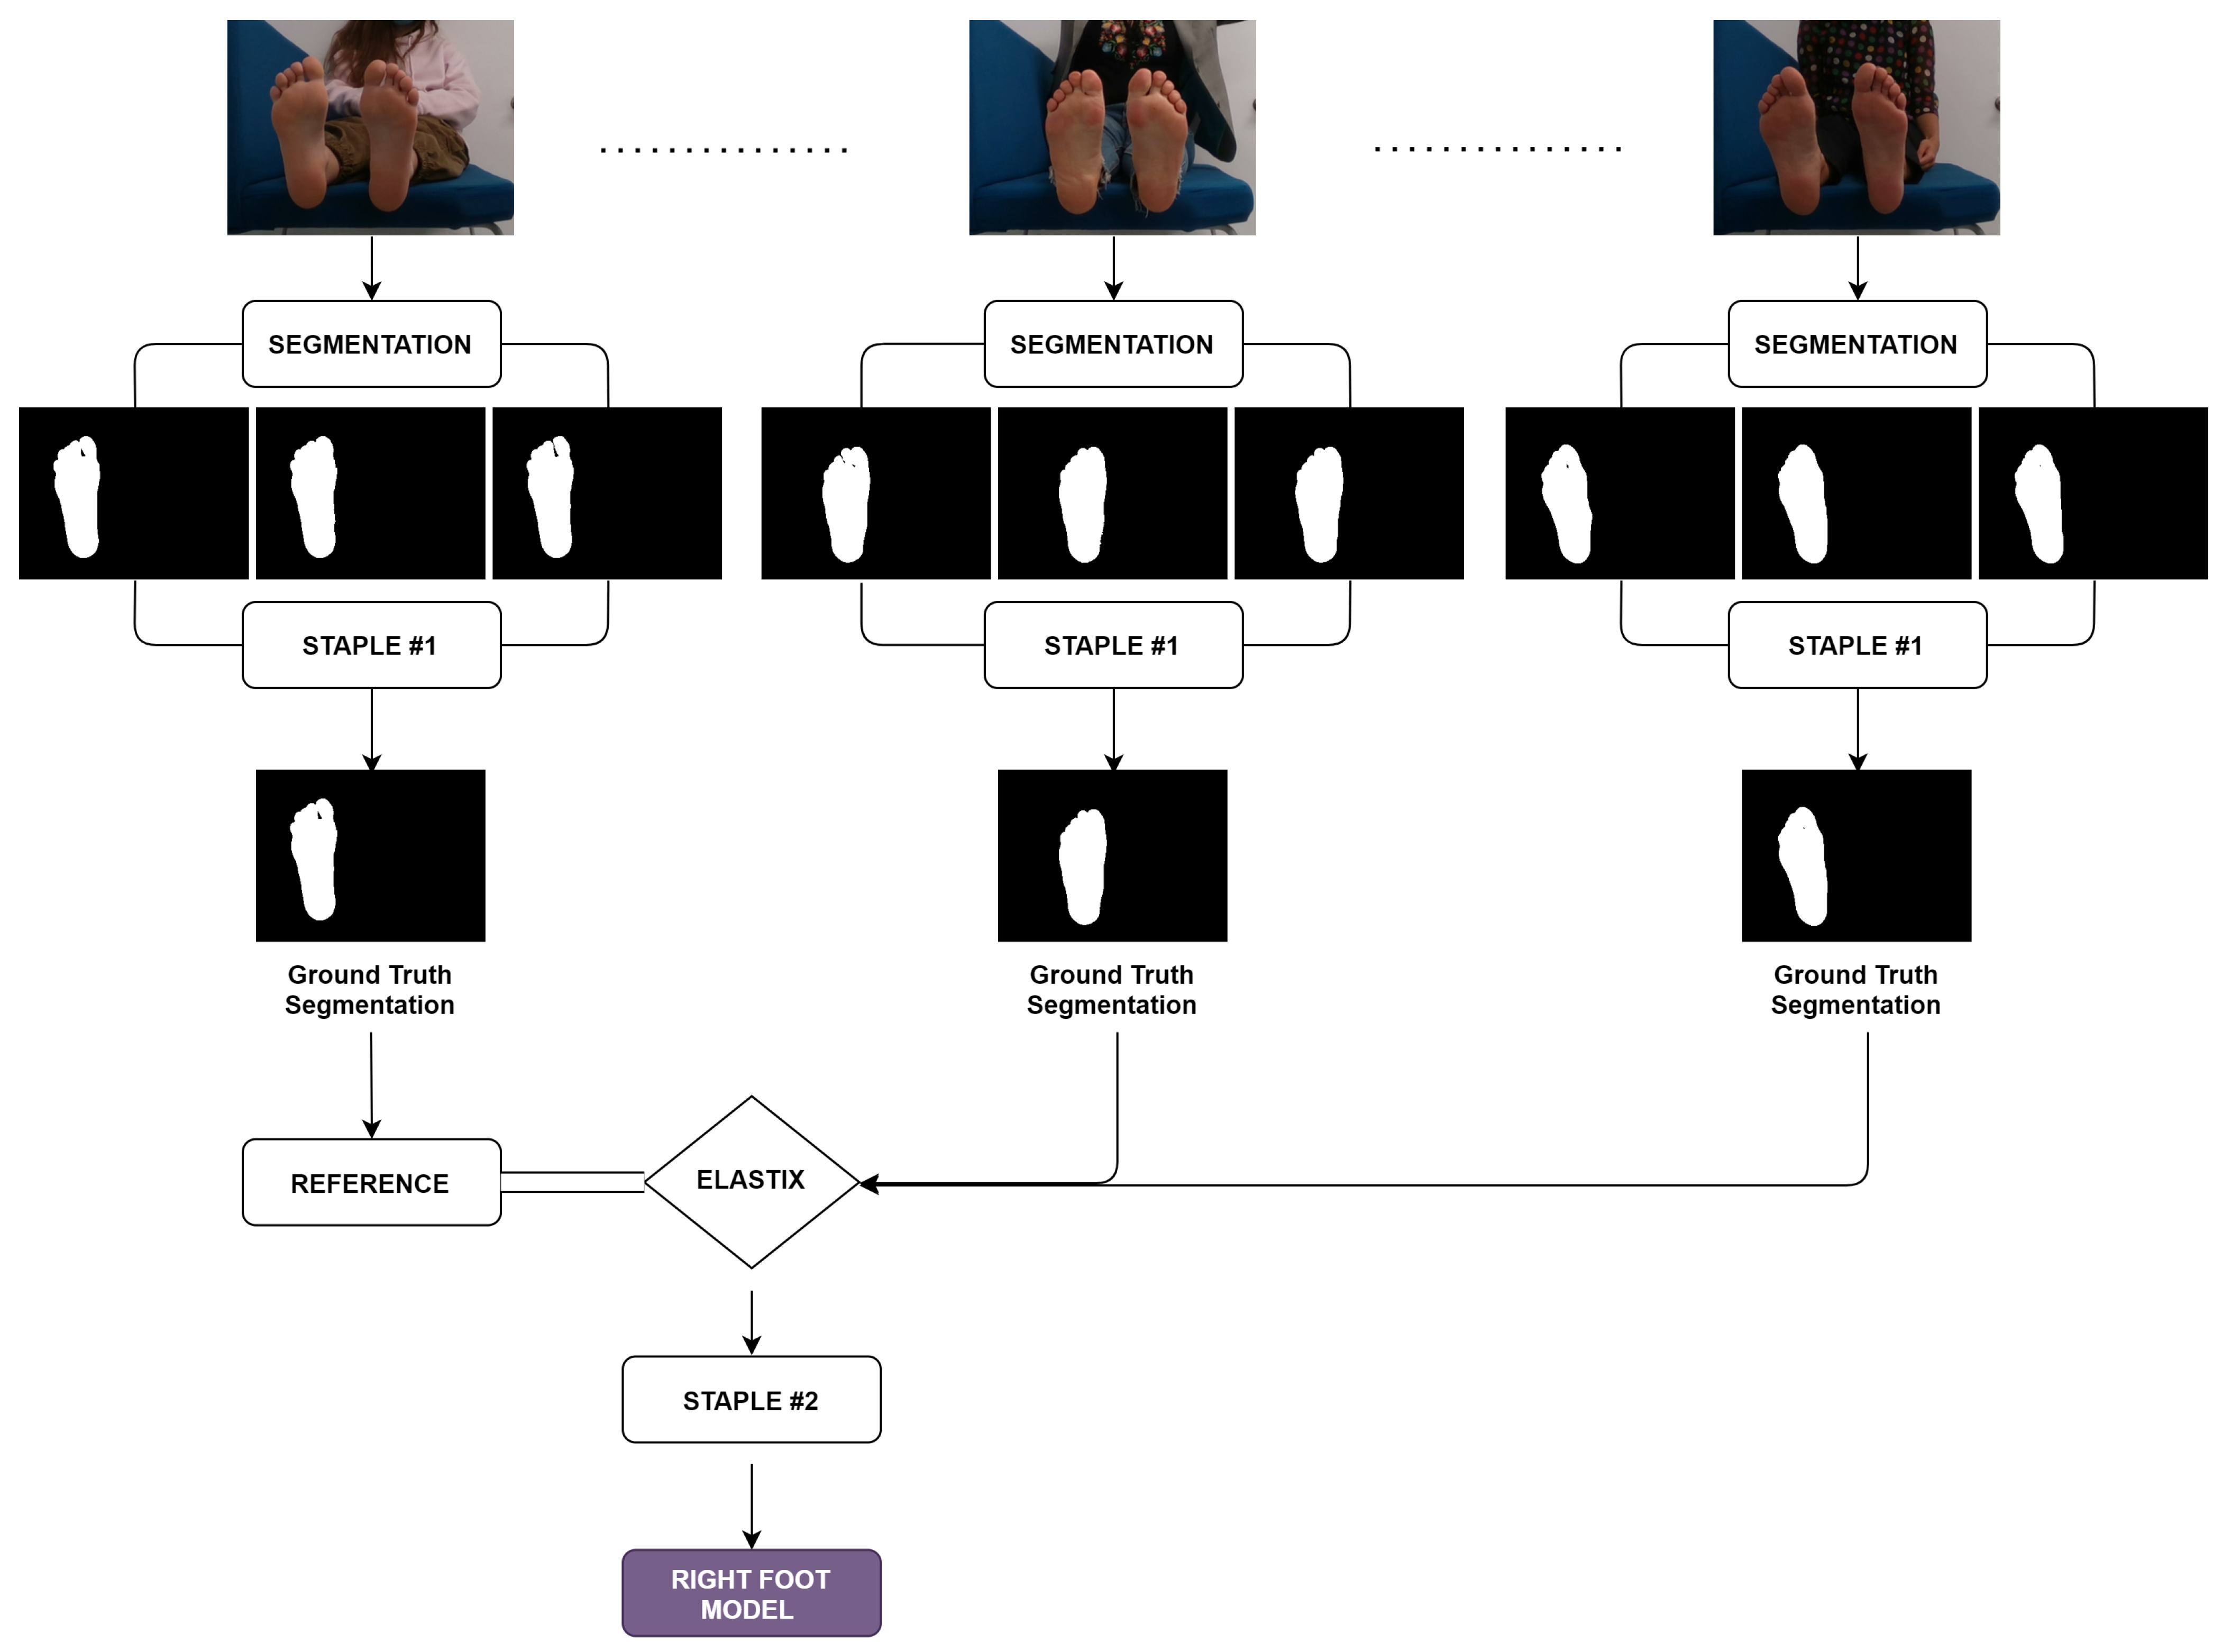
2.2. Ground Truth Establishment
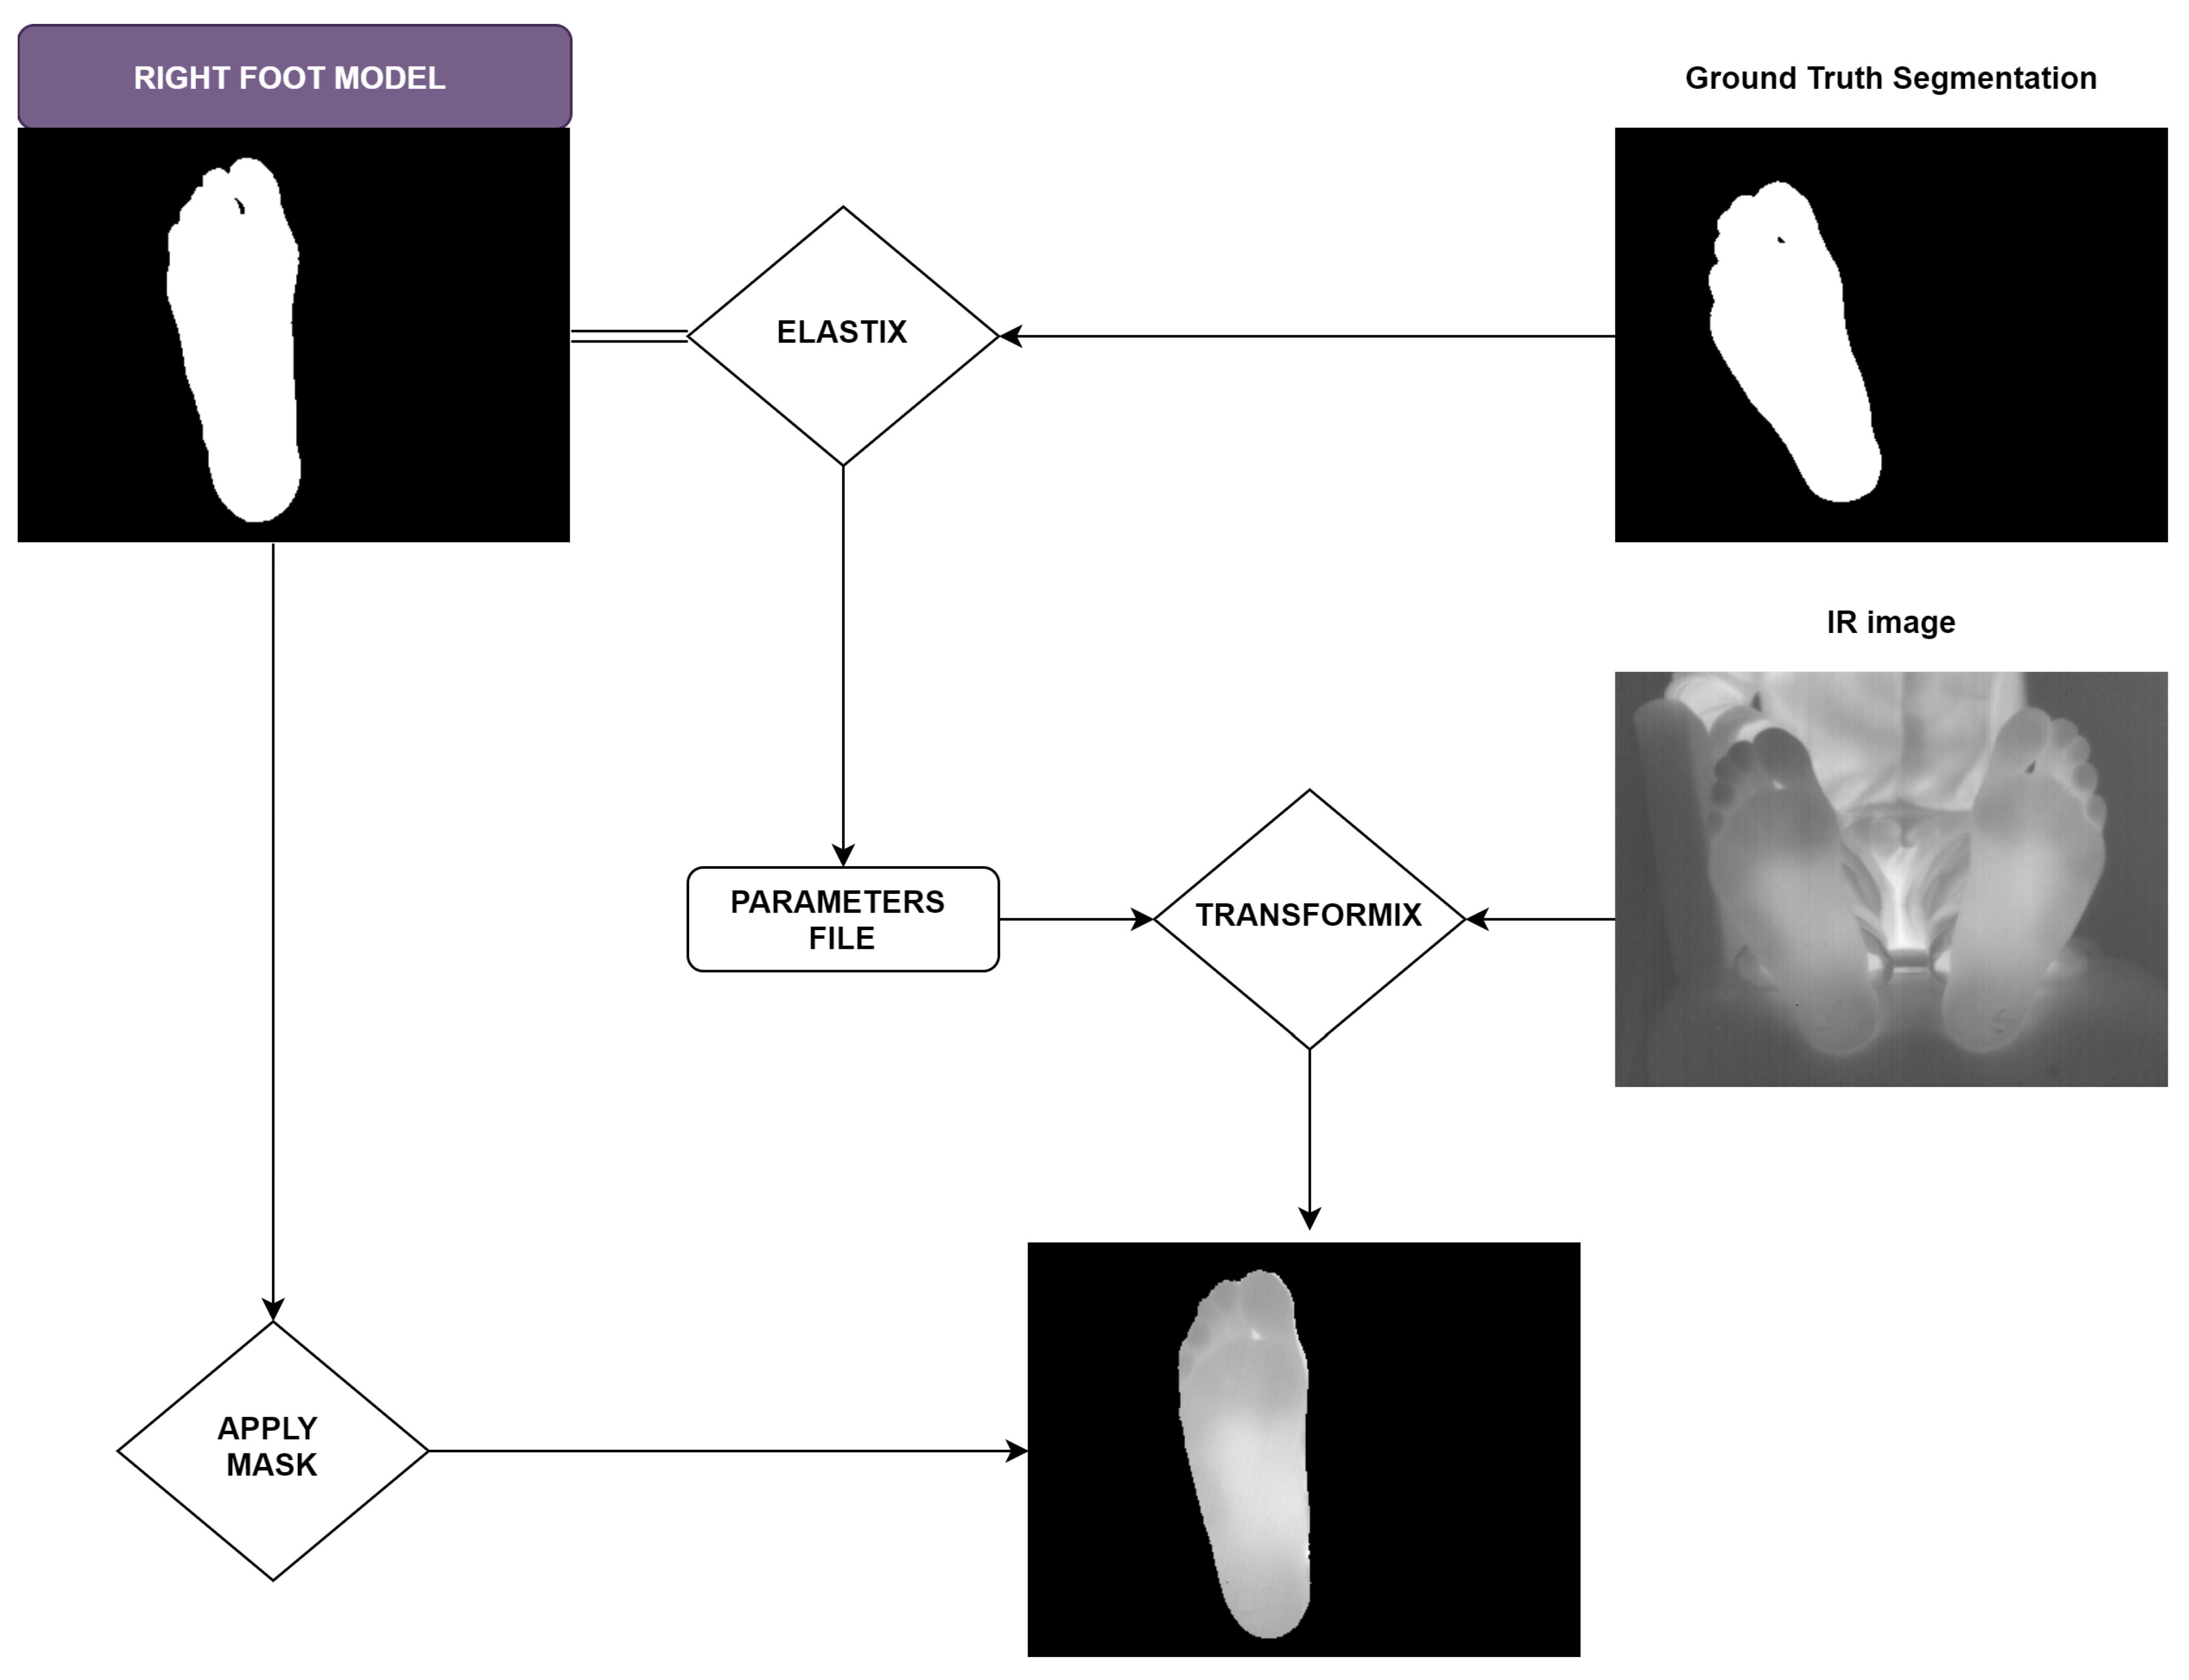
2.3. Foot Model Extraction
2.4. Evaluation Metrics
2.5. Statistical Analysis
3. Results and Discussion
3.1. Ground Truth Establishment
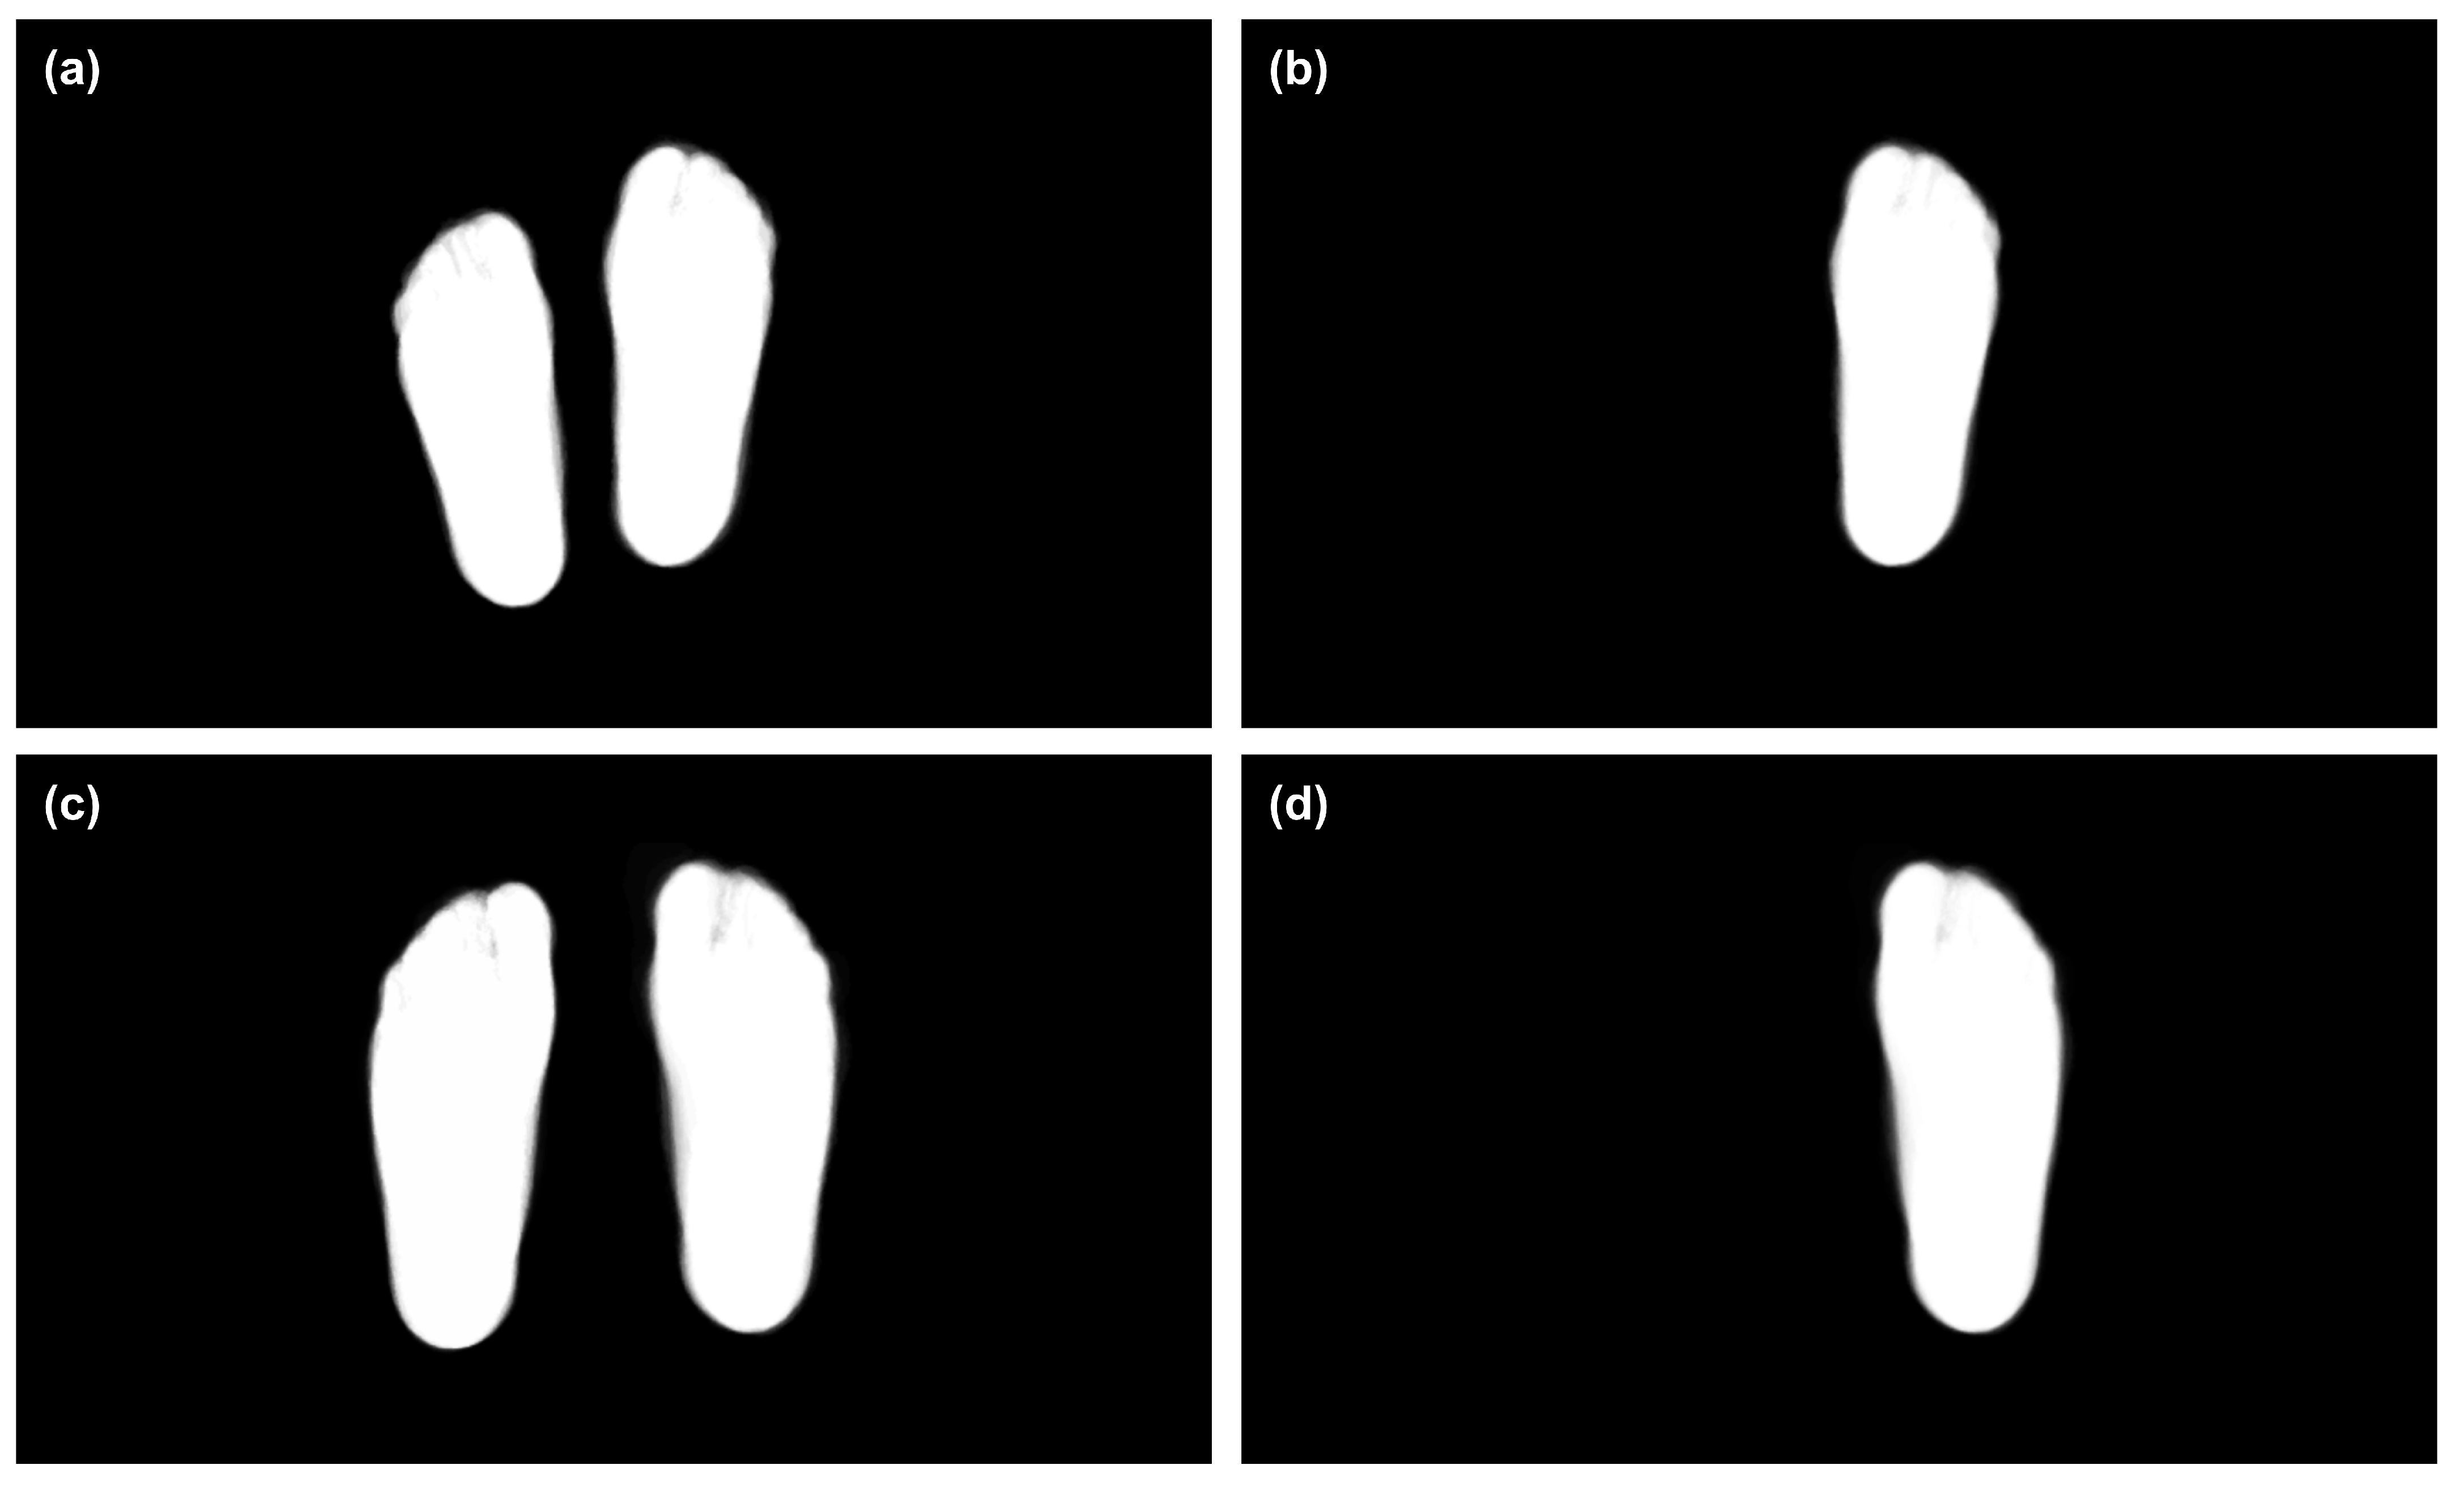
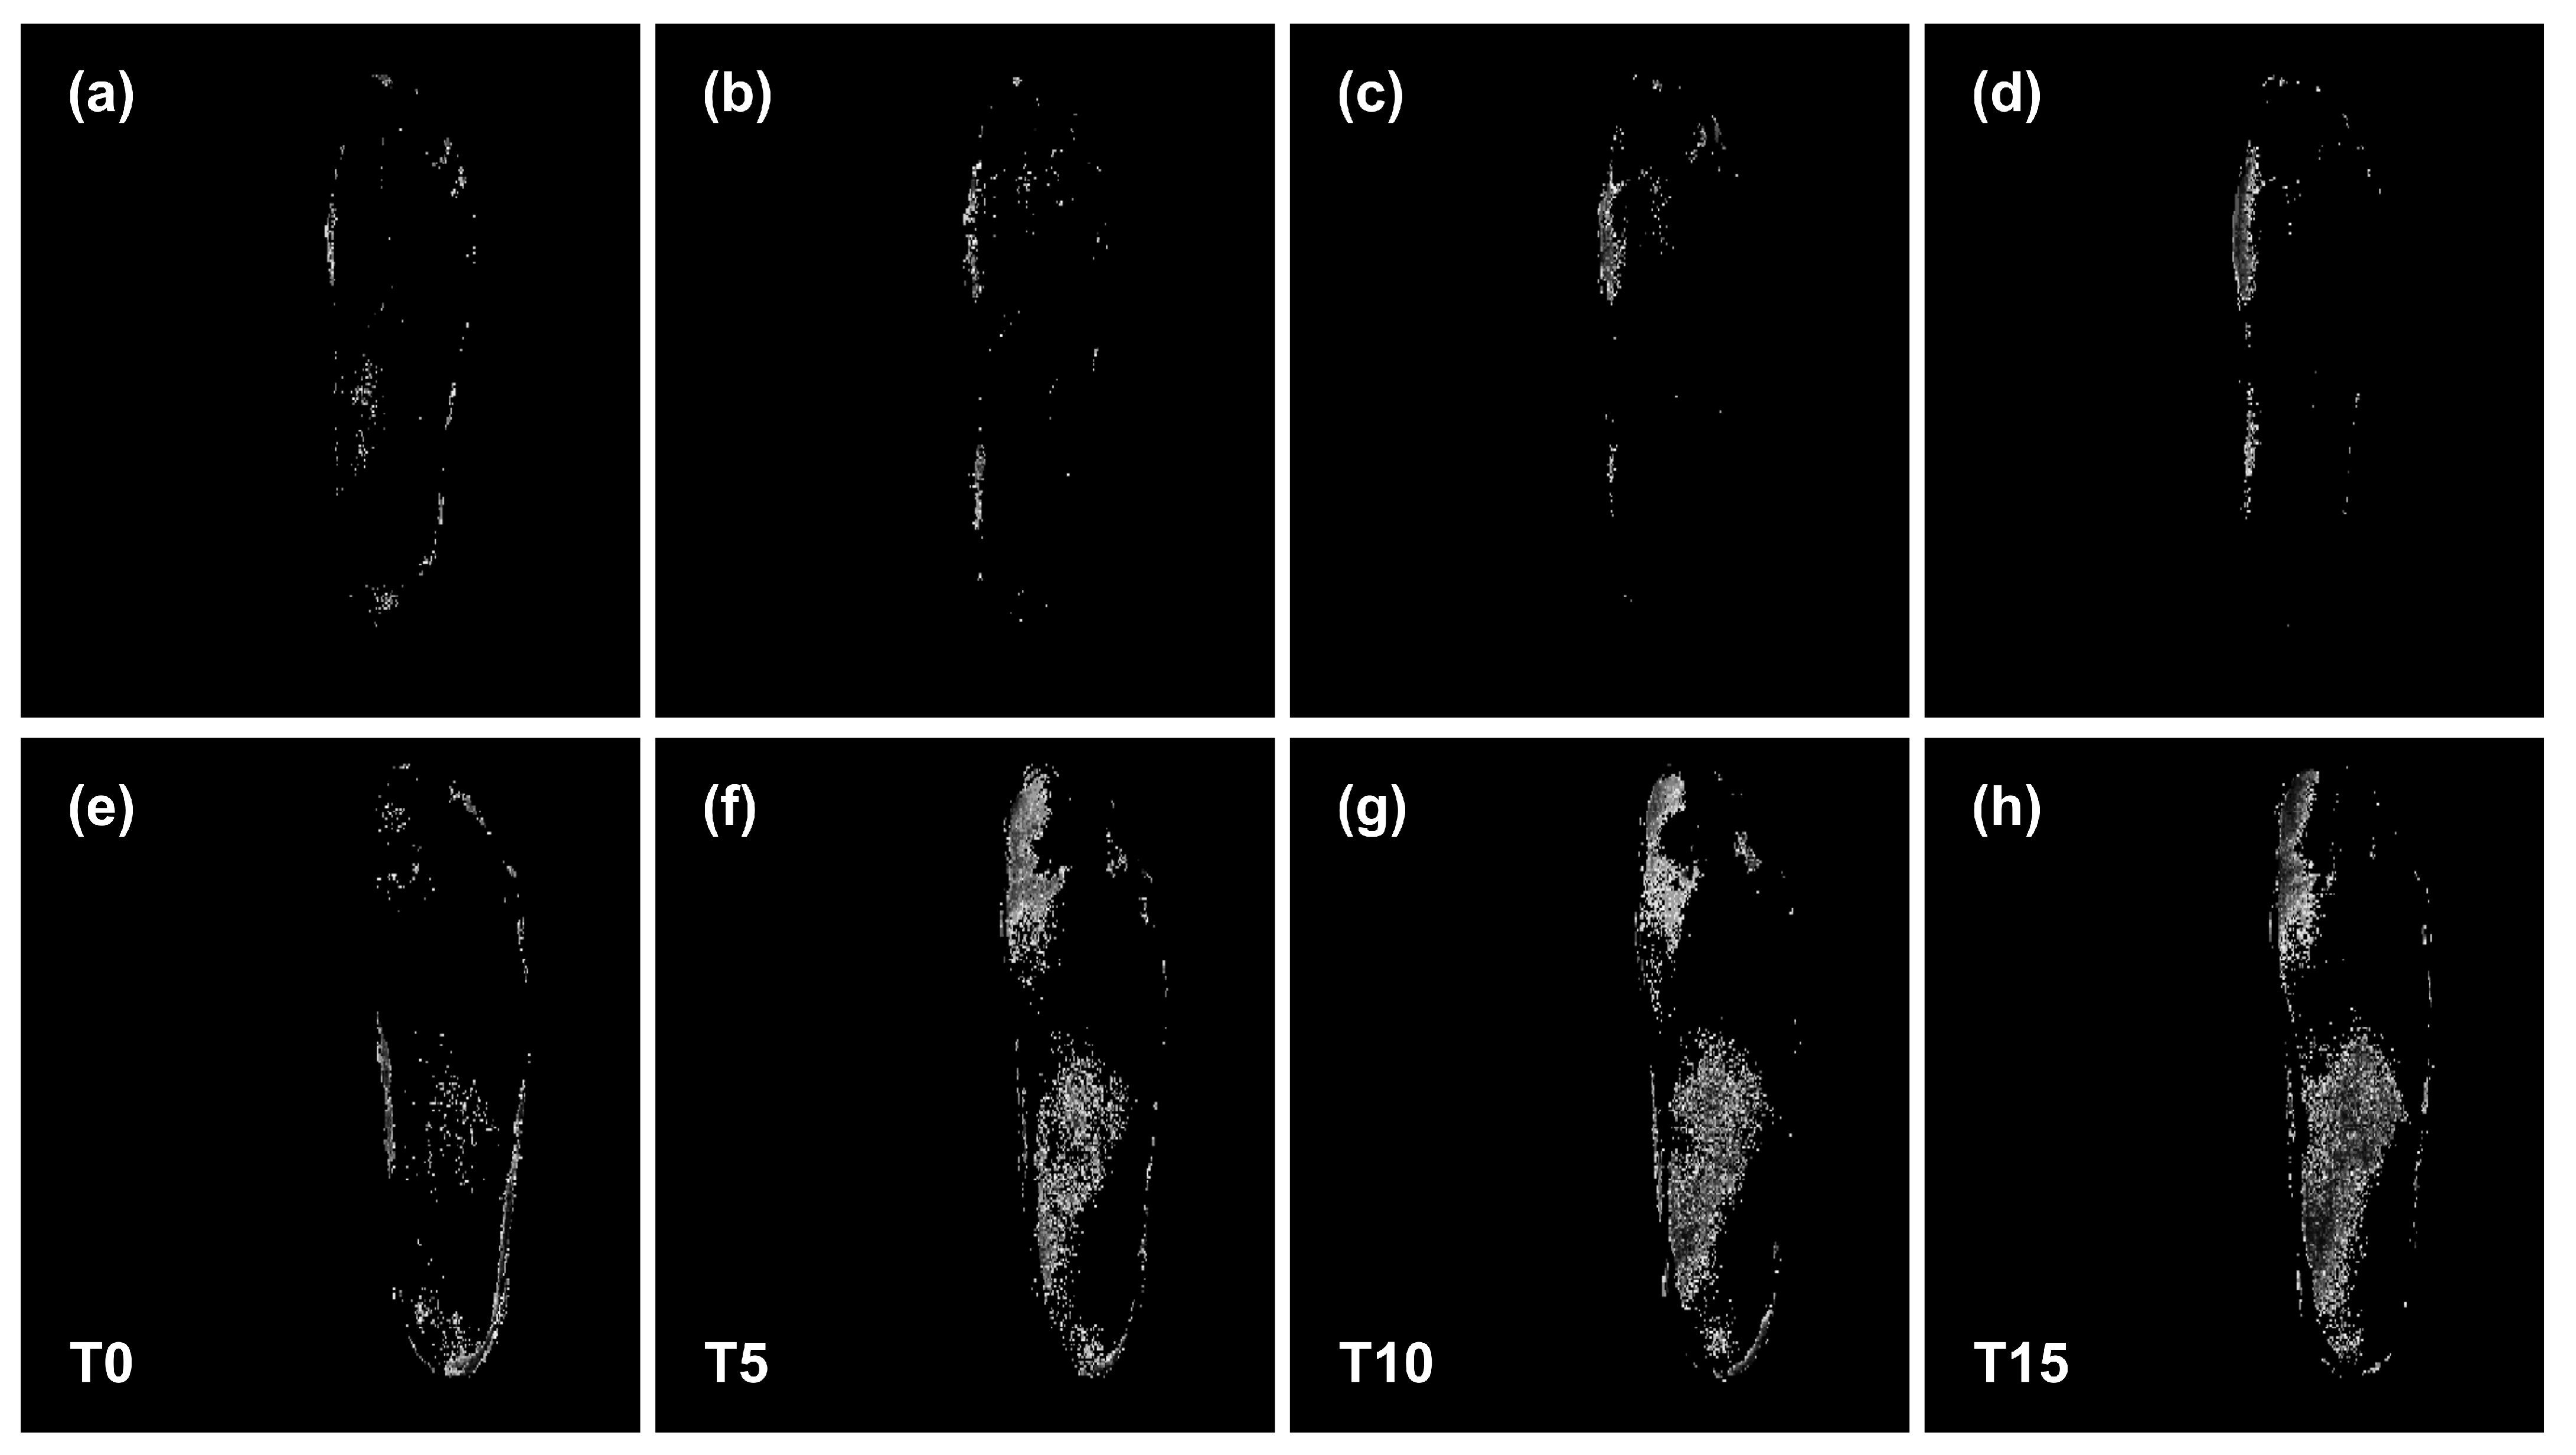
3.2. Foot Model Extraction
3.3. Foot Model for All the Available Shoe Sizes
3.4. Foot Models for Variable Range of Shoe Sizes
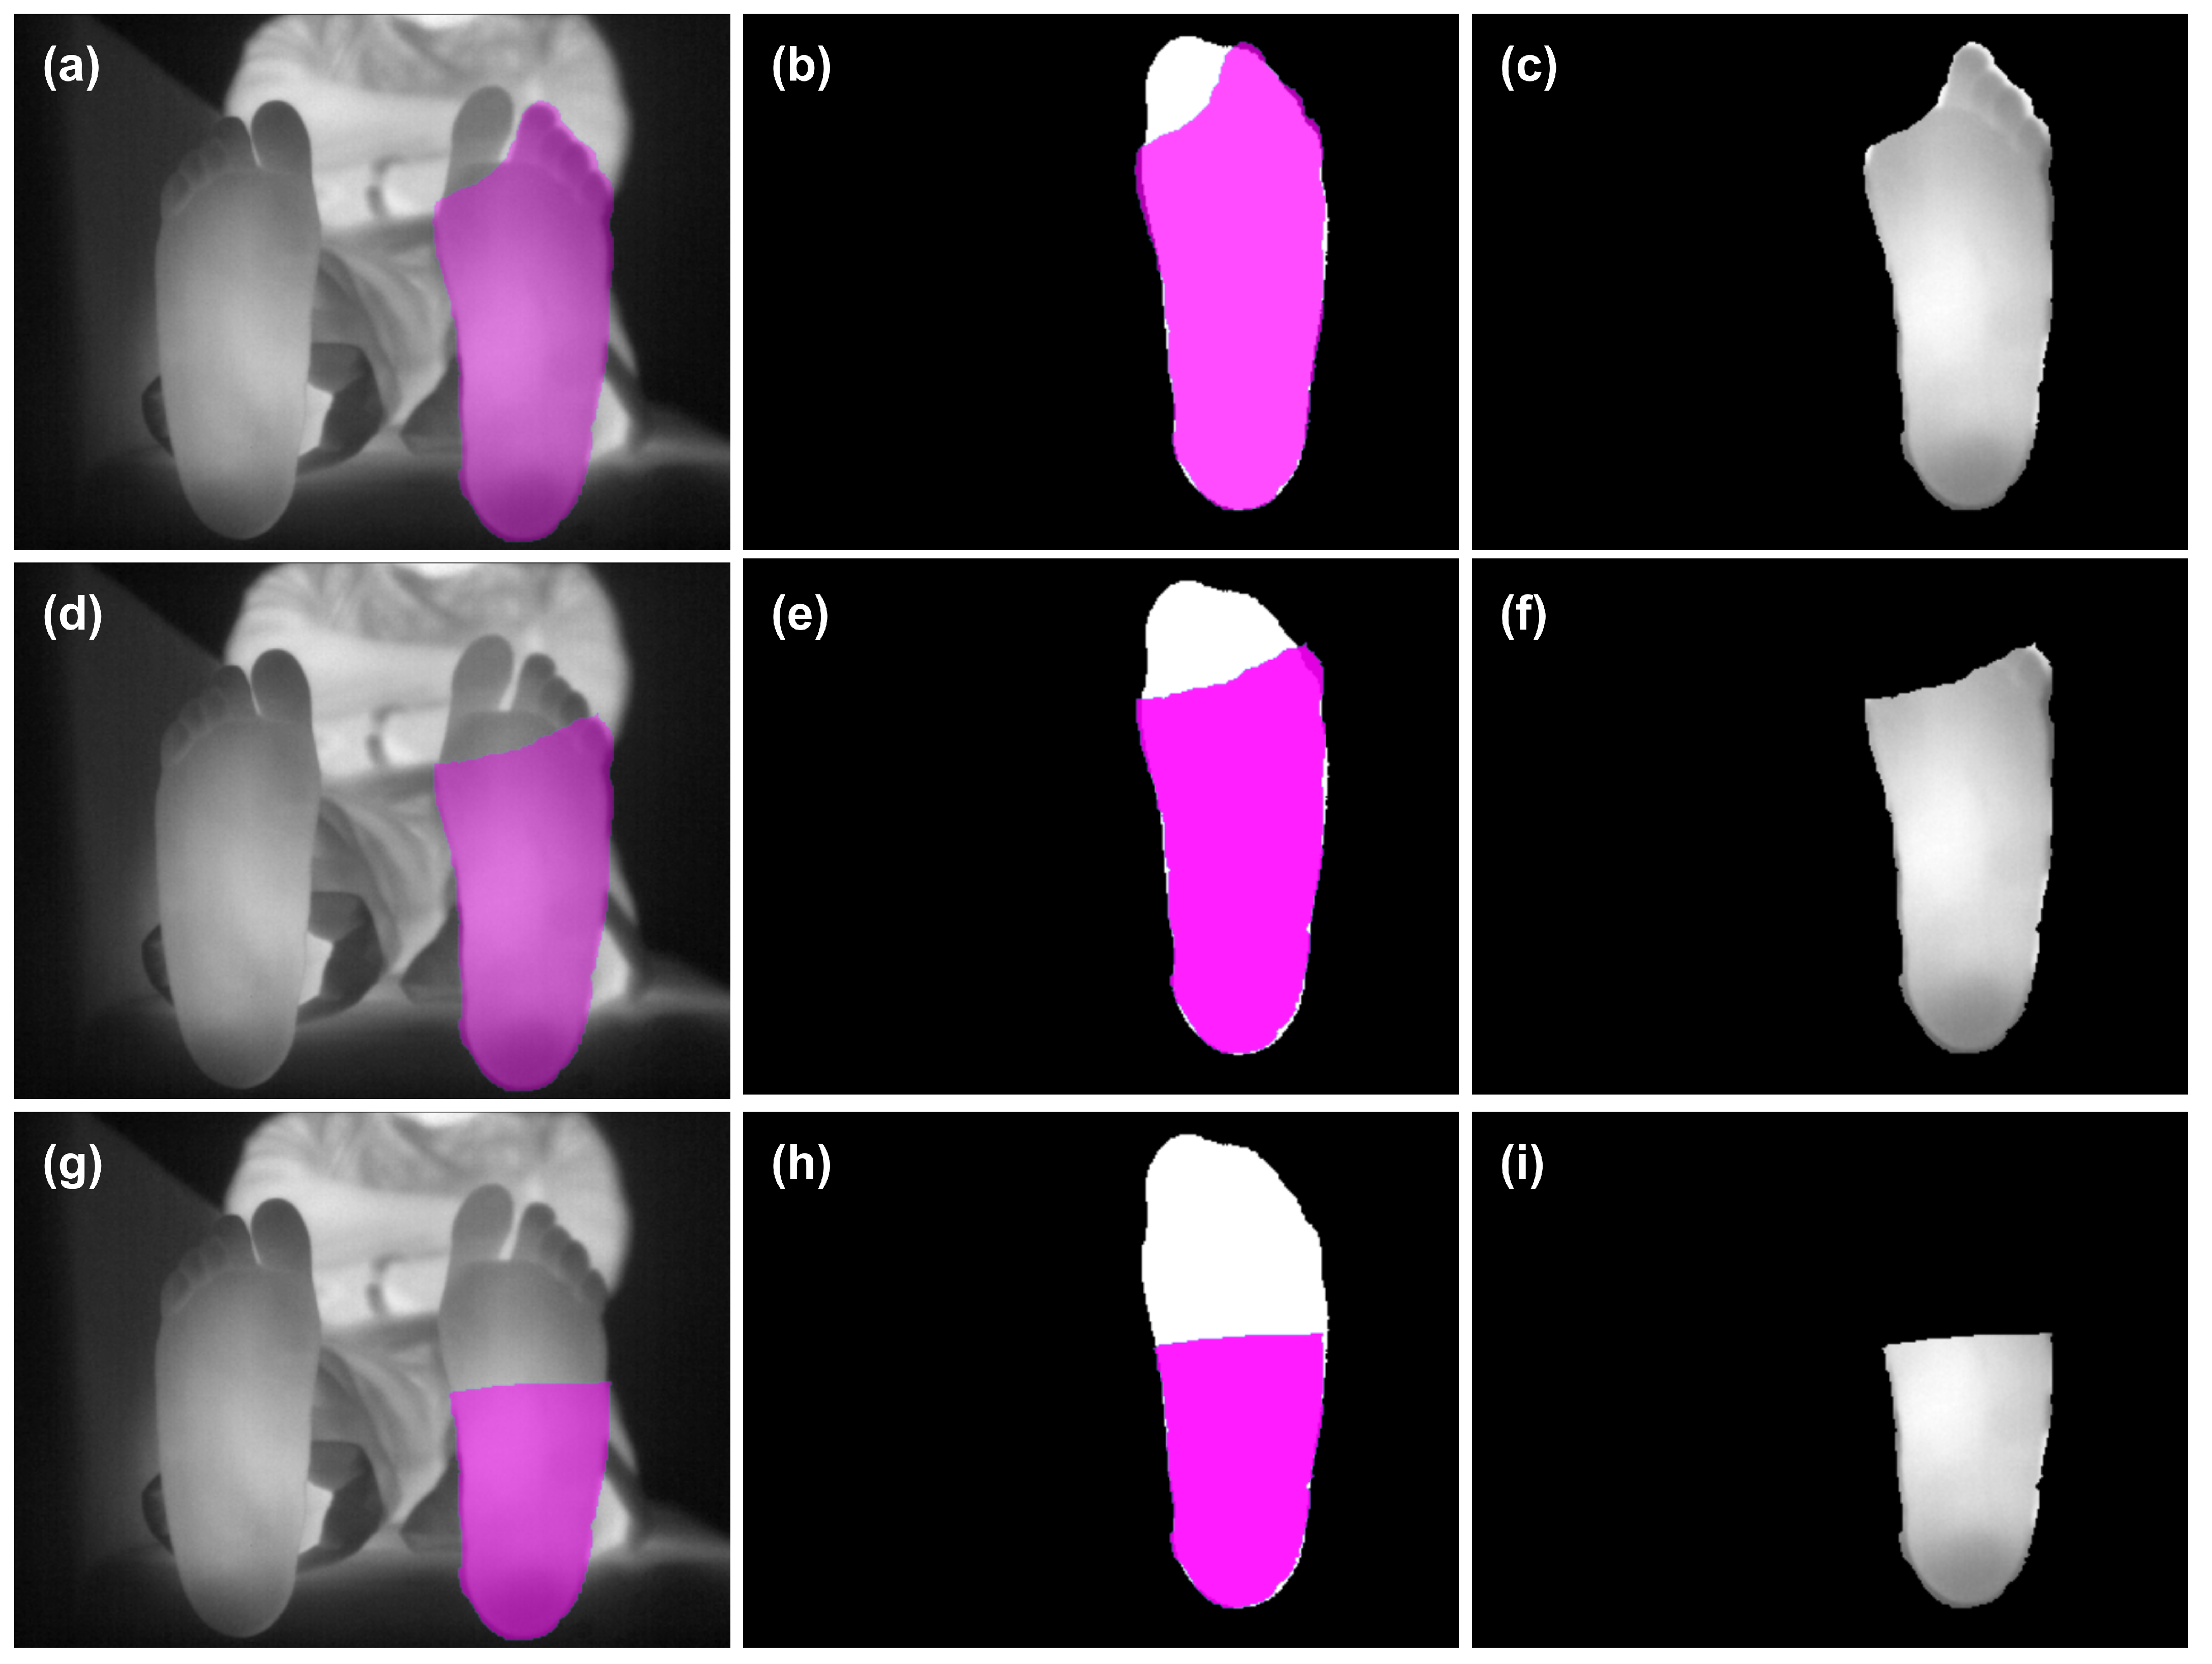
3.5. Partial Foot Amputations or Deformations
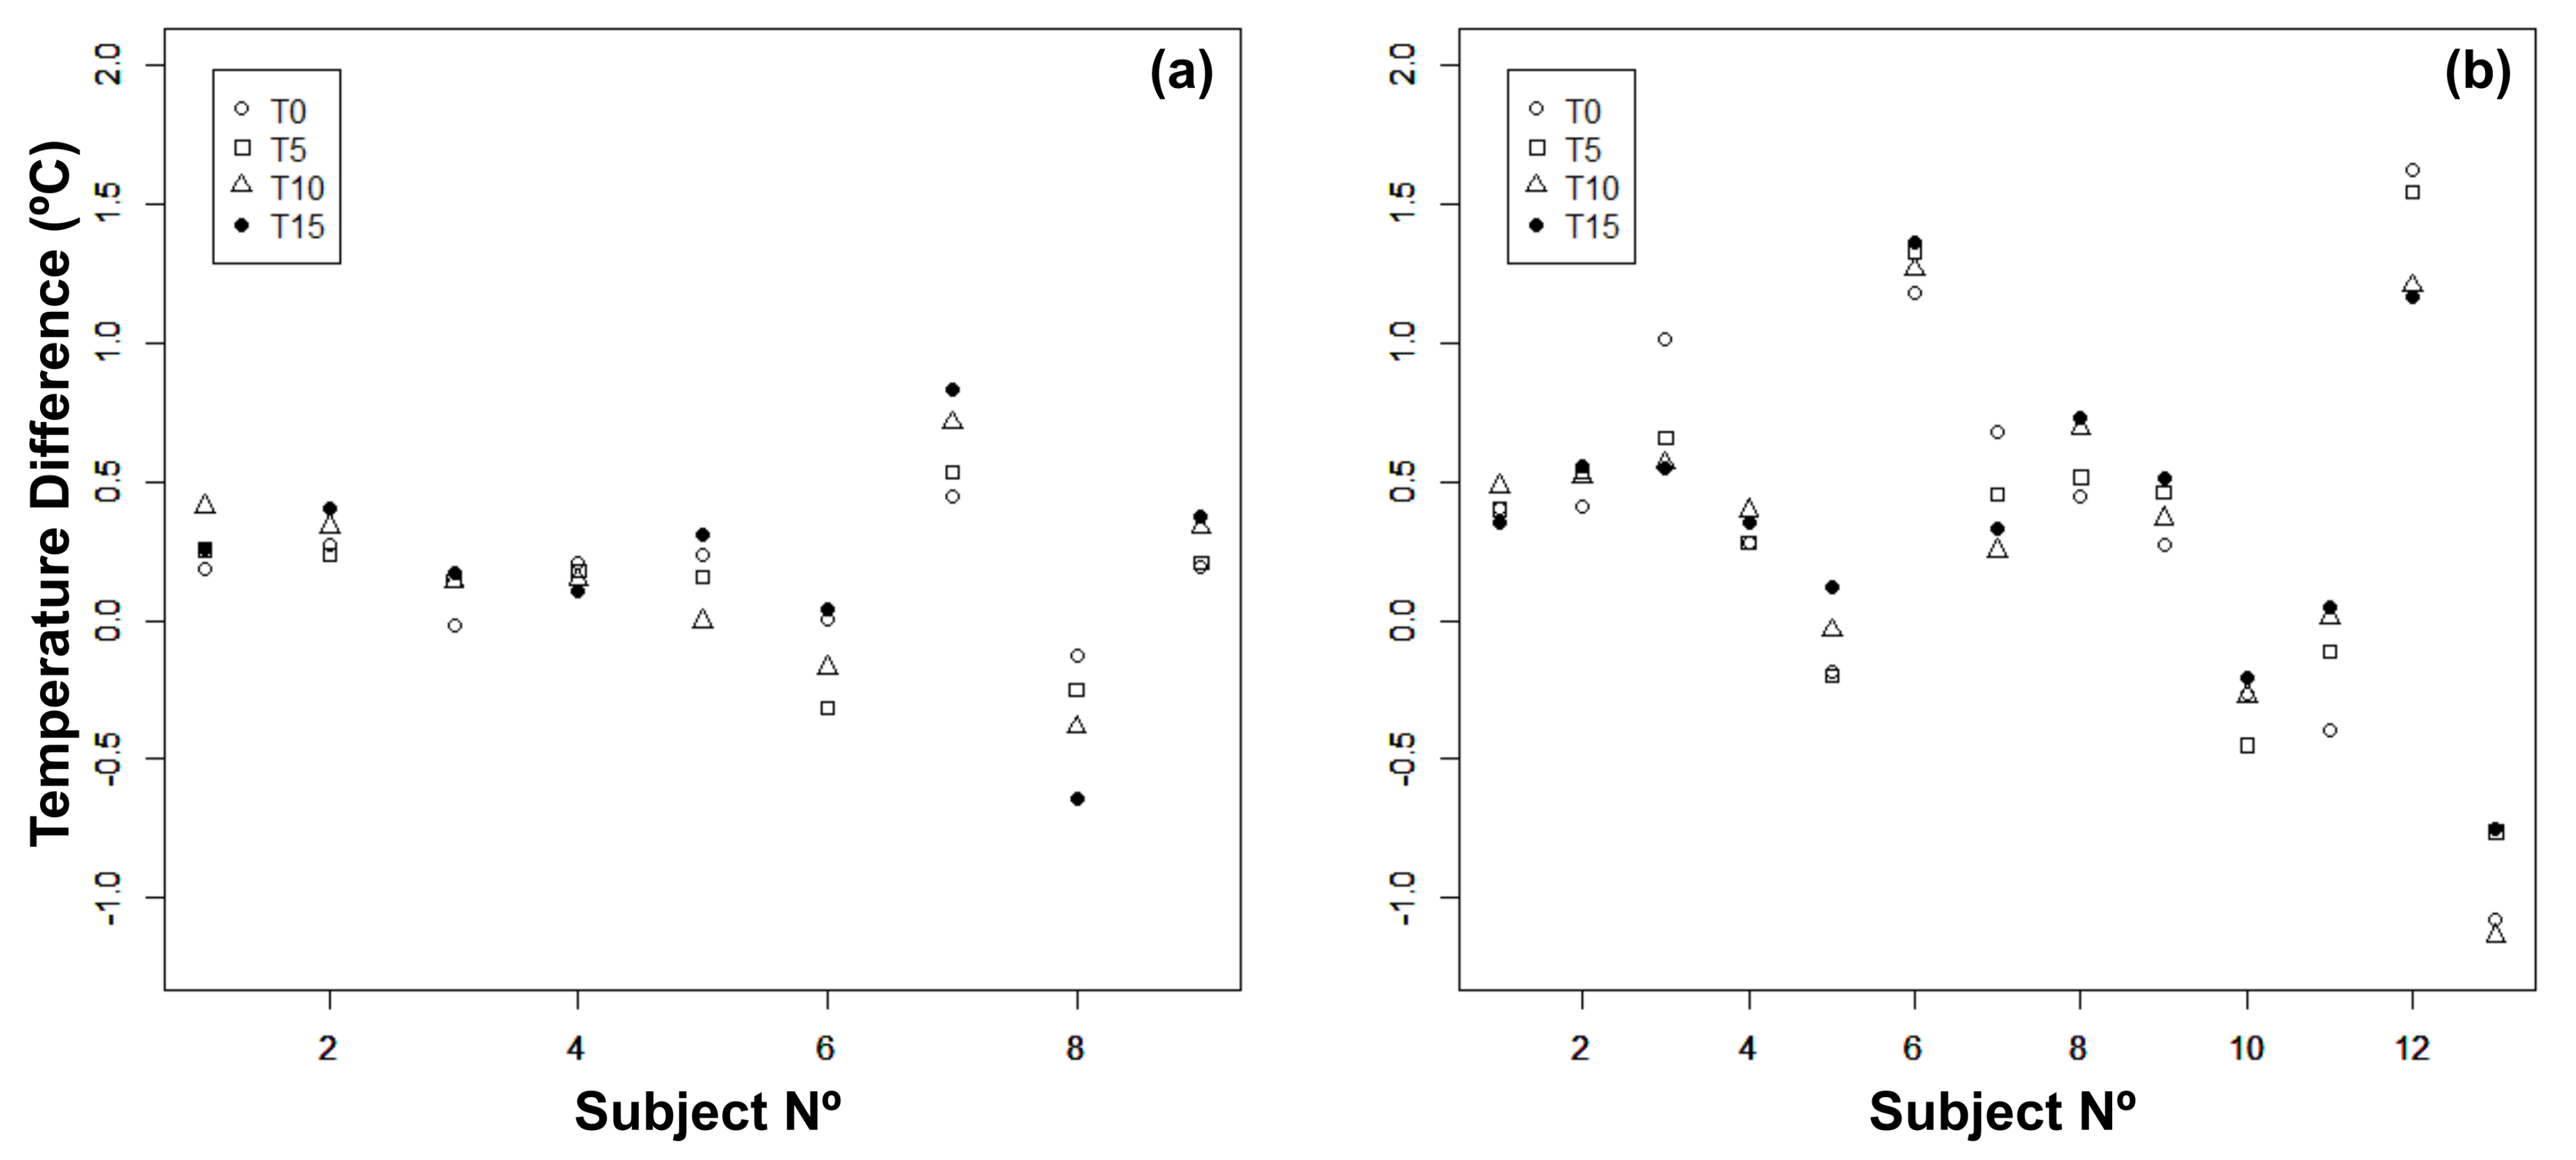
3.6. Statistical Analysis
4. Conclusions
Author Contributions
Funding
Institutional Review Board Statement
Informed Consent Statement
Data Availability Statement
Acknowledgments
Conflicts of Interest
References
- Roback, K. An overview of temperature monitoring devices for early detection of diabetic foot disorders. Expert Rev. Med. Devices 2010, 7, 711–718. [Google Scholar] [CrossRef] [PubMed] [Green Version]
- Liu, C.; van Netten, J.J.; Van Baal, J.G.; Bus, S.A.; van Der Heijden, F. Automatic detection of diabetic foot complications with infrared thermography by asymmetric analysis. J. Biomed. Opt. 2015, 20, 026003. [Google Scholar] [CrossRef] [Green Version]
- Sen, C.K.; Gordillo, G.M.; Roy, S.; Kirsner, R.; Lambert, L.; Hunt, T.K.; Gottrup, F.; Gurtner, G.C.; Longaker, M.T. Human skin wounds: A major and snowballing threat to public health and the economy. Wound Repair Regen. 2009, 17, 763–771. [Google Scholar] [CrossRef] [Green Version]
- Etehadtavakol, M.; Ng, E.; Kaabouch, N. Automatic segmentation of thermal images of diabetic-at-risk feet using the snakes algorithm. Infrared Phys. Technol. 2017, 86, 66–76. [Google Scholar] [CrossRef]
- Gordon, I.L.; Rothenberg, G.M.; Lepow, B.D.; Petersen, B.J.; Linders, D.R.; Bloom, J.D.; Armstrong, D.G. Accuracy of a foot temperature monitoring mat for predicting diabetic foot ulcers in patients with recent wounds or partial foot amputation. Diabetes Res. Clin. Pract. 2020, 161, 108074. [Google Scholar] [CrossRef] [Green Version]
- Siddiqui, H.U.; Spruce, M.; Alty, S.R.; Dudley, S. Automated peripheral neuropathy assessment using optical imaging and foot anthropometry. IEEE Trans. Biomed. Eng. 2015, 62, 1911–1917. [Google Scholar] [CrossRef] [Green Version]
- Tulloch, J.; Zamani, R.; Akrami, M. Machine learning in the prevention, diagnosis and management of diabetic foot ulcers: A systematic review. IEEE Access 2020, 8, 198977–199000. [Google Scholar] [CrossRef]
- Bagavathiappan, S.; Saravanan, T.; Philip, J.; Jayakumar, T.; Raj, B.; Karunanithi, R.; Panicker, T.; Korath, M.P.; Jagadeesan, K. Infrared thermal imaging for detection of peripheral vascular disorders. J. Med. Phys. Assoc. Med. Phys. India 2009, 34, 43. [Google Scholar]
- Frykberg, R.G.; Gordon, I.L.; Reyzelman, A.M.; Cazzell, S.M.; Fitzgerald, R.H.; Rothenberg, G.M.; Bloom, J.D.; Petersen, B.J.; Linders, D.R.; Nouvong, A.; et al. Feasibility and efficacy of a smart mat technology to predict development of diabetic plantar ulcers. Diabetes Care 2017, 40, 973–980. [Google Scholar] [CrossRef] [Green Version]
- Villa, E.; Arteaga-Marrero, N.; Ruiz-Alzola, J. Performance Assessment of Low-Cost Thermal Cameras for Medical Applications. Sensors 2020, 20, 1321. [Google Scholar] [CrossRef] [Green Version]
- Peregrina-Barreto, H.; Morales-Hernandez, L.A.; Rangel-Magdaleno, J.; Avina-Cervantes, J.G.; Ramirez-Cortes, J.M.; Morales-Caporal, R. Quantitative estimation of temperature variations in plantar angiosomes: A study case for diabetic foot. Comput. Math. Methods Med. 2014, 2014, 585306. [Google Scholar] [CrossRef] [PubMed]
- Bagavathiappan, S.; Philip, J.; Jayakumar, T.; Raj, B.; Rao, P.N.S.; Varalakshmi, M.; Mohan, V. Correlation between plantar foot temperature and diabetic neuropathy: A case study by using an infrared thermal imaging technique. J. Diabetes Sci. Technol. 2010, 4, 1386–1392. [Google Scholar] [CrossRef] [PubMed] [Green Version]
- Hernandez-Contreras, D.; Peregrina-Barreto, H.; Rangel-Magdaleno, J.; Gonzalez-Bernal, J. Narrative review: Diabetic foot and infrared thermography. Infrared Phys. Technol. 2016, 78, 105–117. [Google Scholar] [CrossRef]
- Armstrong, D.G.; Lipsky, B.A.; Polis, A.B.; Abramson, M.A. Does dermal thermometry predict clinical outcome in diabetic foot infection? Analysis of data from the SIDESTEP* trial. Int. Wound J. 2006, 3, 302–307. [Google Scholar] [CrossRef] [PubMed]
- Hutting, K.H.; Wouter, B.; Kruse, R.R.; van Baal, J.G.; Bus, S.A.; van Netten, J.J. Infrared thermography for monitoring severity and treatment of diabetic foot infections. Vasc. Biol. 2020, 2, 1–10. [Google Scholar] [CrossRef]
- van Netten, J.J.; Prijs, M.; van Baal, J.G.; Liu, C.; van Der Heijden, F.; Bus, S.A. Diagnostic values for skin temperature assessment to detect diabetes-related foot complications. Diabetes Technol. Ther. 2014, 16, 714–721. [Google Scholar] [CrossRef] [Green Version]
- Lavery, L.A.; Higgins, K.R.; Lanctot, D.R.; Constantinides, G.P.; Zamorano, R.G.; Armstrong, D.G.; Athanasiou, K.A.; Agrawal, C.M. Home monitoring of foot skin temperatures to prevent ulceration. Diabetes Care 2004, 27, 2642–2647. [Google Scholar] [CrossRef] [Green Version]
- van Netten, J.J.; van Baal, J.G.; Liu, C.; van Der Heijden, F.; Bus, S.A. Infrared thermal imaging for automated detection of diabetic foot complications. J. Diabetes Sci. Technol. 2013, 7. [Google Scholar] [CrossRef] [Green Version]
- Petrova, N.; Donaldson, N.; Tang, W.; MacDonald, A.; Allen, J.; Lomas, C.; Leech, N.; Ainarkar, S.; Bevans, J.; Plassmann, P.; et al. Infrared thermography and ulcer prevention in the high-risk diabetic foot: Data from a single-blind multicentre controlled clinical trial. Diabet. Med. 2020, 37, 95–104. [Google Scholar] [CrossRef] [Green Version]
- Elmogy, M.; García-Zapirain, B.; Burns, C.; Elmaghraby, A.; Ei-Baz, A. Tissues classification for pressure ulcer images based on 3D convolutional neural network. In Proceedings of the 2018 25th IEEE International Conference on Image Processing (ICIP), Athens, Greece, 7–10 October 2018; pp. 3139–3143. [Google Scholar]
- Goyal, M.; Reeves, N.D.; Rajbhandari, S.; Yap, M.H. Robust methods for real-time diabetic foot ulcer detection and localization on mobile devices. IEEE J. Biomed. Health Inform. 2018, 23, 1730–1741. [Google Scholar] [CrossRef] [Green Version]
- Wang, L.; Pedersen, P.C.; Agu, E.; Strong, D.M.; Tulu, B. Area determination of diabetic foot ulcer images using a cascaded two-stage SVM-based classification. IEEE Trans. Biomed. Eng. 2016, 64, 2098–2109. [Google Scholar] [CrossRef]
- Cassidy, B.; Reeves, N.D.; Joseph, P.; Gillespie, D.; O’Shea, C.; Rajbhandari, S.; Maiya, A.G.; Frank, E.; Boulton, A.; Armstrong, D.; et al. Dfuc2020: Analysis towards diabetic foot ulcer detection. arXiv 2020, arXiv:2004.11853. [Google Scholar]
- Hernández, A.; Arteaga-Marrero, N.; Villa, E.; Fabelo, H.; Callicó, G.M.; Ruiz-Alzola, J. Automatic Segmentation Based on Deep Learning Techniques for Diabetic Foot Monitoring Through Multimodal Images. In Proceedings of the International Conference on Image Analysis and Processing, Trento, Italy, 9–13 September 2019; pp. 414–424. [Google Scholar]
- Arteaga-Marrero, N.; Hernández, A.; Villa, E.; González-Pérez, S.; Luque, C.; Ruiz-Alzola, J. Segmentation Approaches for Diabetic Foot Disorders. Sensors 2021, 21, 934. [Google Scholar] [CrossRef] [PubMed]
- González-Pérez, S.; Perea Ström, D.; Arteaga-Marrero, N.; Luque, C.; Sidrach-Cardona, I.; Villa, E.; Ruiz-Alzola, J. Assessment of Registration Methods for Thermal Infrared and Visible Images for Diabetic Foot Monitoring. Sensors 2021, 21, 2264. [Google Scholar] [CrossRef] [PubMed]
- Villa, E.; Arteaga-Marrero, N.; León, G.; Herrán, L.; Mateos, I.; Ruiz-Alzola, J. A 3.5-GHz pseudo-correlation type radiometer for biomedical applications. AEU Int. J. Electron. Commun. 2021, 130, 153558. [Google Scholar] [CrossRef]
- Villa, E.; Aja, B.; de la Fuente, L.; Artal, E.; Arteaga-Marrero, N.; González-Pérez, S.; Ruiz-Alzola, J. Analysis and Performance Assessment of a Real-Time Correction Pseudo-Correlation Microwave Radiometer for Medical Applications. Electronics 2021, 10, 1427. [Google Scholar] [CrossRef]
- Magalhaes, C.; Vardasca, R.; Mendes, J. Recent use of medical infrared thermography in skin neoplasms. Ski. Res. Technol. 2018, 24, 587–591. [Google Scholar] [CrossRef]
- Stringasci, M.D.; Salvio, A.G.; Sbrissa Neto, D.; Vollet-Filho, J.D.; Bagnato, V.S.; Kurachi, C. Discrimination of benign-versus-malignant skin lesions by thermographic images using support vector machine classifier. J. Appl. Phys. 2018, 124, 044701. [Google Scholar] [CrossRef]
- Ghassemi, P.; Pfefer, T.J.; Casamento, J.P.; Simpson, R.; Wang, Q. Best practices for standardized performance testing of infrared thermographs intended for fever screening. PLoS ONE 2018, 13, e0203302. [Google Scholar] [CrossRef] [PubMed] [Green Version]
- Yushkevich, P.A.; Piven, J.; Cody Hazlett, H.; Gimpel Smith, R.; Ho, S.; Gee, J.C.; Gerig, G. User-Guided 3D Active Contour Segmentation of Anatomical Structures: Significantly Improved Efficiency and Reliability. Neuroimage 2006, 31, 1116–1128. [Google Scholar] [CrossRef] [Green Version]
- Warfield, S.K.; Zou, K.H.; Wells, W.M. Simultaneous truth and performance level estimation (STAPLE): An algorithm for the validation of image segmentation. IEEE Trans. Med. Imaging 2004, 23, 903–921. [Google Scholar] [CrossRef] [PubMed] [Green Version]
- Marstal, K.; Berendsen, F.; Staring, M.; Klein, S. SimpleElastix: A user-friendly, multi-lingual library for medical image registration. In Proceedings of the IEEE Conference on Computer Vision and Pattern Recognition Workshops, Las Vegas, NV, USA, 26 June–1 July 2016; pp. 134–142. [Google Scholar]
- Van Rossum, G.; Drake, F.L. Python 3 Reference Manual; CreateSpace: Scotts Valley, CA, USA, 2009. [Google Scholar]
- Müller, J.; Müller, J.; Chen, F.; Tetzlaff, R.; Müller, J.; Böhl, E.; Kirsch, M.; Schnabel, C. Registration and fusion of thermographic and visual-light images in neurosurgery. IEEE Trans. Biomed. Circuits Syst. 2018, 12, 1313–1321. [Google Scholar] [CrossRef] [PubMed]
- Lowekamp, B.C.; Chen, D.T.; Ibáñez, L.; Blezek, D. The design of SimpleITK. Front. Neuroinform. 2013, 7, 45. [Google Scholar] [CrossRef] [Green Version]
- Dice, L.R. Measures of the amount of ecologic association between species. Ecology 1945, 26, 297–302. [Google Scholar] [CrossRef]
- Jaccard, P. The distribution of the flora in the alpine zone. New Phytol. 1912, 11, 37–50. [Google Scholar] [CrossRef]
- Yerushalmy, J. Statistical problems in assessing methods of medical diagnosis, with special reference to X-ray techniques. Public Health Rep. (1896–1970) 1947, 62, 1432–1449. [Google Scholar] [CrossRef]
- RStudio Team. RStudio: Integrated Development Environment for R; RStudio, PBC: Boston, MA, USA, 2020. [Google Scholar]
- Bauer, D.F. Constructing confidence sets using rank statistics. J. Am. Stat. Assoc. 1972, 67, 687–690. [Google Scholar] [CrossRef]
- Toutenburg, H.; Hollander, M.; Wolfe, D.A. Nonparametric statistical methods. John Wiley & Sons, New York-Sydney-Tokyo-Mexico City 1973. Biom. Z. 1975, 17, 526. [Google Scholar]
- Hochberg, Y. A sharper Bonferroni procedure for multiple tests of significance. Biometrika 1988, 75, 800–802. [Google Scholar] [CrossRef]
- Benjamini, Y.; Hochberg, Y. Controlling the false discovery rate: A practical and powerful approach to multiple testing. J. R. Stat. Soc. Ser. B 1995, 57, 289–300. [Google Scholar] [CrossRef]
- Ban Frangež, H.; Rodi, Z.; Miklavčič, J.; Frangež, I. The Effect of Transcutaneous Application of Gaseous CO2 on Diabetic Symmetrical Peripheral Neuropathy—A Double-Blind Randomized Clinical Trial. Appl. Sci. 2021, 11, 4911. [Google Scholar] [CrossRef]
- Wijlens, A.M.; Holloway, S.; Bus, S.A.; van Netten, J.J. An explorative study on the validity of various definitions of a 2 · 2 °C temperature threshold as warning signal for impending diabetic foot ulceration. Int. Wound J. 2017, 14, 1346–1351. [Google Scholar] [CrossRef] [PubMed] [Green Version]


| Foot | Overlap Measures | Specificity | Sensitivity | False Positives | False Negatives |
|---|---|---|---|---|---|
| R | T0 | 99.95 ± 0.03 | 99.42 ± 0.75 | 0.58 ± 0.75 | 0.05 ± 0.03 |
| T5 | 99.95 ± 0.03 | 99.39 ± 0.77 | 0.61 ± 0.77 | 0.05 ± 0.03 | |
| T10 | 99.95 ± 0.05 | 99.38 ± 0.79 | 0.62 ± 0.79 | 0.05 ± 0.05 | |
| T15 | 99.95 ± 0.03 | 99.40 ± 0.75 | 0.60 ± 0.75 | 0.05 ± 0.03 | |
| L | T0 | 99.94 ± 0.06 | 99.58 ± 0.40 | 0.42 ± 0.40 | 0.06 ± 0.06 |
| T5 | 99.93 ± 0.06 | 99.58 ± 0.29 | 0.42 ± 0.29 | 0.07 ± 0.06 | |
| T10 | 99.93 ± 0.07 | 99.55 ± 0.40 | 0.45 ± 0.40 | 0.07 ± 0.07 | |
| T15 | 99.94 ± 0.07 | 99.53 ± 0.51 | 0.47 ± 0.51 | 0.06 ± 0.07 |
| Foot Model | Foot | Time | DICE | IoU | Specificity | Sensitivity | False Positives | False Negatives |
|---|---|---|---|---|---|---|---|---|
| Female (36–40) | L | T0 | 86.65 ± 30.53 | 84.46 ± 29.85 | 96.72 ± 9.11 | 85.95 ± 30.24 | 14.05 ± 30.24 | 3.28 ± 9.11 |
| L | T5 | 94.88 ± 15.20 | 92.41 ± 14.90 | 99.13 ± 3.95 | 94.05 ± 15.05 | 5.96 ± 15.05 | 0.87 ± 3.95 | |
| L | T10 | 96.15 ± 10.87 | 93.63 ± 10.66 | 99.43 ± 2.73 | 95.29 ± 10.79 | 4.72 ± 10.79 | 0.57 ± 2.73 | |
| L | T15 | 95.52 ± 13.26 | 93.07 ± 13.00 | 99.26 ± 3.43 | 94.74 ± 13.14 | 5.26 ± 13.14 | 0.74 ± 3.43 | |
| R | T0 | 93.74 ± 18.41 | 91.34 ± 18.09 | 99.02 ± 3.92 | 92.68 ± 18.18 | 7.33 ± 18.18 | 0.98 ± 3.92 | |
| R | T5 | 92.84 ± 20.56 | 90.49 ± 20.17 | 98.79 ± 4.52 | 91.84 ± 20.33 | 8.16 ± 20.33 | 1.21 ± 4.52 | |
| R | T10 | 94.36 ± 16.94 | 91.98 ± 16.61 | 99.17 ± 3.46 | 93.31 ± 16.75 | 6.69 ± 16.75 | 0.83 ± 3.46 | |
| R | T15 | 93.45 ± 19.29 | 91.12 ± 18.88 | 98.96 ± 3.99 | 92.44 ± 19.07 | 7.56 ± 19.07 | 1.04 ± 3.99 | |
| Male (41–45) | L | T0 | 93.18 ± 19.09 | 90.55 ± 18.67 | 98.33 ± 6.68 | 92.56 ± 18.96 | 7.44 ± 18.96 | 1.67 ± 6.68 |
| L | T5 | 95.65 ± 11.78 | 92.96 ± 11.58 | 99.18 ± 3.55 | 95.05 ± 11.73 | 4.95 ± 11.73 | 0.82 ± 3.55 | |
| L | T10 | 95.98 ± 10.59 | 93.33 ± 10.42 | 99.30 ± 2.84 | 95.43 ± 10.57 | 4.57 ± 10.57 | 0.70 ± 2.84 | |
| L | T15 | 96.53 ± 7.55 | 93.84 ± 7.49 | 99.46 ± 2.08 | 95.86 ± 7.57 | 4.14 ± 7.57 | 0.54 ± 2.08 | |
| R | T0 | 93.86 ± 18.46 | 91.58 ± 18.11 | 98.65 ± 5.79 | 93.67 ± 18.42 | 6.33 ± 18.42 | 1.36 ± 5.79 | |
| R | T5 | 96.33 ± 10.53 | 93.98 ± 10.39 | 99.38 ± 2.77 | 96.11 ± 10.51 | 3.89 ± 10.51 | 0.62 ± 2.77 | |
| R | T10 | 96.34 ± 10.56 | 93.99 ± 10.41 | 99.35 ± 3.02 | 96.13 ± 10.54 | 3.87 ± 10.54 | 0.65 ± 3.02 | |
| R | T15 | 94.73 ± 16.19 | 92.42 ± 15.87 | 98.87 ± 4.76 | 94.50 ± 16.14 | 5.50 ± 16.14 | 1.13 ± 4.76 |
| Foot Model | Foot | DICE | IoU | Specificity | Sensitivity | False Positives | False Negatives |
|---|---|---|---|---|---|---|---|
| Female (36–40) | L | 97.56 ± 0.60 | 95.25 ± 1.15 | 99.68 ± 0.21 | 97.08 ± 0.53 | 2.93 ± 0.53 | 0.32 ± 0.21 |
| R | 97.54 ± 0.48 | 95.21 ± 0.92 | 99.80 ± 0.08 | 96.55 ± 0.98 | 3.45 ± 0.98 | 0.20 ± 0.08 | |
| Male (41–45) | L | 97.31 ± 0.81 | 94.77 ± 1.51 | 99.65 ± 0.16 | 96.74 ± 1.48 | 3.26 ± 1.48 | 0.35 ± 0.16 |
| R | 97.63 ± 0.62 | 95.37 ± 1.17 | 99.67 ± 0.18 | 97.45 ± 0.90 | 2.56 ± 0.90 | 0.33 ± 0.18 |
| Foot Model | Foot | DICE | IoU | Specificity | Sensitivity | False Positives | False Negatives |
|---|---|---|---|---|---|---|---|
| Female (37) | L | 97.66 ± 0.61 | 95.44 ± 1.15 | 99.76 ± 0.19 | 97.02 ± 0.75 | 2.98 ± 0.75 | 0.24 ± 0.19 |
| R | 97.72 ± 0.58 | 95.55 ± 1.11 | 99.78 ± 0.09 | 97.03 ± 1.12 | 2.97 ± 1.12 | 0.22 ± 0.09 | |
| Female (36–38) | L | 97.62 ± 0.56 | 95.35 ± 1.06 | 99.73 ± 0.17 | 96.91 ± 0.57 | 3.09 ± 0.57 | 0.27 ± 0.17 |
| R | 97.56 ± 0.70 | 95.25 ± 1.34 | 99.76 ± 0.11 | 96.60 ± 1.27 | 3.41 ± 1.27 | 0.24 ± 0.11 | |
| Male (43) | L | 97.72 ± 0.55 | 95.55 ± 1.05 | 99.71 ± 0.12 | 96.90 ± 1.21 | 3.10 ± 1.21 | 0.29 ± 0.12 |
| R | 98.01 ± 0.47 | 96.10 ± 0.89 | 99.73 ± 0.12 | 97.43 ± 0.77 | 2.57 ± 0.77 | 0.28 ± 0.12 | |
| Male (42–44) | L | 97.41 ± 0.60 | 94.96 ± 1.15 | 99.63 ± 0.17 | 96.63 ± 1.02 | 3.37 ± 1.02 | 0.37 ± 0.17 |
| R | 97.59 ± 0.65 | 95.30 ± 1.24 | 99.64 ± 0.19 | 96.89 ± 0.93 | 3.11 ± 0.93 | 0.36 ± 0.19 |
| Figure 4 | DICE | IoU | Specificity | Sensitivity | False Positives | False Negatives |
|---|---|---|---|---|---|---|
| (b) | 93.89 | 88.48 | 99.37 | 96.90 | 9.27 | 2.73 |
| (e) | 88.78 | 79.82 | 98.92 | 94.32 | 18.76 | 2.15 |
| (h) | 69.48 | 53.23 | 97.59 | 84.62 | 1.66 | 46.29 |
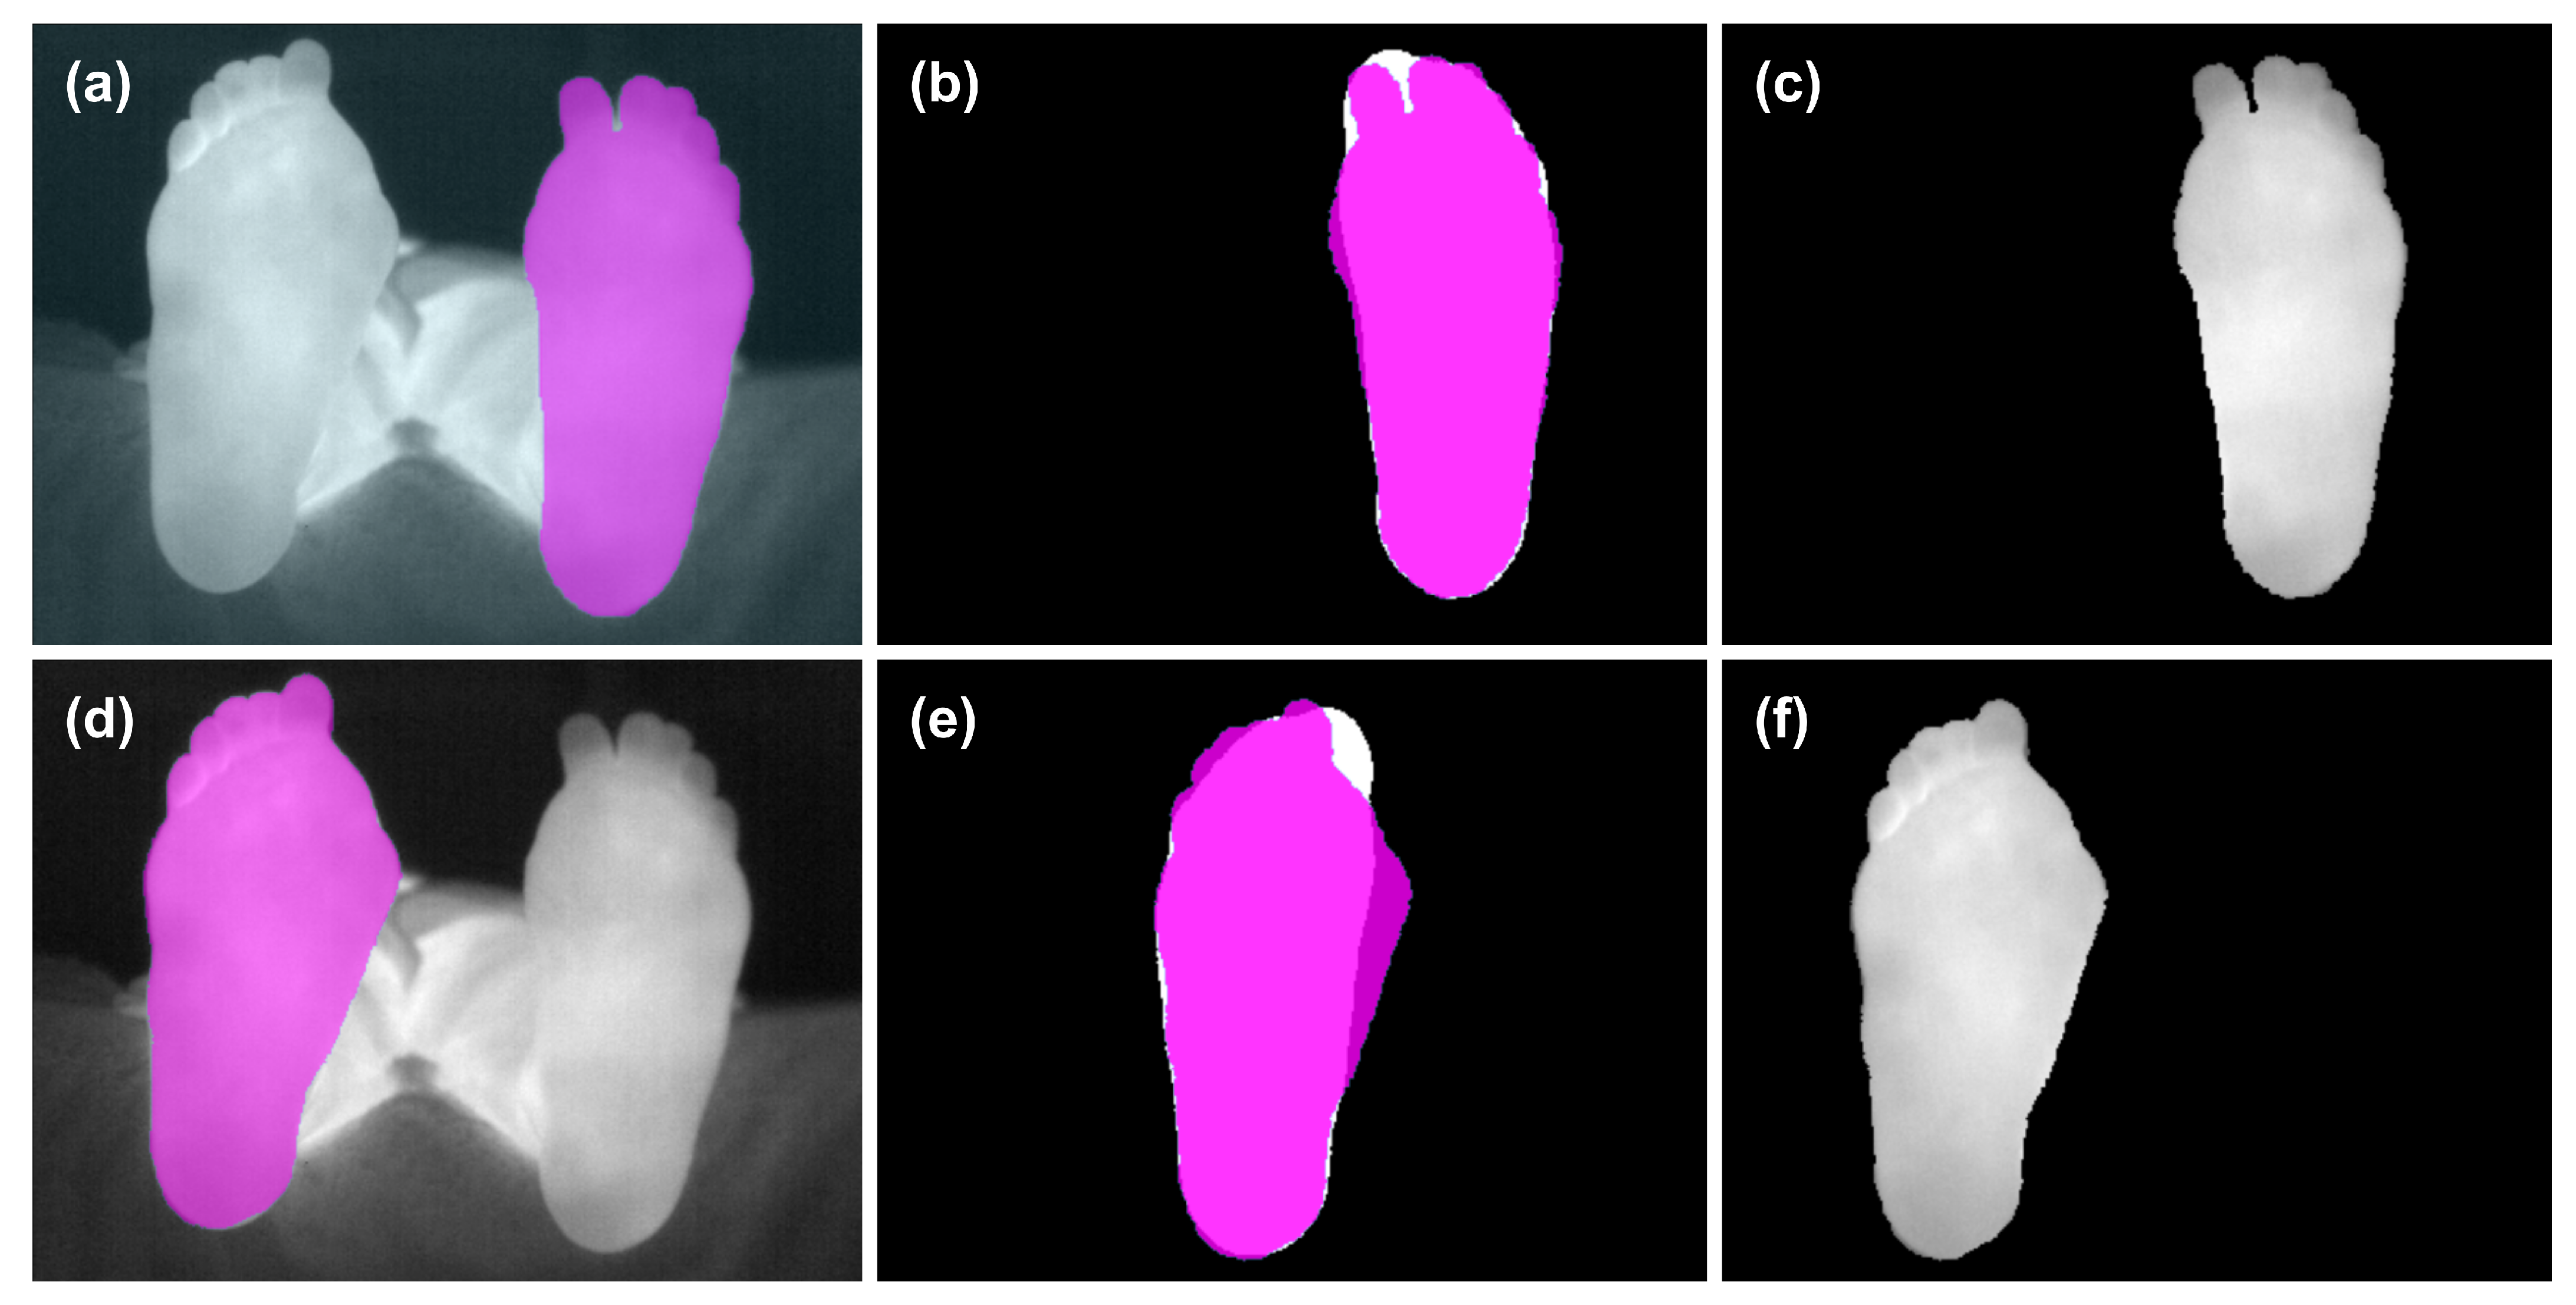
| Figure 5 | DICE | IoU | Specificity | Sensitivity | False Positives | False Negatives |
|---|---|---|---|---|---|---|
| (b) | 96.83 | 93.86 | 99.66 | 98.40 | 3.53 | 2.80 |
| (e) | 93.23 | 87.32 | 99.23 | 96.56 | 9.61 | 3.74 |
| Time Point | Female (°C) | Male (°C) |
|---|---|---|
| T0 | 0.155 ± 0.175 | 0.337 ± 0.715 |
| T5 | 0.127 ± 0.261 | 0.357 ± 0.642 |
| T10 | 0.170 ± 0.328 | 0.332 ± 0.622 |
| T15 | 0.205 ± 0.205 | 0.394 ± 0.546 |
Publisher’s Note: MDPI stays neutral with regard to jurisdictional claims in published maps and institutional affiliations. |
© 2021 by the authors. Licensee MDPI, Basel, Switzerland. This article is an open access article distributed under the terms and conditions of the Creative Commons Attribution (CC BY) license (https://creativecommons.org/licenses/by/4.0/).
Share and Cite
Arteaga-Marrero, N.; Bodson, L.C.; Hernández, A.; Villa, E.; Ruiz-Alzola, J. Morphological Foot Model for Temperature Pattern Analysis Proposed for Diabetic Foot Disorders. Appl. Sci. 2021, 11, 7396. https://doi.org/10.3390/app11167396
Arteaga-Marrero N, Bodson LC, Hernández A, Villa E, Ruiz-Alzola J. Morphological Foot Model for Temperature Pattern Analysis Proposed for Diabetic Foot Disorders. Applied Sciences. 2021; 11(16):7396. https://doi.org/10.3390/app11167396
Chicago/Turabian StyleArteaga-Marrero, Natalia, Lucas Christian Bodson, Abián Hernández, Enrique Villa, and Juan Ruiz-Alzola. 2021. "Morphological Foot Model for Temperature Pattern Analysis Proposed for Diabetic Foot Disorders" Applied Sciences 11, no. 16: 7396. https://doi.org/10.3390/app11167396
APA StyleArteaga-Marrero, N., Bodson, L. C., Hernández, A., Villa, E., & Ruiz-Alzola, J. (2021). Morphological Foot Model for Temperature Pattern Analysis Proposed for Diabetic Foot Disorders. Applied Sciences, 11(16), 7396. https://doi.org/10.3390/app11167396