Review

A Review of the Vibration Arthrography Technique Applied to the Knee Diagnostics

Université de Lyon, INSA Lyon, CNRS, LaMCoS, UMR5259, 69621 Villeurbanne, France
*
Author to whom correspondence should be addressed.
Appl. Sci. 2021, 11(16), 7337; https://doi.org/10.3390/app11167337
Submission received: 22 June 2021 / Revised: 12 July 2021 / Accepted: 30 July 2021 / Published: 10 August 2021
(This article belongs to the Special Issue Contact Mechanics, Wear and Acoustic Waves)

Abstract

:
When a joint undergoes a range of motion, its constituents rub against each other, causing friction and thus vibrations. The vibration arthrography (VAG) technique consists of detecting, recording, and processing those vibrations to diagnose disorders. This non-invasive method could be an alternative to the currently used arthroscopy or X-rays. It has been revealed to be as accurate as these methods in terms of detecting pathologies such as osteoarthritis (OA). Moreover, vibrational analysis has highlighted some physiological signals associated with the displacement of knee joint components. Thus, vibroarthrography provides further understanding of the internal mechanisms of the knee joint. This paper aims to examine the research progress on the use of this vibration arthrography technique in diagnosing knee disorders.

1. Introduction

The knee is one of the most complex joints in the body and consists of three bones (femur, tibia, and patella) articulating in three synovial joint compartments—namely, the patellofemoral joint, the lateral femorotibial joint, and the medial femorotibial joint. The femur, the tibia, and the patella surfaces are covered with articular cartilage that absorbs compression stresses in the joint and thus prevents bones from being in direct contact with each other [1]. These joints are surrounded by a single capsule containing synovial fluid. Furthermore, ligaments stabilize and reinforce the joint capsule. In addition to these structures, fibrocartilaginous menisci lie between the articular surfaces of the tibia and femur. They are essential to enable effective articulation and to absorb shocks.
Due to its large number of components and its complexity, the knee is one of the most commonly injured parts of the body. A common disease is knee osteoarthritis (OA), which is characterized by the local and progressive loss of articular cartilage along with simultaneous changes in the bone underneath the cartilage [2]. OA is a major cause of disability in the elderly, with around 654 million people over 40 years old suffering from knee OA in 2020 worldwide [3].
It is therefore crucial to have good diagnostic methods to detect OA at an early stage. To assess the knee joint condition and cartilaginous losses, the gold standard method is arthroscopy. This consists of inspecting the interior of the knee with a small camera called an arthroscope. However, this is an invasive surgical procedure involving a small incision and thus cannot be used easily for the repeated assessment of patients over time [4]. Image-based techniques such as X-rays are also widely used. However, as cartilage is not visible on X-rays, this technique cannot directly evaluate the cartilage condition, but the width of the joint space can be estimated [4]. Small apparent spaces between the bones may then indicate a loss of cartilage. Magnetic Resonance Imaging (MRI) can overcome some of the limitations of X-rays due to its capacity to detect structures such as cartilage, menisci, ligaments, and synovium [2]. However, MRI suffers from its high cost and long acquisition times. Ultrasounds can therefore be seen as a great alternative to MRI, as they enable the precise visualization of soft tissues and are inexpensive and not invasive [5]. Nonetheless, parts of the knee joint can still be concealed, as ultrasounds cannot penetrate bones [6]. Advantages and limitations of these previous diagnostic techniques are summarized in Table 1.
To overcome some of these limitations, a non-invasive and inexpensive technique called “Vibration Arthrography” (VAG) was introduced by McCoy et al. [7]. This technique is based on the detection and recording of knee vibration emission. This emission originates from articular surfaces rubbing against each other during knee movement. Thus, acoustic and vibrational signals can be recorded and analyzed to evaluate the knee joint condition [2]. As mentioned above, OA manifests itself by the degeneration of articular cartilage, thus causing more friction during movements. Consequently, abnormal knees generally produce more vibroarthrographic signals than healthy ones.
To understand the origin of vibration arthrography, it is important to consider its long history. Indeed, auscultation is one of the most ancient diagnostic methods. The modern development of this method is associated with the invention of the stethoscope. The first use of a stethoscope to explore sounds from the locomotor system was performed by Heuter in 1885 and he was able to locate loose bodies within the knee joint using this tool. In 1902, the evaluation of knee joint sounds as a diagnostic tool was realized by Blodgett. In 1929, the examination of 1600 joints from people of all ages and sexes by Walters led to the conclusion that auscultation may reveal a certain roughness of the joint that was not recognizable by any other means [8]. He also promoted the use of auscultation for diagnosing OA. Later on, progressive technological advances led to the use of microphones instead, thus reducing the subjectivity of stethoscopes. However, microphones also showed some drawbacks because they have a limited frequency response in the audible range and their sensitivity is reduced by artifacts such as skin friction and ambient noise [9]. Due to these limitations, the use of accelerometers in the late 20th century has overcome the problem of background noise because of their sensitivity to vibration at the point of measurement only [7].
Previous studies have demonstrated the potential of VAG to diagnose knee disorders. The aim of this review is to give a summary of the current state of knowledge of the vibration arthrography technique applied on the knee joint. It is organized as follows. Section 2 presents the experimental setup, which consists of undergoing a range of flexion and extension cycles while sitting on a high chair. Section 3 discusses the post-processing of recorded signals with the aim of extracting meaningful parameters. This chapter describes several approaches recently used for such signal processing. Their limitations are also mentioned. Finally, Section 4 presents how the extracted parameters were employed to classify normal and abnormal knee joints.

2. Experimental Methods

In order to analyze vibroarthrographic (VAG) signals, the first essential step is signal acquisition. This step comprises the choice of sensors, their position on the knee, and the experimental setup.
As explained in the introduction, most previous studies have used either a microphone [10,11,12] or an accelerometer [2,7,13,14,15,16,17,18,19,20,21,22,23,24,25,26,27,28,29] to measure VAG signals. The choice of an accelerometer depends on parameters such as its frequency response and its sensitivity. The typical bandwidth is up to 10kHz, while the sensitivity ranges from 100 to 600 mV/g [13,16,25,27,28]. For obvious reasons, accelerometers are often very small in size, thus enabling their placement upon the skin.
The location of the sensors on the skin is a crucial point, as the vibroarthrographic signal is different when recorded in two different locations [13]. The optimal location of sensors has been demonstrated to be on the medial compartment below the midline of the patella [2,14,15,16]. This can be explained by the fact that it is the closest position to the area of contact between moving joint surfaces, thus inducing the least attenuation of the signal during propagation. Moreover, McCoy et al. [7] have demonstrated that some meniscal signals were larger on the affected side of the knee. Therefore, the importance of using three sensors on the patella, the medial condyle, and the lateral condyle is stressed. Figure 1 shows the different locations of sensors according to different authors.
Sensors are firmly attached to the skin with double-sided tape or a medical adhesive patch. In most cases, an electro goniometer is used simultaneously to measure the flexion and extension angle, which can add information to the signal analysis. Furthermore, the angular velocity of flexion/extension motion is important, as some signals are present only at slow knee motion [7]. A metronome can be used to control and maintain a constant speed [17]. The sensor location and the velocity of knee motion are therefore parameters that can influence VAG signals. Consequently, the question of repeatability has been addressed by Kalo et al. [11]. It has been proven that knee joint sound signals are rather reliable within one day, since Intraclass Correlation Coefficients (ICC) range from 0.85 to 0.95 at the medial tibial plateau and from 0.73 to 0.87 at the patella. However, the repeatability of these signals drops if measurements are taken on two different days [11]. Likewise, it has been demonstrated that the initial condition of the knee affects the vibration signal [18]. Therefore, the previous activity that the knee joint undergoes should be controlled in order to obtain repeatable measurements. In most studies, volunteers are requested to sit on a high chair with both legs freely suspended in the air. They are asked to perform a range of knee motion cycles from flexion (usually 90° [7,19] but sometimes 135° [20,21,22,23,24,25]) to full extension and then go back to the initial flexion in a certain amount of time. However, some other studies propose a different measurement setup. Bolus et al. [28] propose measurement in an inverted squat-like position with the knee loaded by a given force. A similar setup with traditional squats was used by Olowiana et al. [30]. Kalo et al. used either sit-ups in [11] or climbing up and going down the stairs in [31].
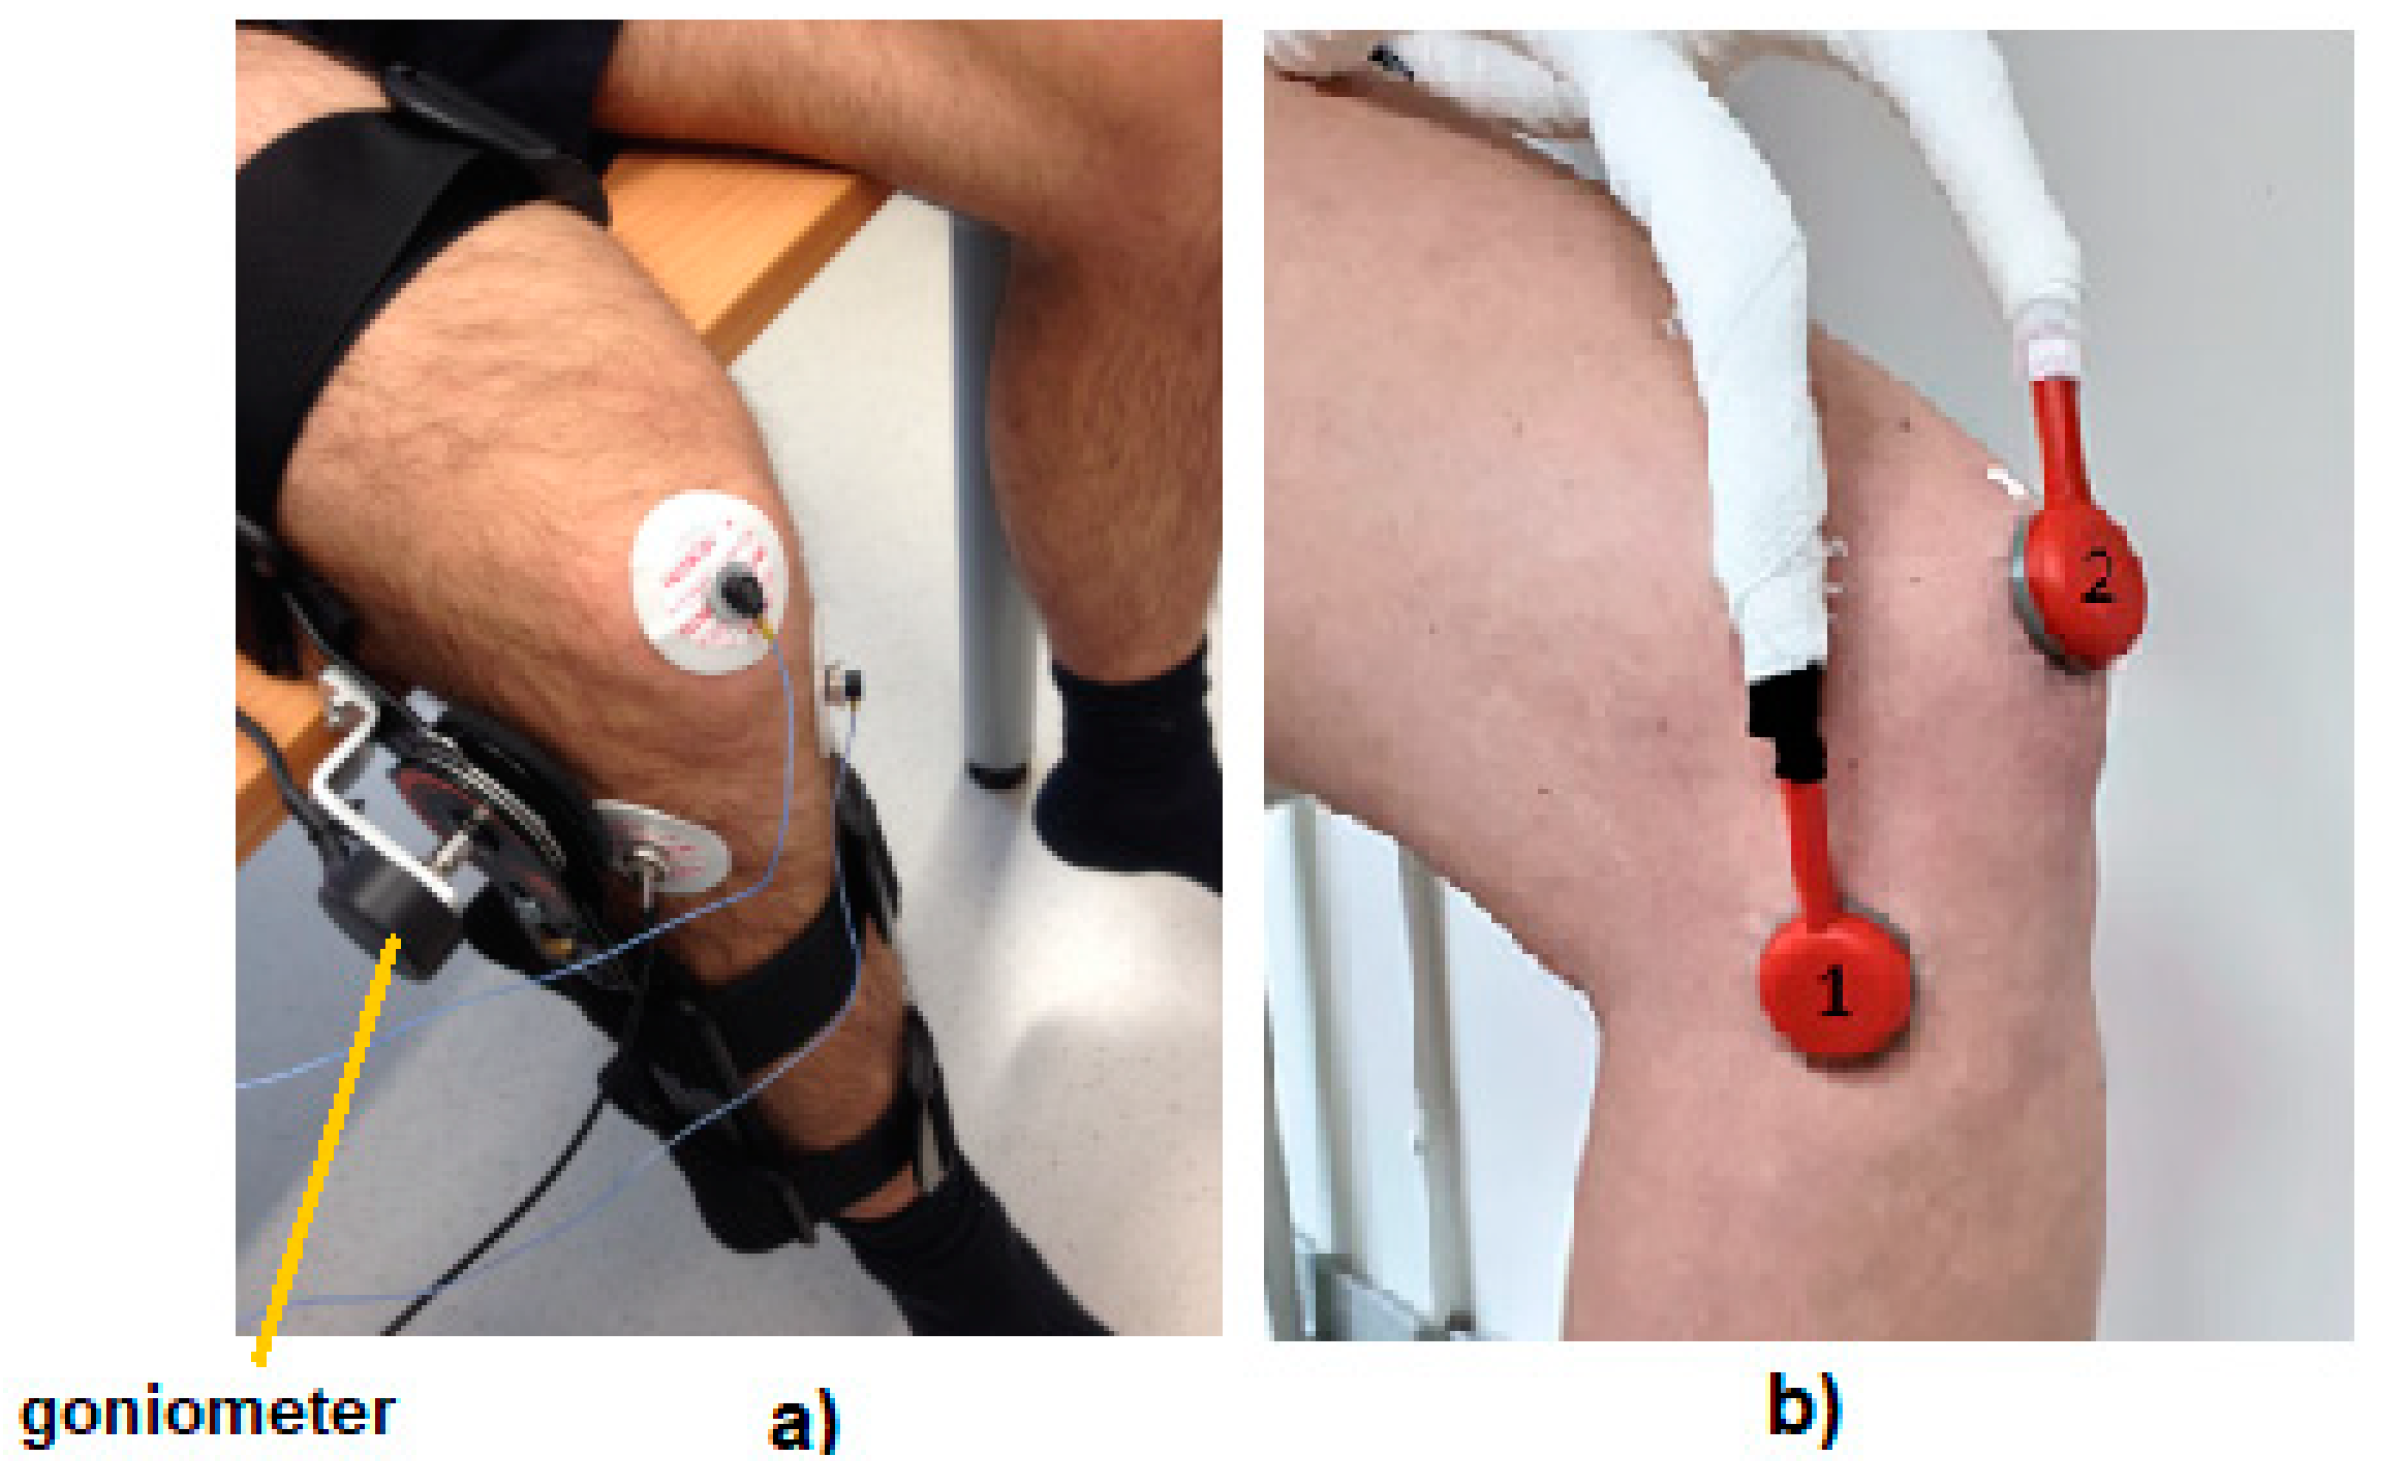
Figure 2 shows two examples of sensors attached to the knee. Moreover, the workflow of the VAG signal recording and analyzing procedure is shown in Figure 3. It will be further described in the following chapters.

3. Signal Analysis

3.1. Signal Preprocessing

Following the signal acquisition, signal preprocessing is crucial in order to reduce different types of measurement artifacts. Diverse techniques are used to extract only the desired components present in the VAG signal.
Artifacts in VAG signals can be a baseline wander, a random noise, or a muscle contraction interference. In the VAG signal, a baseline wander is usually observed when people with knee disorders tremble their legs when undergoing a range of motion due to pain [20]. Furthermore, random noise is usually generated by the thermal effect of circuit constituents. As discussed earlier, firmly attaching the sensors to the skin can minimize the generation of noise during the experimental protocol.
Additionally, to suppress these artifacts, several methods are currently cited in the literature. The most common ones are fixed and adaptive filtering. Fixed filtering uses a band-pass or high-pass filter with defined parameters. Adaptive filtering is more complex and requires a change in filter parameters over the signal’s time adapting to its changing characteristics [2].
An example of fixed filtering is provided by Noor et al. [15] with the use of a Butterworth 4th order filter with cutoff frequencies of 10 Hz and 720 Hz and a wavelet denoising technique to smooth the VAG signal. This type of filter minimizes low-frequency movement artifacts and prevents aliasing effects [16].
Concerning adaptive filtering, Cai et al. have studied the use of a so-called cascade moving average filter to remove the baseline wander [20]. This filter combines two successive moving average operators. It shows very good results in removing baseline wander from the VAG signal of both normal and abnormal subjects [20]. Another method introduced by Wu et al. [21] utilizes Ensemble Empirical Mode Decomposition (EEMD) and Detrended Fluctuation Analysis (DFA) algorithms to eliminate artifacts such as baseline wander and random noise in VAG signals. This method can be explained as follows. Each raw signal is processed into several Intrinsic Mode Functions (IMFs) that represent the fast and slow oscillations in the signal. The DFA algorithm is then used to study the correlations of each of the IMFs, in order to identify which IMF contains the dominant artifacts of baseline wander and random noise. These IMFs are then removed from the signal [21].
Muscle contraction interference (MCI) is another form of important artifact in vibroarthrographic signals. It involves the acoustic manifestation of the mechanical activity of muscle fibers [4]. Yet, the results of different research concluded that the MCI filtering did not increase the classification accuracy significantly (compared with the classification accuracy obtained using the features of the original VAG signals) [16,26].

3.2. Signal Processing

After removing the artifacts presented above, it is necessary to extract interesting features by further processing the filtered VAG signal. This signal processing can be made in the time domain, frequency domain, or time–frequency domain depending on the type of information needed. A typical waveform issued from the preprocessing is shown in Figure 4. It represents signals from a healthy and an abnormal knee.

3.2.1. Time Domain Analysis

In the time domain, segmentation is commonly used to cleave the signal into smaller segments according to angular data given by the electro-goniometer. The use of segmentation to isolate flexion and extension segments has been performed by Mascaro et al. and Befrui et al. [14,27]. Results have shown that the ascending and descending phases produce different acoustic emissions amplitudes, and that features extracted from the ascending phase highlight a greater difference between healthy and OA knee joints, thus confirming the interest in segmentation [14].
VAG signals were characterized with Form Factor, kurtosis, entropy, and skewness, as used by R. Rangayyan et al. [22]. The Form Factor gives information about the variability of the signal and is defined using three parameters—namely, activity, mobility, and complexity. Skewness is related to the asymmetry of the probability density function (PDF), kurtosis is the tendency of the signal to have peaks, and entropy is at its maximum for a uniform PDF [22]. These parameters provide good classification performance in discriminating between normal and abnormal subjects. Rangayyan et al. also showed that the Turns Count (TC) can be used to characterize the variability of a VAG signal [23,24]. TC can detect the number of spikes, swings, or changes in an amplitude larger than a defined threshold [23]. Thus, the TC provides relevant information on the overall variation in a signal. According to Rangayyan et al. [23], TC yields good levels of accuracy in screening VAG signals. In addition, the amplitude and duration of the signal have shown encouraging results in differentiating OA and healthy knee joints [14]. Similarly, Olowiana et al. [30] have estimated the variability of the VAG signal by computing the variance of the mean-squared values and the signal amplitude.

3.2.2. Frequency Domain Analysis

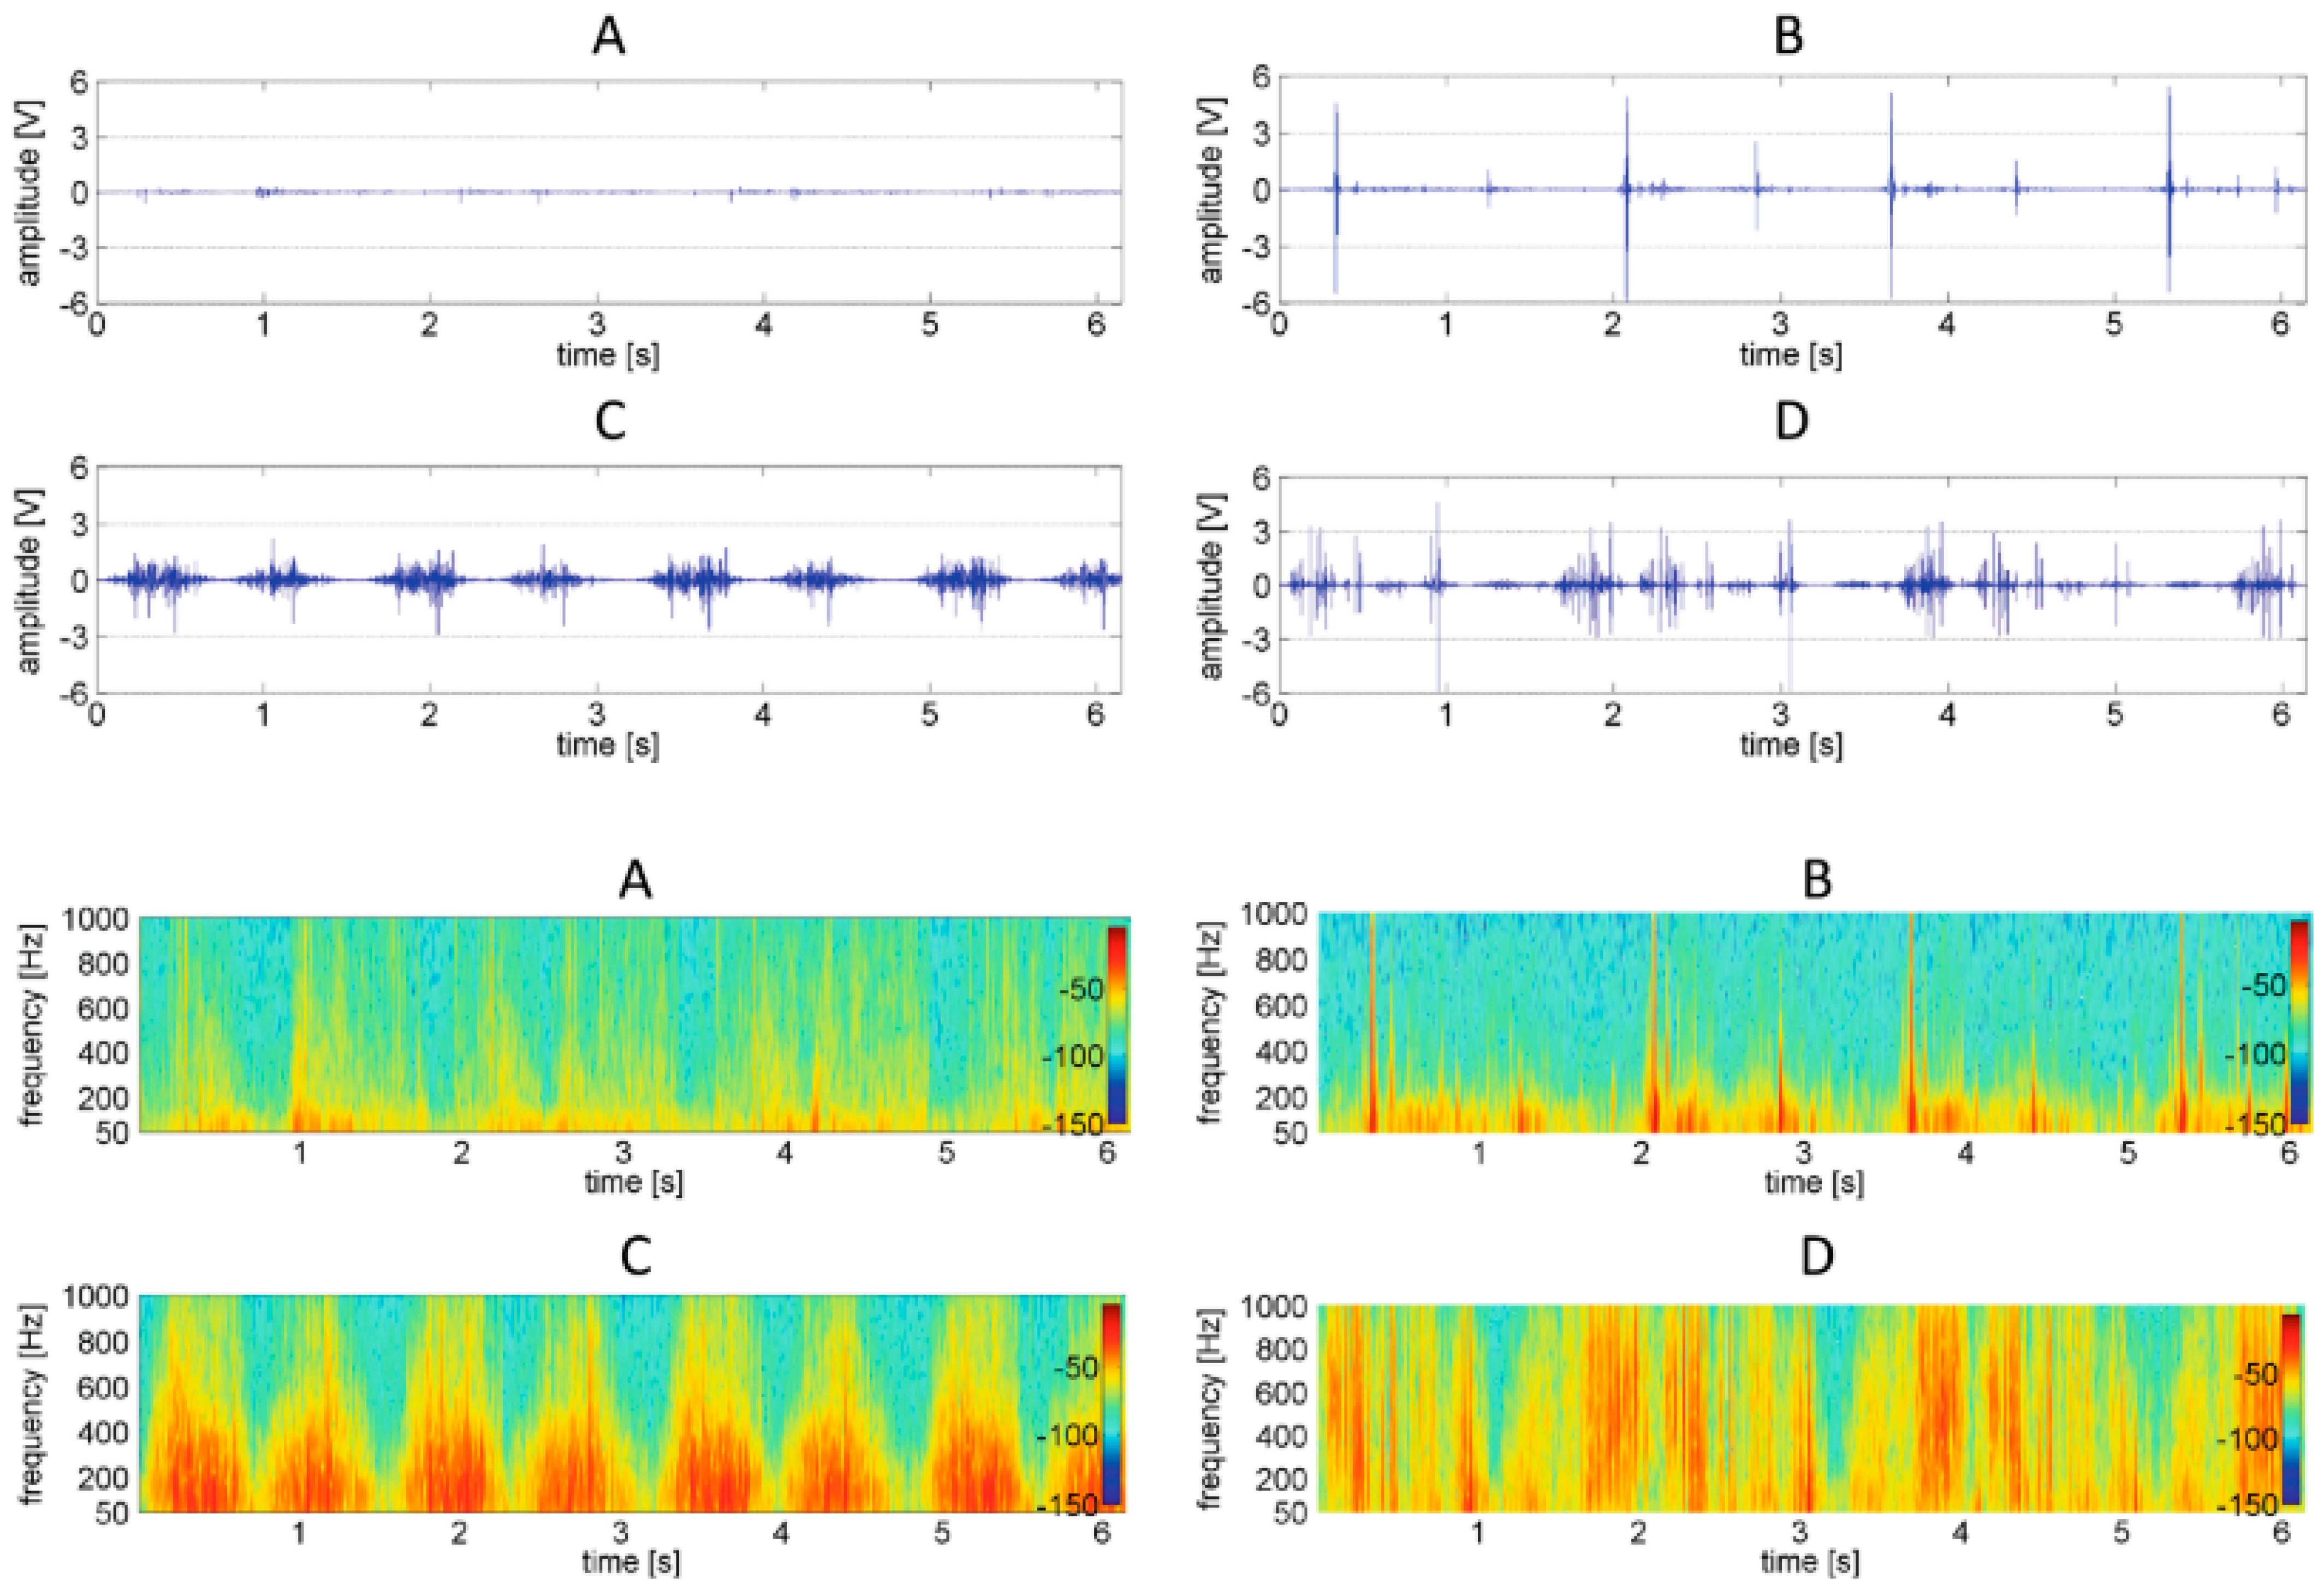
The parameters defined previously reflect the signal’s temporal shape and its variation over time. However, it is sometimes more interesting to explore the frequency content of a signal. The frequency analysis of VAG signals can be performed using Fourier Transform [32], which allows the conversion of signals from the time domain to the frequency domain. For example, significant differences in the mean power of the knee acceleration signal were detected in the 100–500 Hz range for two knee disorders: spondyloarthropathy and rheumatoid arthritis [19]. Patellofemoral joint diseases were extensively investigated by Baczkowicz et al. [17]. The spectrograms for different diseases are plotted in Figure 5.
Furthermore, peak frequency, as well as the power content and decibel level of their VAG signals, have been computed by McCoy et al. [7]. They have enabled the identification and categorization of different signal types in healthy knees. As discussed earlier, VAG signals may be of different forms, as shown in Figure 5. A typical example of these signal types is the Physiological Patellofemoral Crepitus (PPC). This is found in 99% of people when the knee angular velocity is lower than 5 degrees per second. PPC is a manifestation of the slip-stick friction phenomenon generated by the patella on femoral condyles. It is believed to reflect the integrity of the articular cartilage [7]. Nevertheless, the exact origin of most of the VAG signal remains unknown.

3.2.3. Time-Frequency Domain Analysis

As VAG signals are non-stationary signals, the Fourier Transform is not adequate. Indeed, it only characterizes the frequency content of a given signal but it is not possible to detect signal variation characteristics over time [2]. Therefore, time–frequency techniques are often employed. These techniques enable the study of a signal by considering the time and frequency domains simultaneously. The most common time–frequency analysis techniques used for VAG signals are Short Time Fourier Transform, Wigner Ville Distribution, and Wavelet Transform (WT).
Short-Time Fourier Transform (STFT) can be defined as Fourier Transform over a fixed window that slides over time. Baczkowicz et al. [17] have used STFT to compare three types of patellofemoral joint pathologies, which are chondromalacia, lateral patellar compression syndrome, and osteoarthritis based on their vibroacoustic signals. However, even though STFT can overcome some drawbacks of Fourier Transform, it cannot give a good resolution in both time and frequency.
The Wigner–Ville distribution has been used by Kim et al. [16] to transform their VAG signal into a time–frequency distribution and thus extract four parameters—namely, the energy parameter (EP), energy spread parameter (ESP), frequency parameter (FP), and frequency spread parameter (FSP).
Lastly, Wavelet Transform [33] is a time–frequency analysis technique based on the dilation and translation of a mother wavelet over time to characterize an entire signal. The main difference with Fourier Transform is that the WT breaks down the signal into wavelets instead of sine waves. Moreover, due to the scale and the translation parameters, the decomposition gives a better resolution than STFT, which has a fixed window sliding over time. Previous studies have employed the Daubechies wavelets, as they most resemble the VAG signals [2,4,24]. An illustration in Figure 6 shows some of these wavelets along with measured waveforms. Chiu Ching Tuan et al. [34] have executed dynamic time warping on the wavelet coefficients of signals from healthy patients and patients with a history of ligament injuries. They have concluded that those coefficients can represent a useful indicator of the degree of ligament stabilization during recovery [34].

3.3. Classification

Classification is the last step in the post-processing method described above. Its aim is to predict a pathology from measured signals. Typically, the classification model is trained with two datasets. One belongs to the normal and the other to abnormal knees.
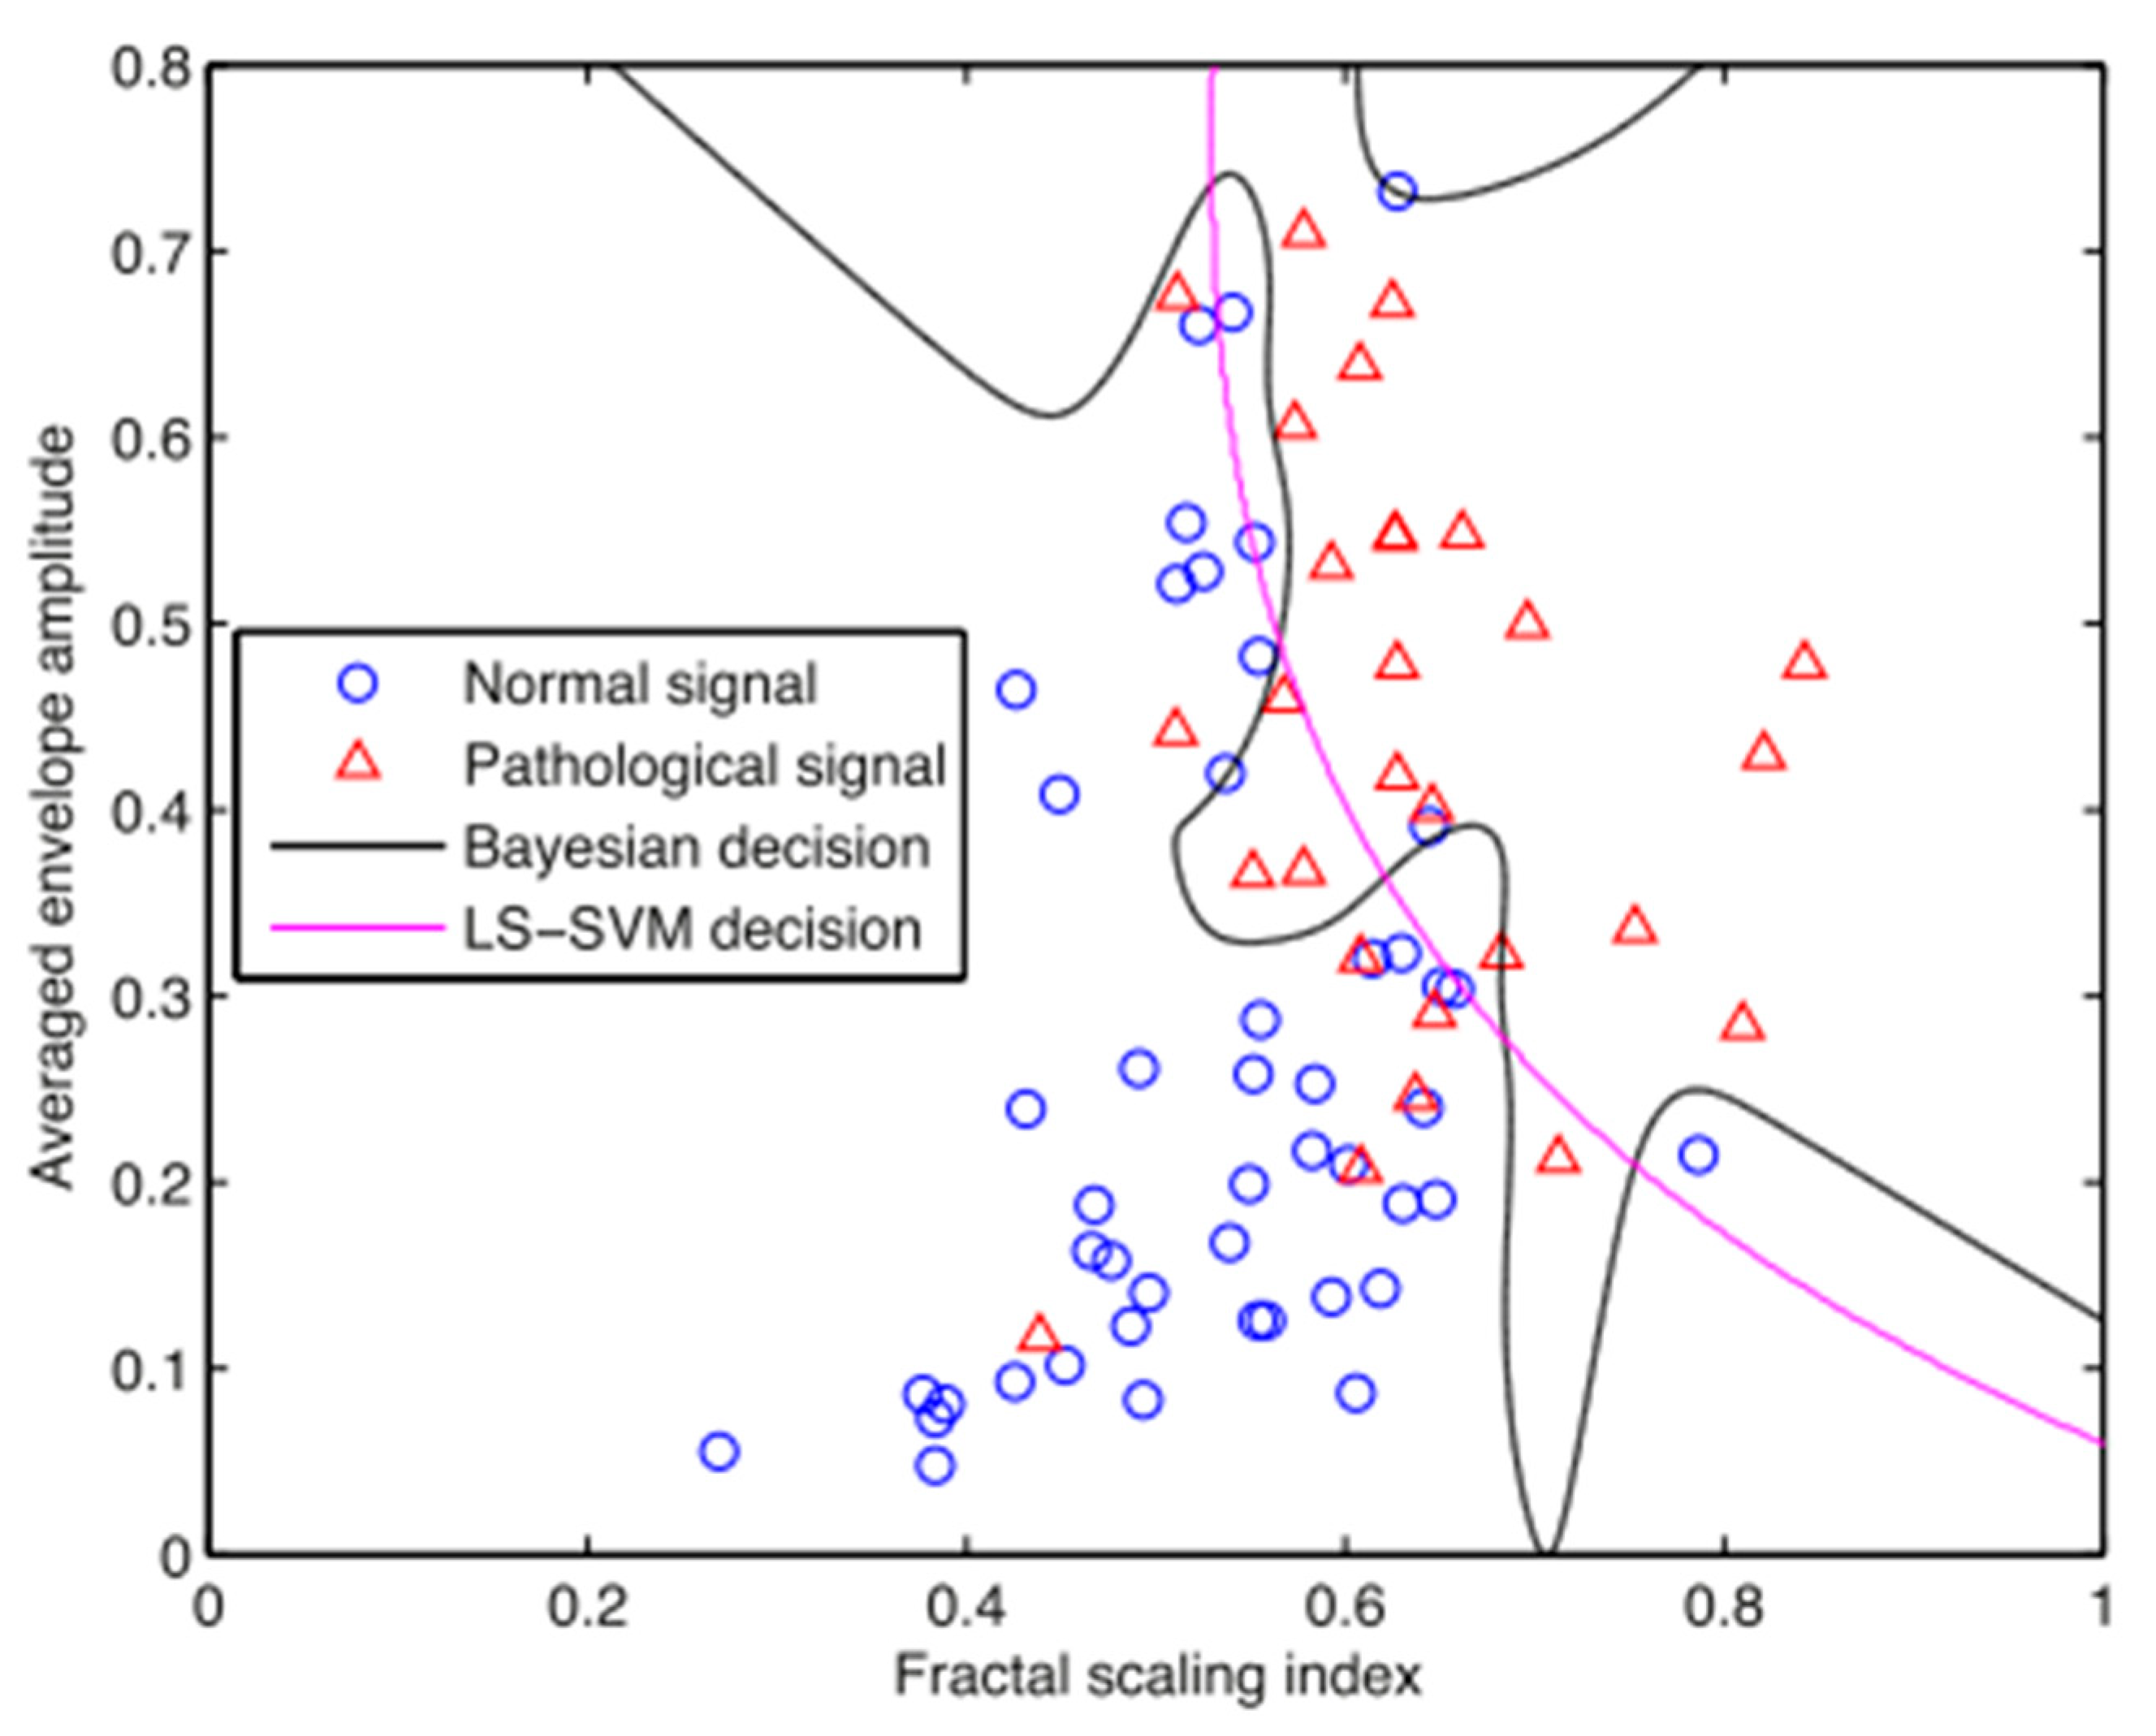
A range of the parameters and statistics discussed in Section 3.2 may be used for classification. Nevertheless, the parameter selection is essential and it should include highly discriminant features to increase the predictive accuracy [2]. So-called supervised classification has therefore been used recently, and relies on chosen features that will affect the presence or absence of knee pathology. Befrui et al. [27] performed a supervised classification to distinguish asymptomatic versus OA knees, thanks to a Linear Support Vector Machine. Their results were conclusive, as the specificity and sensitivity reached 80% and 75%, respectively. This accuracy is as high as that of existing diagnostic tests. Similarly, Kim et al. classified with an average accuracy of 91.4% normal and abnormal VAG signals from four parameters that are mentioned above in the time–frequency analysis section [16]. Furthermore, normal and OA knees have been classified using a discriminant function based on four other parameters [35]. Classification results showed a sensitivity of 89.52%, a specificity of 67.50%, and a total accuracy rate of 81.52%. Moreover, Yang et al. [36] used the Least-Squares Support Vector Machine (LS-SVM) and the Bayesian Decision Rule (BDR) to classify knee joint vibroarthrographic signals. The VAG signal is represented by a two-dimensional feature vector composed of a fractal scaling index and the average envelope amplitude. Figure 7 illustrates the classification result of the two techniques. It can be observed that the least-square support vector machine and the Bayesian decision rule provide two different nonlinear decision boundaries and produce overall accuracy rates of 82.67% and 88%, respectively. Other classification studies are listed in Table 2.

4. Conclusions and Perspectives

The study of sounds emitted from knee joints began a long time ago with the stethoscope and has evolved thanks to technological changes. These advances have allowed the discovery of new ways to record and analyze these sounds. Several techniques are currently available to explore the characteristics of vibroarthrographic signals, such as Fourier or wavelet transform. This review paper mentions some of the parameters that can be extracted from these signals in their time and/or frequency domain. Due to the nature of vibroarthrographic signals, the most appropriate analysis technique seems to be the time–frequency one, as it enables the study of the frequencies contained in the signal while preserving the signal’s information over time.
The vibration arthrography technique has been demonstrated to be a useful and discriminant diagnostic tool. It enables the differentiation of healthy knees from several pathologies such as osteoarthritis. Classification achieved impressive results, with an accuracy ranging from 81.52% to 91.4% according to the signal analysis techniques used [2,16,24,27,35,36]. In the same way, it has shown significant results in discriminating spondyloarthropathy and rheumatoid arthritis patients [19].
It is worth mentioning some of the major limitations of the vibration arthrography technique that should be addressed in the future. First, the anatomy is highly different between individuals, thus inducing complexity in positioning the sensors on the skin. Second, the experimental setup always produces artifacts either from the sensors themselves (electrical) or from the choice of fixation to the skin (friction). Recently, alternative experimental methods have been developed to avoid some artifacts. A typical example explored by Bolus et al. [28] is an instrumented glove with a miniature accelerometer mounted at the fingertips. It has been demonstrated that this method produces reliable results. Furthermore, it could prevent the use of tapes and adhesive pads, thus removing some noise. Such gloves could enable parents of children with juvenile idiopathic arthritis to collect easily vibrational data at home [28].
The vibroarthrography seems to work sufficiently well in discriminating normal and abnormal knees. Yet, the exact source and cause of knee joint vibration emissions are still unknown since this articulation is highly complex and the vibration arthrography technique does not allow us to see the inside of the body.
Therefore, future research could focus on biomechanical modeling of the knee to come to a further understanding of the mechanisms behind VAG signals. Although numerous studies have dealt with the biomechanical modeling of the knee joint [37,38,39], only a handful have tried to explain the nature of VAG signals. One such model has been developed to reproduce the Physiological Patellofemoral Crepitus mentioned previously [40]. It clearly demonstrates the slip-stick phenomenon at the cartilage interface. Thus, future studies could improve this model to more accurately represent the knee joint components and their biomechanical behavior. Furthermore, measurements of linearity and vibration transmissibility have been provided by Safaei et al. [29] and could therefore provide useful data for such models.
Moreover, the clinical application of the vibroarthrography technique should be further studied to give a non-invasive alternative to current imaging methods. In the same way, the repeatability of this technique needs to be proven for more precise diagnostics.
While current vibroarthrographic studies focus on healthy and osteoarthritic knees, future research should investigate vibration emission in knee implants. This could lead to a further understanding of the wear of prosthetic components in currently used knee implants.

Author Contributions

S.d.T. collected the data, performed the analysis and wrote the paper. M.R. supervised, conceived and designed the analysis. M.M. provided drawings to illustrate the paper. All authors have read and agreed to the published version of the manuscript.

Funding

Financed by the project Bonus Qualité Recherche (BQR) lamcos 2020. The project adviser is Ana-Maria Trunfio-Sfarghiu. The authors are paid by the CNRS and INSA Lyon.

Institutional Review Board Statement

Le laboratoire de Mécanique des Contacts et des Structures (LaMCoS) is part of the « ministère de l’enseignement supérieur, de la recherche et de l’innovation ». Its Code of Ethics is complying with the law of 25 June 2021. The ethical adviser of the LaMCoS laboratory is Arnaud Duval.

Informed Consent Statement

Not applicable because it consists in a review paper. Thus, all results and images are taken from previous studies and are referenced. Drawings are provided by authors.

Data Availability Statement

Data sharing not applicable. No new data were created or analyzed in this study. Data sharing is not applicable to this article.

Conflicts of Interest

The authors declare no conflict of interest.

References

  1. Marieb, E.; Hoehn, K. Anatomie et Physiologie Humaines; Pearson Education: Paris, France, 2005. [Google Scholar]
  2. Moreira, D.B.F. Classification of Knee Arthropathy with Accelerometer-Based Vibroarthrography. Master Thesis, Uni Porto, Porto, Portugal, 2015. [Google Scholar]
  3. Cui, A.; Li, H.; Wang, D.; Zhong, J.; Chen, Y.; Lu, H. Global, Regional Prevalence, Incidence and Risk Factors of Knee Osteoarthritis in Population-Based Studies. EClinicalMedicine 2020, 29–30, 100587. [Google Scholar] [CrossRef]
  4. Wu, Y. Knee Joint Vibroarthrographic Signal Processing and Analysis; Springer: Berlin/Heidelberg, Germany, 2015. [Google Scholar]
  5. Lee, M.; et Chow, K. Ultrasound of the Knee. Semin. Musculoskelet. Radiol. 2007, 11, 137–148. [Google Scholar] [CrossRef] [PubMed]
  6. Naredo, E.; Acebes, C.; Moller, I.; Canillas, F.; de Agustin, J.J.; de Miguel, E.; Filippucci, E.; Iagnocco, A.; Moragues, C.; Tuneu, R.; et al. Ultrasound Validity in the Measurement of Knee Cartilage Thickness. Ann. Rheum. Dis. 2009, 68, 1322–1327. [Google Scholar] [CrossRef]
  7. McCoy, G.F.; McCrea, J.D.; Beverland, D.E.; Kernohan, W.G.; Mollan, R.A. Vibration Arthrography as a Diagnostic Aid in Diseases of the Knee. A Preliminary Report. J. Bone Jt. Surg. 1987, 69B, 288–293. [Google Scholar] [CrossRef] [Green Version]
  8. Walters, C.F. The value of joint auscultation. Clin. Lab. Notes. Lancet 1929, 1, 920–921. [Google Scholar] [CrossRef]
  9. Kernohan, W.G.; Beverland, D.E.; McCoy, G.F.; Hamilton, A.; Watson, P.; Mollan, R. Vibration Arthrometry. Acta Orthop. Scand. 1990, 61, 70–79. [Google Scholar] [CrossRef] [Green Version]
  10. Hersek, S.; Baran Pouyan, M.; Teague, C.N.; Sawka, M.N.; Millard-Stafford, M.L.; Kogler, G.F.; Wolkoff, P.; Inan, O.T. Acoustical Emission Analysis by Unsupervised Graph Mining: A Novel Biomarker of Knee Health Status. IEEE Trans. Biomed. Eng. 2018, 65, 1291–1300. [Google Scholar] [CrossRef] [PubMed]
  11. Kalo, K.; Niederer, D.; Sus, R.; Sohrabi, K.; Groß, V.; Vogt, L. Reliability of Vibroarthrography to Assess Knee Joint Sounds in Motion. Sensors 2020, 20, 1998. [Google Scholar] [CrossRef] [Green Version]
  12. Teague, C.N.; Hersek, S.; Toreyin, H.; Millard-Stafford, M.L.; Jones, M.L.; Kogler, G.F.; Sawka, M.N.; Inan, O.T. Novel Methods for Sensing Acoustical Emissions from the Knee for Wearable Joint Health Assessment. IEEE Trans. Biomed. Eng. 2016, 63, 1581–1590. [Google Scholar] [CrossRef]
  13. Madeleine, P.; Andersen, R.E.; Larsen, J.B.; Arendt-Nielsen, L.; Samani, A. Wireless Multichannel Vibroarthrographic Recordings for the Assessment of Knee Osteoarthritis during Three Activities of Daily Living. Clin. Biomech. 2020, 72, 16–23. [Google Scholar] [CrossRef] [PubMed]
  14. Mascaro, B.; Prior, J.; Shark, L.-K.; Selfe, J.; Cole, P.; Goodacre, J. Exploratory Study of a Non-Invasive Method Based on Acoustic Emission for Assessing the Dynamic Integrity of Knee Joints. Med. Eng. Phys. 2009, 31, 1013–1022. [Google Scholar] [CrossRef]
  15. Noor, M.A. Development of a Non-Invasive Bio-Acoustics Measurement System for Assessing Articular Cartilage Knee Joint Problem. J. Teknol. 2014. [Google Scholar] [CrossRef] [Green Version]
  16. Kim, K.S.; Seo, J.H.; Kang, J.U.; Song, C.G. An Enhanced Algorithm for Knee Joint Sound Classification Using Feature Extraction Based on Time-Frequency Analysis. Comput. Methods Progr. Biomed. 2009, 94, 198–206. [Google Scholar] [CrossRef]
  17. Bączkowicz, D.; Majorczyk, E. Joint Motion Quality in Vibroacoustic Signal Analysis for Patients with Patellofemoral Joint Disorders. BMC Musculoskelet. Disord. 2014, 15, 426. [Google Scholar] [CrossRef] [Green Version]
  18. Barr, D.A.; Kernohan, W.G.; Mollan, R.A.B. An Investigation of the Short-Term Effect of Exercise on the Knee Joint by Means of Computer-Assisted Auscultation. Adv. Eng. Softw. 1994, 21, 27–35. [Google Scholar] [CrossRef]
  19. Reddy, N.P.; Rothschild, B.M.; Verrall, E.; Joshi, A. Noninvasive Measurement of Acceleration at the Knee Joint in Patients with Rheumatoid Arthritis and Spondyloarthropathy of the Knee. Ann. Biomed. Eng. 2001, 29, 1106–1111. [Google Scholar] [CrossRef]
  20. Cai, S.; Wu, Y.; Xiang, N.; Zhong, Z.; He, J.; Shi, L.; Xu, F. Detrending Knee Joint Vibration Signals with a Cascade Moving Average Filter. In Proceedings of the 2012 Annual International Conference of the IEEE Engineering in Medicine and Biology Society, San Diego, CA, USA, 28 August–1 September 2012; IEEE: San Diego, CA, USA, 2012; pp. 4357–4360. [Google Scholar] [CrossRef]
  21. Wu, Y.; Yang, S.; Zheng, F.; Cai, S.; Lu, M.; Wu, M. Removal of Artifacts in Knee Joint Vibroarthrographic Signals Using Ensemble Empirical Mode Decomposition and Detrended Fluctuation Analysis. Physiol. Meas. 2014, 35, 429–439. [Google Scholar] [CrossRef] [PubMed]
  22. Rangayyan, R.M.; Wu, Y.F. Screening of Knee-Joint Vibroarthrographic Signals Using Statistical Parameters and Radial Basis Functions. Med. Biol. Eng. Comput. 2008, 46, 223–232. [Google Scholar] [CrossRef]
  23. Rangayyan, R.M.; Wu, Y. Analysis of Vibroarthrographic Signals with Features Related to Signal Variability and Radial-Basis Functions. Ann. Biomed. Eng. 2009, 37, 156–163. [Google Scholar] [CrossRef]
  24. Cai, S.; Yang, S.; Zheng, F.; Lu, M.; Wu, Y.; Krishnan, S. Knee Joint Vibration Signal Analysis with Matching Pursuit Decomposition and Dynamic Weighted Classifier Fusion. Comput. Math. Methods Med. 2013, 2013, 904267. [Google Scholar] [CrossRef] [Green Version]
  25. Rangayyan, R.M.; Oloumi, F.; Wu, Y.; Cai, S. Fractal Analysis of Knee-Joint Vibroarthrographic Signals via Power Spectral Analysis. Biomed. Signal Process. Control 2013, 8, 23–29. [Google Scholar] [CrossRef]
  26. Krishnan, S.; Rangayyan, R.M.; Bell, G.D.; Frank, C.B.; Ladly, K.O. Adaptive Filtering, Modelling and Classification of Knee Joint Vibroarthrographic Signals for Non-Invasive Diagnosis of Articular Cartilage Pathology. Med. Biol. Eng. Comput. 1997, 35, 677–684. [Google Scholar] [CrossRef] [PubMed]
  27. Befrui, N.; Elsner, J.; Flesser, A.; Huvanandana, J.; Jarrousse, O.; Le, T.N.; Müller, M.; Schulze, W.H.W.; Taing, S.; Weidert, S. Vibroarthrography for Early Detection of Knee Osteoarthritis Using Normalized Frequency Features. Med. Biol. Eng. Comput. 2018, 56, 1499–1514. [Google Scholar] [CrossRef] [PubMed]
  28. Bolus, N.B.; Jeong, H.K.; Whittingslow, D.C.; Inan, O.T. A Glove-Based Form Factor for Collecting Joint Acoustic Emissions: Design and Validation. Sensors 2019, 19, 2683. [Google Scholar] [CrossRef] [PubMed] [Green Version]
  29. Safaei, M.; Bolus, N.B.; Erturk, A.; Inan, O.T. Vibration Characterization of the Human Knee Joint in Audible Frequencies. Sensors 2020, 20, 4138. [Google Scholar] [CrossRef] [PubMed]
  30. Olowiana, E.; Selkow, N.; Laudner, K.; Puciato, D.; Baczkowitz, D. Vibroarthograpic analysis of patellofemoral joint arthrokinematics during squats with increasing external loads. BMC Sports Sci. Med. Rehabil. 2020, 12, 51. [Google Scholar] [CrossRef]
  31. Kalo, K.; Niederer, D.; Stief, F.; Wurzberger, L.; Drongelen, S.; Meurer, A.; Vogt, L. Validity of and recommendations for knee joint acoustic assessments during different movement conditions. J. Biomech. 2020, 109, 109939. [Google Scholar] [CrossRef]
  32. Duhamel, P.; Vetterli, M. Fast Fourier transform: A tutorial review and state of the art. Signal Process. 1990, 19, 259–299. [Google Scholar] [CrossRef] [Green Version]
  33. Rhif, M.; Abbes, A.B.; Farh, R.F.; Martinez, B.; Sang, Y. Wavelet transform application for/in non-stationary time-series analysis: A review. Appl. Sci. 2019, 9, 1345. [Google Scholar] [CrossRef] [Green Version]
  34. Tuan, C.-C.; Lu, C.-H.; Wu, Y.-C.; Chen, M.-C.; Chi, S.-W.; Lee, T.-F.; Yeh, W.-L. Developmental Screening System for Patient Vibration Signals with Knee Disorder. Appl. Sci. 2019, 9, 908. [Google Scholar] [CrossRef] [Green Version]
  35. Lin, W.-C.; Lee, T.-F.; Lin, S.-Y.; Wu, L.-F.; Wang, H.-Y.; Chang, L.; Wu, J.-M.; Jiang, J.-C.; Tuan, C.-C.; Hong, M.-F.; et al. Non-Invasive Knee Osteoarthritis Diagnosis via Vibroarthrographic Signal Analysis. J. Inf. Hiding Multimed. Signal Process. 2014, 5, 497–507. [Google Scholar]
  36. Yang, S.; Cai, S.; Zheng, F.; Wu, Y.; Liu, K.; Wu, M.; Zou, Q.; Chen, J. Representation of Fluctuation Features in Pathological Knee Joint Vibroarthrographic Signals Using Kernel Density Modeling Method. Med. Eng. Phys. 2014, 36, 1305–1311. [Google Scholar] [CrossRef] [PubMed]
  37. Wang, J.; Tao, K.; Li, H.; Wang, C. Modelling and Analysis on Biomechanical Dynamic Characteristics of Knee Flexion Movement under Squatting. Sci. World J. 2014, 2014, 321080. [Google Scholar] [CrossRef] [Green Version]
  38. Erdemir, A. Open Knee: Open Source Modeling and Simulation in Knee Biomechanics. J. Knee Surg. 2016, 29, 107–116. [Google Scholar] [CrossRef] [Green Version]
  39. Madeti, B.K.; Rao, C.S. Biomechanics of knee joint–A review. Front. Mech. Eng. 2015, 10, 176–186. [Google Scholar] [CrossRef]
  40. Beverland, D.E.; Kernohan, G.; McCoy, G.F.; Mollan, R.A.B. What Is Physiological Patellofemoral Crepitus? Med. Biol. Eng. Comput. 1985, 23, 1249–1250. [Google Scholar]
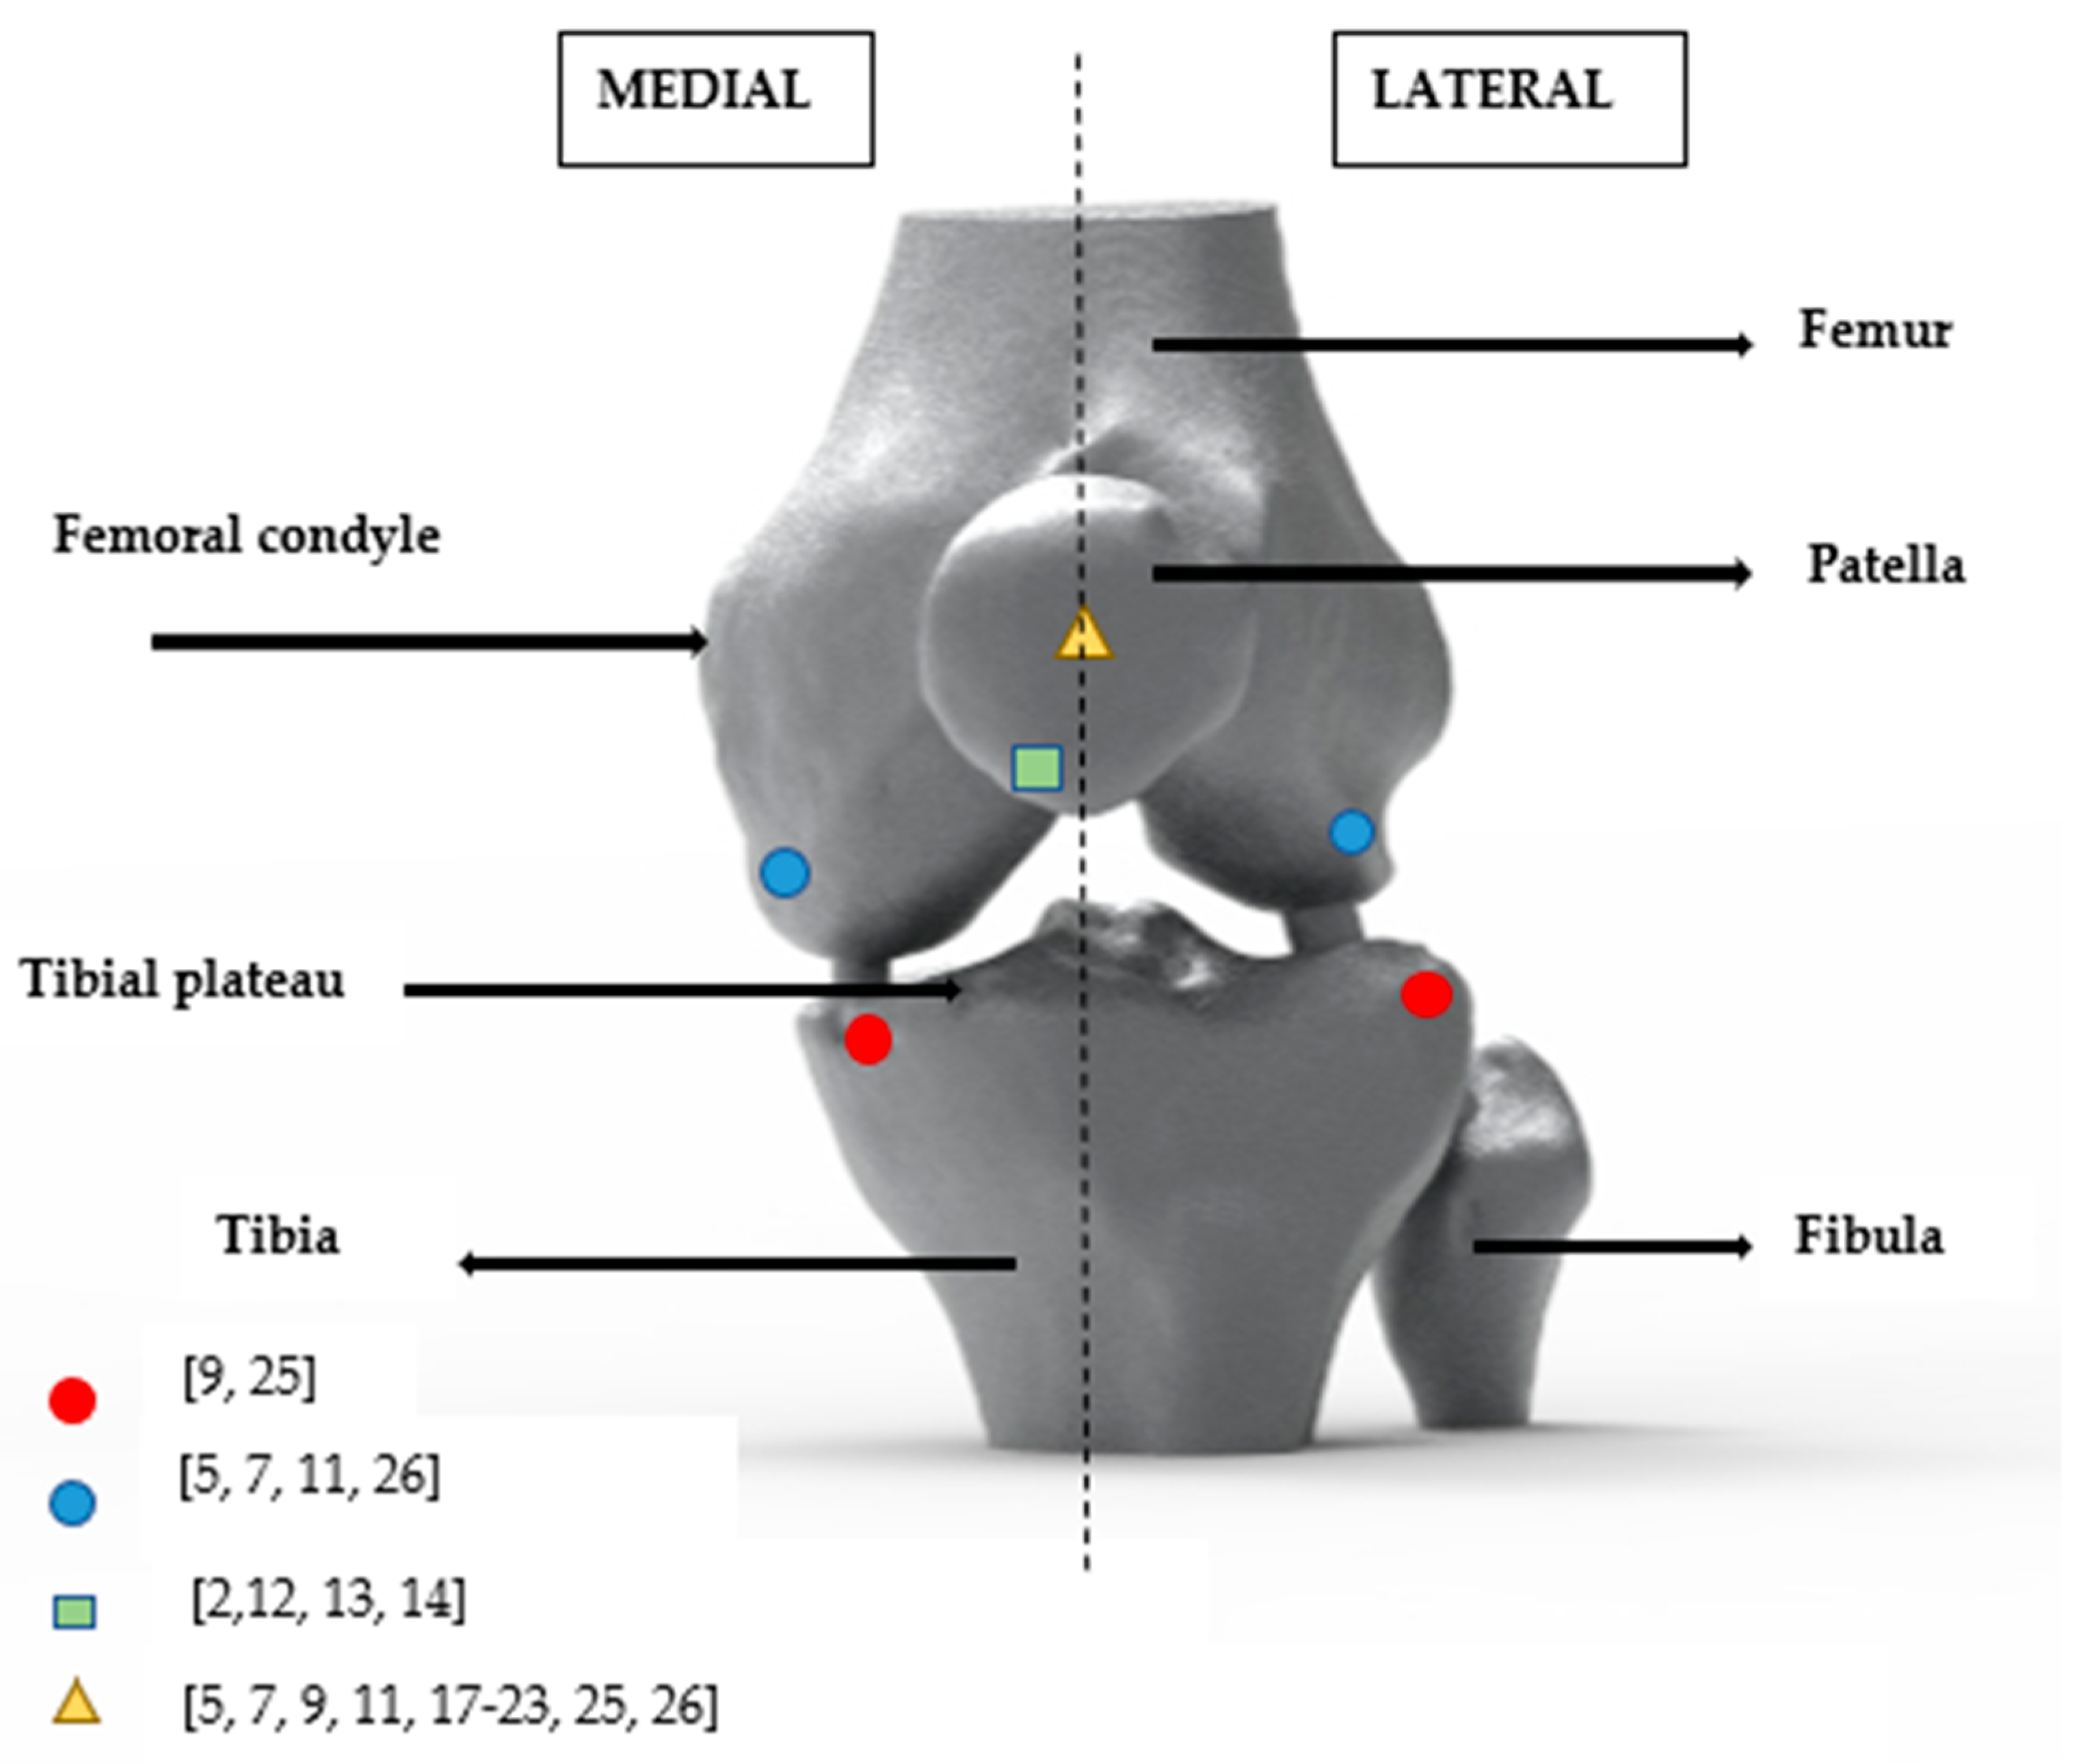
Figure 1. 3D modelling of a left knee with color symbols showing the different locations of sensors used by the authors.
Applsci 11 07337 g001
Figure 2. Examples of sensors being attached to a knee: (a) accelerometers [25], (b) microphones [9].
Applsci 11 07337 g002
Figure 3. Diagram of a typical knee joint vibration arthrographic signal recording and analyzing process.
Applsci 11 07337 g003
Figure 4. Example of a waveform obtained by an accelerometer on a healthy knee in (a) and from a knee with pathology in (b) (from [20]). The short-time burst in (a) is often referred to as a “patellar click”.
Applsci 11 07337 g004
Figure 5. The time domain waveforms and their respective spectrograms from [17]. Here, the different patellofemoral diseases were investigated: (A) healthy knee; (B) knee with lateral patellar compression syndrome; (C) knee with condromalacia; and (D) knee with patellofemoral joint arthritis.
Applsci 11 07337 g005
Figure 6. (A) A typical signal encountered in VAG data is a short-duration “click”. Here, it is measured by three accelerometers and is associated with the posterior horn tear of the meniscus by McCoy [7]. (B) Typical wavelet forms are used in the post-processing of VAG signals. Daubechies wavelet was used because of its resemblance with short-duration pulses of the VAG signal.
Applsci 11 07337 g006
Figure 7. Decision boundaries provided by the least-square support vector machine (LS-SVM) with polynomial kernels and the Bayesian decision rule applied on VAG signals [36].
Applsci 11 07337 g007
Table 1. Comparison of the currently used diagnostic techniques for knee inspection.
TechniqueAdvantagesLimitations
X-Ray imagingInexpensive
Fast
Indirect measurements because structures such as cartilage do not appear
ArthroscopyGold standard
Low-risk assessment
Non-suitable for repeated assessment: invasive and requires anaesthesia (incisions made to the knee)
UltrasoundReal-time imaging
Low cost
soft tissues and structures detected
Limited by the sound’s properties: ultrasounds cannot penetrate bones, some parts of the knee are hidden from sight
MRI3D imaging, accurate quantitative measurements of articular cartilage morphology
Enables the detection of cartilage, menisci, ligaments, etc.
Expensive
Complex
Long acquisition times
Table 2. A sample of the literature available on the use of the vibration arthrography technique on knee joints as a classification end.
Authors of Research StudyPopulationProcessing Technique: Extracted FeaturesAim of the Study and Results
Reddy et al. (2001) [19]11 spondyloarthropathy—11 rheumatoid arthritic kneesFD analysis: (Discrete Fourier Transform): Mean power of the power spectrum in the frequency range of 100–500 HzDifferentiate spondyloarthropathy and rheumatoid arthritic signals
Rangayyan et al. (2008) [22]51 H—38 with knee joint pathologyTD analysis: FF (extension/flexion), S, K, EClassification of normal and abnormal knees
Rangayyan et al. (2009) [23]51 H—38 with knee joint pathologyTD analysis: TC, VMSClassification of normal and abnormal knees
Mascaro et al. (2009) [14]11 H—10 OATD analysis (segmentation): amplitude, duration
FD analysis (Fourier Transform): peak frequency
Provide a visual tool for differentiate healthy and OA knees
Kim et al. (2009) [16]20 H—11 OATFD analysis: EP, ESP, FP, FSPClassification of normal and OA knees (accuracy of 91.4%)
Baczkowicz (2014) [17]64 H—86 knees with disordersTD analysis: VMS and amplitude
TFD analysis (STFT), partial sum of the power spectrum
Compare the impact of chondromalacia, lateral patellar compression syndrome and OA on knee joint sounds
Moreira (2015) [2]19 H—20 OATD analysis (segmentation): S, K, E, TC
TFD analysis (Wavelet Transform)
Classification of normal and OA knees using a k-NN classifier (accuracy of 89%)
Befrui et al. (2018) [27]30 H—39 OATD analysis: segmentation
Frequency domain: partial sum of the power spectrum
Classification of normal and OA knees using an SVM
FF, Form Factor; S, Skewness; K, Kurtosis; E, Entropy; TC, Turns Count; VMS, variance of the mean-squared value; OA, osteoarthritis; H, Healthy; SVM, Support Vector Machine; TD, Time Domain; FD, Frequency Domain; TFD, Time–Frequency Domain; STFT, Short-Time Fourier Transform; EP, Energy Parameter; ESP, Energy Spread Parameter; FP, Frequency Parameter; FSP, Frequency Spread Parameter.
Publisher’s Note: MDPI stays neutral with regard to jurisdictional claims in published maps and institutional affiliations.