Article

Mixed, Augmented and Virtual, Reality Applied to the Teaching of Mathematics for Architects

by
Julio Cabero-Almenara
1,*,
Julio Barroso-Osuna
1 and
Rosabel Martinez-Roig
2
1
Department of Didactics and Educational Organization, University of Seville, 41013 Seville, Spain
2
Department of General Didactics and Specific Didactics, University of Alicante, 03690 Alicante, Spain
*
Author to whom correspondence should be addressed.
Appl. Sci. 2021, 11(15), 7125; https://doi.org/10.3390/app11157125
Submission received: 8 July 2021 / Revised: 30 July 2021 / Accepted: 30 July 2021 / Published: 1 August 2021
(This article belongs to the Special Issue Innovative Solutions for Augmented and Virtual Reality Applications)

Abstract

:
This paper examines the possibilities of Mixed Reality, the combination of two emerging technologies—Augmented Reality and Virtual Reality—in university education. For this purpose, an object was elaborated in Mixed Reality that underwent the evaluation of 44 first-year students from the degree in architecture who were enrolled in the subject “Mathematical Foundations for Architecture.” The instrument utilized was based on the TAM model, which analyzes the degree of acceptance of the technology used. The analysis of the responses provided by students supported the 23 hypotheses formulated in this study. It was found that MR significantly influences the perceived usefulness and ease of use. The results imply that MR utilization has positive effects on the mathematical teaching-learning processes in architecture from the students’ perception of their mastery of technology. It becomes necessary to offer support to those university teachers who promote the use of active MR-based methodologies in classrooms.

1. Mixed Reality Applied to Training

Amongst the so-called emerging technologies that have recently been coming closer to the educational field, with true potential for training, “Augmented Reality” (AR) and “Virtual Reality” (VR) [1,2] stand out. They offer different possibilities for their implementation in training: fostering mobile, ubiquitous learning; removing unnecessary information that may prevent the observation of the significant one; enriching the information about reality to make its understanding easier; favoring the perception of the most relevant elements, offering faithfulness in the representation of objects; creating multimedia training scenarios, establishing active and interactive environments for learning; increasing students’ motivation; looking at objects from various points of view; adding value to the information supplied to students; and allowing the latter to become immersed in a totally controlled special training context.
Despite this long list of possibilities associated with AR and VR, no unanimous consensus exists on their definition, which has to do with the rapid developments that have taken place within the context of these technologies. Different paths can be followed to distinguish AR from VR; one of them possibly being to place both of them along the reality-virtuality continuum, where AR would stand closer to the real context, while VR would be at one of the ends, with “Augmented Virtual Reality” or “Mixed Reality”—which brings together elements from AR and VR—positioned halfway between them. It is likewise possible to contrast AR and VR, and therefore we can say that, in AR, reality combines with informative elements located in technological devices so that a new reality can be attained, whereas VR places the subject within an immersive technological context that detaches the former from reality [3]. What AR pursues is to mix reality with the virtual sphere, or expressed differently, it enables the user to interact with the physical and digital worlds; instead, VR paves the way for users to access an alternative immersion world simulated by the computer in which different types of sensorial experiences take place and where subjects have the chance to interact with the environment as if they were inside it.
In turn, the Tecnológico de Monterrey [4] recently performed a study that included a comparison between Augmented Reality (AR) (addition of virtual information to physical elements), Virtual Reality (VR) (immersion in a digital world), Mixed Reality (MR) (combination of AR and VR) and the Internet of Things (IoT) (objects with sensors or chips that interact in the real world) (Table 1).
What we are trying to highlight is that AR and VR propose different ways to interact with reality; whereas VR takes the subject to an unreal world and has as its aim for the subject to become immersed in it, AR adds information to the real world. When we talk about MR, both interaction options are found inside an object, which is the case at hand.
Although educational experiences have been developed with AR to a greater extent than VR, amongst other reasons because the former does not require special devices to interact with objects, a diversity of experiences are actually beginning to appear, which combine them both so that they can be applied to different scientific fields: engineering and architecture [5]; language learning [6]; education sciences [7]; chemistry [8]; natural sciences [9]; biology [10]; geography [11]; medicine [12,13,14]; emergency protocol learning [15]; or physical activities [16].
Despite the scarcity of research studies devoted to the implementation of AR and VR in mathematics and in mathematical thinking, those carried out have turned out to be useful in a variety of ways: to prove their effectiveness for competence acquisition, as well as to improve performance and the attitudes towards mathematics learning [17] and to favor the acquisition of mathematical knowledge for students with limitations in that area [18]. From this perspective, Poot, Martin-Gonzalez and Menéndez-Dominguez [19] stressed their effectiveness when it comes to helping upper secondary education students to assimilate the contents related to Euclidean vectors and vector calculation [20], creating environments in AR where students are led to specific interfaces that make it easier for them to perform calculations and represent them graphically. Studies have likewise been carried out at various levels in geometry that serve to attest their effectiveness [21]. At the same time, evidence also exists for their usefulness for the development of visual-spatial ability [22] and for the acquisition of mathematical functions [23].
Such significant aspects have acquired relevance thanks to the possibilities in terms of freedom that these technologies offer from different spatial perspectives and interaction levels, since students can control the pace of their own learning and because of the chances that they provide for the three-dimensional graphic representation of geometric objects [24]. Furthermore, studies have shown that learners display a high level of acceptance regarding these technologies in addition to being greatly motivated when working with them [25,26], which results in students being more engaged with the contents that they must learn [27].
In short, these are technologies that provide the field of mathematics and its diverse areas with highly faithful representations alongside the possibility for the subject to interact with the object, even more so when AR and VR combine, which offers the student multiple perspectives. In this regard, our study has aimed to identify the factors that have an impact on the use of MR by university students through the utilization of the Technology Acceptance Model (TAM). To that end, we will firstly define the specific objectives sought with this study, subsequently offering a detailed description of the method used that will include the hypotheses posed. The results obtained will then be analyzed and presented so that we can finally discuss and draw conclusions about the most important findings based on those results.

2. Research Carried Out

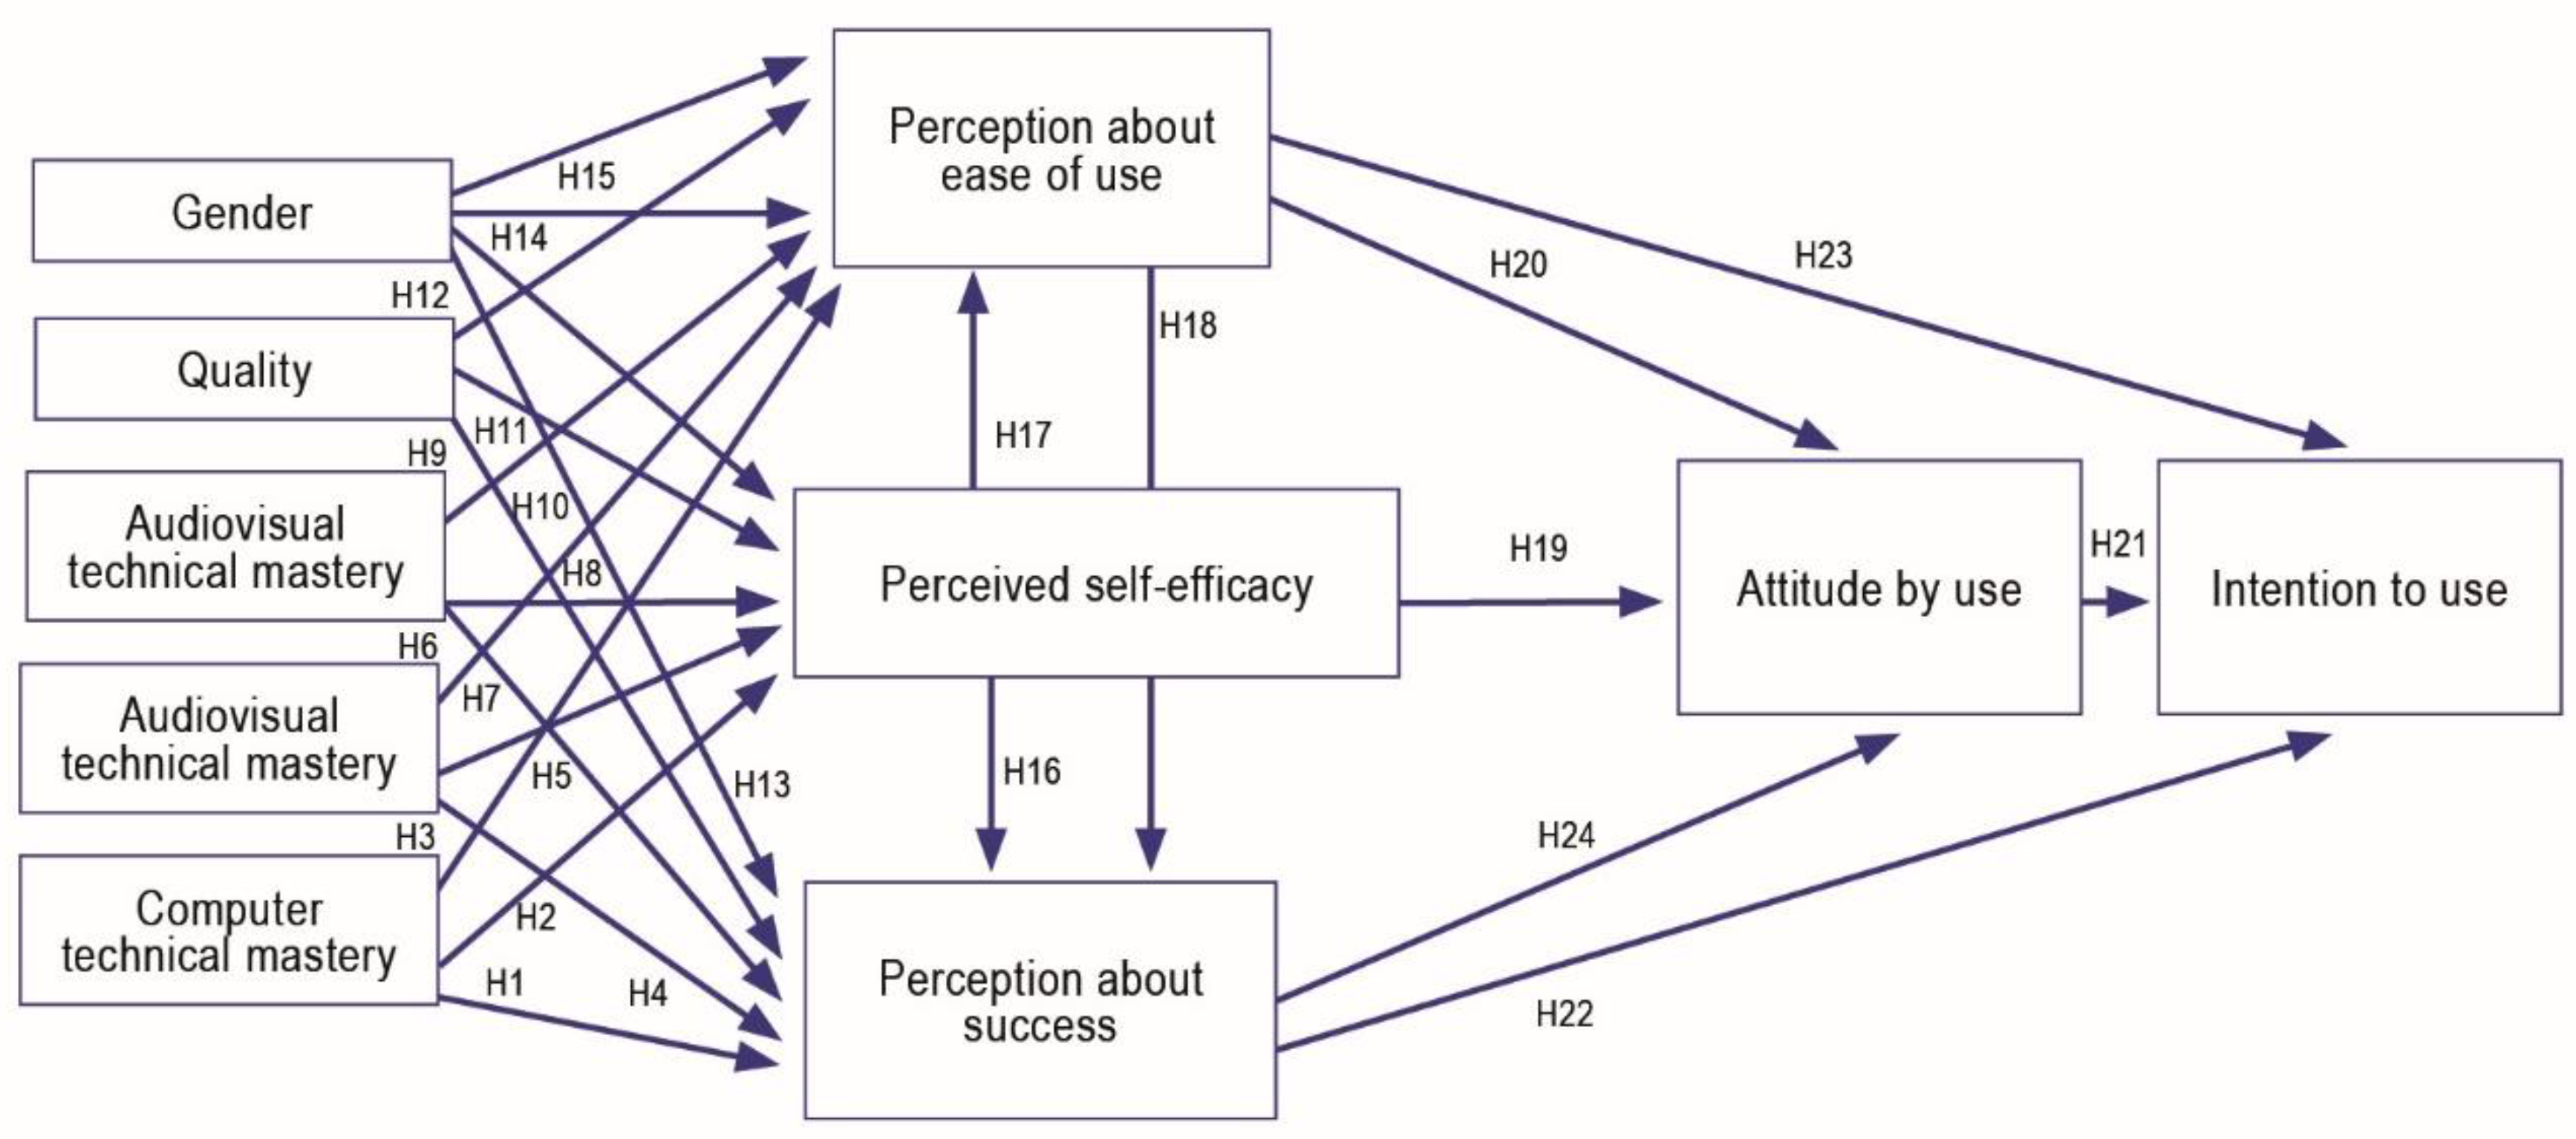
2.1. Research Objectives

The objectives set in this research are:
(a)
Ascertaining the degree of technological acceptance that the use of Mixed Reality (MR), Augmented Reality (AR) and Virtual Reality (VR) arouses amongst university architecture students in mathematics teaching.
(b)
Checking whether significant differences exist according to students’ gender in their perception of technical mastery regarding audiovisual resources, computer resources and the Internet.
(c)
Analyzing the extent to which students’ gender influenced their perceptions about MR as a training tool that could be used to teach architecture mathematics.
(d)
Verifying whether the degree of technological acceptance depends on the technical mastery expressed regarding audiovisual resources, computer resources and the Internet.

2.2. Information Collection Tools

The instrument used to gather information consisted of two parts: one meant to analyze the degree of acceptance that technology aroused amongst students; and another one that enabled students to evaluate the objects in MR with which they interacted.
In order to examine the degree of acceptance of MR, a decision was made to utilize the tool devised by Davis [28]—“Technology Acceptance Model”—TAM—which collects information from five dimensions: perceived usefulness (PU); perceived ease of use (PEU); perceived enjoyment (PE); attitude towards its use (AU); and intention to use it (IU). The theory about the degree of acceptance of a technology suggests that the potential predisposition for the use of any technology largely depends on the attitude towards it, which is in turn determined by the “perceived ease of use,” the “perceived usefulness” and the “perceived enjoyment” (Figure 1). The instrument included 14 Likert-type items (4 for PU, 3 for PEU, 3 for PE, 2 for AU, and 2 for IU), with seven response options ranging from “Extremely unlikely/I disagree” (1) to “Extremely likely/I agree” (7). The TAM model appeared to be quite consolidated in its application to AR when it was analyzed using the Structural Equation Model [29].
These variables may be simultaneously influenced by a series of external predictor variables, amongst which usually appear: type of user, gender, age, experience in the utilization of technology, level of education, professional qualification, or personal proneness towards innovation [30,31,32].
The Technology Acceptance Model has proved effective to ascertain people’s attitudes towards specific technologies, such as the future intention to utilize it, and has been applied to a variety of technologies: Augmented Reality [33,34], mobile devices used for online training [35], b-learning [36], engineering [37] or virtual training platforms [38].
The following predictor variables were identified for our research: gender; students’ perception about the quality of the MR object; and students’ perception about the technical mastery of audiovisual, computer and internet resources. This allowed us to build the model shown in Figure 2 below.
This model enabled us to pose the following hypotheses for their statistical contrast:
H1-H2-H3: The technical mastery of computers that the student claims to have impacts positively on the perception of success in relation to the use of MR, on the perceived self-efficacy regarding MR utilization, and on the perception of MR’s ease of use.
H4-H5-H6: The technical mastery of audiovisual resources that the student claims to have impacts positively on the perception of success in relation to the use of MR, on the perceived self-efficacy regarding MR utilization, and on the perception of MR’s ease of use.
H7-H8-H9: The technical mastery of the Internet that the student claims to have impacts positively on the perception of success in relation to the use of MR, on the perceived self-efficacy regarding MR utilization, and on the perception of MR’s ease of use.
H10-H11-H12: The quality of the system produced in MR has a positive effect on the perception of success in relation to the use of MR, on the perceived self-efficacy regarding MR utilization, and on the perception of MR’s ease of use.
H13-H14-H15: The student’s gender has a positive effect on the perception of success in relation to the use of MR, on the perceived self-efficacy regarding MR utilization, and on the perception of MR’s ease of use.
H16: The student’s perceived self-efficacy with regard to MR has a positive effect on the perception of success in relation to the use of MR.
H17: The student’s perceived self-efficacy with regard to MR has a positive effect on the perception of MR’s ease of use.
H18: The student’s perception about MR’s ease of use has a positive effect on the perception of success in relation to the use of MR.
H19: The student’s perceived self-efficacy with regard to MR has a positive effect on the attitude towards MR utilization.
H20: The student’s perception about MR’s ease of use has a positive effect on the attitude towards MR utilization.
H21: The attitude towards MR utilization has a positive effect on the intention to use MR.
H22: The student’s perception of success with MR has a positive effect on the intention to use MR and on the attitude towards MR utilization.
H23: The student’s perception about MR’s ease of use has a positive effect on the intention to use MR.
As for the way to evaluate the objects produced in MR, a decision was made to resort to a method already used to assess learning objects in an AR format [13,39,40]. With a Likert-type structure, it was made up of 11 items with six response options going from “Very positive/I strongly agree” [6] to “Very negative/I strongly disagree” (MN-1), which sought to collect information about two dimensions: technical and aesthetic aspects of the object produced in AR and VR (4 items); and user-friendliness (7 items).
The reliability index was obtained for both tools using Cronbach’s Alpha, a procedure recommended for such instruments by O’Dwyer & Bernauer [41], reaching the values of 0.912 for that of TAM, and 0.943 for the one utilized to evaluate the objects. These values suggest high reliability levels in both tools.

2.3. The Sample

The work was developed with 44 students (23 males—52.27% and 21 females—47.73%) enrolled in the subject “Mathematical Foundations for Architecture,” belonging to the first year of the Degree in Architecture taught at the “Escuela Técnica Superior de Arquitectura (Higher Technical School of Architecture)” at the University of Seville.
Table 2 shows the mean values and the standard deviations reached by learners, according to their gender, in the different technical mastery areas with respect to which they were asked to assign themselves a score.
Note that the sample used in our research was non-probabilistic and of a convenience or causal nature [42], and relies on easy access by researchers to the subjects who took part in the study.

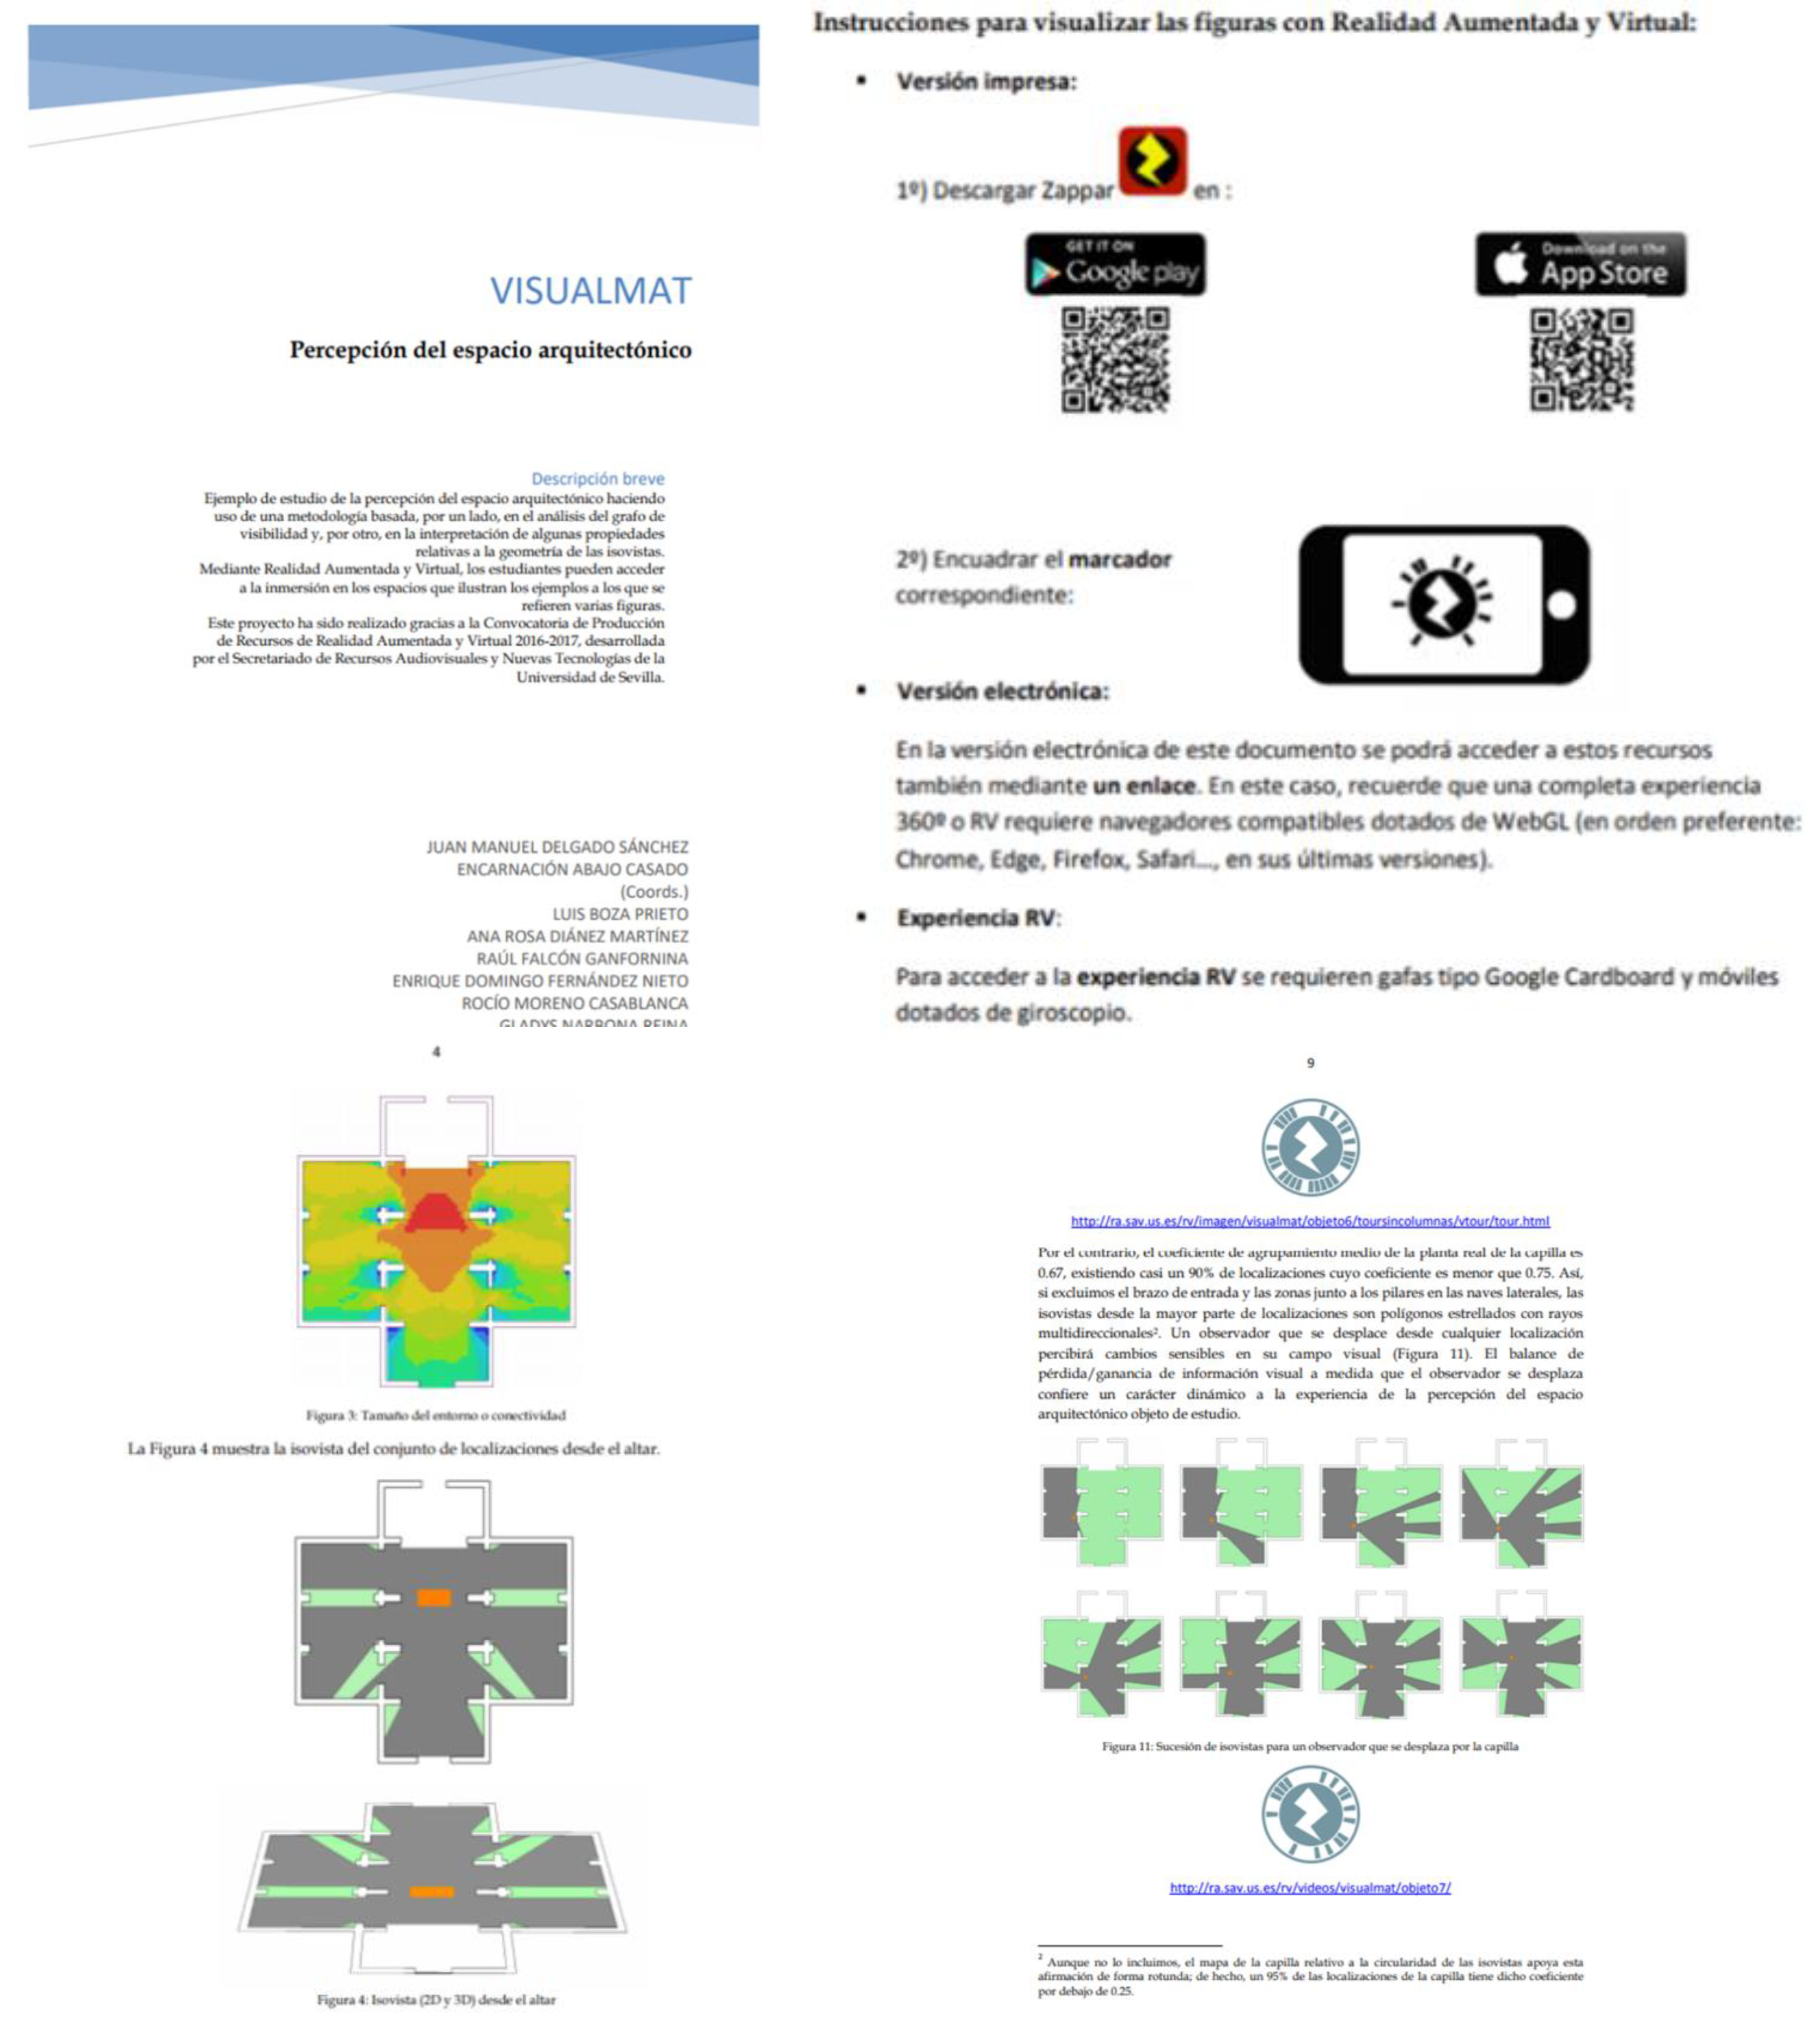
2.4. The Material Produced

The material produced in MR is called “Visualmat. Percepción del Espacio arquitectónico” (Visualmat. Perception of Architectural Space) and addresses how architectural space is perceived through a methodology based on analyzing the visibility graph and on interpreting some relative properties associated with the geometry of isovists. By means of MR, we intend students to be able to access the spaces illustrating the examples to which several figures refer. The building selected is the Chapel of the University of Seville, since the simplicity of its ground plan makes it possible to easily describe some of the indicators explained.
The analysis of ground plan visibility begins from the point of view of a visitor entering the temple. The visibility graph is carried out using 3750 uniformly distributed locations (Figure 3).
The material produced incorporates AR and VR objects (Figure 4).
Attached to the material, we prepared a guide for students in which they were provided with explanations of the goals sought with the object produced in MR, the instructions to visualize figures with AR and VR, and descriptive information about the project (Figure 5). Both the guide and the object’s characteristics can be found on—and downloaded from—the following web address http://ra.sav.us.es/index.php?option=com_content&view=article&id=156:visualmat&catid=27&Itemid=123, accessed on 30 July 2021.
The software programs listed in Table 3 were utilized for its production.
An experimental session was carried out with that material that consisted of different parts: description and presentation of the material for students, specification of the sites from where they had to download the corresponding app together with the instructions for use, description of the educational purposes sought with the object devised, interactions of students with the object, and completion of the evaluation instruments utilized.

3. Results Achieved

Here we show the mean scores and standard deviations obtained with both tools, starting with those reached with the TAM instrument. So that a correct interpretation is made, readers must bear in mind that the answer scale ranged between 1 (extremely unlikely/I disagree) and 7 (extremely likely/I agree). (Table 4).
The analysis of the preceding table allows us to focus on two aspects: the degree of acceptance of MR technology can be regarded as very high and additionally quite uniform amongst all students, as shown by the low standard deviation values obtained. The high average value reached in the dimension “intention to use it” (6.64) also deserves to be stressed.
And concerning students’ assessment of the object produced, the means and standard deviations appear in Table 5; in this case, the scale provided for answers went from 1 (Very negative/I strongly disagree) to 6 (very positive/I strongly agree).
Once again, the average scores achieved, both in the tool total (5.20) and in its different items, suggest a good assessment of the object, not only in technical terms (5.18) but also regarding its user-friendliness (5.21).
After showing the means and standard deviations, we will now go on to contrast the various hypotheses, the first ones being those that are formulated as follows:
Null hypothesis (H0): No significant differences exist between students’ gender and their technical mastery regarding audiovisual, computer and Internet resources with a 0.05 alpha risk of being wrong.
Alternative hypothesis (H1): Significant differences do exist between students’ gender and their technical mastery regarding audiovisual, computer and Internet resources with a 0.05 alpha risk of being wrong.
For this purpose, we will use Student’s statistical test for independent samples, although Levene’s test will be initially applied to analyze variance equality. Table 6 shows the t-values reached and their significance for 42 degrees of freedom.
The values obtained do not permit us to reject any of the null hypotheses posed with a p ≤ 0.05 alpha risk of being wrong, which consequently leads us to conclude that no differences exist between students depending on gender when it comes to their technical mastery either of audiovisual means or of computer and internet resources.
The next step will consist in examining the hypotheses formulated where some of the variables collected in the TAM come into play. With this aim, attention will be firstly paid to H13-H14-H15, destined to ascertain whether students’ gender has a positive impact on the perception of success in relation to the use of MR, on the perceived self-efficacy regarding MR utilization, and on the perception of MR in terms of its ease of use. To that end, H0 will refer to the non-existence of differences at p ≤ 0.05, applying Student’s t for independent samples once again, and reaching the values collected in Table 7. Note that we apply Levene’s test once more, even though the resulting t-values and the significance level are already going to be shown here.
Once again, it becomes necessary to point out that none of the null hypotheses posed at a p ≤ 0.05 level are rejected and, therefore, that students’ gender determines the perceived usefulness, the perceived ease of use and the perceived enjoyment of MR.
The time now comes to examine the other hypotheses formulated. Note that, in this case, Pearson’s correlation will serve to establish the independence or relationship between two variables and the intensity of such relationship. Its application resulted in the values contained in Table 8.
The values attained allow us to draw a number of conclusions:
Students’ perception about their technical mastery of audiovisual, computer and internet resources positively and significantly affects the perceived usefulness of MR.
The quality of the system produced in MR has a positive effect on the perceived enjoyment of MR, on its perceived ease of use, and on the perception regarding MR’s usefulness.
The perceived enjoyment of MR positively and significantly affects the perceived ease of use, the perceived usefulness, and the attitude towards the utilization of the system in MR.
The perceived ease of use associated with MR positively and significantly affects the perceived usefulness and the attitude towards the utilization of the system in MR.
The perceived usefulness of MR positively and significantly influences the attitude towards the utilization of the system in MR.
The intention to use MR positively and significantly affects the perceived enjoyment, the perceived usefulness, and the attitude towards the utilization of the system in MR.
The need simultaneously arises to highlight three aspects: the relationships found were all significant at p ≤ 0.01; thus, when one of the related variables increases, so does the other in the same direction, and when one decreases, the other does too; relationships can be considered moderate or high since correlations between 0.41 and 0.70 can be regarded as moderate, whereas those between 0.71 and 0.90 are seen as high.
We finally attempted to check whether relationships existed between the perception that students had about the technical mastery of the various resources (Table 9).
The results obtained provide significant relationships—and with a moderate trend—between the different technological mastery areas; students subsequently showed a digital competence trend in the various audiovisual, computer and internet resources.

4. Discussions

Our findings suggest that MR can be incorporated into university teaching; remember that the experience was carried out within a real classroom environment, and in our specific case, focused on the teaching of mathematics within architecture studies. This becomes visible through two highly significant features: the degree of acceptance aroused by technology amongst students; and the positive assessment made. With regard to this, the results follow along the lines of those that have been found lately with this type of “reality” [13,39,40,43], although it is true that we have obtained more with objects in AR format. As specific examples, we can mention [44], who have worked in FI-AR Learning, a web platform for the development of educational contents in AR. In the case of [45], they have created an AR prototype known as Master of Time meant to help first-year architecture students learn the main principles of landscape. Similarly, [46] implemented a mobile application with AR technology called NitLabEduca for the study of the spinal cord using an interactive exploration of rotating 3D models.
In regard to contributions referred to MR utilization in higher education, our study complements previous research works on that field. Thus, by way of example, [47] worked with learning material on solar panels for engineering and came to the conclusion that “some benefits can be gained from using Virtual and Mixed Realities for education” (p. 795). Our findings likewise suggest that MR can enrich learning—among architecture students in this case. The level of satisfaction shown by learners is considered an important aspect, as pointed out by [47]. Thus, the results derived from our study revealed a high degree of satisfaction when it comes to MR use. All of this reinforces similar previous findings related to satisfaction with MR-based methodologies as a means to improve learning. An example thereof is the investigation undertaken by [48], who designed MR learning experiences in clinical practical training as a complement to theoretical training. Likewise, [49] proposed an original hands-free interaction method through multimodal gestures supported on deep learning in MR environments.
At the same time, the results obtained ensure not only the way in which the object “Visualmat” was produced but also how the objects combined in AR and VR; furthermore, the experience suggests the need to prepare a guide that can help students, immerse them in the educational experience and facilitate their interaction with technology. Therefore, the production of technology does not suffice, a use-and-guidance handbook is required too; this conclusion has also been confirmed by other works, including the research study authored by [50]. They compared an AR-based teaching-learning process guided by videos and written explanations with an unguided one. The average values were better in the measurements made within the group of guided users.
However, the interest awakened should not lead us to forget some aspects such as the need to have not only classrooms with advanced technology available in university centers so that technology can be easily incorporated but also production centers able to build materials adapted to students’ curricular needs; likewise, the need exists for training and an economic investment with the aim of guaranteeing success when implementing technology in classrooms [51]. As for the devices required for its observation, some are familiar to university students, e.g., tablets and Smartphones [52]. Concerning goggles, we will soon witness the appearance of new more affordable devices in the market, and without the need to incorporate mobile devices, since observation will take place via Bluetooth.
Moreover, as it also happened in other works [29], the technology acceptance model designed by Davis [28] has proved effective in knowing the degree of acceptance of MR technology, and provided a reference to know the future intention to use any technology. Our work supports other previous studies where the TAM model proved effective to assess technological acceptance in addition to comparing results by gender [53], to measure the level of personalization perceived [35] or the intention [54]. It is additionally worth highlighting the proposal made by [55] from their study based on an empirical methodology referred to as the so-called “technological niche”. This makes it possible to introduce the digital technology perspective, alongside other no less important issues such as sustainability or Industry 4.0.
The two diagnostic tools utilized showed high levels of reliability, which was in tune with the findings of other studies [13,43,56,57]. It is also worth highlighting that their simplicity and the ease with which they can be administered facilitates their incorporation into experimental sessions focused on the use and validation of MR objects.
This work has attested to the disappearance of the digital divide between men and women; gender is no longer a significant variable when it comes to explaining differences in the use of technologies and the interaction with them [58,59,60,61]. We need to highlight in this regard the concurrence with [62], where the scores of men and women revealed that the experience implemented—with a guidance aim, in this case—did not differ to a great extent between genders.

5. Conclusions

The impact of this article includes an empirical inquiry into the pedagogical advantages brought by MR within the university context. More precisely, this resource was applied to the mathematical training linked to architecture, which served to investigate the acceptance of this digital technology by students. Since this resource is not easily available or accessible in the market, few research works have been dedicated to it so far. This circumstance increases the interest of our research because we are dealing with new technologies whose educational use is bound to become widespread in the coming years [54].
The results obtained suggest that MR, as well as AR and VR—which combine in it—are suitable and motivating technologies for learning, which permits promotion of new methodological possibilities. Moreover, the applications of these technologies may also adapt to a variety of teaching modes, both face-to-face and non-face-to-face ones [63]. This proposal turns out to be interesting in the latter case, especially in situations like the current one where the pandemic provoked by Covid-19 prevents normal development of face-to-face education. The utilization of MR can become a powerful resource for online teaching, since it provides a way to break the rigid separation between the physical and virtual spheres. The generation of new hybrid learning environments undoubtedly arises as an inspiring element to shape more practical, immersive and active approaches to teaching and learning. In short, MR will most probably favor the emergence of new learning methods that can enable us to define twenty-first-century education.
Our last reflections will focus on possible lines of research for the future, amongst which stand out: systematic reviews [64,65], replicating the research work with other students enrolled in architecture studies, even from other universities, complementing the information collection tools with a test to analyze academic performance, as well as the significance of learning styles for the interaction with the object produced in MR, and extending the production of objects to other areas of knowledge.

Author Contributions

The authors J.C.-A., J.B.-O. and R.M.-R. contributed equally. All authors have read and agreed to the published version of the manuscript.

Funding

This project was carried out thanks to the 2016-17 Call for the Production of Augmented and Virtual Reality Resources, developed by the Secretariat for Audiovisual Resources and New Technologies of the University of Seville and EDU2DIGITAL (2021) of the University of Alicante.

Institutional Review Board Statement

This study did not require ethical approval.

Informed Consent Statement

Informed consent was obtained from all subjects involved in the study.

Data Availability Statement

The data presented in this study are available on request from the corresponding author. The data are not publicly available due to restrictions of privacy.

Conflicts of Interest

The authors declare no conflict of interest.

References

  1. Barroso-Osuna, J.; Gutiérrez-Castillo, J.J.; Llorente-Cejudo, M.D.C.; Valencia Ortiz, R. Difficulties in the Incorporation of Augmented Reality in University Education: Visions from the Experts. J. New Approaches Educ. Res. 2019, 8, 126–141. [Google Scholar] [CrossRef]
  2. Cabero, J.; Puentes, A. La realidad Aumentada: Tecnología emergente para la sociedad del aprendizaje. Aula. Rev. De Humanid. Y Cienc. Soc. 2020, 66, 137–158. [Google Scholar]
  3. Johnson, L.; Adams, S. NMC Horizon Report: 2016 Higher Education Edition; The New Media Consortium: Austin, TX, USA, 2016. [Google Scholar]
  4. Tecnológico de Monterrey. EduTrends. Realidad Aumentada y Virtual; Tecnológico de Monterrey: Monterrey, Mexico, 2017. [Google Scholar]
  5. Flores, J.; Camarena, P.; Avalos, E. La Realidad Virtual una Tecnología Innovadora Aplicable al Proceso de Enseñanza de los Estudiantes de Ingeniería. Apertura. Rev. De Innovación Educ. 2014, 6. Available online: http://www.udgvirtual.udg.mx/apertura/index.php/apertura/article/view/547/369 (accessed on 18 June 2021).
  6. Hsu, Y.; Lin, Y.; Yang, B. Impact of augmented reality lessons on students’ STEM interest. Res. Pract. Technol. Enhanc. Learn. 2017, 12, 1–14. [Google Scholar] [CrossRef] [PubMed] [Green Version]
  7. Cabero-Almenara, J.; Barroso-Osuna, J.; Llorente-Cejudo, C.; Fernández, M.M. Educational Uses of Augmented Reality (AR): Experiences in Educational Science. Sustainability 2019, 11, 4990. [Google Scholar] [CrossRef] [Green Version]
  8. Borrel, A.; Fourches, D. RealityConvert: A tool for preparing 3D models of biochemical structures for augmented and virtual reality. Bioinformatics 2017, 33, 3816–3818. [Google Scholar] [CrossRef]
  9. Fracchia, C.; Alonso, A.; Martins, A. Realidad Aumentada aplicada a la enseñanza de Ciencias Naturales. Rev. Iberoam. De Educ. En Tecnol. Y Tecnol. En Educ. 2015, 16, 7–15. [Google Scholar]
  10. Nasharuddin, N.A.; Khalid, N.A.; Hussin, M. InCell VR: A Virtual Reality-based Application on Human Cell Division for Mobile Learning. Int. J. Interact. Mob. Technol. 2021, 15, 55–71. Available online: https://www.online-journals.org/index.php/i-jim/article/view/18049 (accessed on 18 June 2021). [CrossRef]
  11. Carbonell, C.; Bermejo, L. Landscape interpretation with augmented reality and maps to improve spatial orientation skill. J. Geogr. High. Educ. 2019, 41, 119–133. [Google Scholar] [CrossRef]
  12. Huang, T.K.; Yang, C.H.; Hsieh, Y.H.; Wang, J.C.; Hung, C.C. Augmented reality (AR) and virtual reality (VR) applied in dentistry. Kaohsiung J. Med Sci. 2018, 34, 243–248. [Google Scholar] [CrossRef]
  13. Barroso, J.; Cabero, J. Evaluación de objetos de aprendizaje en Realidad Aumentada: Estudio piloto en el Grado de Medicina. Enseñanza Teach. 2016, 34, 149–167. [Google Scholar] [CrossRef] [Green Version]
  14. Cabero-Almenara, J.; Roig-Vila, R. The Motivation of Technological Scenarios in Augmented Reality (AR): Results of Different Experiments. Appl. Sci. 2019, 9, 2907. [Google Scholar] [CrossRef] [Green Version]
  15. López Belmonte, J.; Pozo Sánchez, S.; López Belmonte, G. La eficacia de la Realidad Aumentada en las aulas de Infantil: Un estudio del aprendizaje de SVB y RCP en discentes de 5 años. Píxel-Bit. Rev. De Medios Y Educ. 2019, 55, 157–178. [Google Scholar] [CrossRef]
  16. Soltani, P.; Morice, A.H.P. Augmented reality tools for sports education and training. Comput. Educ. 2020, 155, 103923. [Google Scholar] [CrossRef]
  17. George, C.E. Percepción de estudiantes de bachillerato sobre el uso de Metaverse en experiencias de aprendizaje de realidad aumentada en matemáticas. Píxel-Bit. Rev. De Medios Y Educ. 2020, 58, 143–159. [Google Scholar] [CrossRef]
  18. Del Río, L.; Sanz, C.; Búcari, N. Incidence of a hypermedia educational material on the Teaching and Learning of Mathematics. J. New Approaches Educ. Res. 2019, 8, 50–57. [Google Scholar] [CrossRef]
  19. Poot, A.; Martin-Gonzalez, A.; Menendez-Dominguez, V.; Espinosa-Romero, A. Aprendizaje de Vectores Euclidianos utilizando un Sistema de Realidad Aumentada. Res. Comput. Sci. 2015, 89, 9–16. [Google Scholar] [CrossRef]
  20. Buitrago-Pulido, R.D. Incidencia de la realidad aumentada sobre el estilo cognitivo: Caso para el estudio de las matemáticas. Educ. Y Educ. 2015, 18, 27–41. [Google Scholar] [CrossRef] [Green Version]
  21. Marinakis, A.; Mania, K.; Antoniadis, A. Augmented reality for cad-cam training featuring 3d interactive geometric transformations. Comput. -Aided Des. Appl. 2021, 18, 561–570. [Google Scholar] [CrossRef]
  22. Roca-González, C.; Martin-Gutiérrez, J.; García-Domínguez, M.; Mato, M.C. Virtual Technologies to Develop Visual-Spatial Ability in Engineering Students. EURASIA J. Math. Sci. Technol. Educ. 2017, 13, 441–468. [Google Scholar] [CrossRef]
  23. Del Cerro Velázquez, F.; Morales Méndez, G. Application in Augmented Reality for Learning Mathematical Functions: A Study for the Development of Spatial Intelligence in Secondary Education Students. Mathematics 2021, 9, 369. [Google Scholar] [CrossRef]
  24. Hwang, W.; Hu, S. Analysis of peer learning behaviors using multiple representations in virtual reality and their impacts on geometry problem solving. Comput. Educ. 2013, 62, 308–319. [Google Scholar] [CrossRef]
  25. García-Tudela, P.; Prendes-Espinosa, M.; Solano-Fernández, I. Smart Learning Environments and Ergonomics: An Approach to the State of the Question. J. New Approaches Educ. Res. 2020, 9, 245–258. [Google Scholar] [CrossRef]
  26. Sánchez-López, I.; Pérez-Rodríguez, A.; Fandos-Igado, M. Com-educational Platforms: Creativity and Community for Learning. J. New Approaches Educ. Res. 2019, 8, 214–226. [Google Scholar] [CrossRef]
  27. Brown, J.; Ortiz-Padilla, M.; Soto-Varela, R. Does Mathematical Anxiety Differ Cross-Culturally? J. New Approaches Educ. Res. 2020, 9, 126–136. [Google Scholar] [CrossRef]
  28. Davis, F.D. Perceived usefulness, perceived ease of use, and user acceptance of information technology. MIS Q. 1989, 13, 319–340. [Google Scholar] [CrossRef] [Green Version]
  29. Cabero, J.; Pérez, J.L. Validación del modelo TAM de adopción de la Realidad Aumentada mediante ecuaciones estructurales. Estud. Sobre Educ. 2018, 34, 129–153. [Google Scholar] [CrossRef] [Green Version]
  30. Teo, T.; Noyes, J. An assessment of the influence of perceived enjoyment and attitude on the intention to use technology among pre-service teachers: A structural equation modeling approach. Comput. Educ. 2011, 57, 1645–1653. [Google Scholar] [CrossRef]
  31. Hsiao, C.H.; Yang, C. The intellectual development of the technology acceptance model: A co-citation analysis. Int. J. Inf. Manag. 2011, 31, 128–136. [Google Scholar] [CrossRef]
  32. Gallego, O.; Cabero, J.; Sampedro, B. Valoraciones de la “Aceptación de la Tecnología de Formación Virtual” por profesores universitarios asistentes a un curso de formación virtual. Edutec. Rev. Electrónica De Tecnol. Educ. 2016, 56, a335. [Google Scholar] [CrossRef] [Green Version]
  33. Fernández, B. La utilización de objetos de aprendizaje de realidad aumentada en la enseñanza universitaria de educación primaria. Int. J. Educ. Res. Innov. 2017, 9, 90–104. [Google Scholar]
  34. Yáñez-Luna, J.C.; Arias-Oliva, M. M-learning: Aceptación tecnológica de dispositivos móviles en la formación online. Tecnología, Cienc. Y Educ. 2018, 10, 13–34. [Google Scholar] [CrossRef]
  35. Papakostas, C.; Troussas, C.; Krouska, A.; Sgouropoulou, C. Measuring User Experience, Usability and Interactivity of a Personalized Mobile Augmented Reality Training System. Sensors 2021, 21, 3888. [Google Scholar] [CrossRef] [PubMed]
  36. Cabero, J.; Marín, V. Blended Learning y Realidad Aumentada: Experiencias de diseño docente. RIED. Rev. Iberoam. De Educ. A Distancia 2018, 21, 33–56. [Google Scholar] [CrossRef] [Green Version]
  37. Álvarez-Marín, A.; Velázquez-Iturbide, J.Á.; Castillo-Vergara, M. Technology Acceptance of an Interactive Augmented Reality App on Resistive Circuits for Engineering Students. Electronics 2021, 10, 1286. [Google Scholar] [CrossRef]
  38. Cabero-Almenara, J.; Arancibia, M.L.; Del Prete, A. Technical and Didactic Knowledge of the Moodle LMS in Higher Education. Beyond Functional Use. J. New Approaches Educ. Res. 2019, 8, 25–33. [Google Scholar] [CrossRef] [Green Version]
  39. Garay, U.; Tejada, E.; Castaño, C. Percepciones del alumnado hacia el aprendizaje mediante objetos educativos enriquecidos con realidad aumentada. Edmetic. Rev. De Educ. Mediática Y TIC 2017, 6, 145–164. [Google Scholar] [CrossRef] [Green Version]
  40. Garay, U.; Tejada, E.; Maiz, I. Valoración de objetos educativos enriquecidos con realidad aumentada: Una experiencia con alumnado de máster universitario. Pixel-Bit. Rev. De Medios Y Educ. 2017, 50, 19–31. [Google Scholar] [CrossRef]
  41. O’Dwyer, L.; Bernauer, J. Quantitative Research for the Qualitative Researcher; Sage: Riverside County, CA, USA, 2014. [Google Scholar]
  42. Baena-Morales, S.; Martinez-Roig, R.; Hernádez-Amorós, M.J. Sustainability and Educational Technology—A Description of the Teaching Self-Concept. Sustainability 2020, 12, 10309. [Google Scholar] [CrossRef]
  43. Kim, K.; Hwang, J.; Zo, H. Understanding users’ continuance intention toward smartphone augmented reality applications. Inf. Dev. 2016, 32, 161–174. [Google Scholar] [CrossRef]
  44. Coma-Tatay, I.; Casas-Yrurzum, S.; Casanova-Salas, P.; Fernández-Marín, M. FI-AR learning: A web-based platform for augmented reality educational content. Multimed. Tools Appl. 2019, 78, 6093–6118. [Google Scholar] [CrossRef]
  45. Kerr, J.; Lawson, G. Augmented Reality in Design Education: Landscape Architecture Studies as AR Experience International. J. Art Des. Educ. 2020, 39, 6–21. [Google Scholar] [CrossRef] [Green Version]
  46. Fernandes, J.; Teles, A.; Teixeira, S. An Augmented Reality-Based Mobile Application Facilitates the Learning about the Spinal Cord. Educ. Sci. 2020, 10, 376. [Google Scholar] [CrossRef]
  47. Allcoat, D.; Hatchard, T.; Azmat, F.; Stansfield, K.; Watson, D.; von Mühlenen, A. Education in the Digital Age: Learning Experience in Virtual and Mixed Realities. J. Educ. Comput. Res. 2021, 59, 795–816. [Google Scholar] [CrossRef]
  48. Rojo, A.; Raya, L.; Sanchez, A. A novel mixed reality solution based on learning environment for sutures in minor surgery. Appl. Sci. 2021, 11, 2335. [Google Scholar] [CrossRef]
  49. Park, K.-B.; Choi, S.H.; Lee, J.Y.; Ghasemi, Y.; Mohammed, M.; Jeong, H. Hands-free human-robot interaction using multimodal gestures and deep learning in wearable mixed reality. IEEE Access 2021, 9, 55448–55464. [Google Scholar] [CrossRef]
  50. Smith, E.; McRae, K.; Semple, G.; Welsh, H.; Evans, D.; Blackwell, P. Enhancing Vocational Training in the Post-COVID Era through Mobile Mixed Reality. Sustainability 2021, 13, 6144. [Google Scholar] [CrossRef]
  51. Cabero, J.; Vázquez-Cano, E.; López-Meneses, E. Uso de la Realidad Aumentada como Recurso Didáctico en la Enseñanza Universitaria. Form. Univ. 2018, 11, 25–34. [Google Scholar] [CrossRef]
  52. Roig-Vila, R.; López Padrón, A.; Urrea-Solano, M. Perfil del uso académico del smartphone entre estudiantes noveles universitarios españoles e iberoamericanos. Am. J. Distance Educ. 2021, 35. [Google Scholar] [CrossRef]
  53. Pal, D.; Patra, S. University Students’ Perception of Video-Based Learning in Times of COVID-19: A TAM/TTF Perspective. Int. J. Hum. Comput. Interact. 2020, 37, 903–921. [Google Scholar] [CrossRef]
  54. Jang, J.; Ko, Y.; Shin, W.S.; Han, I. Augmented Reality and Virtual Reality for Learning: An Examination Using an Extended Technology Acceptance Model. IEEE Access 2021, 9, 6798–6809. [Google Scholar] [CrossRef]
  55. Giganti, P.; Falcone, P.M. Socio-technical transitions and innovation niches: The case of the virtual and augmented reality in Europ. AIMS Energy 2021, 9, 755–774. [Google Scholar] [CrossRef]
  56. Wojciechowski, R.; Cellary, W. Evaluation of learners’ attitude toward learning in ARIES augmented reality environments. Comput. Educ. 2013, 68, 570–585. [Google Scholar] [CrossRef]
  57. Marín-Díaz, V.; López-Perez, M.; Fernández-Robles, B. RAFODIUM: A social nets about augmented reality. Pixel-Bit. Revista Medios Educ. 2020, 59, 225–240. [Google Scholar] [CrossRef]
  58. Lohbeck, A.; Hagenauer, G.; Frenzel, A.C. Teachers’ self-concepts and emotions: Conceptualization and relations. Teach. Teach. Educ. 2018, 70, 111–120. [Google Scholar] [CrossRef]
  59. Marín, V. The augmented reality in the educational sphere of student of degree in chilhood education. Case study. Píxel-Bit. Rev. De Medios Y Educ. 2017, 51, 7–19. [Google Scholar] [CrossRef]
  60. Vázquez-Cano, E.; Meneses, E.L.; García-Garzón, E. Differences in basic digital competences between male and female university students of Social Sciences in Spain. Int. J. Educ. Technol. High. Educ. 2017, 14, 27. [Google Scholar] [CrossRef] [Green Version]
  61. Ríos, J.M.; Gómez, E.; Priscilla, M. Valoración de competencias TIC del profesorado universitario: Un caso en Chile. Pixel-Bit. Rev. De Medios Y Educ. 2018, 52, 55–65. [Google Scholar] [CrossRef]
  62. Munoz-Montoya, F.; Fidalgo, C.; Juan, M.-C.; Mendez-Lopez, M. Memory for Object Location in Augmented Reality: The Role of Gender and the Relationship among Spatial and Anxiety Outcomes. Front. Hum. Neurosci. 2019. [Google Scholar] [CrossRef] [PubMed]
  63. Neffatia, O.S.; Setiawan, R.; Jayanthic, P.; Vanithamani, S.; Sharma, D.K.; Regin, R.; Mani, D.; Sengan, S. An educational tool for enhanced mobile e-Learning for technical higher education using mobile devices for augmented reality. Microprocess. Microsyst. 2021, 83, 104030. [Google Scholar] [CrossRef]
  64. González-Calatayud, V.; Prendes-Espinosa, P.; Roig-Vila, R. Artificial Intelligence for Student Assessment: A Systematic Review. Appl. Sci. 2021, 11, 5467. [Google Scholar] [CrossRef]
  65. Diao, P.-H.; Shih, N.-J. Trends and Research Issues of Augmented Reality Studies in Architectural and Civil Engineering Education—A Review of Academic Journal Publications. Appl. Sci. 2019, 9, 1840. [Google Scholar] [CrossRef] [Green Version]
Figure 1. TAM model developed by Davis [28].
Applsci 11 07125 g001
Figure 2. Model based on the TAM developed by Davis [28] formulated for our research. (Translation: Gender//Quality//Internet technical mastery//Audiovisual technical mastery//Computer technical mastery; Perception about ease of use//Perceived self-efficacy//Perception about success; Attitude by use//Intention to use).
Applsci 11 07125 g002
Figure 3. Isovists in 2D and 3D and real image of the chapel from that area.
Applsci 11 07125 g003
Figure 4. Augmented and Virtual Reality versions of the object: “Visualmat. Percepción del Espacio arquitectónico”.
Applsci 11 07125 g004
Figure 5. Images of the accompanying guide.
Applsci 11 07125 g005
Table 1. Comparison between Augmented Reality (AR), Virtual Reality (VR), Mixed Reality (MR) and the Internet of Things (IoT).
CriterionARVRMRIoT
User’s interaction with natural realityHigh
The real world is an environment in which interaction occurs from the digital information that is added therein.
Low
Users isolate themselves from reality using a device to become immersed in a sensorial universe.
Medium
The real world serves as a stage which projects the Virtual Reality in which the user is immersed by means of a device.
Low
The user is a consumer of the information or performance of by things.
Level of immersion in a digital experienceMedium
It depends on the digital density which is added to reality.
High
It implies a full immersion in a completely digitized parallel reality
High
The real world is replaced by a sensorial experience immersed in a virtual world.
Low
The user performs in a real environment, albeit having the chance to connect with the objects in the cloud.
Emblematic deviceApps in AR-equipped SmartphonesSensorial headphonesLenses which project digital information on a real environmentRefrigerator able to provide information about the expiry date of food or to suggest recipes
Representative enterprise in technology developmentGoogleFacebookMicrosoftCisco
Development stageRight in the middle of an expansive exploration periodIn a readjustment period, after the initial bubbleRight in the middle of an experimental revolutionImmediate commercial boom
Table 2. Means and standard deviations.
Technical Mastery AreaGenderMeanS.D.
Audiovisual resourcesMale7.261.764
Female6.902.095
Computer resourcesMale7.481.855
Female7.001.449
InternetMale8.351.434
Female7.621.717
Table 3. Software programs used to produce the MR object.
AUGMENTED REALITY
SOFTWAREWHAT IT IS USED FOR
ZapparApplication launcher
Sketahfab3D launcher
Android studioJava development environment. Apk export for Android.
AutocardImage design–3D retouching
Google sketah Up3D retouching
Adobe PhotoshopCreation of equirectangular images. Graphics
VIRTUAL REALITY
Sketahfa3D launcher
Google Sketachfa3D launcher
KrpanoMaking reality via a video image website
Google VRMaking reality via a video image website
Table 4. Means and standard deviations obtained with TAM.
MR
ms.d.
(1)
Perceived usefulness (PU)
 1.1. The use of this system could enhance my learning in the classroom. (PU1)6.301.17
 1.2. The use of this system during classes would make it easier for me to understand certain concepts. (PU2).6.650.65
 1.3. I think the system is useful when one is learning. (PU3)6.381.16
 1.4. The use of this system would improve my learning.6.401.14
(2)
Perceive ease of use (PEU)
 2.1. In my opinion, the system is user-friendly. (PEU1)5.231.16
 2.2. Learning to use and operate the system was not a problem for me. (PEU2)5.181.61
 2.3. I found the explanations about how to use and operate the system clear and understandable. (PEU3)5.721.41
(3)
Perceived enjoyment (PE)
 3.1. Utilizing the system was fun for me (PE1)6.820.39
 3.2. I enjoyed myself using the system (PE2)6.580.81
 3.3. In my view, the system allows you to learn while playing. (PE3)6.630.70
(4)
Attitude towards its use (AU)
 4.1. Using the system makes learning become more interesting. (AU1)6.620.55
 4.2. In my opinion, using the system in the classroom is a good idea. (AU2)6.310.89
(5)
Intention to use it (IU)
 5.1. I would like to use these systems in the future if I had the chance. (IU1)6.650.71
 5.2. I would like to use the system to learn both about the topics that were presented to me and about others (IU3).6.630.62
Perceived usefulness (PU)6.431.03
Perceived ease of use (PEU)5.281.39
Perceived enjoyment (PE)6.680.63
Attitude towards use (AU)6.470.72
Intention to use (IU)6.640.72
TAM GLOBAL VALUES6.300.89
Table 5. Means and standard deviations obtained with the tool used to evaluate the object produced.
MR
ms.d.
1. Technical and aesthetic aspects
1.1. The operation of the resource that we have presented to you is:5.200.80
1.2. On the whole, you consider the aesthetics of the resource produced:5.081.02
1.3. In general, you would describe the technical functioning of the resource as:5.140.88
1.4. Broadly speaking, how would you assess the presentation of information on the screen?5.290.95
2. Ease of use
2.1. How would you describe the user-friendliness and handling of the resource that we have presented to you?5.030.94
2.2. How would you describe the extent to which it is easy to understand the technical functioning of the resource that we have presented to you?5.320.91
2.3. How would you assess the overall design of the AR-resource produced?5.061.05
2.4. How would you assess the overall design of the resource that we have presented to you?4.711.37
2.5. How would you assess the flexibility in the utilization of the material that we have presented to you?5.191.06
2.7. Using the resource produced was fun for you:5.960.51
TECHNICAL ASPECTS5.180.91
EASE OF USE5.210.97
TOOL TOTAL5.200.94
Table 6. Student’s t for the gender variable and the technical mastery of different resources.
Technical Mastery AreaLevene’s Test Sig.TSig.
Audiovisual resources1.458234612544
Computer resources1.536222946349
Internet resources1057481.533133
Table 7. Student’s t for the gender variable and the TAM dimensions “Perceived Usefulness,” “Perceived Ease of Use,” and “Perceived enjoyment”.
DimensionTSig.
Perceived usefulness1.4281605
Perceived ease of use0.7924820
Perceived enjoyment0.8993737
Table 8. Pearson’s correlations between different dimensions. (note: ** = significant at 0.01, moderate or high).
Perceived MasteryPerceived Ease of UsePerceived UsefulnessAttitude Towards Use
Audiovisual mastery217019427 **
Computer mastery106006407 **
Internet mastery108015472 **
Quality501 **463 **499 **
Perceived enjoyment 609 **732 **798 **
Perceived ease of use 569 **563 **
Perceived usefulness 721 **
Intention to use it789 ** 673 **792 **
Table 9. Correlations between the different technological mastery areas. (note: ** = significant at 0.01).
COMPUTER R.INTERNET R.
A/V RESOURCES639 **456 **
COMPUTER RESOURCES 574 **
Publisher’s Note: MDPI stays neutral with regard to jurisdictional claims in published maps and institutional affiliations.

