Featured Application
This work is used for the unmanned driving of vehicles.
Abstract
The safety of unmanned ship berthing is of paramount importance. In order to explore the influence of wind and wave coupling, a berthing computational fluid dynamics (CFD) model was established, and the characteristics of speed field, pressure field, and vortex have been obtained under different speed, wind direction, and the quay wall distances. The results show that the total resistance of the hull against the current can be about 1.60 times higher compared to the downstream resistance, water flow resistance is the dominant factor, accounting for more than 80% of the total resistance. When changing the distance between ship and shore at fixed speed, the results found that the torque is small, but the growth rate is very large when driving below 2 m/s, and the torque growth rate is stable above 2 m/s. Based on the established coupling model, a multi-factor berthing safety study is carried out on an actual unmanned ship. The results show that when the speed increases from 4 m/s to 12 m/s, the curve slope is small, the resistance increases from 3666 N to 18,056 N, and the rear slope increases. The pressure increases with the speed, and when the speed is 24 m/s, the maximum pressure is up to 238,869 Pa. When the wind speed is fixed, the vertical force of the unmanned ship increases first and then decreases to zero and then reverses the same law change, and the maximum resistance is about 425 N at the wind angle of about 45 degrees; At 90 degrees, the maximum lateral force on an unmanned boat is about 638 N. The above results can provide control strategy for unmanned ship berthing safety, and provide theoretical basis for unmanned ship route planning and obstacle avoidance, safety design, etc.
1. Introduction
Unmanned ships are widely used in marine exploration and development, island reef resupply, marine environmental monitoring, improving the energy efficiency and environmental performance of ports and terminals [1]. In unmanned ships, miniaturization, intelligent direction of development [2,3], lack of dock dynamic berthing are pursued; Berthing is affected by the shallow water effect, the shore wall effect, as well as by navigation, speed, speed reduction, wind speed, and wind direction, and other factors [4,5,6,7,8]. Automatic berthing is not an easy task because of various factors, such as the non-linearity of the low-speed maneuvering model, danger of collision with the berth, etc. [9]. Unmanned ship movement state is difficult to determine; during movement; berthing maneuverability becomes more difficult, stranding, grounding, collision, and other accidents can occur, and it will be difficult to recover losses. Therefore, research on dynamic berthing require algorithms or unmanned ship positioning, avoidance, and manipulation [10,11].
The reduced speed during the berthing of unmanned ships results in a decrease in maneuvering performance. At present, the main research methods for berthing motion are the empirical formula estimation, the maneuvering test method, the hydrodynamic CFD simulation and the combination of these methods [12,13,14]. A limited number of experimental cases are available in the literature. Consequently, the ability to reliably predict the hull forces (and the related hydrodynamic coefficients) via computational fluid dynamics calculations may represent a significant added value to further tune or to generate new simplified hull forces models to be employed in a maneuvering code [15].
The empirical formula estimation method is limited by the ship type and live ship test data used in the establishment of the database. A manipulative test requires a ship’s towing tank, has high cost, and is subject to the scale effect. The CFD method has gradually become the main means to study the hydrodynamics of ship berthing because of its advantages of low computational cost, short cycle, and high calculation accuracy [16,17,18,19,20]. Unmanned ship movement is affected by many factors, and the method of calculation of unmanned ship wind and wave coupling CFD mainly includes direct simulation, large vortex simulation, and solving the Reynolds average Navier–Stokes (RANS) equation. A CFD numerical simulation of the calculation error and uncertainty was carried out by Stern and others [21]. Some researchers have also verified and confirmed the calculation method of the ship’s viscous flow [22,23,24,25]. A systematic application of the open-source viscous-based flow solver OpenFOAM to predict forces at low-speed maneuvering conditions for two ship test cases (the Korea container ship (KCS)) and the (Korea very large crude carrier (KVLCC)) was presented [15]. In the study of berthing hydrodynamics of large ships, Li Hongyang and others adopted the CFD method to study the safety of ships with flowing berths in gravity wharves through the standard ship model series 60 approved by the International Towing Tank Conference (ITTC). The berthing process passed the verification of the ship’s towing tank test results [26]. Lao Jun and Cheng Hailiang used the explicit finite non-linear element method and a measurement technology to simulate the collision process between ship berthing and wharf. Based on the maximum stress and fender deformation limit of the component, they obtained a safe berthing of ships with different displacements. The maximum berthing speed provides guidance for the berthing speed control of ships [27]. Li Wenhua, Song Jian, and others, based on the Harris wind speed variation power spectrum and a new type of wind pressure coefficient calculation scheme, at the same time, conducted a wind disturbance simulation through the MATLAB platform, and established mathematics that can quantify wind disturbances at any wind speed and direction in the ocean The model can calculate the disturbance resistance and the torque produced by various ocean winds to the ship [28]. Ma Shaojun simulated the flow field of a ship sailing by solving the RANS equation, studied multiple factors such as the shore distance and the inclination angle of the shore wall effect generated by the ship when the ship sailed along the coast, and determined the shore wall effect in different situations. The torque and the shore suction force provide an operating strategy for ships sailing along the coast [29]. Chen Yuanchao et al. solved the viscous RANS equation to determine the flow field, supplemented by the volume of fluid (VOF) and dynamic grid method for the three aspects of hydrostatic resistance, seakeeping, and maneuverability prediction, and the results showed that the numerical simulation scheme had high accuracy in the prediction of static water resistance of ships at medium and low speeds, but it was not suitable for the prediction of resistance of high-speed navigation. At the same time, a new method was proposed to accurately predict the resistance of high-speed and ultra-high-speed navigation [30]. Liu Renwei established two models of static obstacles and dynamic obstacles based on mathematical models of motion; and quantified the risk of ship collision using these two models. At the same time, the external environmental factors, such as quay wall, wind and water flow, and shallow bottom were also considered. For risk quantification, an automatic collision avoidance model was established, allowing, through simulation, and planning of the best navigation route in specific cases, effective suggestions for ship automatic driving [31]. Hu Yi studied the ship’s motion response under the combined load of wind, wave, and current, and obtained the overall motion response of the liquified natural gas (LNG) ship terminal when mooring [32]. Shao Feng computed the aerodynamic performances and wind drag acting on the ship hull with and without accommodations, then analyzed the obtained CFD results, the interaction between hull and accommodation on aerodynamic performances, and the wind drag acting on the ship [33]. Tao Yihan presented a systematic study comparing results obtained with different computational methods for wave-induced loads and motions of different ship types in regular and random irregular long-crested extremes waves [34].
Wang Meiyun proposed the unmanned aerial vehicle (UAV) motion system based on digital twin technology needs to have the following functions: (1) the actual UAV movement should drive the virtual platform to build the motion trajectory in real time; Commands on virtual UAV also control the movement of actual UAV in real time. (2) UAV can use visual measurement and other perceptive equipment to obtain environmental information parameters in the course of operation, and can transmit this information to the virtual operating platform in real time. (3) UAV can realize the real-time positioning of the UAV and the control of flight attitude, achieve synchronous positioning, and has intelligent obstacle avoidance function, and can display the drone flight attitude and trajectory on the operating interface [35]. Most of the above-mentioned studies focused are aimed at large traditional transport ships and UAV. There are also some scholars who have conducted research on berth allocation and monitoring system of the terminal system [36,37,38,39]. In recent years, our research team has been working on a virtual test technology for USV based on digital twins, the work can be integrated into berth allocation systems of terminal operating systems.
In fact, there are few reports in the literature applying the CFD model to unmanned ship-wind and wave coupling. In this paper, an unmanned ship-wind and wave coupling CFD model is established, and the berthing safety of unmanned ship is studied considering factors such as ship speed and direction, wind speed, and the distance between ship and shore. Based on the established coupling model, a multi-factor berthing safety study is carried out on an actual unmanned ship.
2. Unmanned Ship-Wind and Wave Coupling CFD Model
Based on the three-dimensional CAD model of unmanned ships, the calculation domain was established by reference to the ship berthing literature and the multi-factor influence of unmanned ship berthing. The grid was divided, the boundary was set, and the unmanned ship, wind and wave coupling CFD model was established under the influence of various factors.
2.1. Unmanned Ship Structure and Computational Domain
The 3D CAD model of the unmanned ship is shown in Figure 1, and the parameters are shown in Table 1. In order to consider the influence of multiple factors, such as navigation parameters, water flow, wind, and quay wall effects during the berthing process of the unmanned ship, a berthing model of the unmanned ship was established based on CFD for calculation simulation. In the actual calculation, it was assumed that the hull was relatively stationary, and the speed was determined on the basis of the relative speeds of water and wind; the calculation domain was selected by the method of simulating a numerical tank, with water below the flowing medium and air above. The size of the calculation domain affects the accuracy of the simulation results to a certain extent. If the calculation domain is too small, the flow field area is too small, which will not meet the boundary conditions at infinity, and the water flow will hit the wall early causing a backflow, which will distort the simulation result. The computational domain is shown in Figure 2, the specific size was L 5.15 m × W 1.65 m × H 0.8 m.
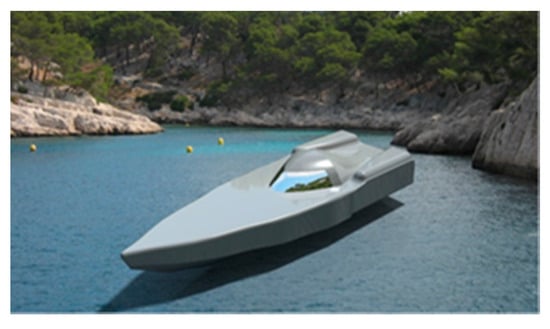
Figure 1.
Unmanned ship structure.

Table 1.
Unmanned ship hull parameter.
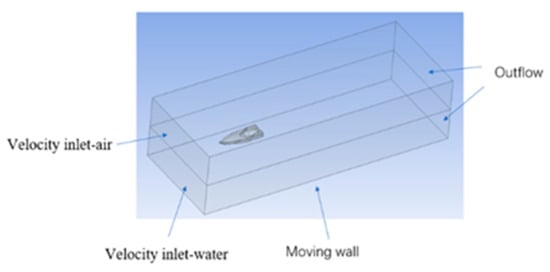
Figure 2.
Schematic diagram of the computational domain.
If the flow field in an infinite space is simulated, it is theoretically closer to the actual situation, but the computational domain expands, and the grid increases accordingly, which will increase the amount of calculations. In practice, when the computational domain expands to a certain extent, the improvement of calculation accuracy is not obvious. When considering the motion of unmanned ships at berth, the speed of the ship is small, and the impact on the surrounding fluid is small. In these conditions, the calculation domain can be reduced appropriately, and the calculation amount can be reduced to improve the calculation efficiency.
2.2. Grid Model
Grid division is a key step in numerical simulation. Factors, such as the size and the number of grids, are important as they affect the convergence and accuracy of the calculation. Therefore, the grid quality should be improved under the premise of meeting the calculation accuracy [29].
Considering the complexity of the surface shape of the unmanned ship, we first used Hypermesh to generate a hybrid surface mesh, with a size of the unit mesh of 2–4 mm. The volume grid was generated by the surface mesh. The initial number of meshes was about 340,000. The total number of grids after mesh refinement was approximately 10.23 million. The mid-section mesh is shown in Figure 3.
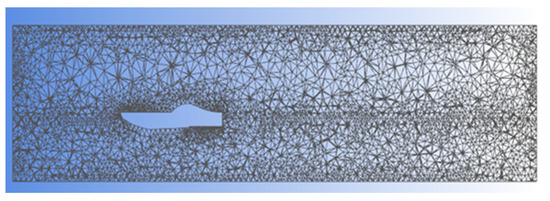
Figure 3.
Mid-section mesh after mesh adaptation.
The surface mesh skewness was less than 0.85, and the volume grid skewness was less than 0.95.
2.3. Governing Equations and Numerical Methods
The process of ship berthing involves the simulation of the two phases of water and air and has to take into account the existence of free liquid surface [31]. The multiphase flow VOF model was used to track the interface on the water surface [34,40]. Because air and water flow cannot dissolve into each other, and an interaction force is established between molecules on the two phases, a surface tension coefficient should be considered. Because the surface tension coefficient has different values at different temperatures, we adopted the tension coefficient at a natural temperature of 15 °C, which is 0.0073.
In calm water conditions (the ship’s eigen wave occurs), the turbulence model adopts the renormalization group (RNG) k-ε model to ensure calculation accuracy. The RNG k-ε model equations are shown below, as Equations (1) and (2) [6].
Gk is the turbulent kinetic energy produced by the laminar flow velocity gradient, Gb is the turbulent kinetic energy produced by buoyancy; Ym is the fluctuation produced by transitional diffusion in compressible turbulence; C1, C2, and C3 are constants; αk and αɛ are the reciprocal of the effective turbulent Prandtl number of turbulent kinetic energy k and dissipation rate ε.
The pressure and velocity coupling of the discrete equations in the steady state adopts the semi-implicit method for pressure linked equations (SIMPLE) algorithm. The second-order upwind equation was used to solve the equations, the face-to-face iteration of time division multiple access (TDMA) and the low relaxation factor were used, and according to the convergence criterion, the remainder had been less than 10−3. The pressure-velocity coupling method in unsteady state adopts the pressure-implicit with splitting of operators (PISO) algorithm [41,42], and the calculation starts after the setting is completed and the flow field is initialized. We set the time step to 0.001 s, and 20 iterations in each time step.
For research under wave conditions, the turbulence model adopts the standard k-ε model. Although this model is not as accurate as the RNG k-ε model, its form is simple, the calculation is convenient, and the accuracy is reasonable. The wave condition is set to the 5th order VOF wave.
2.4. Boundary Conditions and Calculation Scheme
The types of boundary conditions mainly include the velocity inlet (inlet), outlet (outflow), solid wall (wall), water surface (VOF), etc. The established fluid domain, namely the air domain and the water domain, are built in the same module, and there is no need to set the gas–liquid interface [34]. The surface of the ship as a wall and the specific value of the velocity inlet according to different schemes, so that the air velocity was the same as the water flow velocity. The flow outlet is a fully developed flow. We set the hull surface and other outer boundaries as smooth, impenetrable walls with a given roughness. The bottom surface of the water area, due to the relative movement between the riverbed and the hull, it was set as a moving wall, and the other walls were set as non-slip walls.
The speed of unmanned ships is generally low during berthing: under the condition of no wave interference, set up scheme A and B for the simulation, as described below:
Option A: the entrance of the calculation domain was set to be about one time the length of the unmanned ship’s bow, the exit about three times the length of the ship, the port side was three times the width of the quay wall, the starboard side was one time the width of the quay wall, and the upper part was two times the height of the ship. The lower part was twice the height of the ship [18]. We simulated the safety of berthing at a constant speed when the speed is 0.45, 1, 2, 3, 4, 5, and 5.45 m/s.
Option B: On the basis of the previous calculation domain, the distance from the right side of the unmanned ship to the shore wall was adjusted to 0.5 times and 1.5 times the width of the ship, to simulate the safety of the unmanned ship’s homogenous berthing at speeds of 0.45 m/s and 3 m/s, respectively, and the influence of three different quay wall distances on berthing safety was compared.
2.5. Analysis of the Berthing Characteristics of Unmanned Ship
According to the simulation based on the above calculation scheme, the berthing characteristics of unmanned ships were obtained and analyzed. The hull surface was selected to obtain the resistance of the hull in the direction of the flow, and the resistance characteristics of the unmanned ship were analyzed on the basis of speed and quay wall distance.
2.5.1. The Influence of Speed
The law describing the relationship between water or air resistance and speed with regard to an unmanned ship is shown in Figure 4, and the law describing the relationship between viscous resistance or differential pressure resistance and speed is shown in Figure 5.
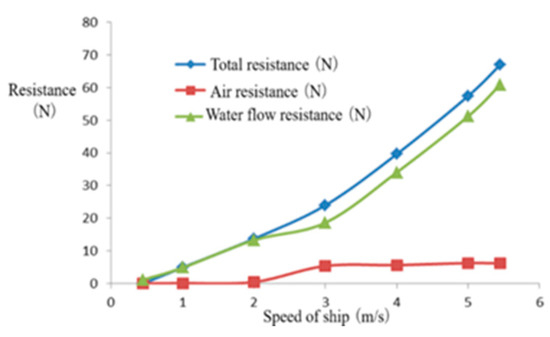
Figure 4.
Relationship between water or air resistance and ship speed.
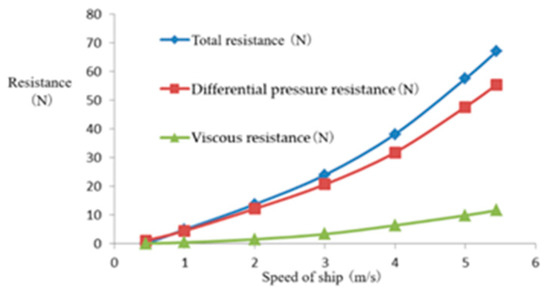
Figure 5.
Relationship between differential pressure or viscous resistance and ship speed.
It can be seen from Figure 4 and Figure 5 that the maximum resistance is 67.05 N and the minimum resistance is 1.16 N. The total resistance was analyzed; and showed a non-linear relationship with the flow velocity. The air resistance kept increasing at a high speed within 0–2 m/s, but the total value was relatively small.
For value above 3 m/s, changes were reduced with the increase in wind speed, and it basically remained between 5 and 6 N. Water flow resistance is the main source of resistance for unmanned ships, accounting for more than 80% of the total resistance, and is related to two factors, i.e., water density and water dynamic viscosity.
It is worth mentioning that the relationship between the resistance and the speed of an unmanned ship navigating on water is not a simple linear relationship, but a non-linear exponential relationship, which may be related to the presence of free liquid surfaces.
2.5.2. The Influence of Quay Wall Distance
Numerical simulations were carried out for different quay wall distances at speeds of 0.45 m/s and 3 m/s, and the rule of bow torque and lateral force varying with quay wall distance was recorded, as shown in Table 2 and Table 3:
Table 2.
Law of ship hull force changing with quay distance when the speed is 0.45 m/s.
Table 3.
Law of ship hull force changing with quay distance when the speed is 3 m/s.
As can be seen from Table 2 and Table 3, the lateral force on the hull changed direction during the berthing process. The reason for this phenomenon is that the bow of the unmanned ship is driven by shore thrust away from the quay wall when the unmanned ship is sailing along the coast, and the shore suction of the mid-ship is caused by the difference in flow velocity on both sides of the ship. Therefore, an offset occurs.
3. Multi-Factor Berthing Safety Study on an Actual Unmanned Ship
Based on the established coupling model, a multi-factor berthing safety study is carried out on an actual unmanned ship.
3.1. Coupling CFD Model of Actual Unmanned Ship
3.1.1. CAD Model and Computational Domain
It is designed to have a draft of 530 mm and a speed of 40 nautical miles per hour, or about 20.58 m/s. The 3D CAD model (L 7.47 m × W 2.72 m × H 1.55 m) and computational domain (L 52.47 m × W 19.03 m × H 10.86 m) of the unmanned ship as shown in Figure 6 and Figure 7, respectively.
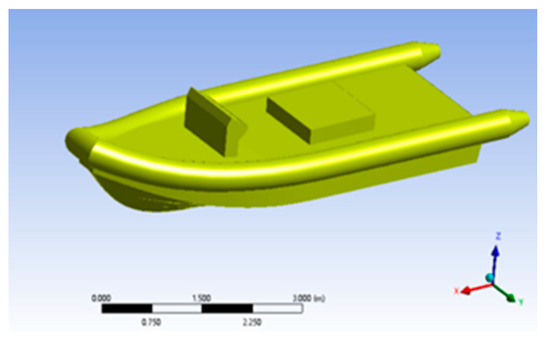
Figure 6.
CAD model of the unmanned ship.
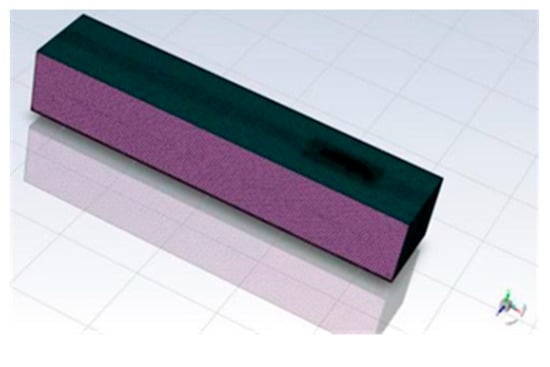
Figure 7.
Computational domain and grids.
The distance from the front of the ship is about 1 times ship length, the distance from the exit surface is about 5 times ship length, the distance between the left and right sides to the left and right boundaries of the calculation domain is 3 times ship width, and the distance between the upper and lower boundaries from the horizontal side is 3 times ship height [43].
3.1.2. Grid Independent Verification
In order to ensure the accuracy and reliability of the calculation results, through the control of the size of the grid unit, three sets of different grid number of grid schemes, take unmanned ship navigation speed of 4 m/s, water depth for the design conditions of 0.53 m, in the case of precise control variables to calculate the absolute value of the size of the resistance of unmanned ships, as shown in Table 4.
Table 4.
Resistance under different grid schemes.
The largest difference between the resistance of schemes 1 and 3 is 4.42%, within a reasonable range. After considering the selection of scheme 1 for subsequent calculations.
3.2. Analysis of the Berthing Characteristics of Actual Unmanned Ship
An unmanned ship-wind and wave coupling CFD model is established, and the berthing safety of unmanned ship is studied considering factors such as ship speed and wind direction.
3.2.1. Flow Characteristic Analysis
The initial waterline of the unmanned ship is 0.53 m below deck, and the speed distribution and air–water volume fraction at different speeds are obtained by simulation, as shown in Figure 8.
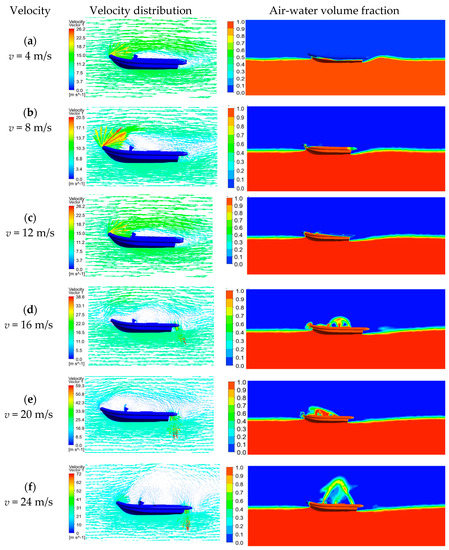
Figure 8.
The fluid velocity distribution and air-water volume fraction at different speed.
As can be seen from Figure 8, color and length represent the flow speed here, the more the color is biased to red, the longer the length indicates the greater the speed, the direction of the vector arrow represents the flow direction of the flow field media here. The water flows smoothly in the front of the unmanned ship, and waves are generated at the stern. The water level near the stern is low. Far from the stern, the water level first rises and then drops, and finally stabilizes. This is because the process of unmanned ships sailing on the water will increase the pressure of the unmanned ship’s bottom water. The high-pressure water will flow to the low-pressure area when passing through the surface of the unmanned ship. Therefore, the wake part of the unmanned ship will be a part of the water flow that is raised. At the same time, while moving, the unmanned ship will create a certain degree of vacuum at the tail, and the pressure value will be relatively small in a small area close to the tail. Since the viscosity of water is much greater than that of air, the tail part of the unmanned ship will be occupied by air first, and the wake of the unmanned ship will be convex. When the speed is less than or equal to 12 m/s, the speed of the first part of the ship increases as the air bypasses the surface of the circular fence, and the air flow rate on the deck becomes smaller and a vortex is formed due to the influence of structures such as the console on the deck. When the speed is too high, there will be fluctuations, causing changes in pressure and viscosity. When the speed is greater than 16 m/s, a vortex is formed on the surface of the tail of an unmanned ship, where the pressure is small and the speed is greater, such as at 20 m/s, the maximum speed at the tail vortex is 59.3 m/s. This will seriously affect the berthing safety of unmanned ship.
3.2.2. Pressure Characteristic Analysis
The pressure characteristics at different speeds obtained are shown in Figure 9.
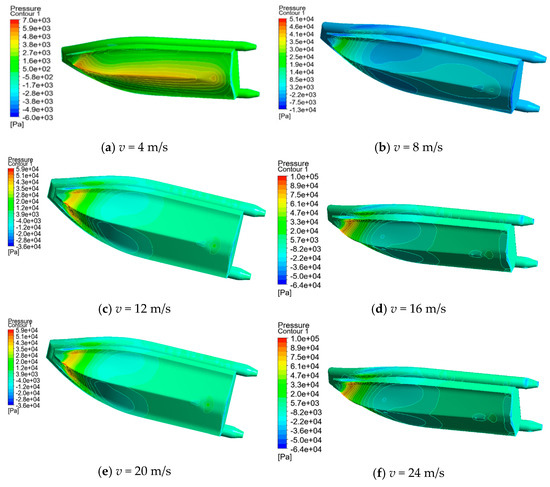
Figure 9.
The bottom pressure characteristics of the unmanned ship at different speeds.
As can be seen from Figure 9, the bow part of the unmanned ship when sailing is positive pressure, the tail of the unmanned ship will form a negative pressure zone, and with the increase in speed, its absolute value is increasing rapidly, such as when the speed is 4 m/s, the maximum pressure at the first of the unmanned ship is 6874 N, when the speed is 24 m/s, the maximum pressure can reach 238,869 Pa, and the pressure at the bow of the ship and the pressure difference between the middle part of the ship is also increasing. As can be seen from Bernoulli’s principle, different flow rates can lead to different pressures, and where water flows faster, unmanned ships are less under pressure. The front and rear parts of the unmanned ship are subjected to a large pressure, which can be reinforced in the process of the design of the unmanned ship structure, and improve the pressure resistance of the unmanned ship. At the same time, the low pressure at the tail will cause fluid back-flow, so the fluid velocity near the tail will be slow. Depending on the ship type, the water and air flowing in the Y direction will partly acquire lateral velocity when they hit the wall of the unmanned ship.
3.2.3. Analysis of Wind Resistance Characteristics
The wind characteristics of 0, 45, 90, and 180 degrees at wind speeds of 20 m/s are simulated as shown in Figure 10.
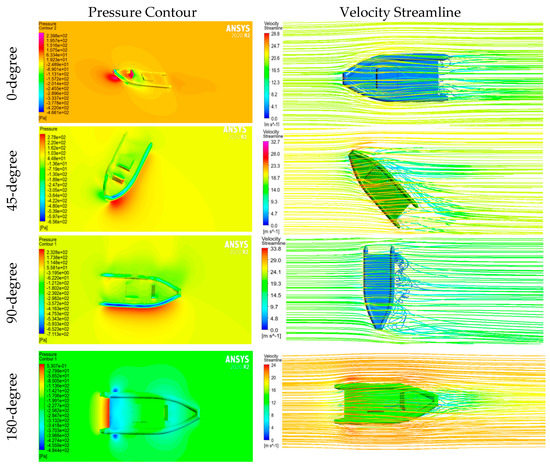
Figure 10.
The wind characteristics of 0, 45, 90, and 180 degrees at wind speeds of 20 m/s.
As can be seen from Figure 10, the front of the unmanned ship is subjected to positive pressure at the wind angle of 0 degrees, with a maximum positive pressure of 261.87 Pa. The arched part of the front edge of the unmanned ship is protruding, the wind speed accelerates when the air is circulating from its upper surface, the pressure is reduced to negative pressure, and the minimum negative pressure is −466.1 Pa. In addition, the leeward surface of unmanned ships is also subjected to negative pressure, but the pressure reduction is not high. At the 45-degree wind angle, the front wind face of the unmanned ship is subjected to positive pressure, and the farther away from the bow, the smaller the positive pressure, the maximum positive pressure is about 307 Pa. On one side of the leeward surface is a negative pressure zone with a minimum value of approximately −156 Pa. The smallest negative pressure appears on the upper surface of the head edge of the windward surface, as shown in the dark blue area of Figure 10, which is about −656 Pa. At a 90-degree wind angle, the wind face is mainly positively pressured, and the closer you get to the hull, the greater the pressure, which is about 263 Pa. The leeward zone is negative pressure, which is about −200 Pa. At the wind angle of 180 degrees, the wind direction is the same as the direction of the ship’s navigation, the tail of the unmanned ship is the positive pressure zone, the maximum pressure is about 7.65 Pa, in the tail of the unmanned ship deck and the front of the operator’s station is the negative pressure zone, because the wind from the rear of the ship when the wind around the current is larger, the pressure is smaller, forming a negative pressure zone, the minimum pressure is about −484 Pa.
4. Conclusions
CFD modeling and simulation were carried out in this study for the berthing of an unmanned ship as follows.
(1) To explore and establish a CFD model of unmanned ship navigation with multi-factors’ influence, we performed a CFD simulation. The results showed that the total resistance of the hull against the current can be 1.60 times higher compared to the downstream resistance. The unmanned ship has a resistance of 1.16 N at 0.45 m/s and 67.05 N at 5.45 m/s. Water flow resistance is the dominant factor, accounting for more than 80% of the total resistance.
(2) When changing the distance between ship and shore at fixed speed, the torque change was calculated. We found that the torque is small, but the growth rate is very large when driving below 2 m/s, and the torque growth rate is stable above 2 m/s.
(3) Based on the established coupling model, a multi-factor berthing safety study is carried out on an actual unmanned ship. The results shown that when the speed increases from 4 m/s to 12 m/s, the curve slope is small, the resistance increases from 3666 N to 18,056 N, and the rear slope increases. At 4 m/s, the maximum pressure of the unmanned bow is 6874 N, the pressure increases with the speed, and when the speed is 24 m/s, the maximum pressure is up to 238,869 Pa. By comparing water resistance with wind resistance, we can know that water resistance accounts for the main part. When the wind speed is fixed, the vertical force of the unmanned ship increases first and then decreases to zero and then reverses the same law change, and the maximum resistance is about 425 N at the wind angle of about 45 degrees; At 90 degrees, the maximum lateral force on an unmanned boat is about 638 N.
The above results give the characteristics of speed field, pressure field and vortex under different speed, wind direction and shore wall distance, reveal the coupling characteristics of unmanned ship berthing navigation and wind and wave environment disturbance, which can provide control strategy for unmanned ship berthing safety, and provide theoretical basis for unmanned ship route planning and obstacle avoidance, safety design, etc.
Author Contributions
Conceptualization, G.X.; methodology, G.X.; software, S.G.; validation, C.T. and G.X.; formal analysis, G.X.; investigation, S.G. and Y.W.; resources, X.H.; data curation, S.G. and Y.W.; writing—original draft preparation, S.G. and G.X.; writing—review and editing, X.H. and G.X.; visualization, S.G.; supervision, X.H.; project administration, X.H. and B.S.; funding acquisition, G.X., X.H. and B.S. All authors have read and agreed to the published version of the manuscript.
Funding
This work was supported by the Guangdong Basic and Applied Basic Research Foundation (2021A1515010794), Guangdong Provincial Key Laboratory of Electronic Information Products Reliability Technology (2017B030314151), Guangdong Province Science and Technology project (2018B010109004 and 2018B010109005), Guangzhou Science and Technology project under (201704020052, 201802020021 and 201802020009), Guangdong Marine Economy Promotion projects Fund (GDOE (2019) A13).
Conflicts of Interest
The authors declare no conflict of interest.
References
- Iris, Ç.; Lam, J.S.L. A review of energy efficiency in ports: Operational strategies, technologies and energy management systems. Renew. Sustain. Energy Rev. 2019, 112, 170–182. [Google Scholar] [CrossRef]
- Cao, J.; Wang, X. Development status and future prospects of unmanned ships at home and abroad. China Ship Insp. 2018, 5, 94–97. [Google Scholar]
- Zhang, W.; Wang, S.A. Autonomous Vessel Scheduling. J. Oper. Res. Soc. China 2020, 8, 391–414. [Google Scholar] [CrossRef]
- Yao, J.; Zou, Z. Numerical study on the quay wall effect of ships sailing near shore. J. Wuhan Univ. Technol. (Transp. Sci. Eng. Ed.) 2011, 35, 435–438. [Google Scholar]
- Ni, C. Comprehensive Research on Ship Resistance Performance Based on CFD; Shanghai Jiao Tong University: Shanghai, China, 2011. [Google Scholar]
- Yu, J. Research on Calculation and Prediction of Ship Resistance Based on CFD; Shanghai Jiao Tong University: Shanghai, China, 2009. [Google Scholar]
- Wang, H.; Li, X.; Chen, L. Numerical study on the hydrodynamic forces on a ship berthing to quay by taking free-surface effect into account. J. Mar. Sci. Technol. 2016, 21, 601–610. [Google Scholar] [CrossRef]
- Cercos-Pita, J.L.; Bulian, G.; Pérez-Rojas, L.; Francescutto, A. Coupled simulation of nonlinear ship motions and a free surface tank. Ocean Eng. 2016, 120, 281–288. [Google Scholar] [CrossRef]
- Maki, A.; Sakamoto, N.; Akimoto, Y.; Nishikawa, H.; Umeda, N. Application of optimal control theory based on the evolution strategy (CMA ES) to automatic berthing. J. Mar. Sci. Technol. 2020, 25, 221–233. [Google Scholar] [CrossRef]
- Yang, P.; Huang, L. Direct calculation analysis of catamaran structure. Ship Ocean Eng. 2006, 5, 4–7. [Google Scholar]
- Larin, O.; Barkanov, E.; Vodka, O. Prediction of reliability of the corroded pipeline considering the randomness of corrosion damage and its stochastic growth. Eng. Fail. Anal. 2016, 66, 60–71. [Google Scholar] [CrossRef]
- Zou, Z. Research progress on ship maneuverability. In Proceedings of the 6th Ship Mechanics Academic Committee Meeting of Chinese Society of Shipbuilding Engineering, Zhenjiang, China, 6–7 August 2006. [Google Scholar]
- Chen, Y. Ship Hydrodynamic Calculation and Maneuvering Simulation Based on CFD; Dalian Maritime University: Dalian, China, 2017. [Google Scholar]
- Besnard, E.; Schmitz, A.; Hefazi, H.; Shinde, R. Constructive Neural Networks and Their Application to Ship Multidisciplinary Design Optimization. J. Ship Res. 2017, 51, 297–312. [Google Scholar] [CrossRef]
- Villa, D.; Viviani, M.; Gaggero, S.; Vantorre, M.; Eloot, K.; Delefortrie, G. CFD-based analyses for a slow speed manoeuvrability model. J. Mar. Sci. Technol. 2019, 24, 871–883. [Google Scholar] [CrossRef]
- Qiu, P.; He, Y.; Li, G. Research on Numerical Calculation of Ship Resistance. China Water Transp. 2021, 1, 121–123. [Google Scholar]
- Yang, X. Research on Yacht Fluid Mechanics Simulation and Hull Model Optimization Based on CFD; University of Electronic Science and Technology of China: Chengdu, China, 2020. [Google Scholar]
- Zhang, S.; Zhang, B.; Tezdogan, T.; Xu, L.; Lai, Y. Computational fluid dynamics-based hull form optimization using approximation method. Eng. Appl. Comput. Fluid Mech. 2018, 12, 74–88. [Google Scholar] [CrossRef] [Green Version]
- Xiao, D. Research on Ship Resistance Performance Based on CFD; Dalian University of Technology: Dalian, China, 2014. [Google Scholar]
- Coppedè, A.; Gaggero, S.; Vernengo, G.; Villa, D. Hydrodynamic shape optimization by high fidelity CFD solver and Gaussian process based response surface method. Appl. Ocean Res. 2019, 90, 101841. [Google Scholar] [CrossRef]
- Stern. Verification and Validation of CFD Simulations; Iowa Institute of Hydraulic Research, University of Iowa: Iowa, IA, USA, 1999. [Google Scholar]
- Ega, L.; Hoekstra, M. An evaluation of verification procedures for CFD applications. In Proceedings of the 24th Symposium on Naval Hydrodynamics, Fukuoka, Japan, 8–13 July 2002; pp. 8–13. [Google Scholar]
- Era, L.; Hoekstra, M. On the influence of the iterative error in the numerical uncertainty of ship viscous flow calculations. In Proceedings of the 26th Symposium on Naval Hydrodynamics, Rome, Italy, 17–22 September 2006; pp. 17–22. [Google Scholar]
- Starke, A.R.; Windt, J.; Raven, H.C. Validation of viscous flow and wake field predictions for ships at full scale. In Proceedings of the 26th Symposium on Naval Hydrodynamics, Rome, Italy, 17–22 September 2006. [Google Scholar]
- Li, K. Research on the Viscous Pressure Resistance of Trimaran; Dalian University of Technology: Dalian, China, 2013. [Google Scholar]
- Li, H. Hydrodynamic Analysis of Ship Berths at Current Berths; Dalian Maritime University: Dalian, China, 2018. [Google Scholar]
- Lao, J.; Cheng, H.; Yao, S. Analysis on the collision safety of ship’s T-shaped berthing wharf. Waterw. Ports 2016, 37, 497–501. [Google Scholar]
- Li, W.; Song, J.; Du, J.; Chen, H. Simulation of Wind Disturbances for ShiP Dynamic Positioningin Marine Environment. Comput. Simul. 2012, 29, 154–157, 285. [Google Scholar]
- Ma, S. Numerical Study on the Hydrodynamic Force of Ships Traveling along the Coast; Shanghai Jiao Tong University: Shanghai, China, 2014. [Google Scholar]
- Chen, Y. Research on ShiP Performance Numerical Tank based on CFD; China Ship Research and Development Academy: Neijiang, China, 2016. [Google Scholar]
- Liu, R.; Xue, Y.; Liu, Y.; Lin, X. Numerical model of ship automatic collision avoidance and the application in restricted water areas. J. Harbin Inst. Technol. 2018, 50, 171–177, 184. [Google Scholar]
- Hu, Y.; Hu, Z.; Liu, Y.; Liu, J. Analysis of mooring of large LNG ship terminal based on AQWA. Ship Sci. Technol. 2012, 34, 70–73, 110. [Google Scholar]
- Shao, F.; Jin, J.; Zhang, J. FLUENT resistance simulation and experimental verification of unmanned ship. J. Ocean Technol. 2014, 33, 8–12. [Google Scholar]
- Tao, Y. Research on Ship Wave Force Model in Regular Waves Based on CFD; Dalian Maritime University: Dalian, China, 2014. [Google Scholar]
- Wang, M. Research on the Key Technology of Virtual Remote Control of Four-Rotor Drones Underground Coal Mines; Xi’an University of Science and Technology: Xi’an, China, 2020. [Google Scholar]
- Iris, Ç.; Pacino, D.; Ropke, S.; Larsen, A. Integrated berth allocation and quay crane assignment problem:Set partitioning models and computational results. Transp. Res. Part E Logist. Transp. Rev. 2015, 81, 75–97. [Google Scholar] [CrossRef] [Green Version]
- Imai, A.; Nishimura, E.; Hattori, M.; Papadimitriou, S. Berth allocation at indented berths for mega-containerships. Eur. J. Oper. Res. 2007, 179, 579–593. [Google Scholar] [CrossRef] [Green Version]
- Iris, Ç.; Lam, J.S.L. Recoverable robustness in weekly berth and quay crane planning. Transp. Res. Part B Methodol. 2019, 122, 365–389. [Google Scholar] [CrossRef]
- Venturini, G.; Iris, C.; Kontovas, C.A.; Larsen, A. The multi-port berth allocation problem with speed optimization and emission considerations. Transp. Res. Part D Transp. Environ. 2017, 54, 142–159. [Google Scholar] [CrossRef] [Green Version]
- Castiglione, T.; Stern, F.; Bova, S.; Kandasamy, M. Numerical investigation of the seakeeping behavior of a catamaran advancing in regular head waves. Ocean Eng. 2011, 38, 1806–1822. [Google Scholar] [CrossRef]
- Zhang, Y.; Que, X. The total resistance prediction of the ship based on CFD. Ship Sci. Technol. 2015, 37, 139–142. [Google Scholar]
- Wang, T.; Gu, C.; Huang, J. PISO algorithm for unsteady flow. Chin. J. Hydrodyn. 2003, 18, 233–239. [Google Scholar]
- Xiao, G.; Li, T.; Li, R.; Hong, X. CFD simulation method on resistance of small unmanned ship. China Meas Test 2018, 44, 69–74. [Google Scholar]
Publisher’s Note: MDPI stays neutral with regard to jurisdictional claims in published maps and institutional affiliations. |
© 2021 by the authors. Licensee MDPI, Basel, Switzerland. This article is an open access article distributed under the terms and conditions of the Creative Commons Attribution (CC BY) license (https://creativecommons.org/licenses/by/4.0/).