1. Introduction
As the limitations of the means of transportation are significantly decreased due to the progress achieved by road traffic technology, the number of modern people who own a vehicle continues to increase, and this leads to diverse traffic problems. Of such problems, the increasing number of car accidents causes strong social risk burden to transportation users, and causes massive social and economic losses at the national level [
1]. The causes of car accidents are divided into drivers, vehicles and roads. According to the statistical data analyzing car accidents, driver-related causes such as negligent driving, fatigue and poor driving account for more than 90% of the total number of car accidents [
2]. Recently, as one of the solutions for reducing the number of car accidents caused by drivers’ negligent driving, many studies on self-driving are being conducted. A self-driving vehicle refers to ‘a vehicle that recognizes the surrounding environment and travels without an operation of a user’ [
3]. According to NHTSA, it is forecasted that 90% of the car accidents occurring due to driver negligence will be prevented when self-driving vehicles are commercialized [
4].
As described, self-driving technology is an innovative technology that effectively reduces the number of car accidents and contributes to reducing traffic congestions and traffic rule violations. Currently, surrounding object recognition and detection are active studies, being essential technologies for commercializing self-driving. Lian, J. et al. [
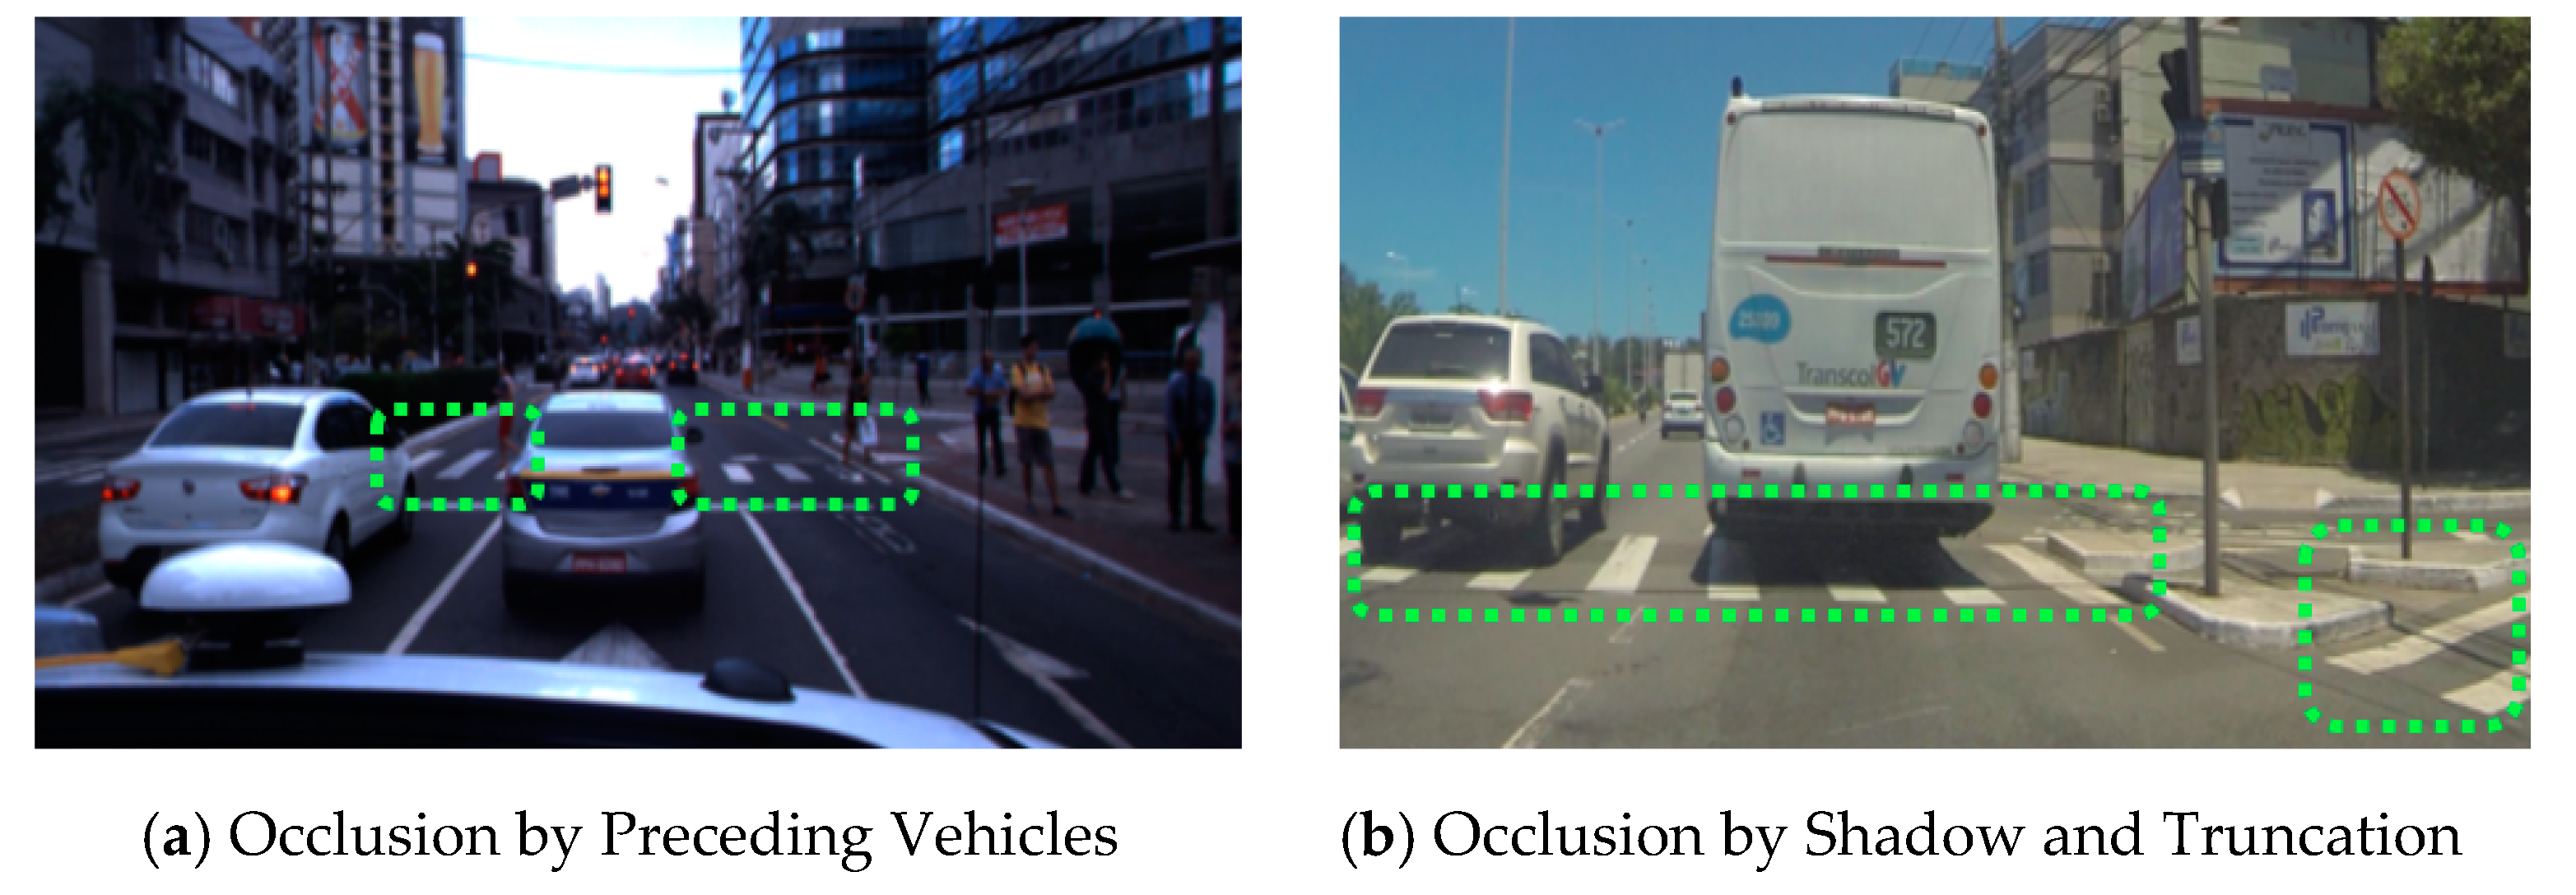
5] proposed a model based on the attention feature fusion method to enhance the detection accuracy of small objects that are difficult to detect in traffic scenes. Such a model is advantageous in that it uses local and global scales to design the multi-scale channel attention block(MS-CAB) and intensively and easily recognize small objects. However, the used model was limited in that it was designed without taking into consideration occluded objects that may occur in a road environment. In addition, the model was problematic in that the data imbalance of the classes of interest to be detected was not taken into consideration in the model training process. In the real-life object detection process, the occlusion phenomenon where a part of an object is occluded by particular blocks frequently occurs. This serves as the main cause that increases the false-negative that decreases detection rate and degrades the overall detection performance [
6]. In a road driving environment, a situation where a crosswalk object is undetected because it is occluded by cars or pedestrians in front is a representative example of the occlusion phenomenon that frequently occurs in the actual self-driving process. In another study on road driving detection, Huang, X. et al. [
7] proposed a real-time detection and tracking model utilizing traffic image data based on the integrated two-stream convolutional neural network. This model utilizes the space stream network for object detection and the motion features for multi-object tracking to allow stable real-time object detection. However, it was still problematic in that occluded objects were not taken into consideration. In addition, since the data set used in the involved study did not take into consideration hard-negative data that induce model performance degradation, it was necessary to make additional improvements. In a road surrounding environment, diverse hard-negative examples that make it likely to incorrectly detect negative examples as positive examples exist. This increases the false-positive detection rate of a detection model and has a negative influence on the overall detection performance [
8]. As described, the pre-existing studies on object detection were examined, and it was confirmed that the studies conducted by Lian, J. et al. [
5], Fan, B. B. et al. [
9], and Lee, S. W. et al. [
10] took into consideration the hard-negative data, but were limited in that they did not take into consideration the hard-positive data and data imbalanced caused by the occlusion phenomenon. In addition, the pre-existing studies conducted by Huang, X. et al. [
7], Ke, X. et al. [
11], and Ha, J. et al. [
12] took into consideration the data imbalance, but were limited in that they did not take into consideration the occluded objects and hard-negative objects.
Accordingly, in this study, to bring solutions to the limitations described above, a detection model of occluded objects based on YOLO using hard-example mining and augmentation policy optimization was proposed. The proposed procedures are as follows: in the detection modeling process, the hard-positive objects occurring due to the occlusion phenomenon and the hard-negative objects that are likely to be incorrectly detected as objects of interest were extracted using the boundary feature vector according to the confidence threshold. The pre-existing learning model was additionally re-trained on the extracted feature vector through transfer learning. In addition, to overcome diverse types of data imbalance problems that may occur in the actual detection process, augmentation policies suitable for the learning model were strategically selected, and the model pre-processing optimization was conducted.
3. Detection Model of Occluded Object Based on YOLO Using Hard-Example Mining and Augmentation Policy Optimization
In this study, a detection model of occluded object based on YOLO using hard-example mining and augmentation policy optimization was proposed to detect objects that occlude a crosswalk on a real-time basis. The proposed model has a structure of a three-phase process.
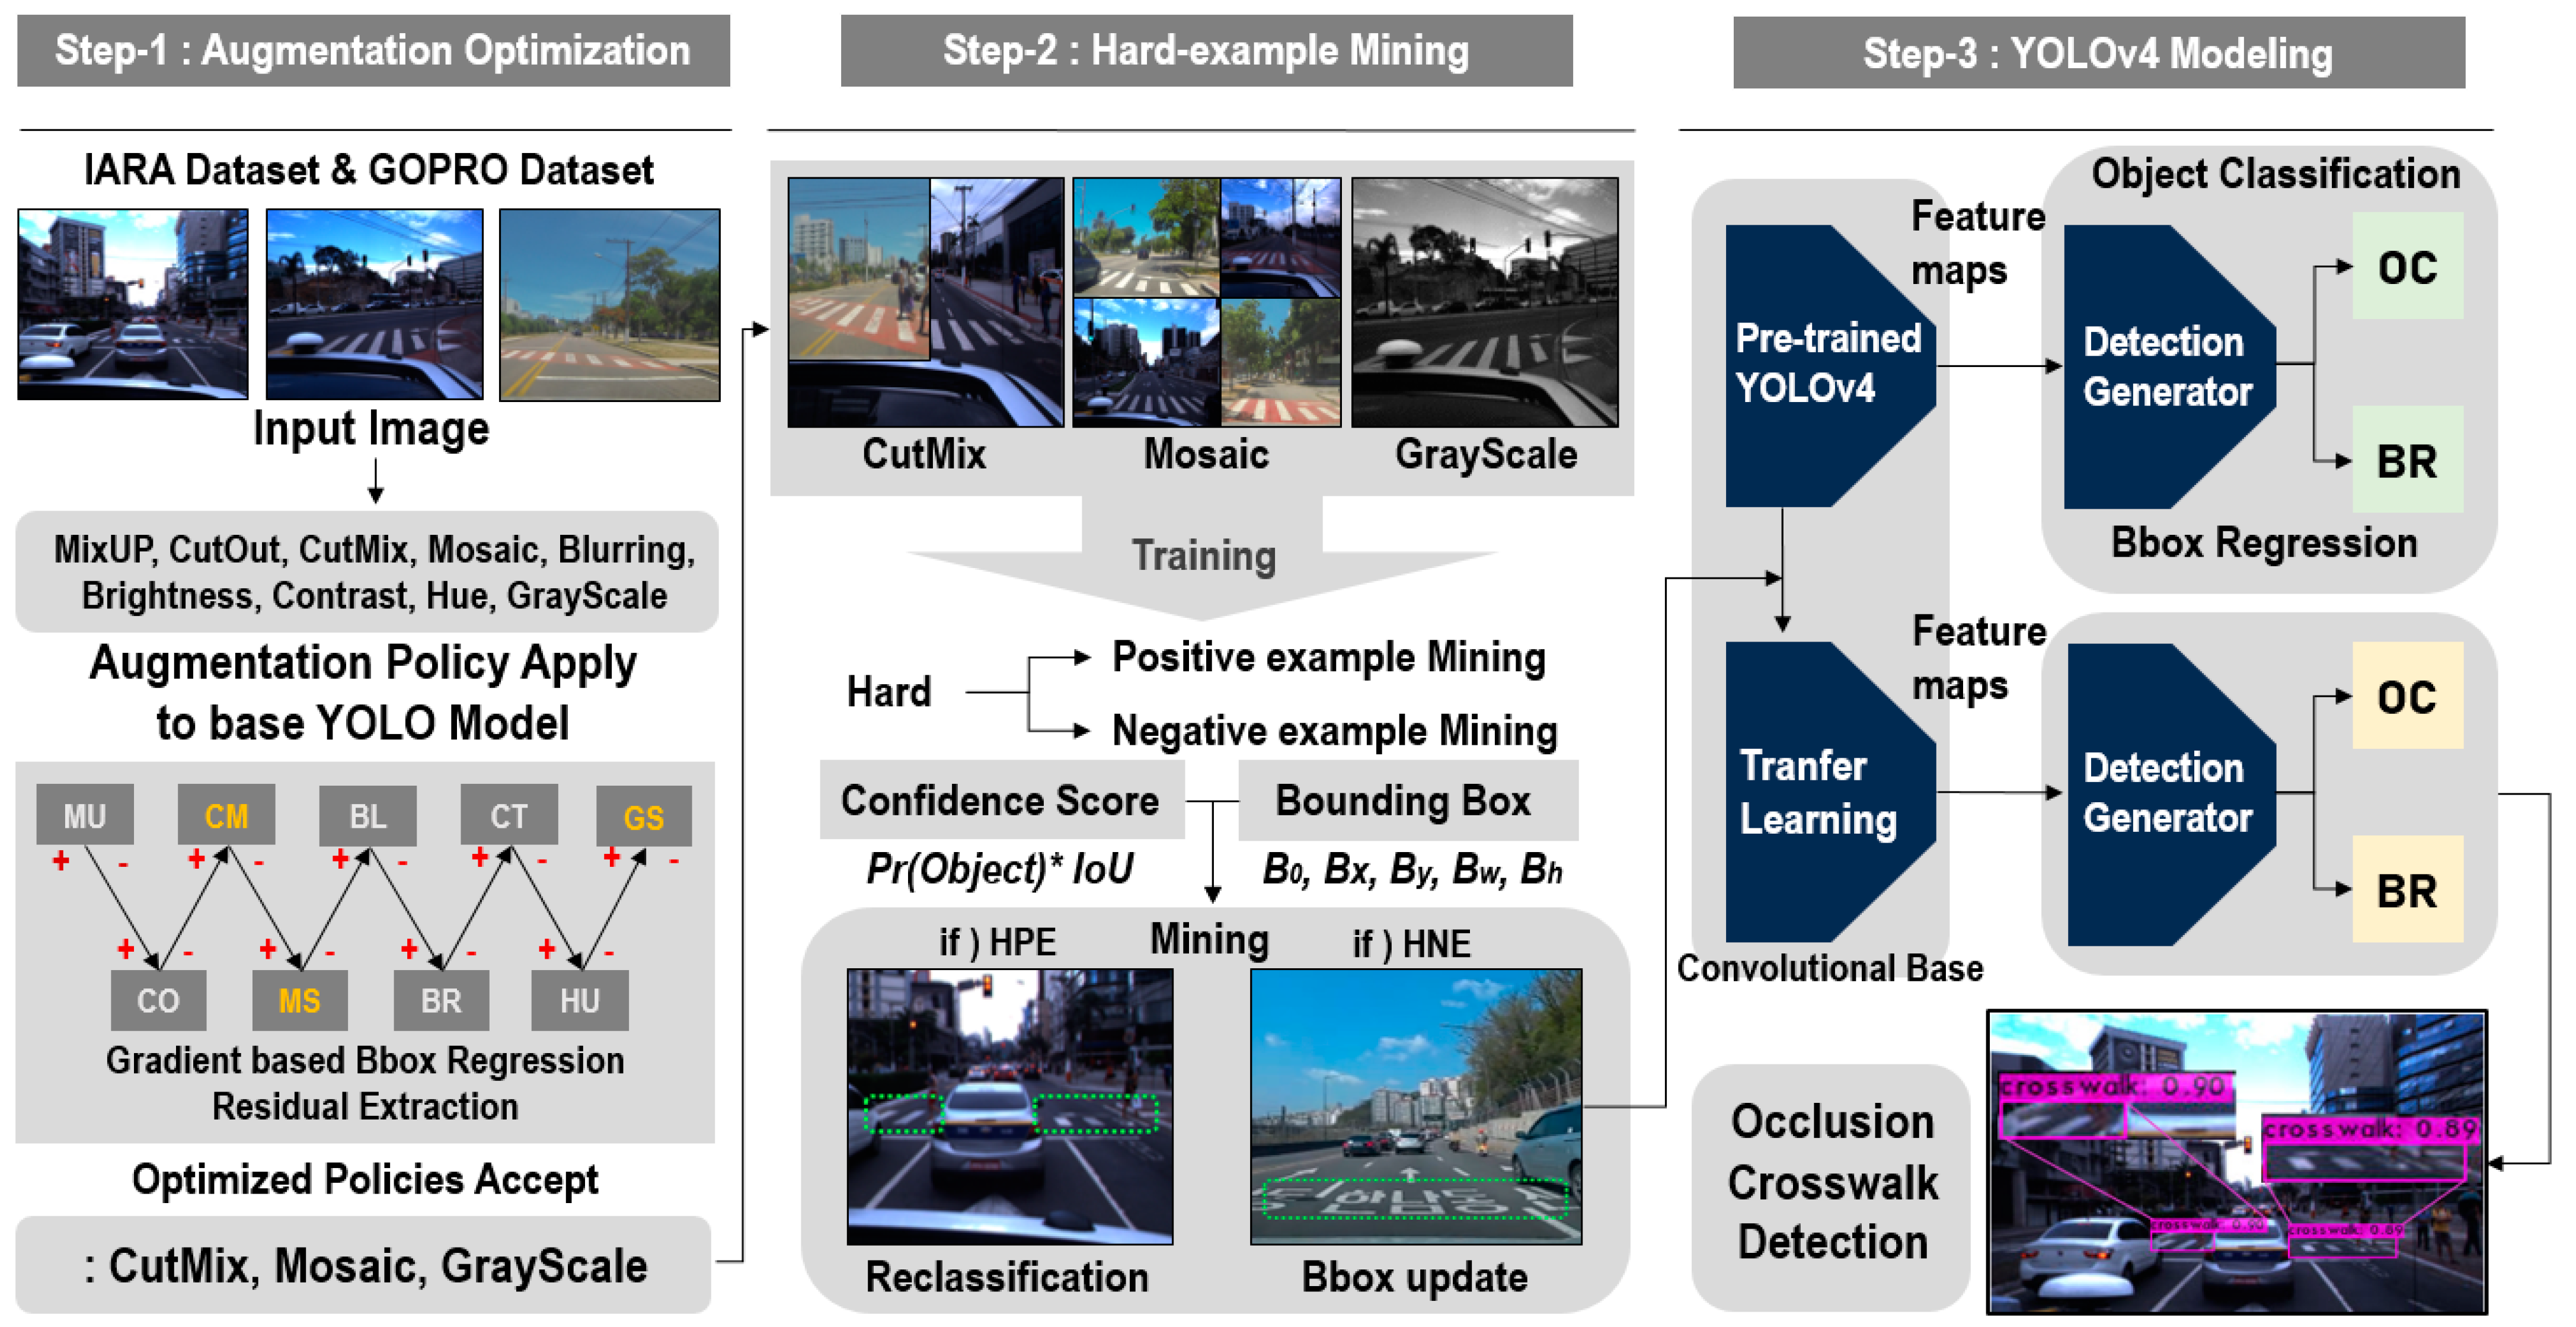
Figure 3 shows the process configuration diagram of a YOLO-based occlusion object detection model. As shown in
Figure 3, the first phase is the augmentation policy optimization phase. As far as the training data for occluded object detection are concerned, the self-driving image dataset provided from the IARA(Intelligent Robotic Autonomous Automobile) and GOPRO was collected [
23,
24]. The above dataset includes diverse objects that appear in a road driving environment. It also contains high-quality image datasets that include various times, spaces, and climate environments. In this study, the involved data were used to create a model that detects objects that occlude a crosswalk. Nine augmentation policies were applied to the collected data to create new training data. The augmentation policies consisted of MixUp, CutOut, CutMix, Mosaic, Blurring, Brightness, Contrast, Hue, and GrayScale [
27]. These policies were applied to the base YOLO model learning in sequence, and extracted the bounding box regression value of the objects of interest calculated based on the IoU(Intersection over Union) index. The actual ground truth value and predicted regression value were compared, and only the policies having a positive influence on occluded crosswalk object detection were accepted through the gradient-based residual.
In the second phase, the pre-existing training data and the data to which the optimized augmentation policy is applied were used to extract the hard-positive example and hard-negative example groups through hard-example mining. Through hard-example mining, the data increasing the false-negative detection rate and false-positive detection rate based on the feature vector were extracted from the confidence score and bounding box parameters. As far as the hard-positive data increasing the false-negative detection rate are concerned, the reclassification of the objects of interest was performed. As far as the hard-negative data increasing the false-positive detection rate are concerned, the Bbox information of the false-positive objects was updated and applied to the detection model. In the final phase, a neural network is configured based on the YOLOv4 model, a one-stage detector, to detect the objects that occlude a crosswalk. The augmentation policies applied through the previous phases were optimized, and fine-tuning was conducted through hard-example re-leaning. This is the process of applying transfer learning to the pre-trained detection model, and has a positive influence on occluded object detection. The occluded crosswalk was detected based on the object classification and bounding box regression values predicted through the detection generator.
3.1. Collection and Pre-Processing of Road Driving Image Data
In this study, to configure an occluded crosswalk detection model, the self-driving dataset [
23] collected from a self-driving vehicle known as IARA(Intelligent Robotic Autonomous Automobile) and the road driving image dataset [
24] recorded using a GOPRO camera were used at the same time. IARA is a self-driving vehicle being developed at the LCAD of Universidade Federal do Espírito Santo. The involved vehicle consisted of a number of sensors. However, in this study, the learning images only consisted of the data collected from the camera for self-driving for image-based object detection. The IARA dataset included consecutive images consisting of general road driving images recorded during the daytime and road driving images recorded during the nighttime on weekdays. It consists of more than 35,000 images of day and night data and uses images with and without crosswalks. Among them, 12,748 images include crosswalks. The GOPRO dataset consisted of images recorded at 29.97 FPS using a GoPRO HERO 3 camera in Espírito Santo, Brazil. The involved images were divided into 29 sequences. Of the 29 sequences, 23 sequence images included the driving images of the vehicle passing through a crosswalk, and the remaining 6 sequence images consisted of the driving images of the vehicle not passing through a crosswalk. The dataset also consists of 11,070 daytime image data, of which 3964 images contain crosswalks. The two datasets are combined to use approximately 46,000 road images, of which 16,712 crosswalks are included. This study was aimed at designing a model capable of detecting the crosswalk objects to which the occlusion phenomenon is applied and not detecting objects that may be incorrectly detected as crosswalk objects at the same time. Accordingly, the sequence images that included a crosswalk were used as the training data of the detection model, and the sequence images that did not include a crosswalk were used as the data for hard-negative extraction and as the validation data.
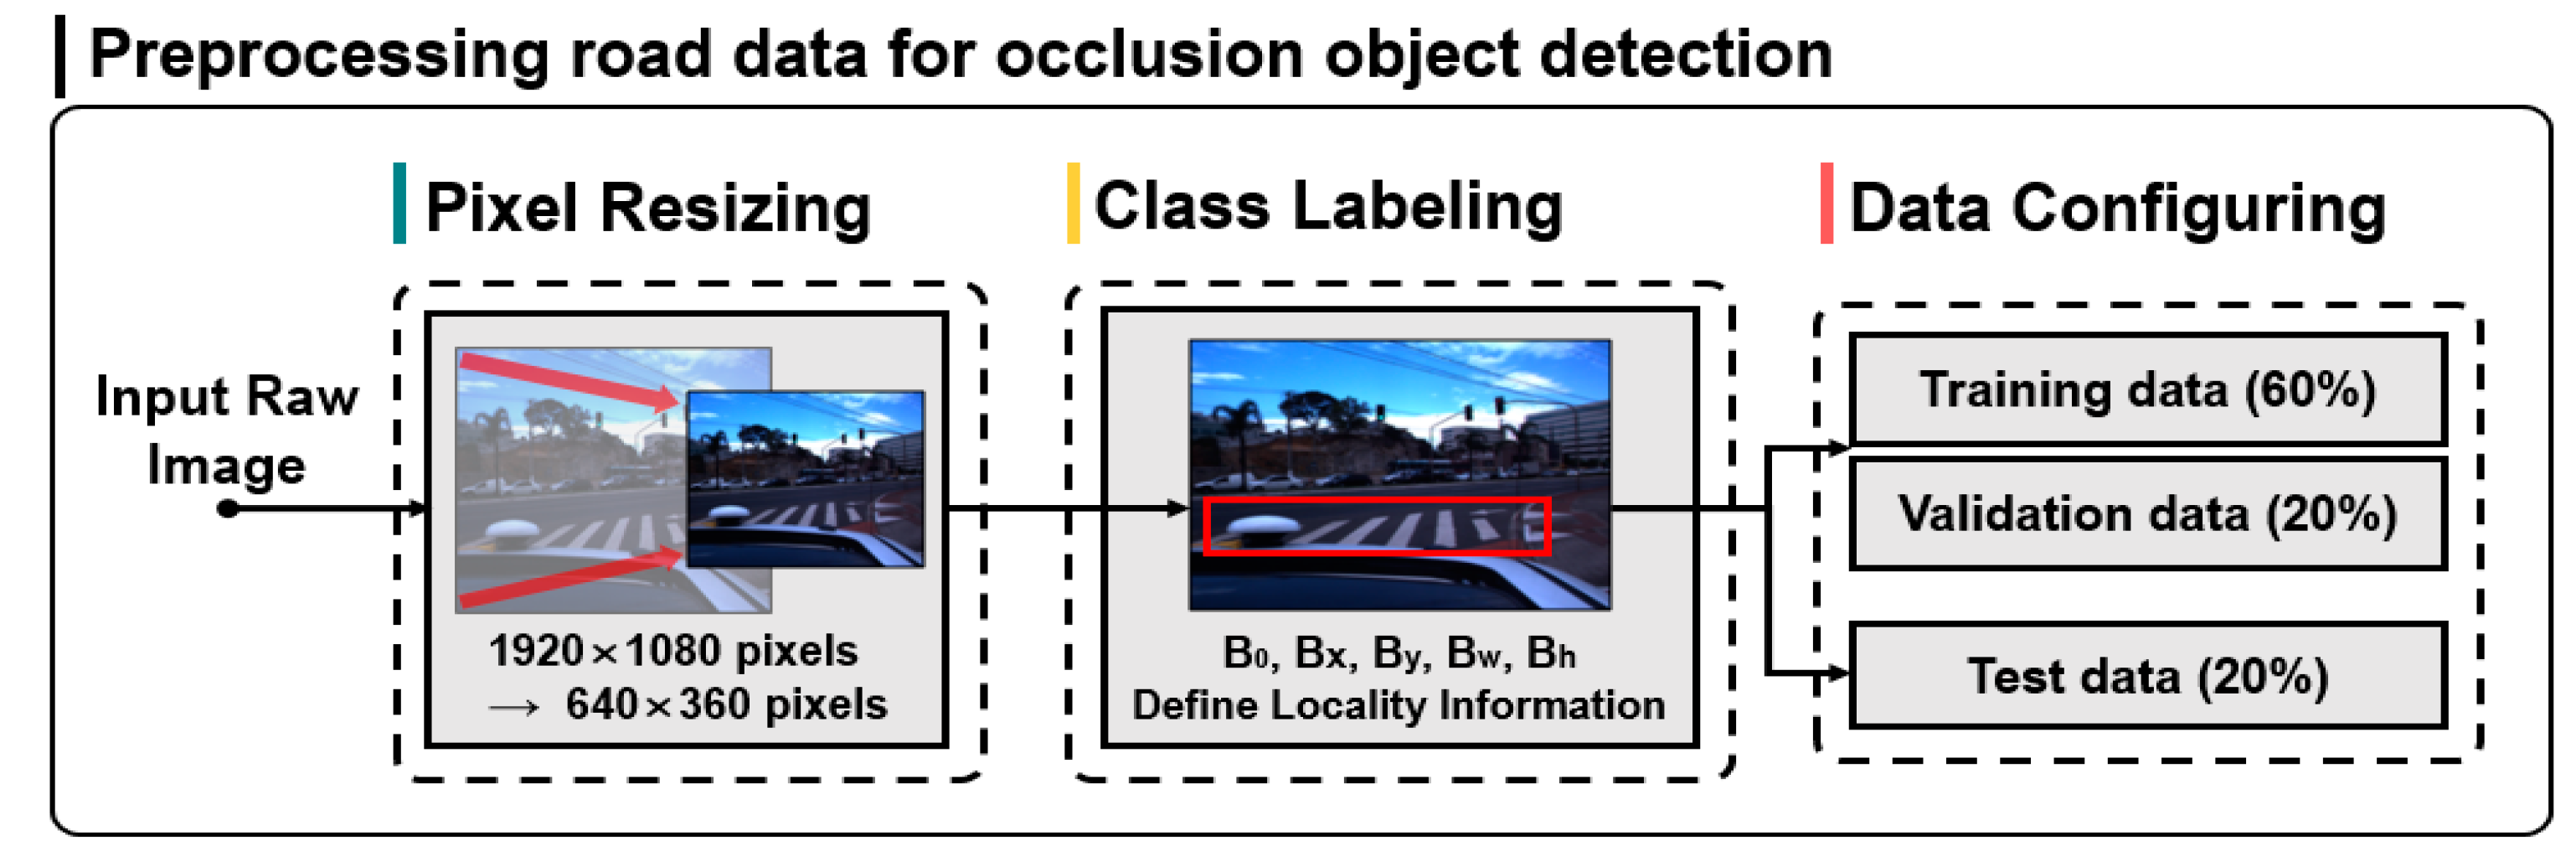
Figure 4 shows the pre-processing of road driving data for occlusion object detection.
As shown in
Figure 4, input raw images represent a total of 35,625 frame-unit input raw images acquired from road driving images in diverse environments. The original resolution of the involved images is 1920 × 1080 pixels. Since high-resolution images increases the complexity of the model algorithm for detecting the objects of interest and decreases the learning efficiency, in this study, the resolution was adjusted to 640 × 360. After the pixel pre-processing, the location of the ground truth bounding box of the crosswalk object was defined through the class labeling process of the objects of interest. This is an essential process for one-stage detector-based YOLO model training. In the final stage of pre-processing, the overall dataset is divided at a ratio of 8:2, and the training dataset for crosswalk occlusion detection and the test dataset were configured. Then, the training data were divided at a ratio of 3:1, and the training data for object detection neural network learning and the validation data used for evaluating the conformity of the model in training were configured.
3.2. Augmentation Policy Optimization for Data Imbalance Problem Solving
The foreground-to-background imbalance problem that normally occurs in the process of detecting objects of interest in a road driving environment has a negative influence on the final detection performance [
28]. This is caused by the intense imbalance between the number of positive examples serving as objects of interest and the number of negative examples serving as background objects, and causes overfitting. In this study, to prevent the data imbalance problem and overfitting, augmentation policies suitable for the learning model were strategically selected. In addition, the model pre-processing was optimized by adjusting the activation function and anchor box hyper parameters.
Table 1 shows the augmentation policies applicable to learning for object detection, and also shows the detailed description of such policies [
27]. Augmentation policy optimization is a process of strategically selecting policies that have a positive influence on the performance of learning data from among diverse policies such as MixUp, CutOut, CutMix, Mosaic, Blurring, Brightness, Contrast, Hue, and GrayScale and applying the selected policies to learning [
29].
This secures additional learning data required for training the deep learning model and prevents the data imbalance problem and overfitting [
30]. In addition, diverse noise processings applied from the pre-existing data is applied to the model to acquire a more generalized model. A generalized model allows the detection of objects of interest in diverse driving environments [
31]. However, indiscreetly applying the involved augmentation policies to learning has a negative influence on the performance of a detection model [
32]. Since the optimized policies may also vary depending on the unique features of learning data, the user designing the detection model is required to make adequate adjustments [
33]. Accordingly, in this study, images to which new augmentation policies are applied in sequence at intervals of 1000 iterations were added to the training data in the model learning process. This means that after 1000 training sessions, the weights for the learning model are extracted, adding images with new policies applied to the existing learning data to the model to continue learning into transfer learning. The policies added in phases went through the transfer learning of the pre-trained base YOLO model. In the transfer learning process for crosswalk occlusion detection, the bounding box regression values before and after applying particular policies were compared, and the residual was extracted. The residual was calculated based on the mAP used as the object detection performance index. When the gradient-based residual comparison is made between the location information of objects of interested predicted in the detection process and the location information of ground truth, the larger detection performance gradient means that the most recently applied augmentation policy satisfies the model optimality [
34]. Accordingly, a comparison was made between the pre-existing detection mAP(mean Average Precision) value and the detection mAP value including the added policies, and the policies for enhancing the performance of occluded crosswalk object detection were strategically selected. A gradient-based performance residual comparison was made, and the increase/decrease in the mAP serving as the objective index was digitized to explore the optimal policy group.
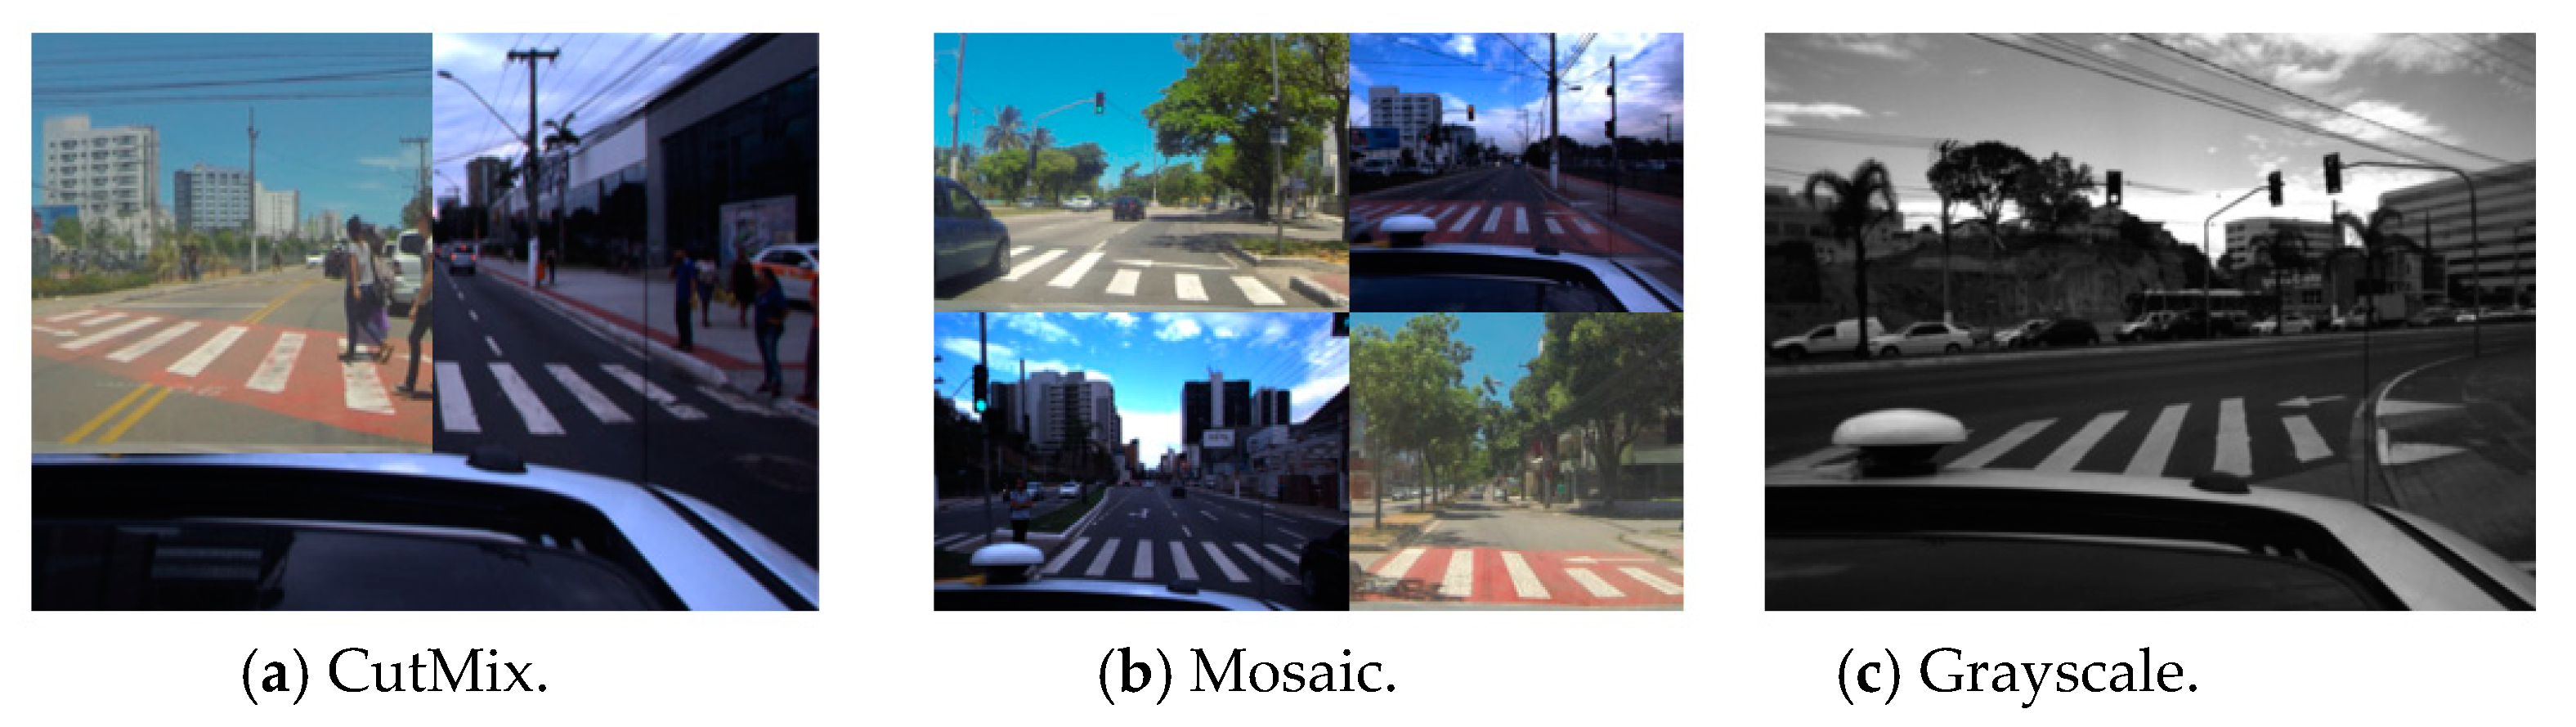
Figure 5 shows the result images of the training data to which augmentation policy optimization is applied according to the model learning process.
Figure 5a–c show the augmentation policies for enhancing the performance of occluded objection detection that showed positive results when applied to the learning model in this study.
Figure 5a CutMix is a policy that replaces a part of one image with a part of another image to newly configure the learning data, and shows amazing performance results for being an intuitive idea [
35].
Figure 5b Mosaic is a policy that mixes and uses four learning images, and shows effective performance despite the small number of mini batches [
36].
Figure 5c is a policy that processes the pre-existing color learning images into black-and-white images, and enables prompt image processing by simply delivering the luminosity information [
37]. The MixUp, CutOut, Blurring, Brightness, Contrast, and Hue policies other than the three described above were not selected as the policies for model optimization, since the performance changes were reduced or insignificant in the transfer learning process. Accordingly, the CutMix, Mosaic, and Grayscale policies that showed detection performance enhancements through each policy performance evaluation were accepted and used in the final model learning. In addition, since the output value representing the detection performance varies depending on which activation function is used for model neural network configuration, it is very important to use activation functions suitable for learning [
38]. In this study, a robust model suitable for normalization was developed and the Mish function that prevents overfitting was used as the activation function. This allows a bit of negative numbers to exist in the output value, and is particular in that the gradient is more smoothly displayed than that of the pre-existing ReLU series function. Since this is more advantageous in finding the global optimum value, it has a positive influence on the mean accuracy [
38]. In addition, in the transfer learning process of the YOLO-based model, the k-means clustering method was applied to the bounding box of the ground truth included in the learning dataset, and the optimal anchor boxes suitable for crosswalk detection were found and used for learning. K-means clustering is an algorithm that aggregates given data into k clusters, minimizing the variance between each cluster and the distance difference. Generally, the method of using k-means clustering uses the euclidean method, but when applied to anchor boxes, it is difficult to find optimal anchor boxes because they rely too much on the center point. To improve this, we apply IoU(Intersection over Union) to extract anchor boxes. This had a positive influence on the crosswalk detection performance, since it took into consideration not just the pre-existing initially set value that simply took into consideration the aspect ratio according to pixels, but also the image features of the ground truth objects of learning data [
39].
3.3. Detection Model of Occluded Object Based on YOLO Using Hard-Example Mining
After configuring the dataset to be used for model learning through the augmentation policy optimization, a custom learning model was conducted to detect the objects that occlude a crosswalk. To detect the occluded object on a road, it is necessary to extract the hard-positive data generated in the model learning process and include them as the input images of the learning model. An effective method to decrease the false-negative detection rate and false-positive detection rate of the objects of interest is to extract diverse hard-negative data that may occur in a road driving environment and have the model re-learn the data [
40]. Hard-positive and hard-negative data are extracted from the hard example mining phase, Step-2 in
Figure 3. The proposed process in this study extracts data from the training datasets that are judged to be hard positive and negative and then reused for occluded crosswalks detection model training through appropriate pre-processing. Accordingly, in this study, in the YOLO-based model learning process for crosswalk detection, the hard-example data were extracted based on the confidence score threshold values and each boundary information of the detected classes. Then, the fine-tuning, to which transfer learning is applied, of the pre-trained model was performed. The convolution base of the pre-existing model serving as the part that extracts the features for detection from the input images was utilized to have just the classifier perform the re-learning process. In the road driving data for crosswalk detection, a hard-positive example is an example where the crosswalk object is not detected or is incorrectly detected as another object due to the occlusion phenomenon. A hard-negative example is an example where speed bumps and signs such as ‘no speeding’ and ‘kids zone’ for provision of traffic information other than crosswalks on roads are likely to be incorrectly detected as crosswalks. In the YOLO-based model learning process, the confidence score value is determined based on the IoU according to the pre-determined IoU(Intersection over Union) threshold value and on the object of interest existence probability, and the detection results are calculated according to the involved score value. In this study, the actual ground truth objects and hard-positive and hard-negative objects were classified through the involved confidence score information and bounding box information. Then, the extracted examples were added to the pre-existing learning data, the transfer learning was conducted, and the pre-trained model was renewed. As far as the model renewal is concerned, the feature vectors acquired from the locations predicted by the bounding box were set and learned as positive examples when they were included in the crosswalk objects, and the feature vectors acquired from the images not including crosswalk vectors were all set and learned as negative examples. In the model learning for occluded object detection, since the hard-negative feature vectors extracted from images not including objects of interest were all negative examples, they were included in the dataset for re-learning. The hard-negative feature vectors extracted from images including objects of interest were classified through the vector comparative calculation with the ground truth objects, and the filtered negative examples were included into the re-learned dataset. At this point, the bounding box information of the classes defined based on the extracted vectors were taken into consideration, the classifier was re-designed to classify the hard-negative examples as a separate class from the ground truth, and the involved examples were included into the new learning category. This induces the hard-negative objects likely to be detected as positive classes in the actual crosswalk detection process to be classified as classes of another category. Accordingly, this decreased the false-positive detection rate and enhanced the overall object detection performance. Lastly, since the hard-positive feature vectors that can be extracted from images including objects of interest were vectors included in or adjacent to the ground truth feature vectors, the bounding boxes of the involved images were reset by taking this into consideration, and then were included in the dataset for transfer learning. At this point, the IoU threshold value for hard-example estimation was set as a value below 0.5, and the feature vectors of the objects of interest were extracted. Algorithm 1 is an occluded object detection algorithm using hard-example mining.
| Algorithm 1. Occluded Object Detection Algorithm using Hard-example Mining. |
Input: training input images[n] applied cutmix, mosaic, and grayscale policies
Output: Hard-negative_example[n], Hard-positive_example[n], Positive_example[n], Negative_example[n] Groups
confidence_score[n]←NULL
Positive_example[n]←NULL
Negative_example[n]←NULL
Hard-negative_example[n]←NULL
Hard-positive_example[n]←NULL
for n is 1 to number of training Input Images do
if Ground Truth interest object is involved in Input Images[n]
// IoU( Intersection over Union) = Overlapping Region/Combined Region
if IoU of pred_bbox_reg(n) and GT_bbox_reg(n) >= 0.5
confidence_score[n]←Pr(object(n)) * IoU
if confidence_score[n] >= 0.5
// Positive example mining with confidence score threshold
Pos_feature_vector[n]←pred_bbox_reg(n)
Positive_example[n]←GT_class_labeling(Pos_feature_vector[n])
else
// Hard-negative mining with bbox comparison and reclassification
Hard-Neg_feature_vector[n]←pred_bbox_reg(n)
bbox_tmp←Comp(Hard-Neg_feature_vector[n], GT_bbox_reg(n))
filtering_tmp←Filtering(bbox_tmp)
Hard-negative_example[n]←Class_redefine(filtering_tmp)
else if IoU of pred_bbox_reg(n) and GT_bbox_reg(n) < 0.5
confidence_score[n]←Pr(object(n)) * IoU
if confidence_score[n] < 0.5 or confidence_score[n] >= 0.25
// Hard-positive mining with class reclassification
Hard-Pos_feature_vector[n]←pred_bbox_reg(n)
bbox_tmp←Class_redefine(Hard-Pos_feature_vector[n])
Hard-positive_example[n]←bbox_tmp
else // confidence_score[n] < 0.25
// Negative example mining with confidence score threshold
Neg_feature_vector[n]←pred_bbox_reg(n)
Negative_example[n]←GT_class_labeling(Neg_feature_vector[n])
else // Ground Truth interest object is not involved in Input Image
if pred_bbox_reg(n) exists
Hard-Neg_feature_vector[n]←pred_bbox_reg(n)
bbox_tmp←Hard-Neg_feature_vectors[n]
Hard-negative_example[n]←Class_bbox_redefine(bbox_tmp)
endfor
return |
As shown in Algorithm 1, the input value represents the learning images to which the CutMix, Mosaic and GrayScale policies acquired through augmentation policy optimization are applied. In the case where the objects of interest were included in the input image, when the IoU(Intersection over Union) threshold value of the predicted bounding box regression value and actual bounding box regression value was above 0.5, it was set as a positive example. Then, a hard-negative example was extracted through the predicted bbox regression value and confidence score within the positive example. In the case where the IoU threshold value of the predicted bounding box regression value and actual bounding box regression value was below 0.5, it was set as a negative example. Likewise, a hard-positive example was extracted through the predicted bbox regression value and confidence score within the negative example. Lastly, in the case where the objects of interest were not included in the input image, since it meant that all the detected objects of interest were negative examples, they were deemed hard-negative examples and were extracted. The output value calculated through the hard-example mining algorithm represents the hard-negative examples and hard-positive examples extracted from the pre-existing positive examples and negative examples. Since this serves as a factor that increases the false-positive and false-negative detection rates in the process of detecting the objects of interest, the class bounding box of the involved data was reset and added to the pre-existing transfer learning model, and the data were re-learned.
4. Result and Performance Evaluation
As far as the test environment for implementing the proposed occluded object detection model is concerned, the hardware and operating system consisting of Windows10 Pro, AMD Ryzen 5 1600 Six-Core Processor, NVIDIA GeForce RTX 2080 and RAM 16GB were used. In this study, a detection model of occluded object based on YOLO using hard-example mining and augmentation policy optimization was proposed.
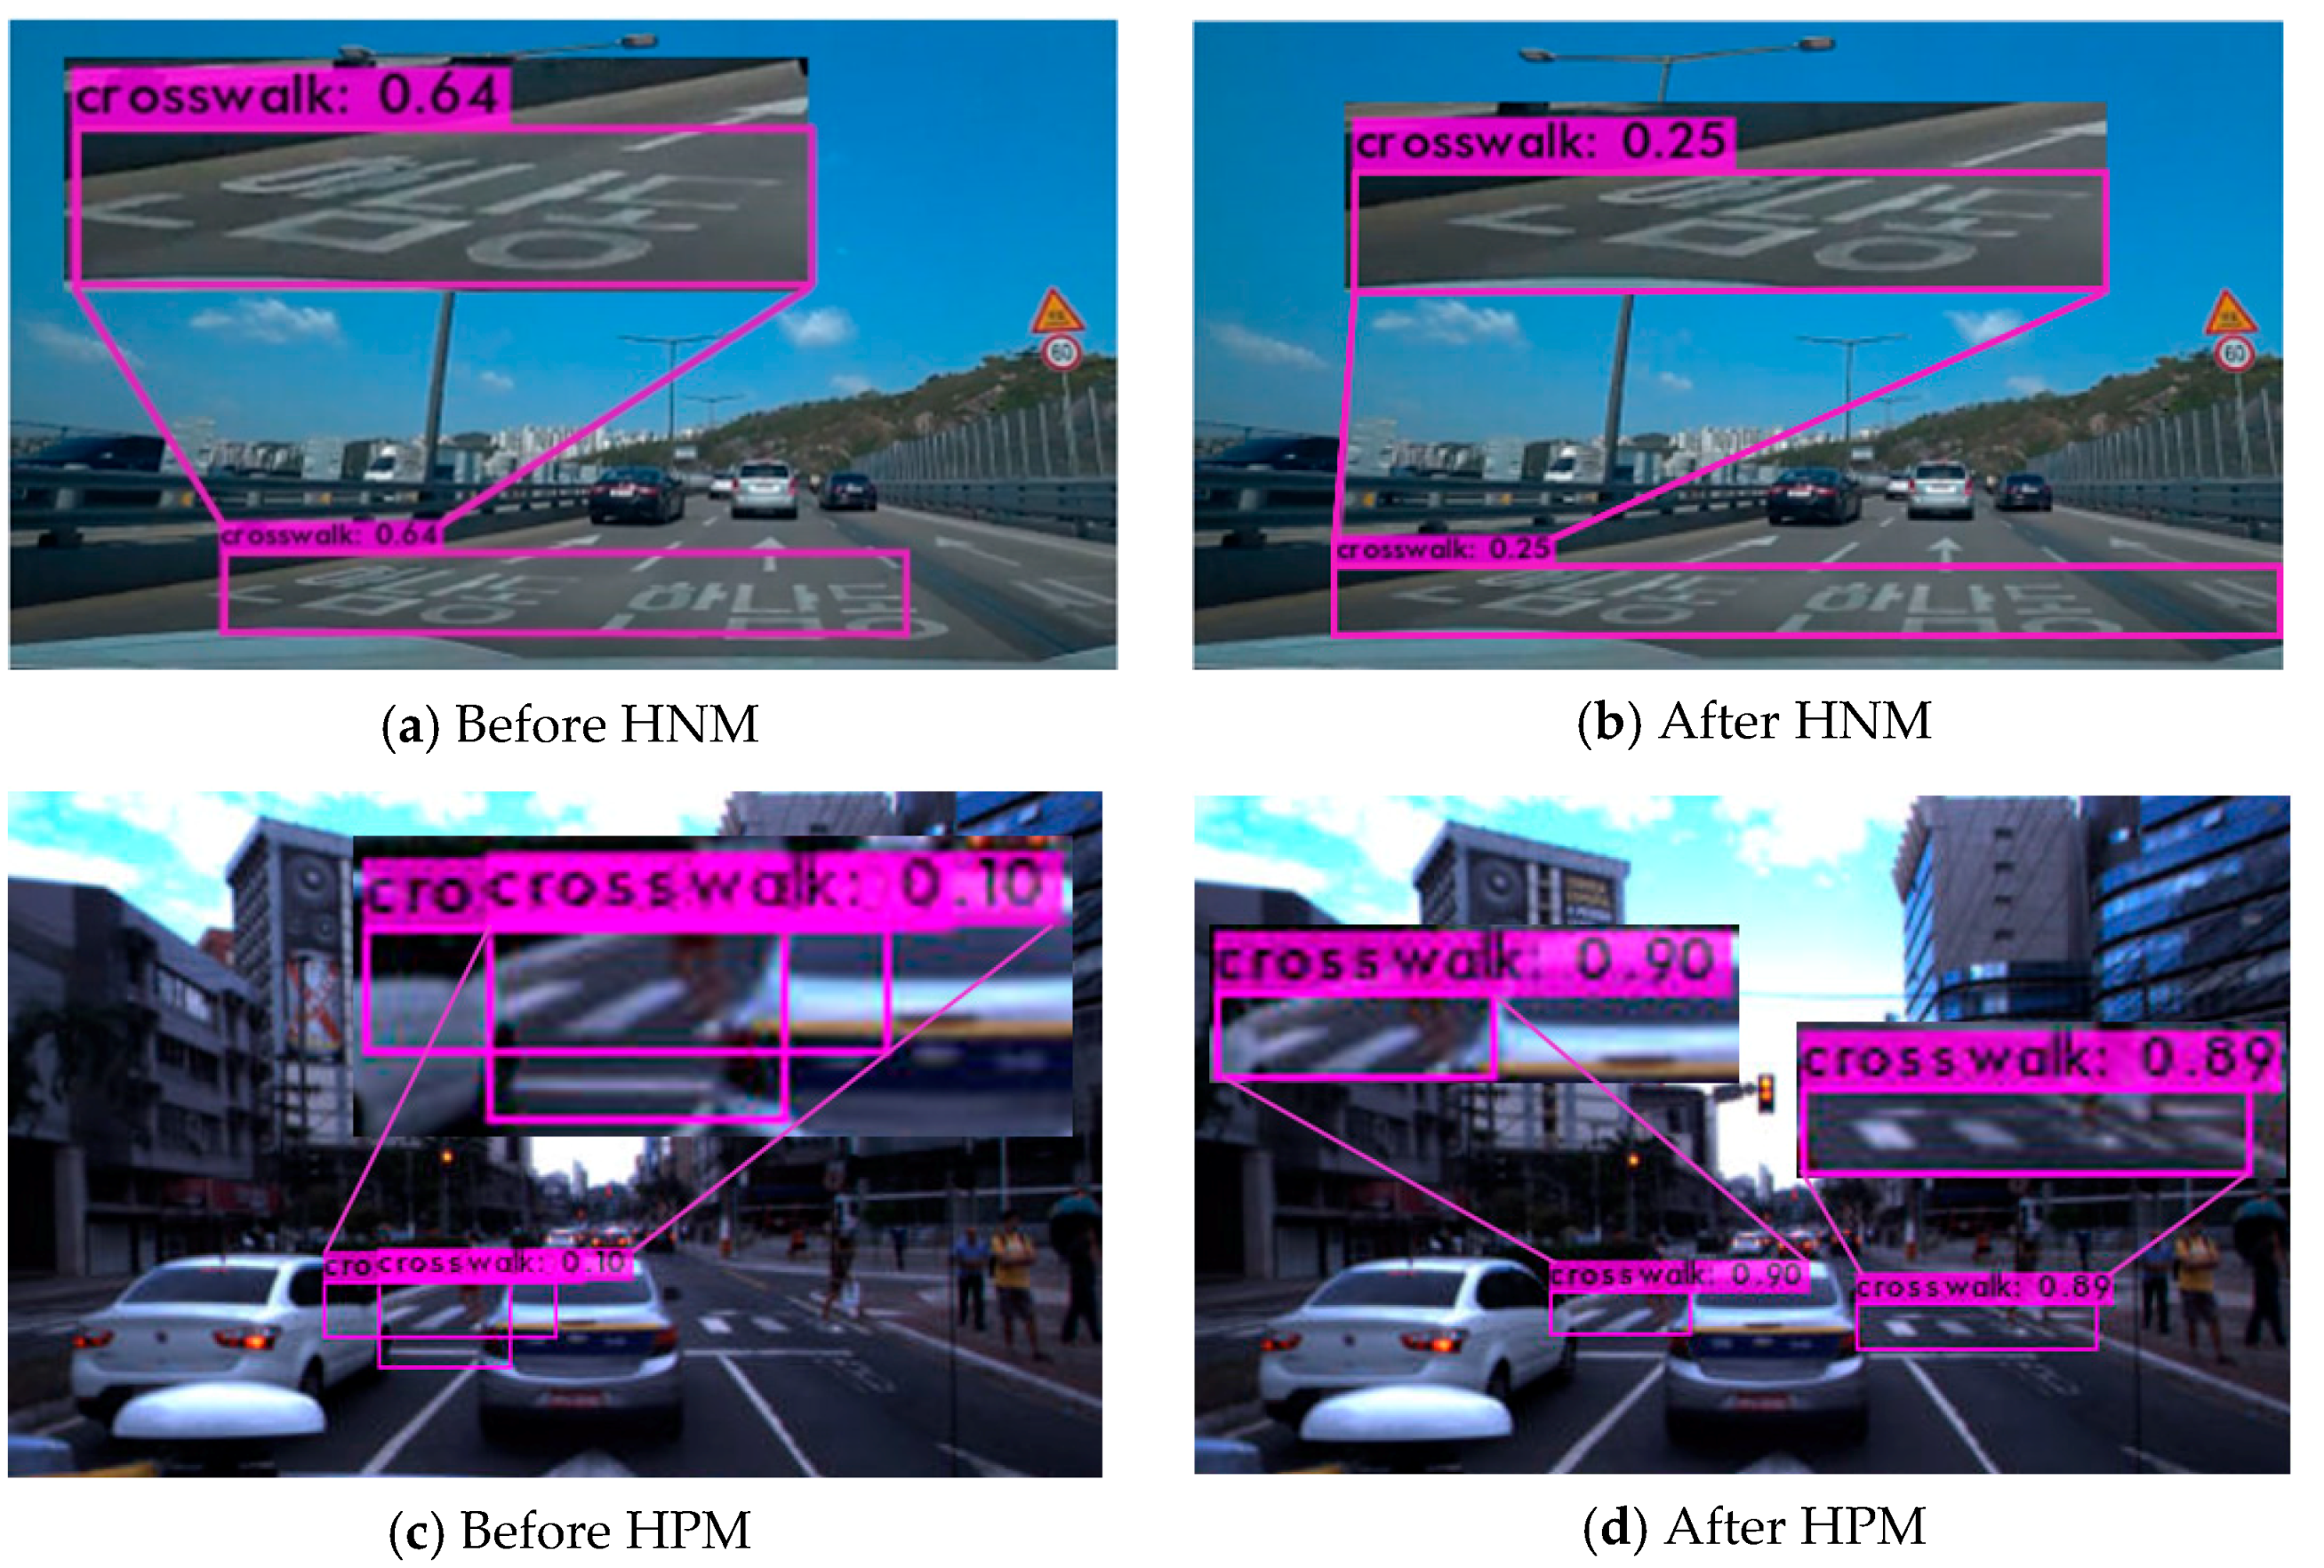
Figure 6 shows the crosswalk occlusion object detection results through the proposed hard-example mining.
Figure 6a,b shows the detection model results acquired by using Seoul road driving images as the test data, and
Figure 6c,d shows the detection model results acquired by utilizing the IARA data not used as learning data as the test data.
Figure 6a shows the YOLO-based crosswalk detection results of a hard-negative example before the application of hard-negative mining. Based on the detection results, it was confirmed that the traffic information on a road that is not a crosswalk was incorrectly detected as a crosswalk, and that the confidence score value was 0.64 at that point.
Figure 6b shows the detection results of a hard-negative example after the application of hard-negative mining, and it was confirmed that the confidence score value of the crosswalk was 0.25, and that the false-positive detection rate was greatly decreased.
Figure 6c shows the crosswalk detection results of a hard-positive example before the application of hard-positive mining. The involved example was a representative occlusion phenomenon, and the confidence score values were 0.09 and 0.10, and it was unable to detect the crosswalk due to the block objects in front. However, as
Figure 6d shows, based on the detection results acquired after the application of hard-positive mining, the confidence score values were enhanced to 0.90 and 0.89, and it was able to stably detect the objects that occluded the crosswalk in a road driving environment. The false-positive (64%) and false-negative(10%) objects generated in the pre-existing base model showed a false-positive detection rate of 25% and a true positive detection rate of 90%, respectively, meaning that the crosswalk object detection performance was greatly enhanced. As far as the real-life object detection is concerned, since the threshold value of the confidence score was 0.5, it was determined that the proposed model more stably detects crosswalk objects.
To evaluate the performance of the occluded object detection model proposed in this study, the performance evaluation for optimal augmentation policy configuration and the performance evaluation of the YOLO-based model to which the optimized augmentation policy and hard-example mining were applied were performed. To enhance the crosswalk occlusion object detection performance during road driving, the performance changes in diverse augmentation policies were observed. The mAP@0.5 (mean Average Precision) was used as the performance index for evaluation, and the gradient value was used as the mAP@0.5–based quantitative index. mAP is a value that expresses the precision values calculated based on the actual object-detected recall changes as one index, and is a representative performance evaluation index of an object detection algorithm [
41,
42]. Equation (1) represents the gradient index.
Equation (1) shows the relative changes in the mAP of the detection model before including the current augmentation policies and in the mAP of the detection model after including the current augmentation policies. At this point, the value is multiplied by 100 and 100 is subtracted from the value for the convenience of calculation through the normalization of performance changes. This allows each gradient index to be applied as a same-level scale, and has a positive effect on understanding the model performance changes. If the involved index value is a positive number, this means that the mAP increases, and, if the involved index value is a negative number, this means that the mAP decreases. Accordingly, the detection performance changes were objectively evaluated through the involved gradient index values.
Table 2 shows the detection performance results for various augmentation policies [
29,
42].
As shown in
Table 2, the CutMix policy showed the highest gradient value of 7.01. This showed better detection performance changes in comparison to the previously included MixUp and CutOut policies. CutMix is a policy created by mixing the strengths of the pre-existing MixUp and CutOut methodologies, and the objective performance difference was confirmed through the involved test results. The Mosaic policy showed the second highest gradient value of 6.21. Four random learning images were mixed into one image and were used for model learning, and it was confirmed that this policy had a positive influence on the learning efficiency and accuracy. Lastly, the Grayscale policy showed a high increase in terms of detection performance changes, and showed a gradient value of 4.08. The involved policy is a method that simply applies the black-and-white processing to the previously learned images. However, by examining the universal features of the learned images used in this study to detect crosswalk objects, it was possible to reason the grounds for high performance results. It was assumed that the difference between the black color of the asphalt-paved road and the white color displaying the crosswalk emphasized the features of the crosswalk through black-and-white processing and had a positive influence on the performance. Based on the test results, it was confirmed that the policies other than CutMix, Mosaic and Grayscale showed a mAP change that was either a negative number or low, so they were excluded from the optimal augmentation policy group. After completing the augmentation policy performance valuation, the optimal polices were selected and applied to the YOLO model for detection together with hard-example mining. Then, the performance evaluation involving the following models was conducted: the BASE+BASE model serving as the pre-existing base model, the HEM+BASE model to which hard-example mining was applied without augmentation policy optimization, the APO+BASE model to which augmentation policy optimization was applied without hard-example mining, and this study’s HEM+APO model to which augmentation policy optimization and hard-example mining were applied.
Table 3 shows the detection performance results for the occluded object detection model proposed in this study and for the pre-existing model [
8,
18].
As shown in
Table 3, a comparison was made between the BASE+BASE model and the HEM+BASE model, and it was confirmed that HEM+APO model showed the highest mAP value of 90.49%. In addition, as shown in the F1-score performance index, the proposed model showed an F1-score value of 0.9027 and showed higher performance than the other three models that showed F1-score values of 0.7502, 0.8784 and 0.8568, respectively. The HEM+BASE model showed an mAP value that was 13.47%p higher than that of the pre-existing base model. It seemed that the model to which hard-negative mining and hard-positive mining were applied showed better performance in detecting crosswalk occlusion objects compared to the pre-existing model, and the model demonstrated the effective true-positive detection of hard-example objects serving as causes that degrade detection performance. The APO+BASE model showed an mAP value that was 12.81%p higher than that of the pre-existing base model. It seemed that the model to which augmentation policy optimization were applied showed better performance compared to the pre-existing model. Thus, it demonstrated that more precise detection of occlusion objects can be achieved by applying CutMix, Mosaic, and Grayscale policies. In addition, the HEM+APO model showed an mAP value that was 1.88%p higher than that of the HEM+BASE mode. This model effectively overcame the data imbalance problem that is likely to occur in the object detection process for road driving through augmentation policy optimization.
In this study, we proposed a detection model of occluded objects based on YOLO using hard-example mining and augmentation policy optimization. In comparison to the pre-existing model, the proposed model more precisely detected the occluded objects during road driving, and the accuracy performance was enhanced as well. However, this study is limited in that the occlusion objects relating to multiple classes were not taken into consideration, because the proposed model was designed to detect occlusion objects relating to a single class known as a crosswalk. In addition, since the size of the IARA and GOPRO data sets for model training was not big enough, there is a possibility that the performance may be improved. In the future study, continuous tests must be conducted to take into consideration the occlusion phenomenon involving diverse objects of interest other than crosswalk objects that may occur in a road driving environment. In addition, diverse types of training data sets should be additionally collected and used for neural network learning and the pre-existing limitations should be supplemented to improve the performance of the occluded object detection model developed.
5. Conclusions
As limitations on the means of transportation are significantly decreased due to progress in road traffic technology, the number of modern people who own a vehicle continues to increase, and this leads to diverse traffic problems. As one of the plans to reduce the number of car accidents, self-driving technology development is attracting greater attention. The core of self-driving technology is object detection technology, and studies on object detection during road driving are being actively conducted. However, since the several pre-existing studies did not carefully take into consideration the occlusion phenomenon that may occur in a road driving environment, they were limited in that they experienced an increase in the false-negative detection rate. Other previous surveys have used a variety of traditional and modern object detection algorithms to consider occlusion objects. However, the number of training data and the limitations for data pre-processing require further improvement. In addition, an increase in the false-positive detection rate that may occur due to objects or noises similar to the objects of interest has a negative influence on detection performance. In this study, a detection model of occluded object based on YOLO using hard-example mining and augmentation policy optimization was proposed. This model extracted the hard-positive objects resulting from the occlusion phenomenon in a road driving environment and the hard-negative objects likely to be incorrectly determined as objects of interest based on the confidence score and the boundary information of the detected classes. Then, fine-tuning that applies transfer learning to the pre-trained weights was conducted, and a robust detection model suitable for hard examples was developed. In addition, the model pre-processing process for occlusion detection and the augmentation policies were optimized through a gradient-based performance comparison, and the optimized policies suitable for learning data were strategically selected. Based on the evaluation results, the YOLO-based occluded object detection model proposed in this study showed an mAP value of 90.49% and an F1-score value of 90%. This showed the highest performance compared to the base model and the model to which no policy optimization was applied. Accordingly, as this model effectively overcame the data imbalance problem that degrades the performance of an object detection model in a self-driving environment and more precisely and more accurately detected the occluded objects that were difficult to detect in the past, it enabled object detection for self-driving in diverse environments.


