Article

Anomaly Detection Using Deep Neural Network for IoT Architecture

1
Faculty of Computer Science and Information Technology, Universiti Malaysia Sarawak, Kota Samarahan 94300, Malaysia
2
Department of Electrical Engineering, College of Engineering, King Khalid University, Abha 62529, Saudi Arabia
3
Faculty of Computing and Informatics, Universiti Malaysia Sabah, Jalan UMS, Kota Kinabalu 88400, Malaysia
4
Department of Computer Science and Engineering, Hanyang University, Seoul 04763, Korea
5
Centre for Cyber Security, Faculty of Information Science and Technology (FTSM), Universiti Kebangsaan Malaysia, Bangi 43600, Malaysia
6
Faculty of Computing & Informatics, Multimedia University, Persiaran Multimedia, Cyberjaya 63100, Malaysia
7
Post-Graduation Program on Electrical Engineering, Federal University of Piauí (UFPI), Teresina 64049-550, PI, Brazil
8
Covilhã Delegation, Instituto de Telecomunicações, 6201-001 Covilhã, Portugal
*
Authors to whom correspondence should be addressed.
Appl. Sci. 2021, 11(15), 7050; https://doi.org/10.3390/app11157050
Submission received: 9 May 2021 / Revised: 28 June 2021 / Accepted: 12 July 2021 / Published: 30 July 2021
(This article belongs to the Section Robotics and Automation)

Abstract

:
The revolutionary idea of the internet of things (IoT) architecture has gained enormous popularity over the last decade, resulting in an exponential growth in the IoT networks, connected devices, and the data processed therein. Since IoT devices generate and exchange sensitive data over the traditional internet, security has become a prime concern due to the generation of zero-day cyberattacks. A network-based intrusion detection system (NIDS) can provide the much-needed efficient security solution to the IoT network by protecting the network entry points through constant network traffic monitoring. Recent NIDS have a high false alarm rate (FAR) in detecting the anomalies, including the novel and zero-day anomalies. This paper proposes an efficient anomaly detection mechanism using mutual information (MI), considering a deep neural network (DNN) for an IoT network. A comparative analysis of different deep-learning models such as DNN, Convolutional Neural Network, Recurrent Neural Network, and its different variants, such as Gated Recurrent Unit and Long Short-term Memory is performed considering the IoT-Botnet 2020 dataset. Experimental results show the improvement of 0.57–2.6% in terms of the model’s accuracy, while at the same time reducing the FAR by 0.23–7.98% to show the effectiveness of the DNN-based NIDS model compared to the well-known deep learning models. It was also observed that using only the 16–35 best numerical features selected using MI instead of 80 features of the dataset result in almost negligible degradation in the model’s performance but helped in decreasing the overall model’s complexity. In addition, the overall accuracy of the DL-based models is further improved by almost 0.99–3.45% in terms of the detection accuracy considering only the top five categorical and numerical features.

1. Introduction

IoT is a revolutionary computing paradigm that has evolved rapidly over the last decade in almost every technological domain, such as smart homes, smart industries, smart transportation, smart healthcare [1,2,3,4], use of sensors [5,6,7,8], smart cities, and satellites [9], to name a few [10]. It comprises many IoT devices (Things) equipped with different sensors, actuators, storage, computational and communicational capabilities to collect and exchange data over the traditional internet [11]. The data captured and processed within the IoT network is of a sensitive nature that demands security from possible intrusions. Different security mechanisms such as firewalls, authentication schemes, different encryption methods, antiviruses, etc., are currently used to protect sensitive data from possible security attacks [12,13,14] on vulnerable devices [15,16,17] like the distributed denial of service (DDoS) attacks [18,19,20,21] as the first line of defense. IoT can implement using software-defined networking [SDN] [22,23,24], future network architecture [25,26,27,28], named data networking (NDN) [29,30,31] and cloud computing network [32] with voice over IP (VoIP) [33,34,35,36] fiber optics [37,38,39], worldwide interoperability for microwave access (WiMAX) [40,41,42], deep learning (DL) [43], artificial intelligence (AI), and machine learning (ML) [44].
Due to the involvement of a huge amount of data, many new anomalies (either novel or the mutation of an old anomaly) are being generated very frequently. Thus, an intrusion detection system (IDS) that can act as a second line of defense can provide extra protection to an IoT network against security attacks. An IDS can be classified based on the deployment method and detection methodology. An IDS can be host-based IDS or a network-based IDS based on its deployment, but it can also be signature-based, anomaly detection-based, specification-based, or hybrid detection based on the detection method [45,46]. For this study, our focus is to provide security to the IoT at the entry points by adopting the network-based IDS (NIDS) using the anomaly detection-based detection strategy.
The main problem with the current IDSs is the increase in the False Alarm Rate (FAR) in detecting the zero-day anomalies [47]. Researchers have recently explored the possibility of using machine learning (ML), and deep learning (DL) approaches to improve detection accuracy and reduce the FAR for NIDS. Studies have shown that both ML and DL methodologies are efficient tools to learn valuable patterns from the network traffic to classify the flows as an anomaly or benign [48]. The DL has shown efficiency in learning valuable features from the raw data due to its deep architecture without human involvement, highlighting its importance of usage within NIDS for IoT networks.
Deep Neural Networks (DNNs) are critical DL algorithms widely explored by researchers in different fields such as natural language processing, computer vision, and network security, etc. DNNs have performed exceptionally well in those fields due to their deep architecture to provide multiple abstractions for learning complex features for efficient predictions [49]. These attributes of DNN have made it an ideal methodology to be adopted for an IDS designed for an IoT network due to the involvement of a massive amount of data generated by IoT devices. In this study, we focus on the possibility of utilizing DNN for proposing an efficient NIDS solution within the framework of IoT.
The main contributions of this study are four-fold. (1) To extensively discuss the state-of-work DL-based NIDS methodologies. (2) To propose an effective anomaly detection method for an IoT network using the DNN. (3) To test the efficiency of our model, we wanted to evaluate it by using the IoT-Botnet 2020 dataset and compare the performance of our model against different NIDS models based on different supervised DL algorithms. (4) To explore the importance of numerical and categorical features on the performance of DL-based NIDS models.
The rest of the paper is organized as follows: Section 2 provides related literature on the recent works on artificial intelligence-based NIDS solutions for IoT. Section 3 details the crucial concepts and the methodology adopted in this study. Section 4 extensively discusses the dataset, experimental setup, and results, along with the discussion. Finally, this research article is concluded in Section 5.

2. Related Work

Researchers widely explore artificial intelligence (AI) methods such as ML and DL to propose efficient NIDS solutions over the last decade. It was observed from the recent trends on NIDS that DL algorithms are preferred over ML during the past three years due to the advancement in Graphical Processing Units (GPUs) technology, which have solved the fast computation requirement of the DL algorithms [50]. This has motivated the researchers to use the DL algorithms to propose efficient security solutions in an IoT network that process vast amounts of raw data. The DL can learn the complex pattern by utilizing its deep structure and help in classifying the benign and anomaly traffic.
Researchers in the context of NIDS widely utilize ML algorithms. For instance, Ali et al. proposed an IDS using a fast-learning network with the particle swarm algorithm [51]. Although efficient enough to predict most attacks, their model’s performance in detecting the minority class label was not very promising. Similarly, Shen et al. proposed their methodology using the ensemble approach considering multiple extreme learning machines by utilizing the BAT optimization algorithm during the ensemble pruning stage [52]. In another notable work, a multilevel semi-supervised ML model is proposed by Yao et al. by combining the clustering concept with the Random Forest (RF) algorithm [53]. Their methodology performed well in detecting the attack classes due to multiple levels.
Researchers also adopt different hybrid approaches to combining ML and DL methods to develop efficient NIDS solutions. The DL methods are explored in all those methodologies for feature reduction and complexity reduction purposes, followed by an ML predictor. For instance, a hybrid approach of combining autoencoder (AE) and the RF is adopted by Shone et al. by only utilizing the encoder part of AE [54]. Their nonsymmetric solution performed well in detecting the anomalies except for few labels due to lower instances. Similarly, another hybrid idea is given by Yan et al. by combining sparse AE with support vector machine (SVM) [55]. This methodology also struggled to detect the minority anomaly labels. Another hybrid approach is coined by Marir et al. by using the ensemble approach utilizing the voting to combine the deep belief network (DBN) with SVM [56].
Researchers have also used standalone DL [57,58] algorithms such as AE, recurrent neural network (RNN), DBN, convolutional neural network (CNN), Morlet wavelet neural network (MWNN) [59], etc., to propose efficient NIDS models. For instance, an RNN based NIDS is proposed by Xu et al. by utilizing Gated Recurrent Units (GRUs) as the memory unit [60]. Similarly, a CNN-based solution is presented by Xiao et al. by using the principal component analysis and AE for feature extraction tasks followed by CNN for prediction [61]. Their proposed methodology only performed well for the class label with a more significant number of instances. Another highly complex NIDS solution is provided by Jiang et al. by combining the CNN with the bidirectional Long short-term memory (LSTM) [62]. Wei et al. provided a complex solution based on the combination of different optimization algorithms such as particle swarm, fish swarm, and genetic algorithms with the DBN.
The NIDS solutions are also being proposed by many researchers using the DNN approach. For instance, an efficient DNN-based NIDS is proposed by Jia et al., consisting of four hidden layers [63]. The model achieved high-performance results to classify the KDD cup’99 and NSL-KDD datasets. Their proposed solutions did not perform efficiently in detecting User to Root (U2R) attack instances. Another notable work proposed by Wang, who proposed and DNN-based IDS for the adversaries, is studying the role of each feature in producing adversarial examples [64]. Similarly, a hybrid scalable DNN framework is proposed by Vinayakumar et al. for the host and network-level intrusion detection by implementing on Apache Spark cluster computing platform [65]. They evaluated their proposed methodology on many new and old datasets to show the superiority of their proposed solution.
Based on the analysis of the related literature, it is observed that most of the proposed solutions struggled to detect the minority class labels efficiently. This is because DL methods require a considerable amount of data for training. In such a case with very few samples within a dataset for a certain class, the DL algorithm will not learn enough complex patterns and will result in incorrect predictions for those labels. Moreover, for an IoT network, the research on the DL-based IDS is still in the early days, and there is plenty of room for more research in this domain. To this end, we propose a DNN-based NIDS solution for an IoT network. Notably, we discover the importance of the features in the performance of DL methods for an IoT network.

3. Proposed Methodology

This section details the essential concepts and methodology adopted for implementing and evaluating the DL-based anomaly detection solutions.

3.1. Deep Neural Network (DNN)

DNN belongs to the family of supervised learning algorithms to train the model using multiple layers. The DNN adopted in this study is based on the idea of the feed-forward artificial neural network with multiple hidden layers to enhance the abstraction features for increased capability [66]. DNN structure consists of input layers, multiple hidden layers, and an output layer as shown in Figure 1. Let X = { x 1 , x 2 , , x n } is the input vector with n = 86 features. Similarly, Y = { y 1 , y 2 } is the output vector containing the probability values in the range of [ 0 , 1 ] for classifying anomaly and benign traffic. The output calculation of each hidden layer H i is mathematically given as:
H i ( x ) = A ( w i T x + b i )
where, A ( . ) represents the nonlinear activation function, w i and b i represents the weight and bias of the hidden layer i . The activation functions used in this study are ‘ R e L U ’ for hidden layers and ‘ s i g m o i d ’ for the output layer that is calculated using the mathematical formulas given as,
R e L U ( x ) = max ( 0 , x )
s i g m o i d ( x ) = 1 1 + e x
The DNN structure used in this study consists of an input layer with 80 ,   32 ,   16 , and 8 neurons representing the numerical feature set. Then, we used four dense layers with 2 10 , 2 9 ,   2 8 and 2 7 neurons followed by a sigmoid classification layer considering two outputs to represent the anomaly and benign traffic classification. Similarly, for the experiment considering both the numerical and categorical features, the input layer is furnished with only five neurons, followed by two dense layers with 2 8 and 2 7 neurons and the output layer with a sigmoid activation function to classify the network traffic into benign and anomaly traffic.

3.2. IoT Architecture

The IoT has revolutionized future networks in recent years with the potential to improve the overall quality of life efficiently. It contains a vast network of interconnected internet-enabled devices called IoT devices, equipped with a wide range of sensors, storage, computational, and communication capabilities. It generates a massive amount of critical data shared over the internet and is needed to be secured.
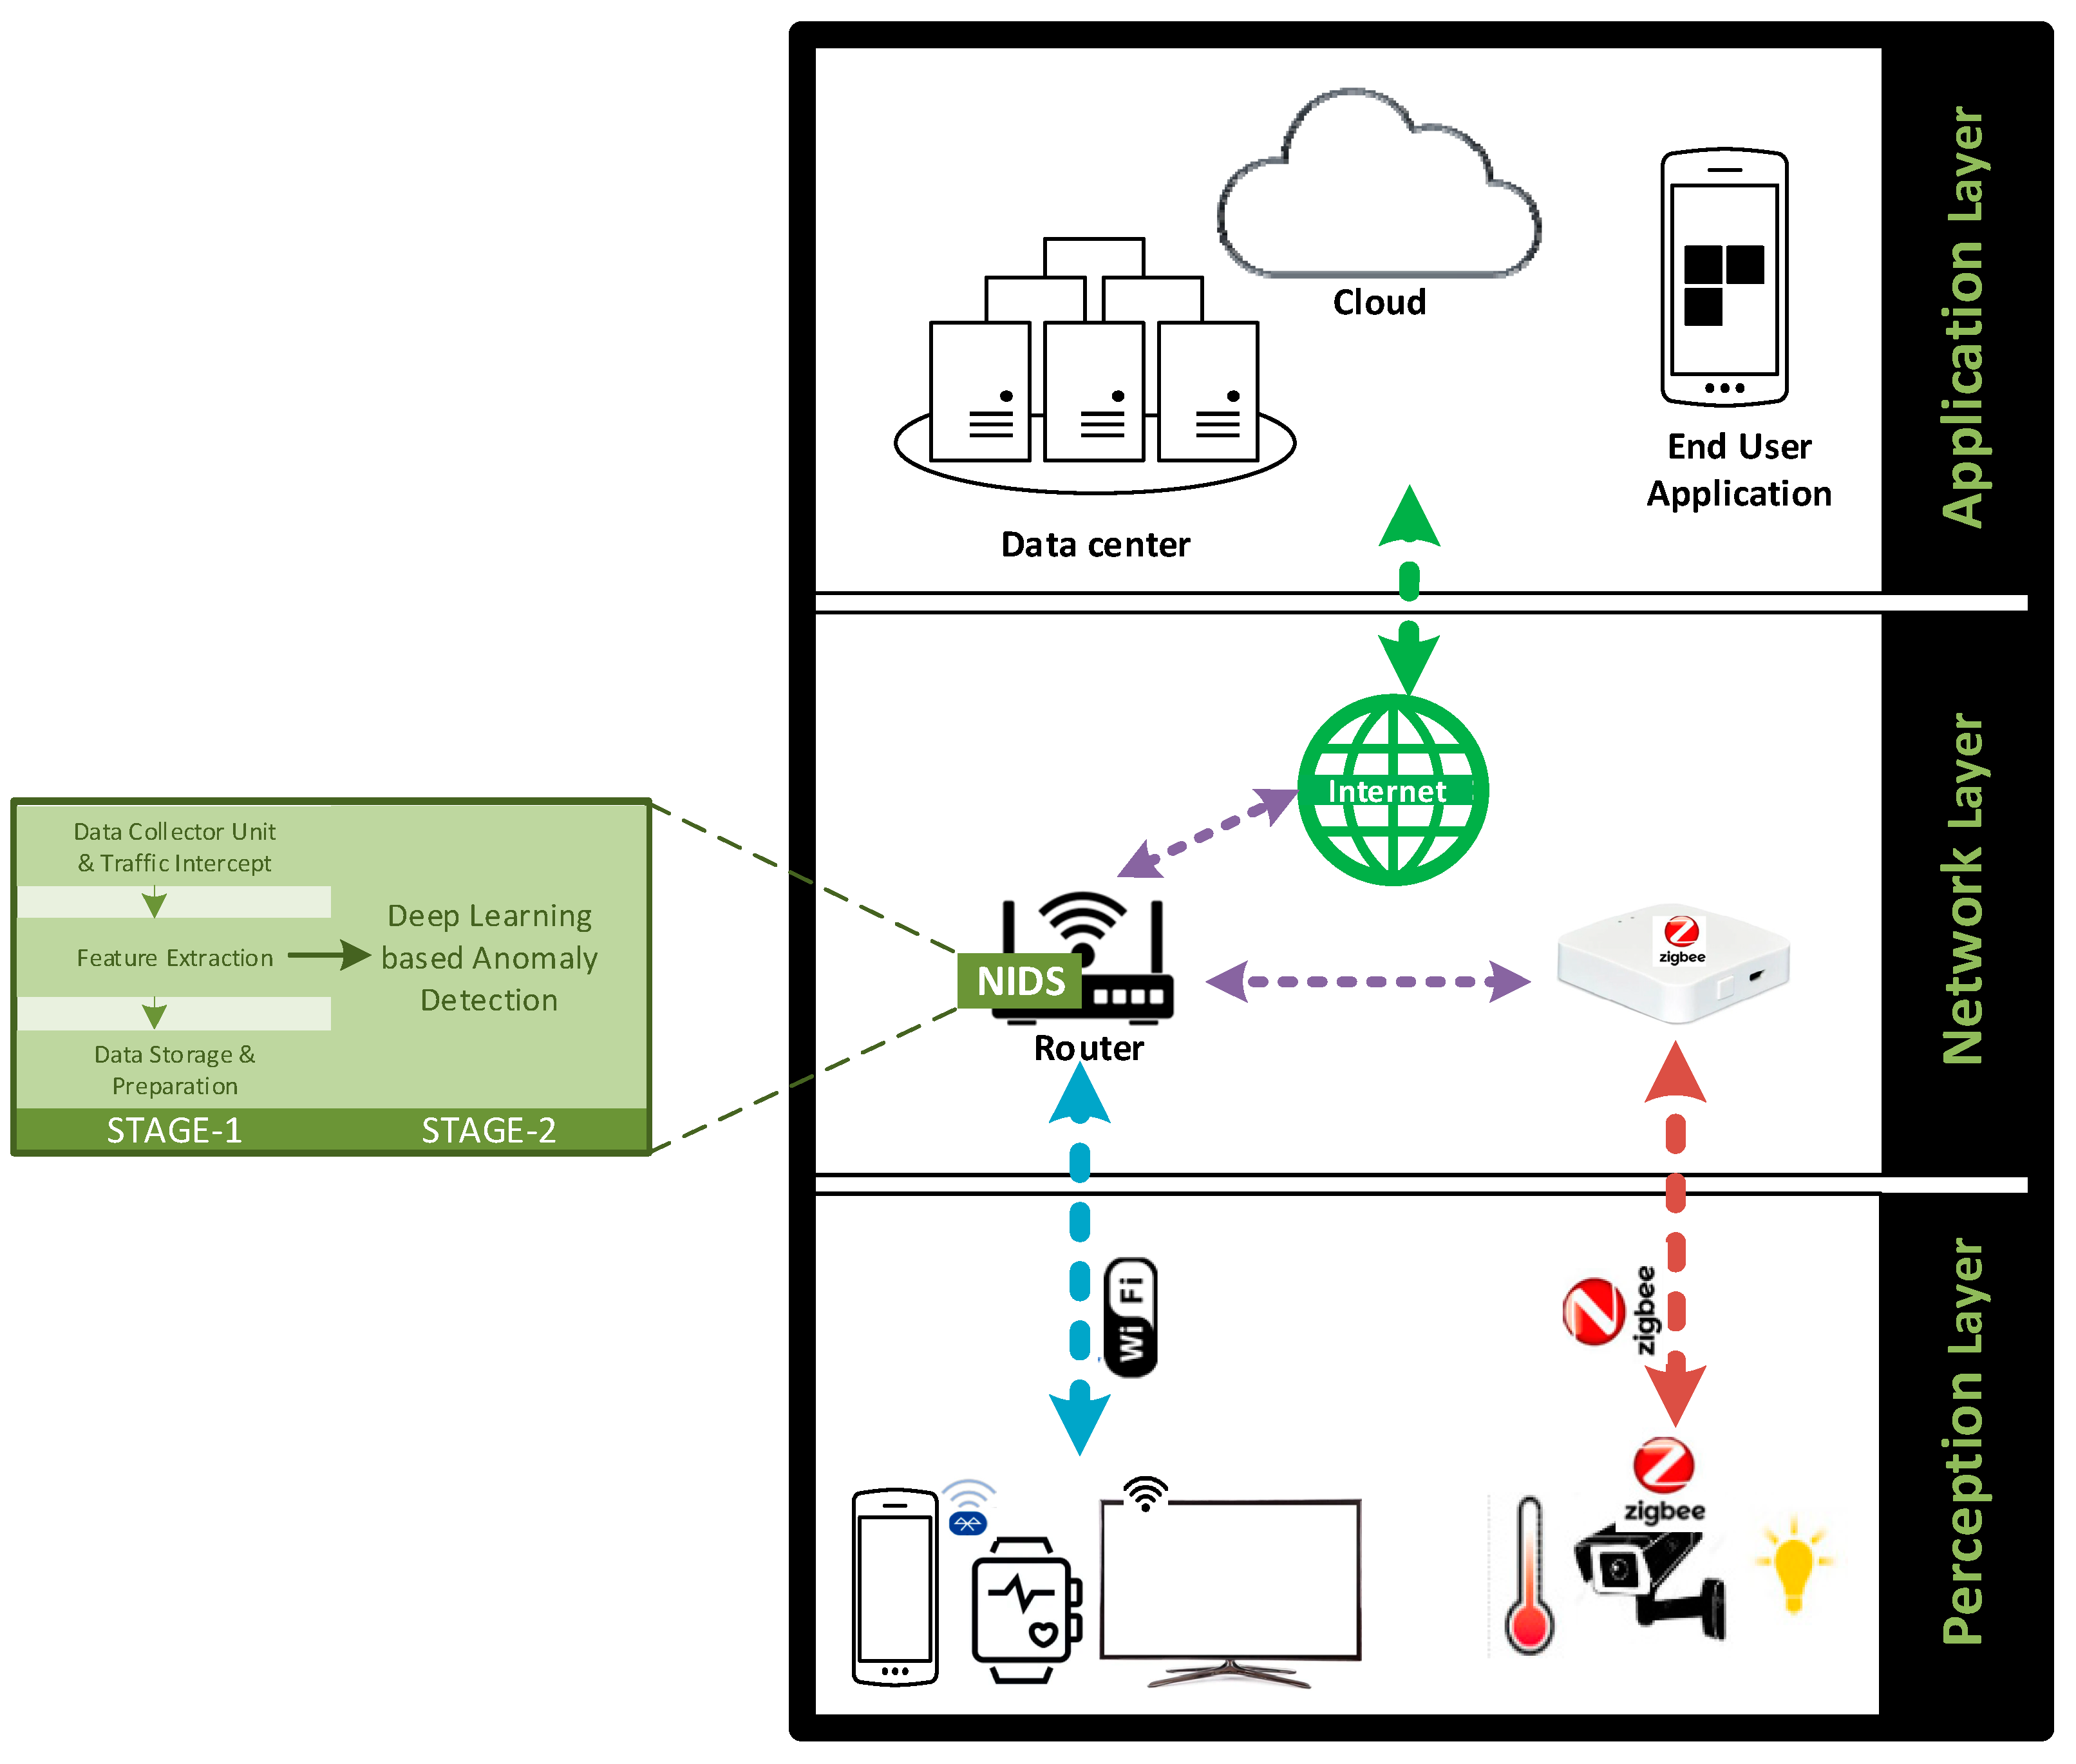
A typical three-layer IoT architecture [67] is depicted in Figure 2. It consists of a perception layer, network layer, and application layer. The perception layer is the lowest, also called the physical layer. It involves the different devices, sensors, actuators, etc., that constantly gather information and then exchange using different communication standards and protocols like Bluetooth, Wi-Fi, ZigBee, and 6LowPAN, etc. The network layer, also called the transport layer, is responsible for the smooth transmission of the packets using the different communication standards as 4G, 5G, Wi-Fi, ZigBee, IPv6, etc. The final layer is the application layer, which processes the data for visualization for end users’ applications, e.g., smart health monitoring. Some of the protocols used in this layer are the Constrained Application Protocol (CoAP) and Data Distribution Service (DDS) etc. [68].
The most suitable position to deploy the NIDS for the three-layered IoT architecture is the entry points of the network—e.g., an edge router as shown in Figure 2—to provide the needed protection to the network against anomalies. In this study, the considered NIDS is a two-stage solution, comprised of the data capturing and preparation stage (Stage-1 in Figure 2), followed by the DL-based anomaly detection stage (Stage-2 in Figure 2). In stage-1, the data will be collected and intercepted either within the network such as IoT devices or from outside of the IoT network through the internet. The useful feature extraction task will be performed followed by the data preparation for the DL stage. In stage-2, the prepared data will be processed by the DL-based anomaly detection model to detect the anomaly traffic to protect the IoT network.

3.3. Methodology

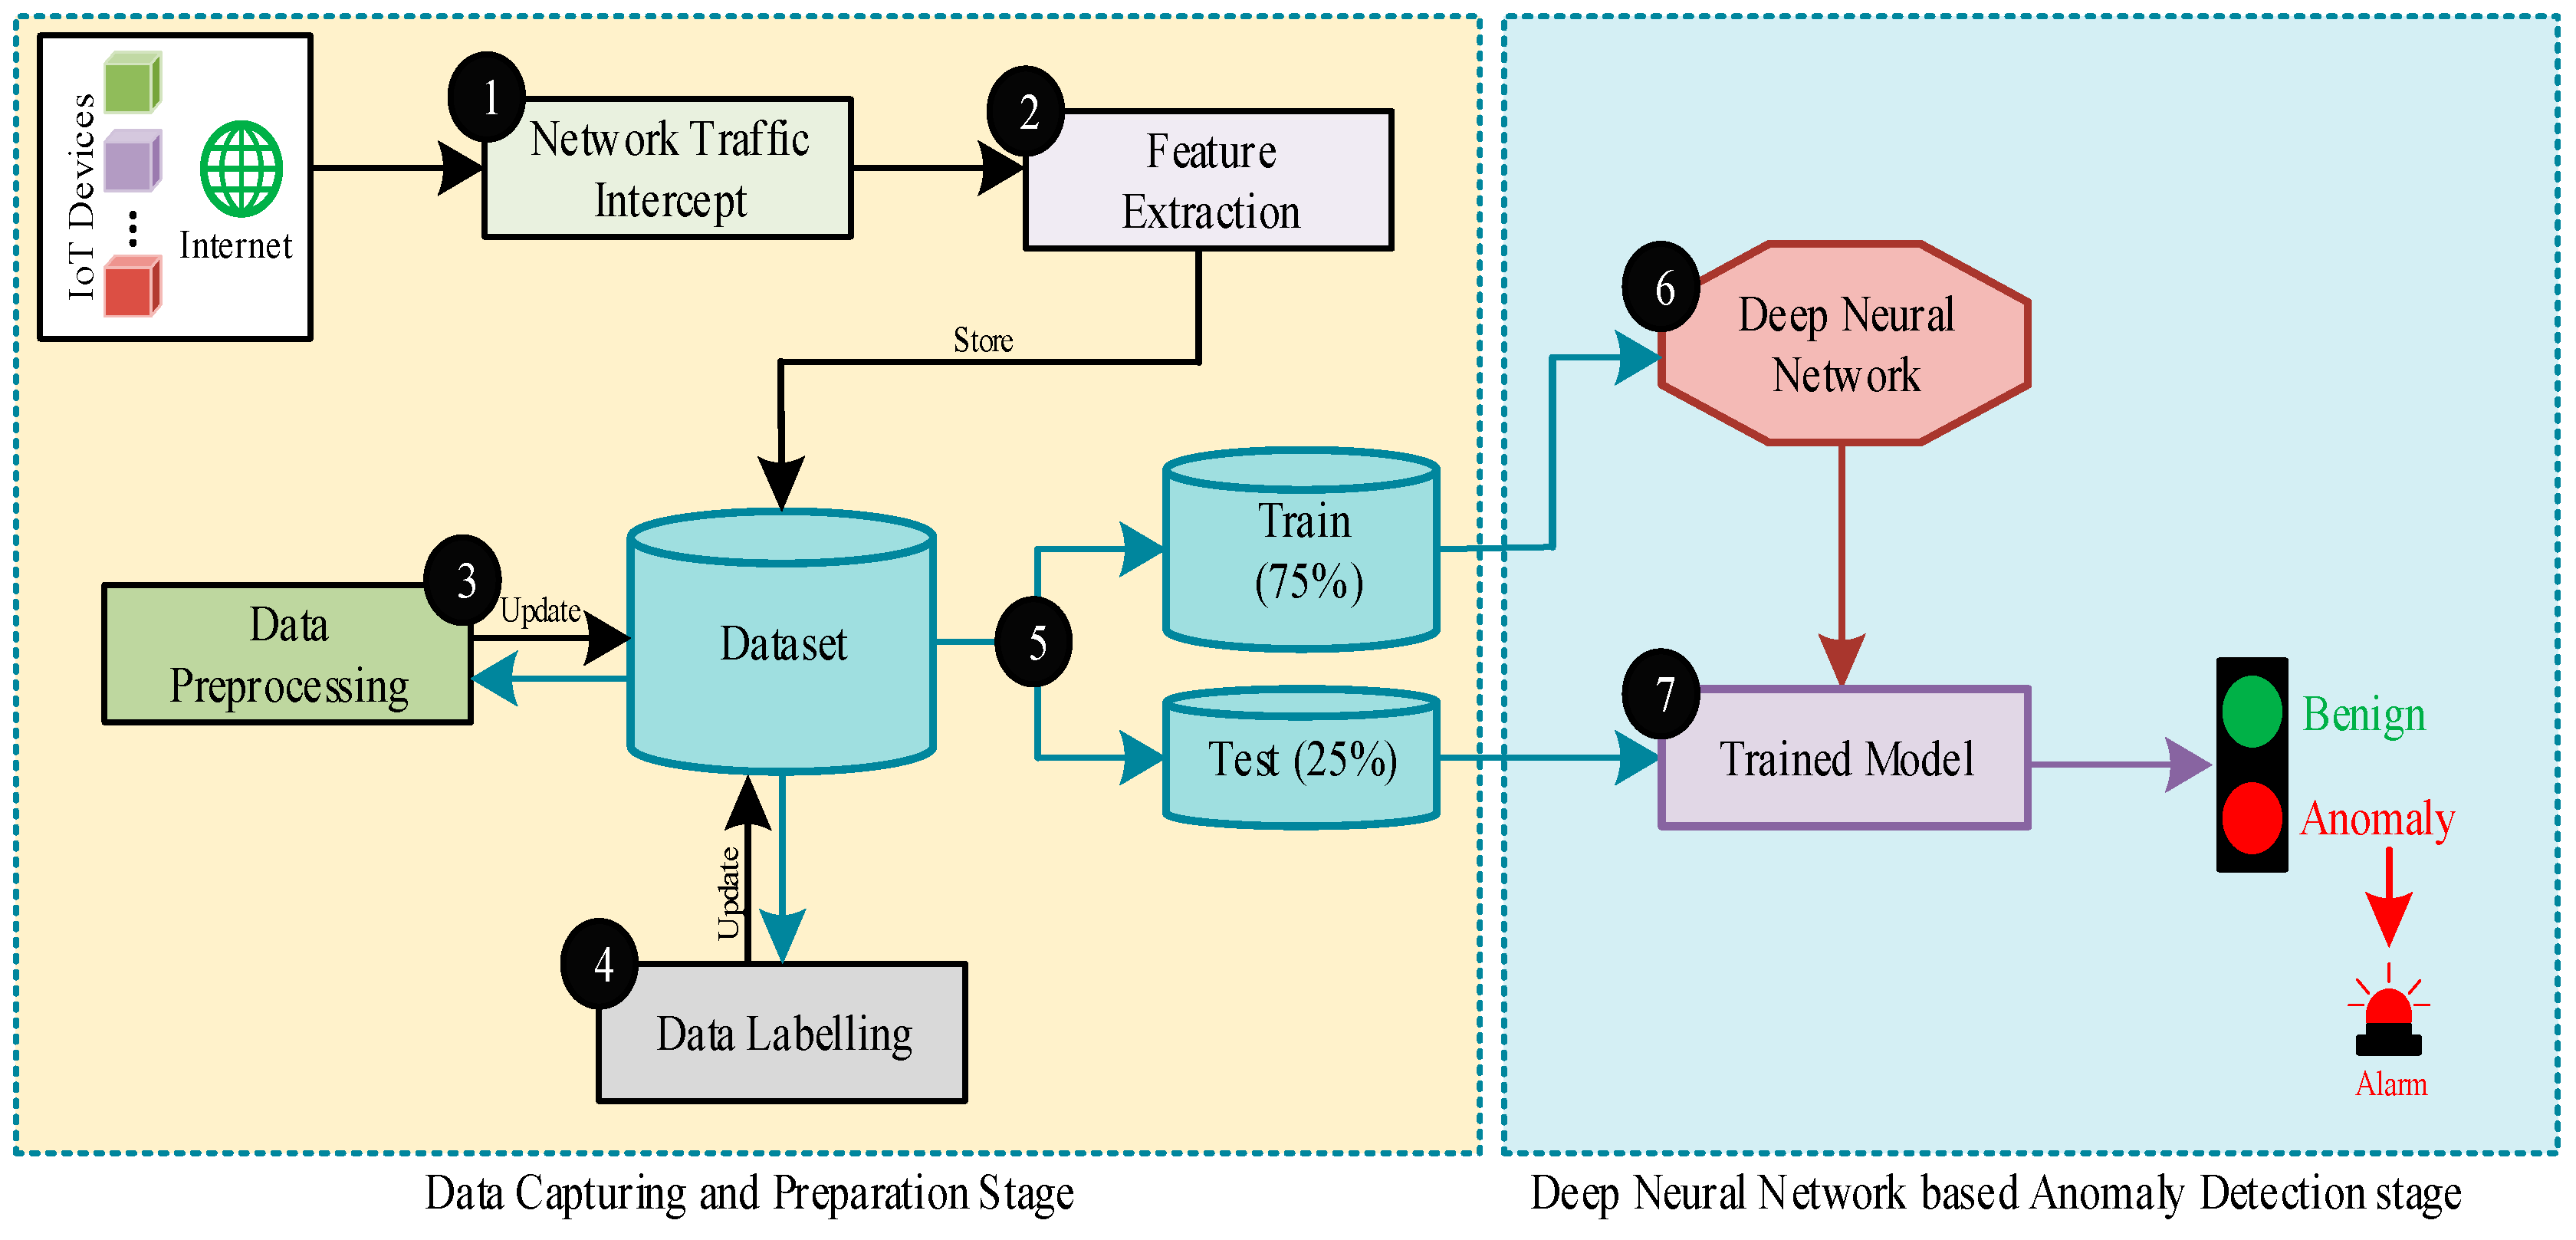
This study considered a two-stage IDS solution to protect the IoT network from possible intrusions, as depicted in Figure 3. The different stages of our considered model are the (1) Data Capturing and Preparation stage and (2) Deep Neural Network-based Anomaly detection stage. The different steps followed to implement and evaluate DL models includes,
Step-1:
The IoT network traffic is intercepted using network sniffing tools. For this purpose, some openly available tools such as tcpdump and Wireshark can be used [69]. The main task is to capture and then analyze the network packs by examination and visualization [70].
Step-2:
The features are being extracted from the network packets and are stored in a dataset.
Step-3:
The extracted features are then preprocessed to remove the redundant flows, normalize the continuous features, and encode the categorical features using one-hot encoding.
Step-4:
The dataset is labeled as the Benign record and Anomaly record to prepare for the binary classification scenarios.
Step-5:
The dataset is then split into 75% Train dataset and 25% Test dataset.
Step-6:
The DNN is then trained on the Train dataset by selecting the Benign and Anomaly Labels as target features utilizing the binary classification. This step results in a trained DNN model.
Step-7:
The trained model is then tested using the Test dataset to predict the records as either Benign or Anomaly flows. If the Benign traffic is predicted, it was allowed to pass through without taking any action. While on the other hand, if an Anomaly is predicted, an alarm signal is given to the network administrator to take further actions.

4. Experimental Results and Analysis

This section provides the details about the dataset and the evaluation metrics considered for evaluation purposes, followed by the experimental setup and the discussion of the results.

4.1. Dataset Description

For evaluating the performance of the DL methodologies considered in this study, we used the publicly available dataset IoT-Botnet 2020 [71]. This dataset is available in comma-separated values (CSV) format and is adopted from Pcap files of the BoT-IoT dataset [72] by generating many more network and flow-based attributes. A detailed description of the number of records for Benign and Anomaly labels in the original dataset and this study is given in Table 1. The original dataset contains the samples of different types of attacks such as Denial of Service, Distributed Denial of Service, Reconnaissance, and information theft attacks. We selected the benign samples from the original dataset, while for the anomaly class, we considered the random samples from each anomaly class for fair model evaluation.
The original dataset contains a total of 85 features of different data types such as integer, float, and categorial, as detailed in Table 2. Among those 85 features, we perform experiments to find out the performance of different DL algorithms, considering the 80, 32, 16, 8 best numerical features and 5 best categorical-numerical features calculated using the mutual information (MI).
The MI is an important concept in the information theory, which provides the average reduction in uncertainty of one random variable provided the information of other variables. Mathematically, MI is given as [73]:
I ( U ; V ) = u ϵ U v ϵ V p ( u , v ) log p ( u , v ) p ( u ) p ( v )
where, I ( U ; V ) is the MI between two random discrete variables, U and V , such that U = { u 1 , u 2 , , u k } and V = { v 1 , v 2 , , v k } with k samples each. p ( u , v ) represents the joint probability mass function while p ( u ) and p ( v ) represent the marginal probabilities. In the context of feature selection from a dataset, the relevant features will contain useful information about the particular class. The MI is chosen in this study for finding the relevant features due to its ability to quantify the amount of information shared among the feature and a class.
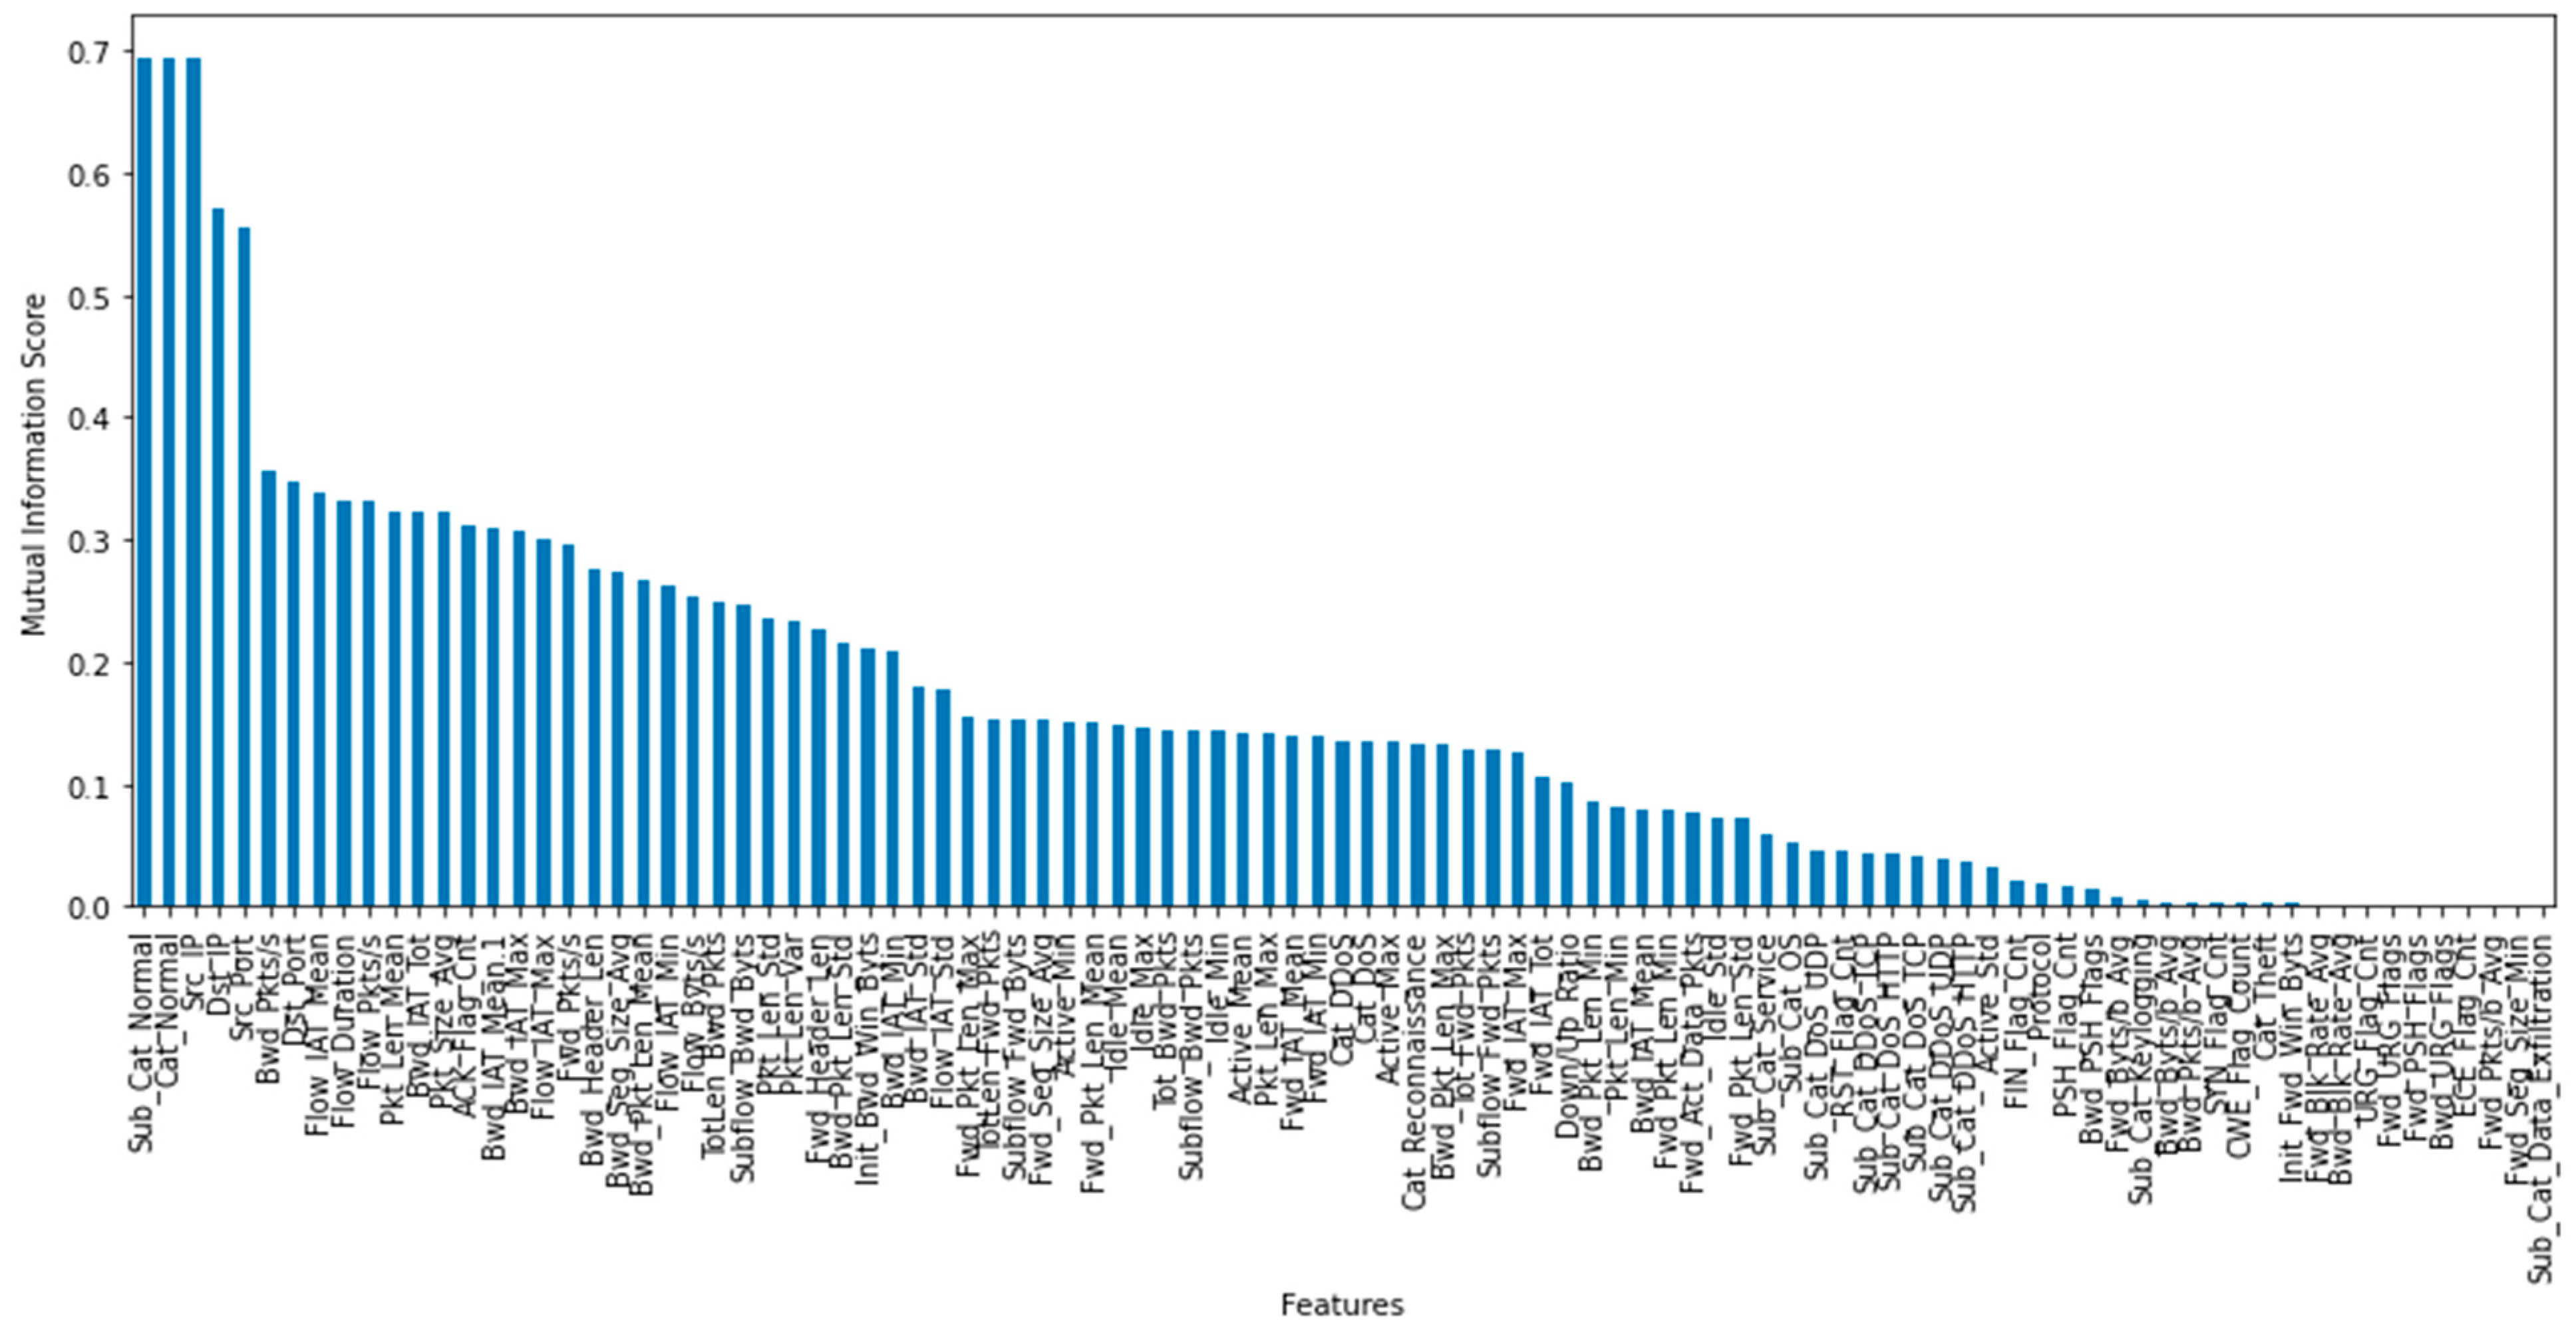
Figure 4 shows the best numerical features selected based on the MI value arranged in descending order. We selected the top 80 ,   32 ,   16 , and 8 features based on the highest MI scores to find out the optimal set of useful and important features that can be used to train the DL model, with a negligible loss in the detection accuracy.

4.2. Evaluation Metrics

The performance evaluation of the consider DL models is performed using the Accuracy, Precision, Recall, F1-Score, False Alarm Rate, True Negative Rate, and False Negative Rate. The basis for these evaluation metrics is the different attributes within the confusion matrix shown in Table 3. The TP and TN instances in the confusion matrix represent the correct prediction of Anomaly and Benign instances, respectively. Similarly, FN and FP instances are incorrect predictions of a classifier as Benign and Anomaly instances. The different evaluation metrics considered in this study are detailed in [74,75,76].
Accuracy: It is calculated as the ratio of the correctly classified records to the total number of records.
A c c u r a c y = T P + T N T P + T N + F P + F N
Precision: It is the ratio of correctly predicted Anomaly instances to all the instances predicted as Anomaly.
P r e c i s i o n = T P T P + F P
Recall: It is defined as the ratio of all the correctly predicted Anomaly instances to all the actual Anomaly instances.
R e c a l l = T P T P + F N
F1 Score: It provides the harmonic mean of the P r e c i s i o n and R e c a l l to examine the accuracy of the system using a statistical technique.
F 1   S c o r e = 2 ( P r e c i s i o n × R e c a l l P r e c i s i o n + R e c a l l )  
False alarm rate (FAR): It is defined as the ratio of wrongly predicted Anomaly instances to all the Benign instances.
F A R = F P F P + T N  
True-negative rate (TNR): It is the ratio of the correctly predicted Benign instance to all the instances that are Benign.
T N R = T N F P + T N  
False-negative rate (FNR): It denotes the miss rate and shows the possibility of the classifier missing the anomaly instances. It is the ratio of wrongly predicted Benign instances to all the actual Anomaly instances.
F N R = F N T P + F N  

4.3. Experimental Setup

To implement and evaluate our proposed methodology on the IoT-Botnet 2020 dataset, we performed the experiments on an HP laptop installed with a Windows 10 operating system, having 8 GB of RAM with Intel Core I7-8550U processor NVIDIA GeForce MX150. Python (version 3.6.9) is used as the primary implementation tool for implementation and evaluation in a Google Colab environment by selecting the GPU as a hardware accelerator [77,78,79].

4.4. Results and Discussion

For implementing the different DL-based IDS methodologies in this study, we selected the Batch size as 2 7 , Learning rate as 0.01 , Optimizer as A d a m , and used b i n a r y   c r o s s e n t r o p y as the Loss function. R e L U and s i g m o i d are the used activation functions in this study for the DL approaches.
Table 4 summarizes the results in a percentage of the performance evaluation metrics considered in this study. The proposed DNN-based methodology is compared with the four different supervised DL algorithms such as 1-dimensional Convolutional Neural Network (CNN-1D), Recurrent Neural Network (RNN), and its different variants as Gated Recurrent Unit (GRU) and Long Short-Term Memory (LSTM). The results confirm the superiority of the proposed DNN-based IDS solution for an IoT network comparing other DL methodologies using the evaluation metrics. It is also observed that the CNN-1D model is the second-best model, while the LSTM is the worst among others in terms of the considered evaluation metrics.
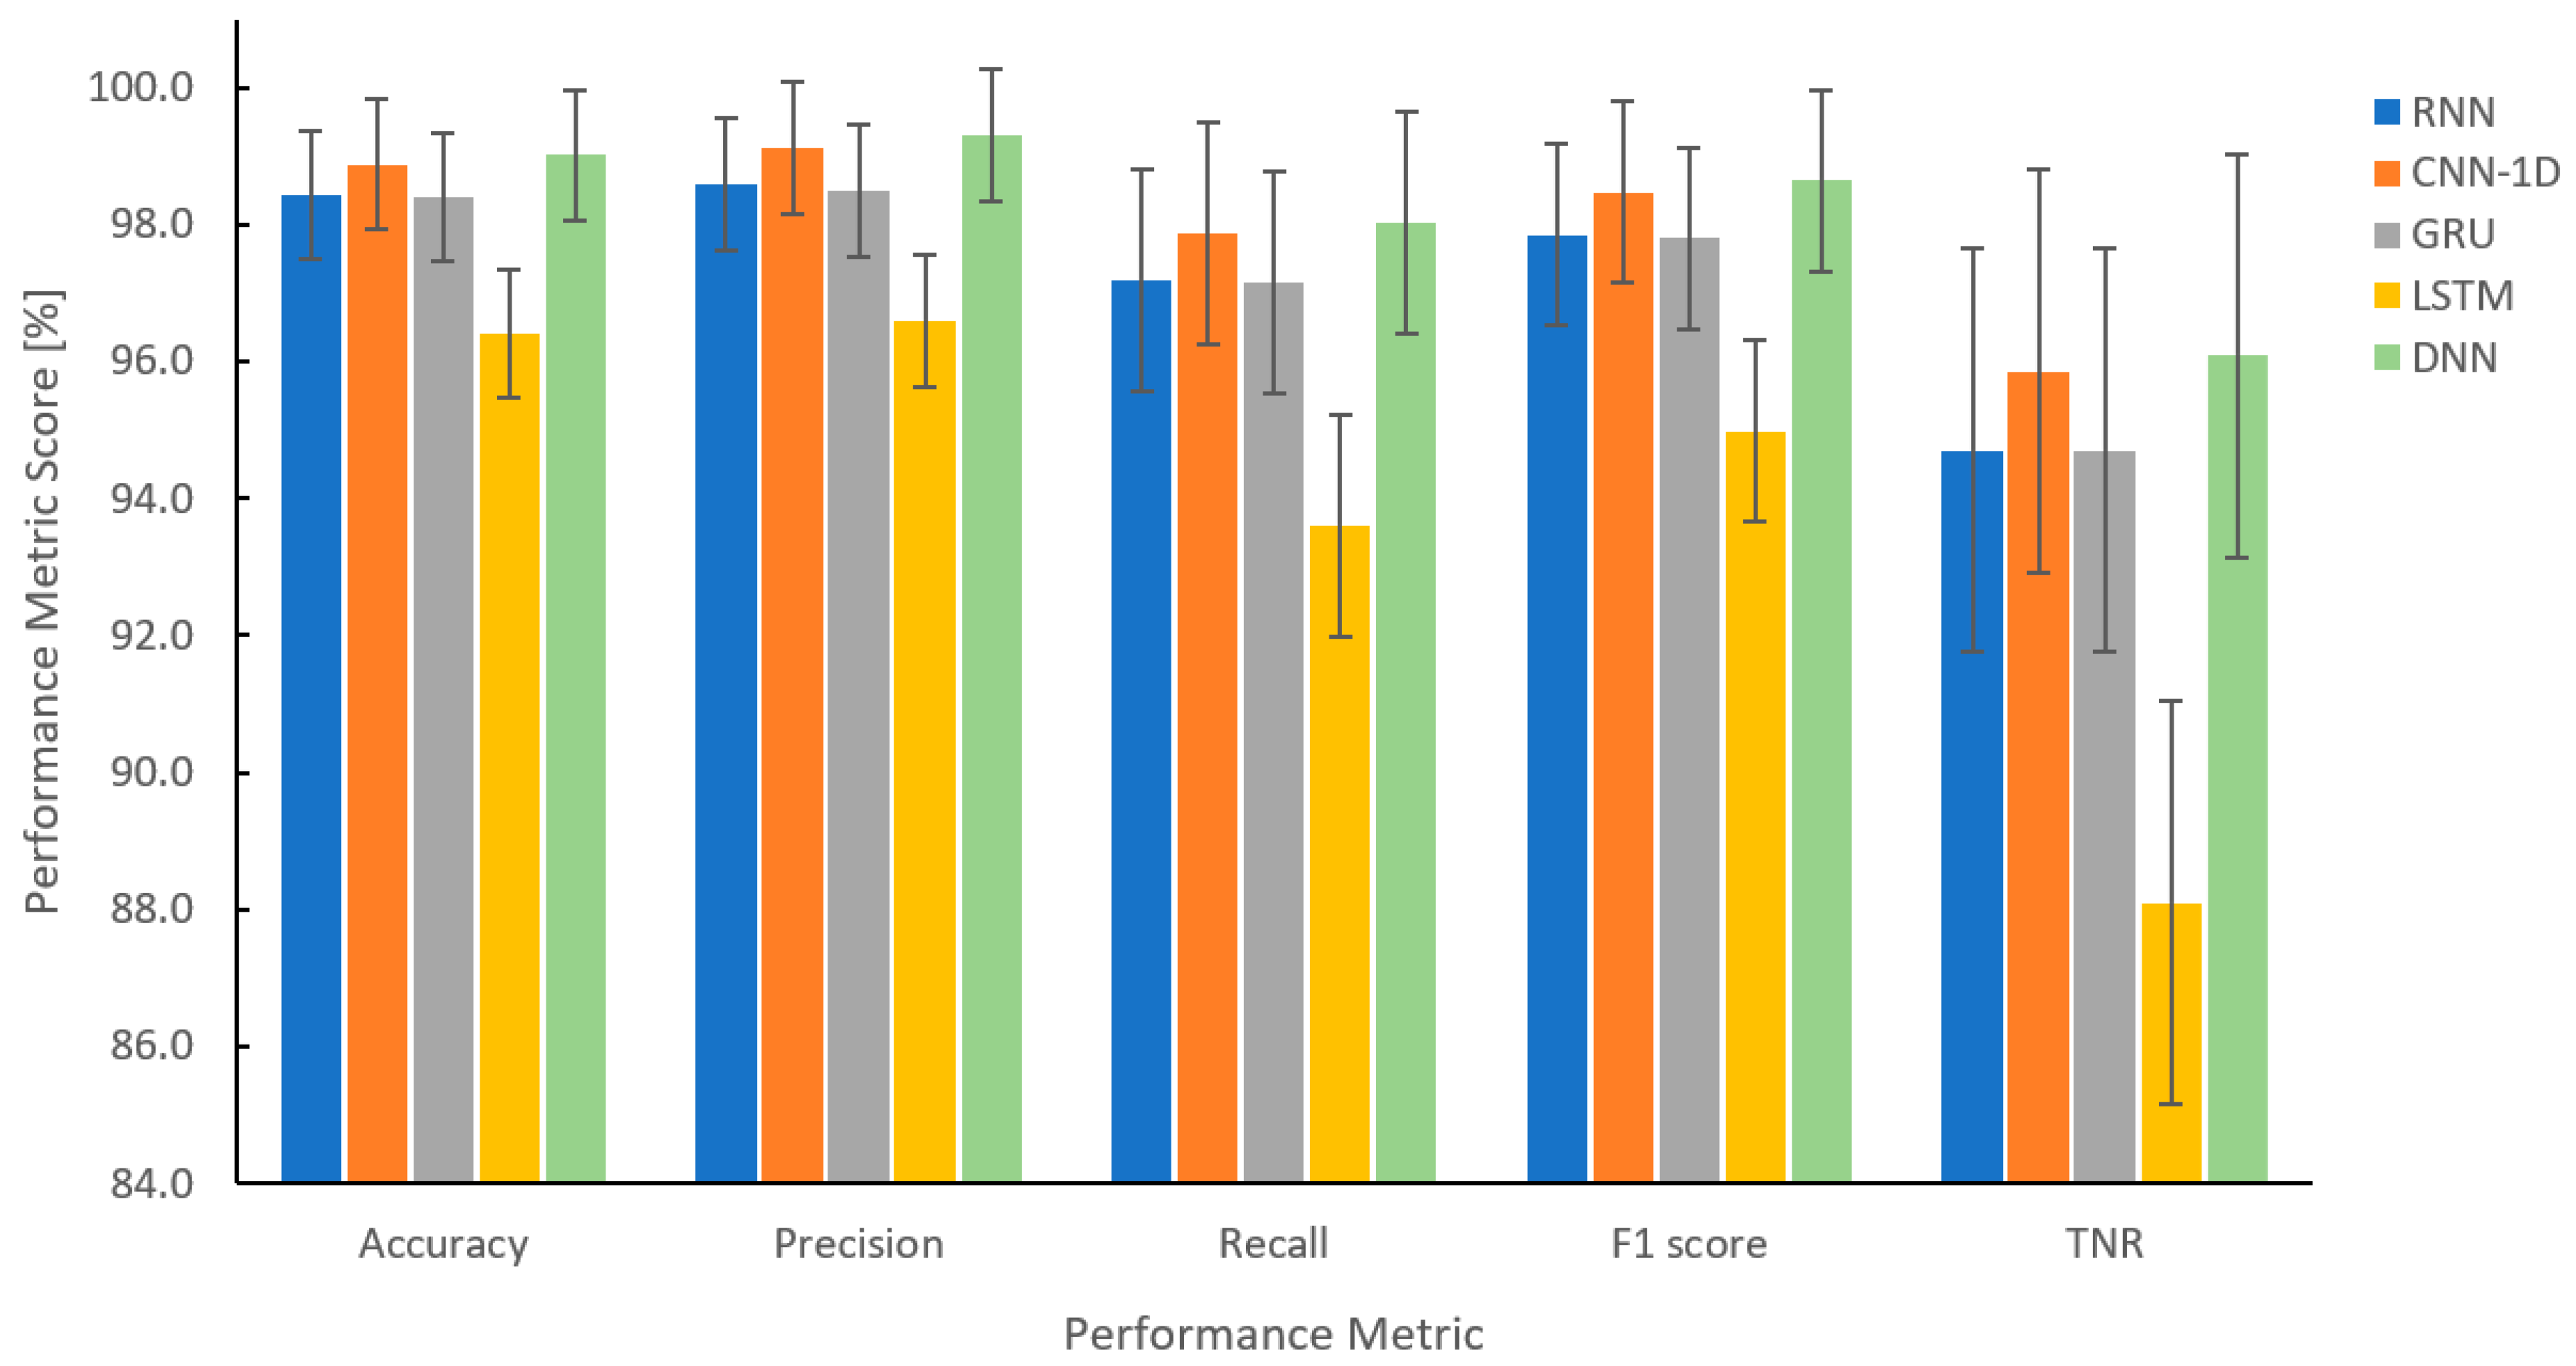
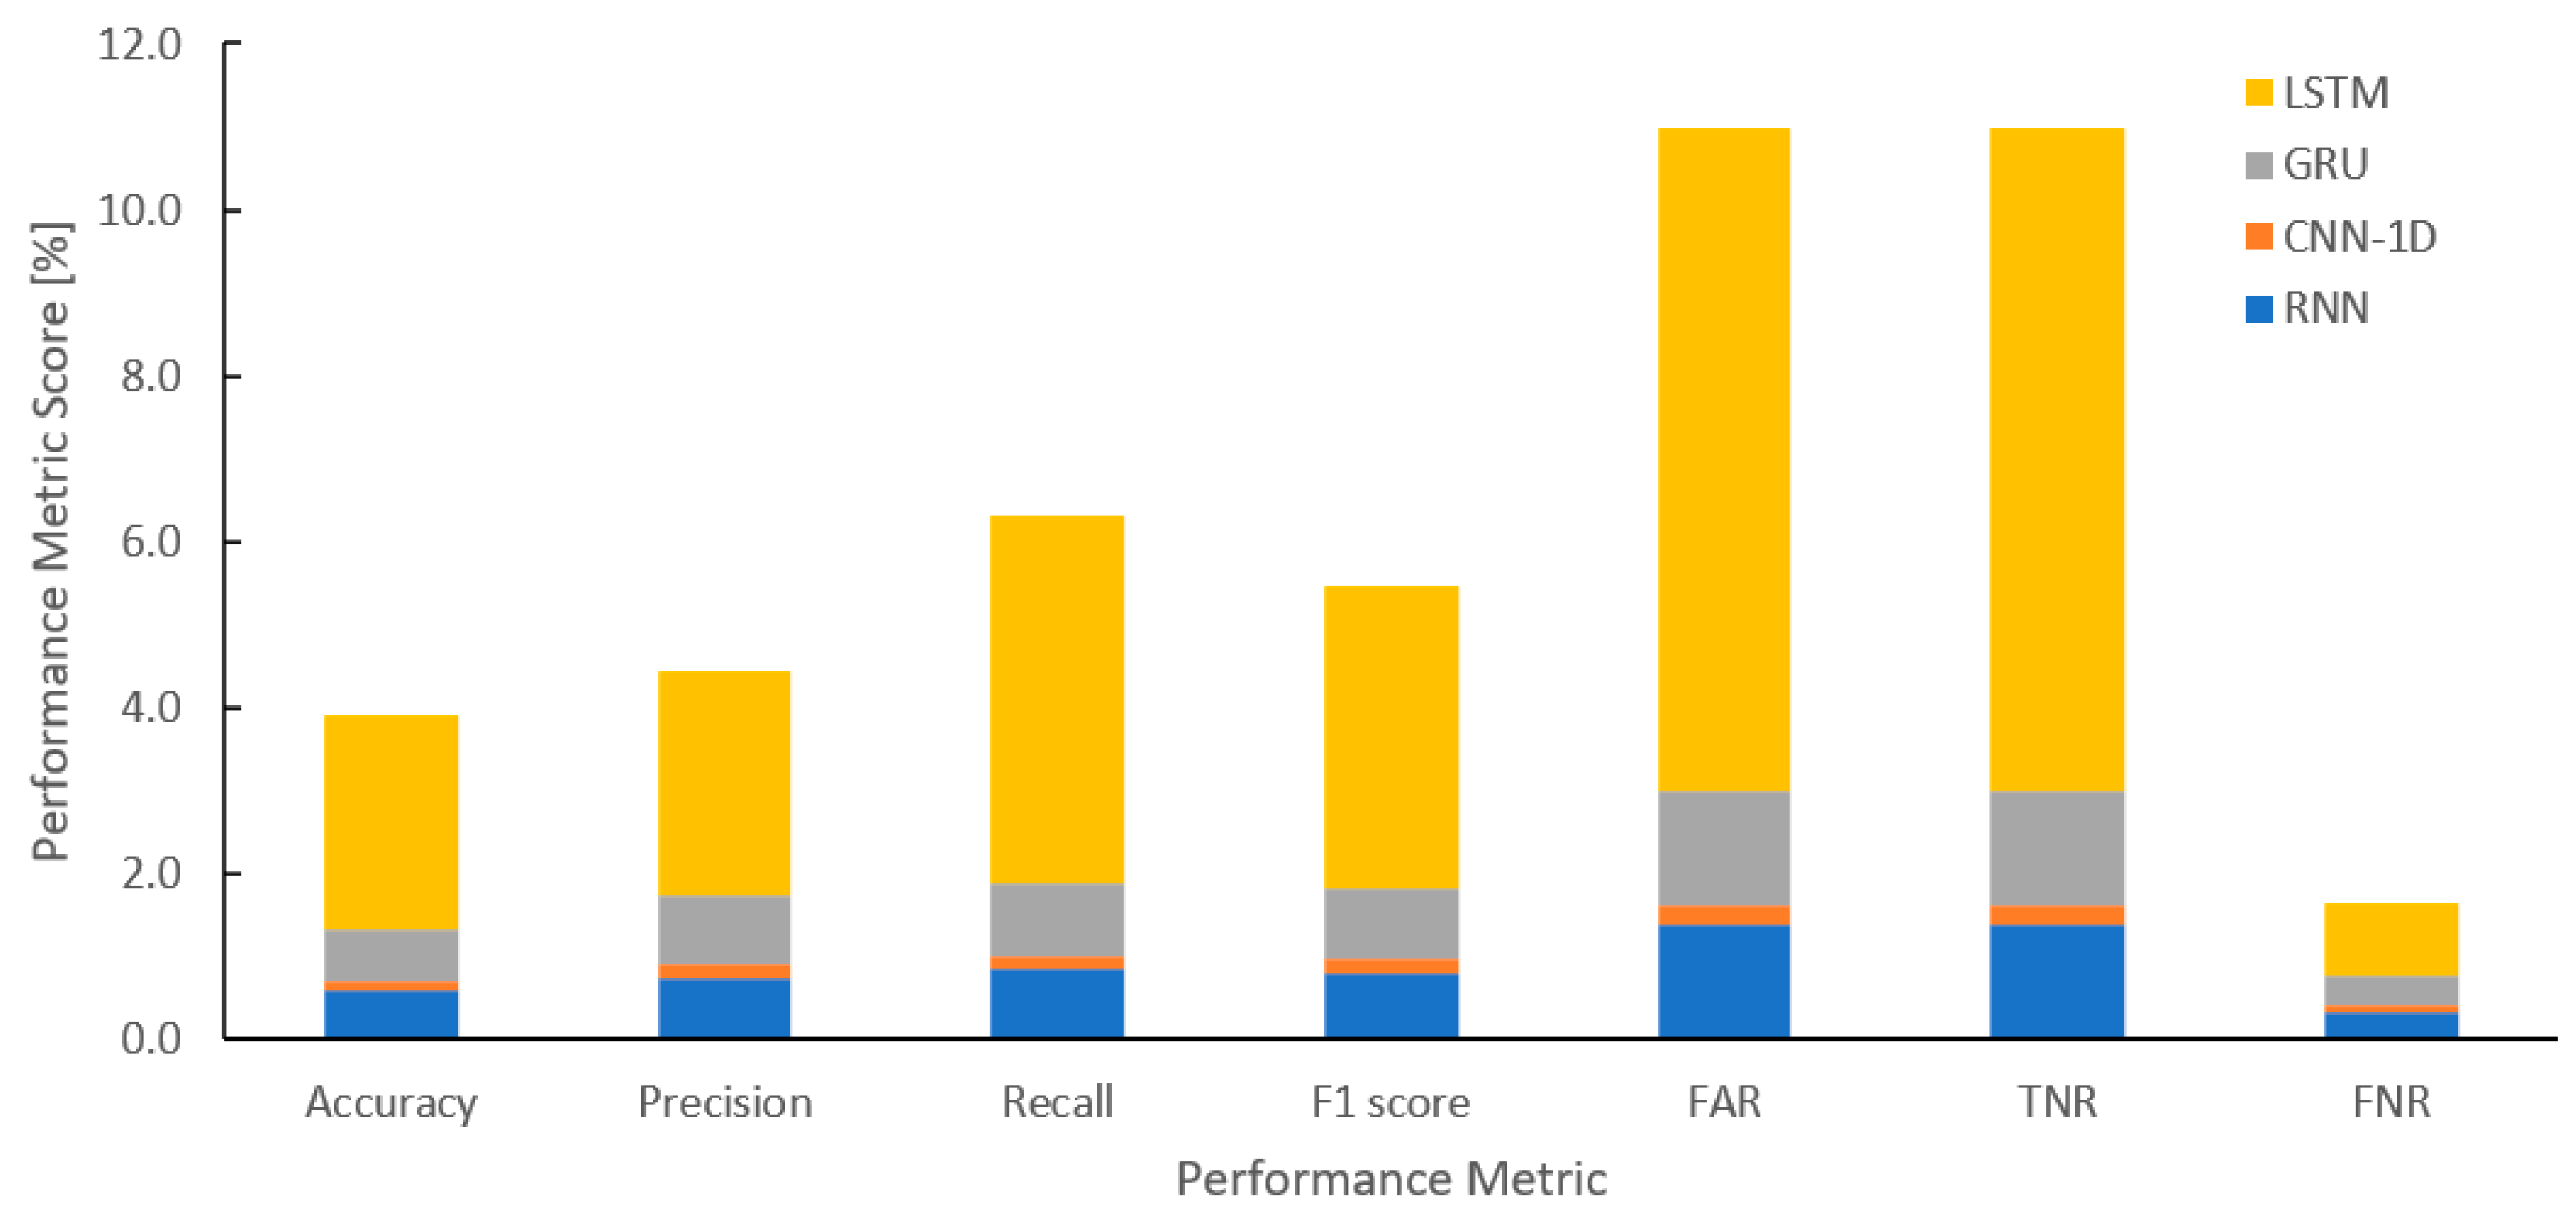
The evaluation metrics scores are also depicted in Figure 5 and Figure 6. From Figure 5, DNN achieved the highest detection accuracy of 99.010% compared to the other DL algorithms, while LSTM showed the most minimal performance with an accuracy score of 96.41%. The DNN model also correctly predicted the anomalies with 99.304% correctness. The DNN-based proposed methodology also showed a high F1 score than other DL models to show the model’s accuracy on an IoT-Botnet 2020 dataset. In addition, the DNN model exhibited a high score of 96.08% of correctly predicting Benign flows compared to the other considered DL methodologies.
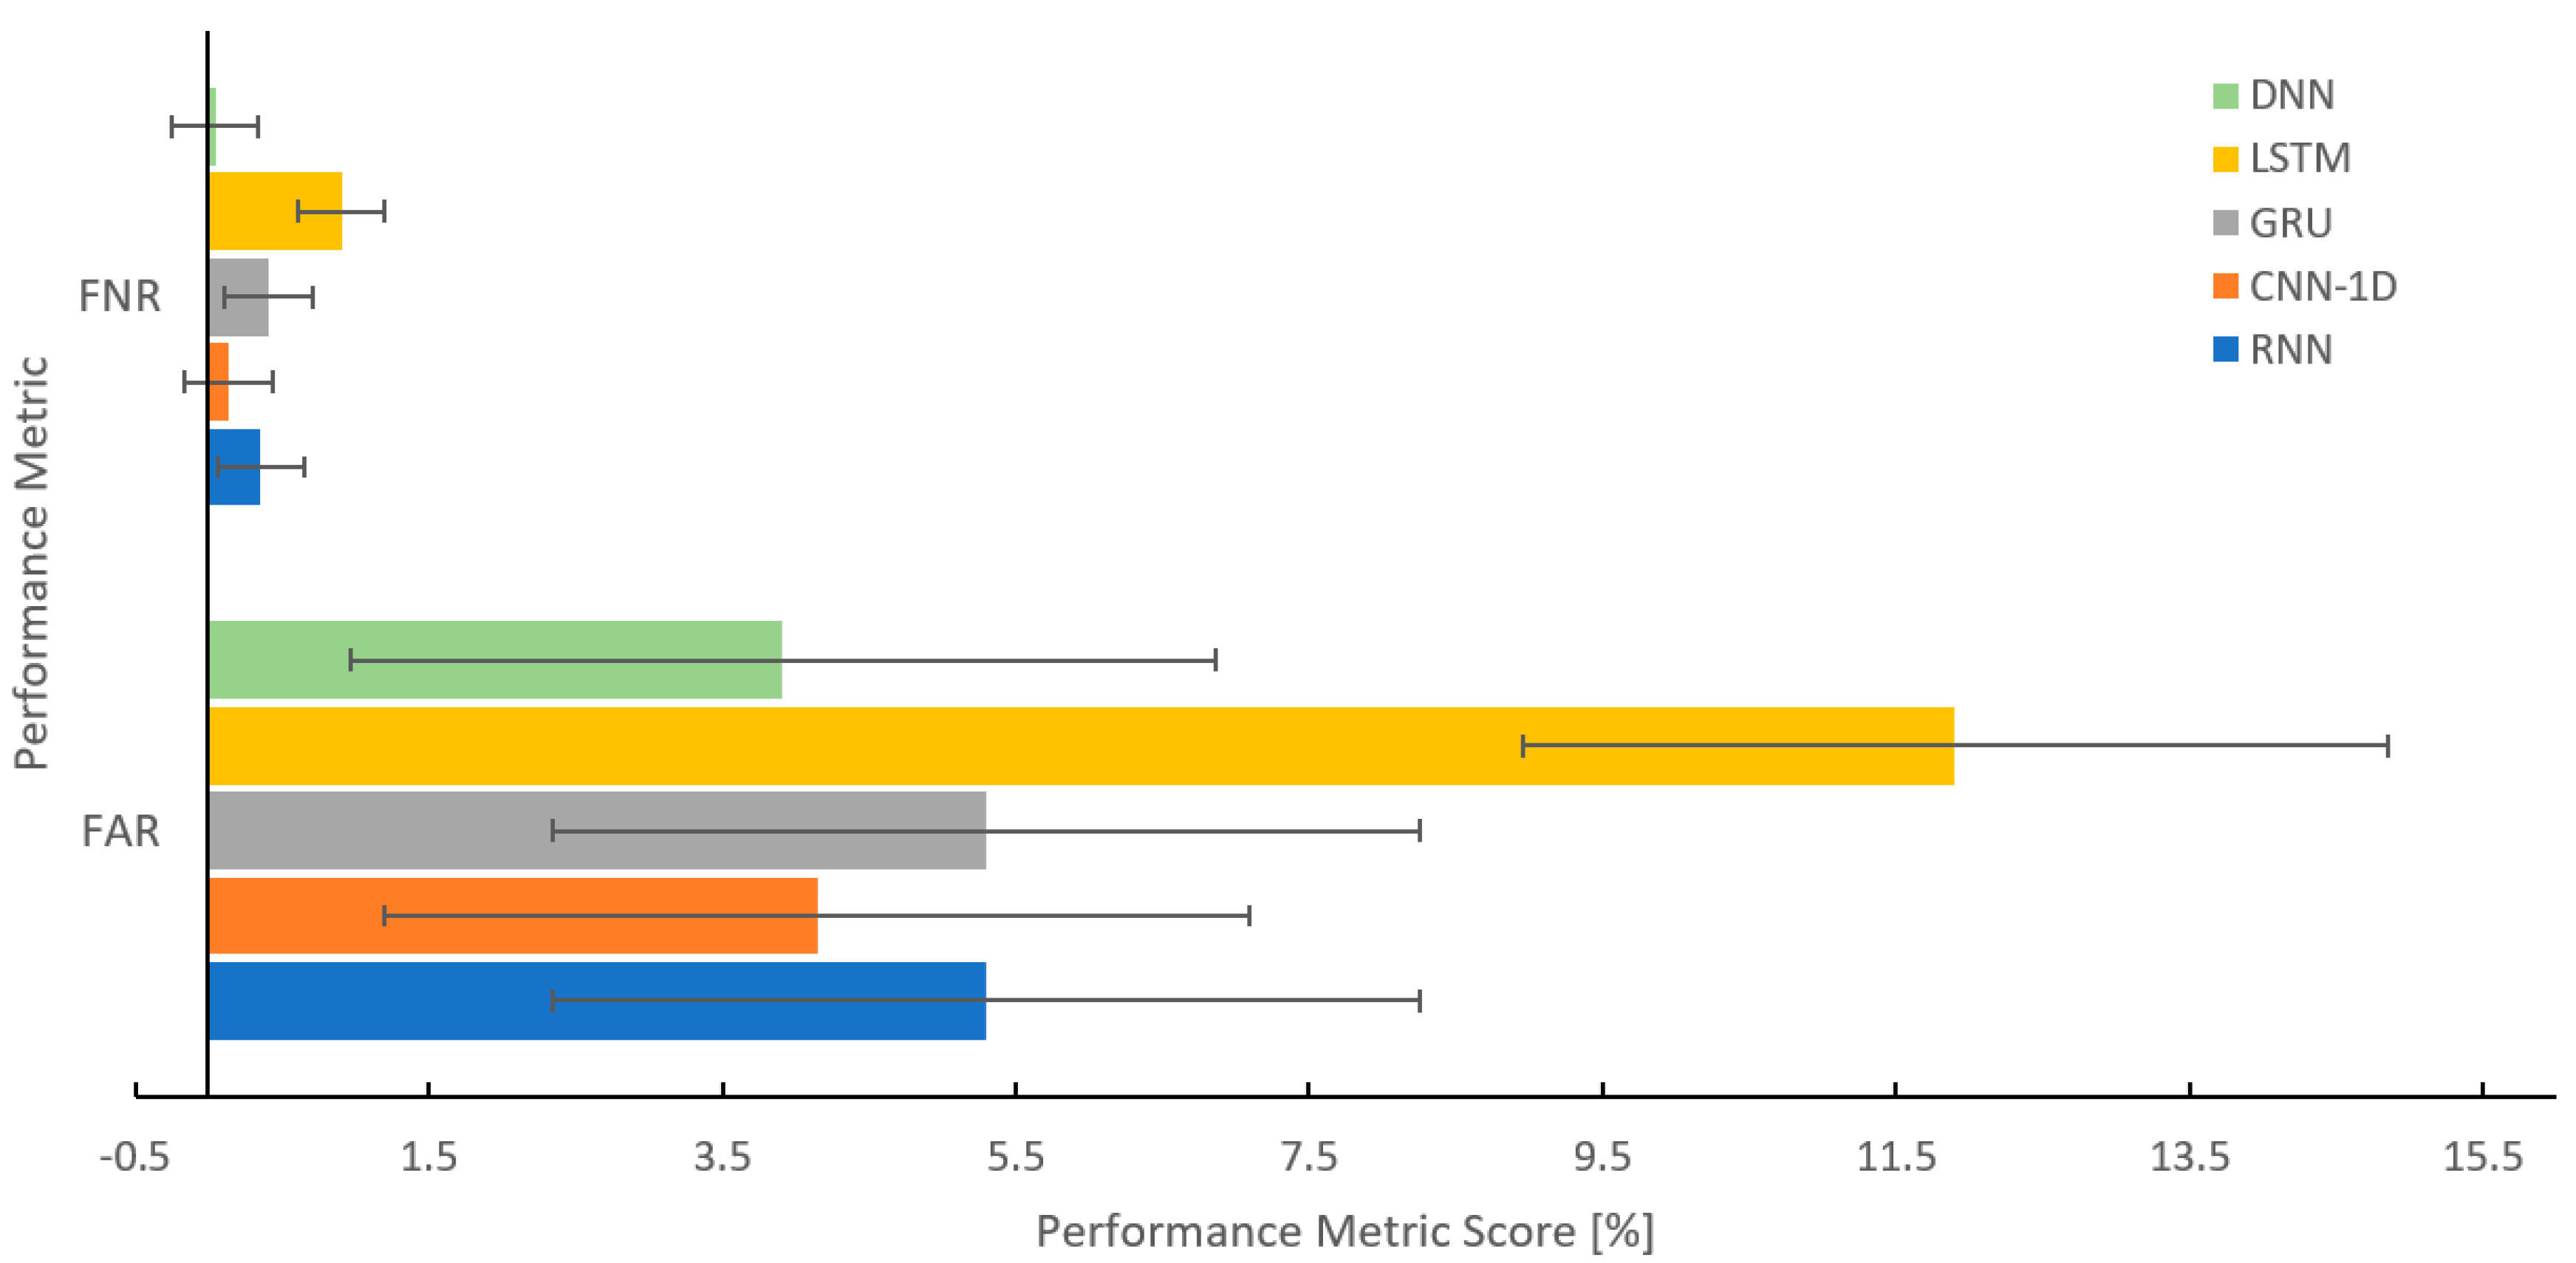
Figure 6 plots the performance of the different DL-based NIDS methodologies in terms of FAR and FNR. As discussed earlier, the main problem exhibited by the current NIDS is the high FAR. To this end, it is observed that the proposed method exhibited a very low FAR and FNR compared to methodologies. The proposed scheme achieved a FAR of 3.9% while achieving a very high detection accuracy at the same time. The LSTM model is observed to achieve a high FAR of 11.9%, showing its inefficiency to learn enough patterns to classify the network flows correctly.
Figure 7 exhibits the percentage improvement of the DNN-based NIDS comparing other DL-based solutions. It is observed that DNN exhibited an improvement of 0.57–2.6% in terms of the model’s accuracy while at the same time reducing the FAR by 0.23–7.98% to show its effectiveness. It is also observed that DNN showed a slight improvement in terms of evaluation metrics from CNN-1D. Similarly, DNN performed quite well comparing the LSTM model exhibiting its superiority comparing the typical supervised DL algorithms.
Table 5 details the analysis of the individual labels (Benign and Anomaly) in terms of percentage precision, recall, and F1-score. We observed that all of the methodologies exhibited a very high percentage of detection rate for the anomaly flows, with DNN showing the best score of 99.95%. On the other hand, it is observed that the detection rate to detect the benign traffic is slightly decreased by 3.87–10.99%, with DNN still performing better than other algorithms with a score of 96.085%. We also observed that the LSTM model performed poorly to detect benign flows with the degradation in the detection rate of almost 11%. We believe that the imbalanced nature of the dataset with anomaly records almost 3.2 times more than the benign records, which contributed to the degradation of the detection rate for the benign labels. Increasing the number of records for benign labels can also improve its detection rate.
Figure 8 shows the performance of different DL-based IDS methodology considering the different number of features selected based on the MI scores as depicted in Figure 4. We observed an almost negligible degradation in the accuracy for the DNN model for the feature sets of 80, 32, and 16. The model exhibited an almost 1% decrease in detection accuracy for 8 features set. Other DL algorithms, except for LSTM, also exhibited similar performances considering different feature sets. For LSTM, we observe the improvement of 0.7 0.8 % in the accuracy considering 32 and 16 features. Since the number of features contributes to the complexity of the model. As observed, the performance remains almost similar considering the 32 and 16 features for the majority of DL algorithms. Thus, the model can be trained only using the best 16 to 32 features to reduce the complexity of the model.
Figure 9 shows the confusion matrix of the proposed DNN methodology obtained for different feature sets. It was observed that anomalies are detected with more accuracy considering the 80, 32, and 16 features comparing the 8 features. At the same time, the model exhibited more incorrect predictions for the benign traffic with the 8 features set performing the worst. Furthermore, we observed that the DNN with 16 features had fewer incorrect predictions for benign labels and more incorrect predictions for anomaly labels comparing the 32 features set. The feature set selected based on MI was calculated considering the integer and float features only.
To check the role of the categorical features of the dataset on the detection accuracy of the DNN, we calculated the MI scores of all of the features of the dataset. For that purpose, the categorical features were first converted as integer and binary data types which eventually increased the number of features. Figure 10 depicts the features arranged in descending order, including the categorical features as well.
For experimenting, we selected all the features depicted in Figure 4 and Figure 10 that resulted in an MI score of a minimum of 0.5 or more as given in Table 6.
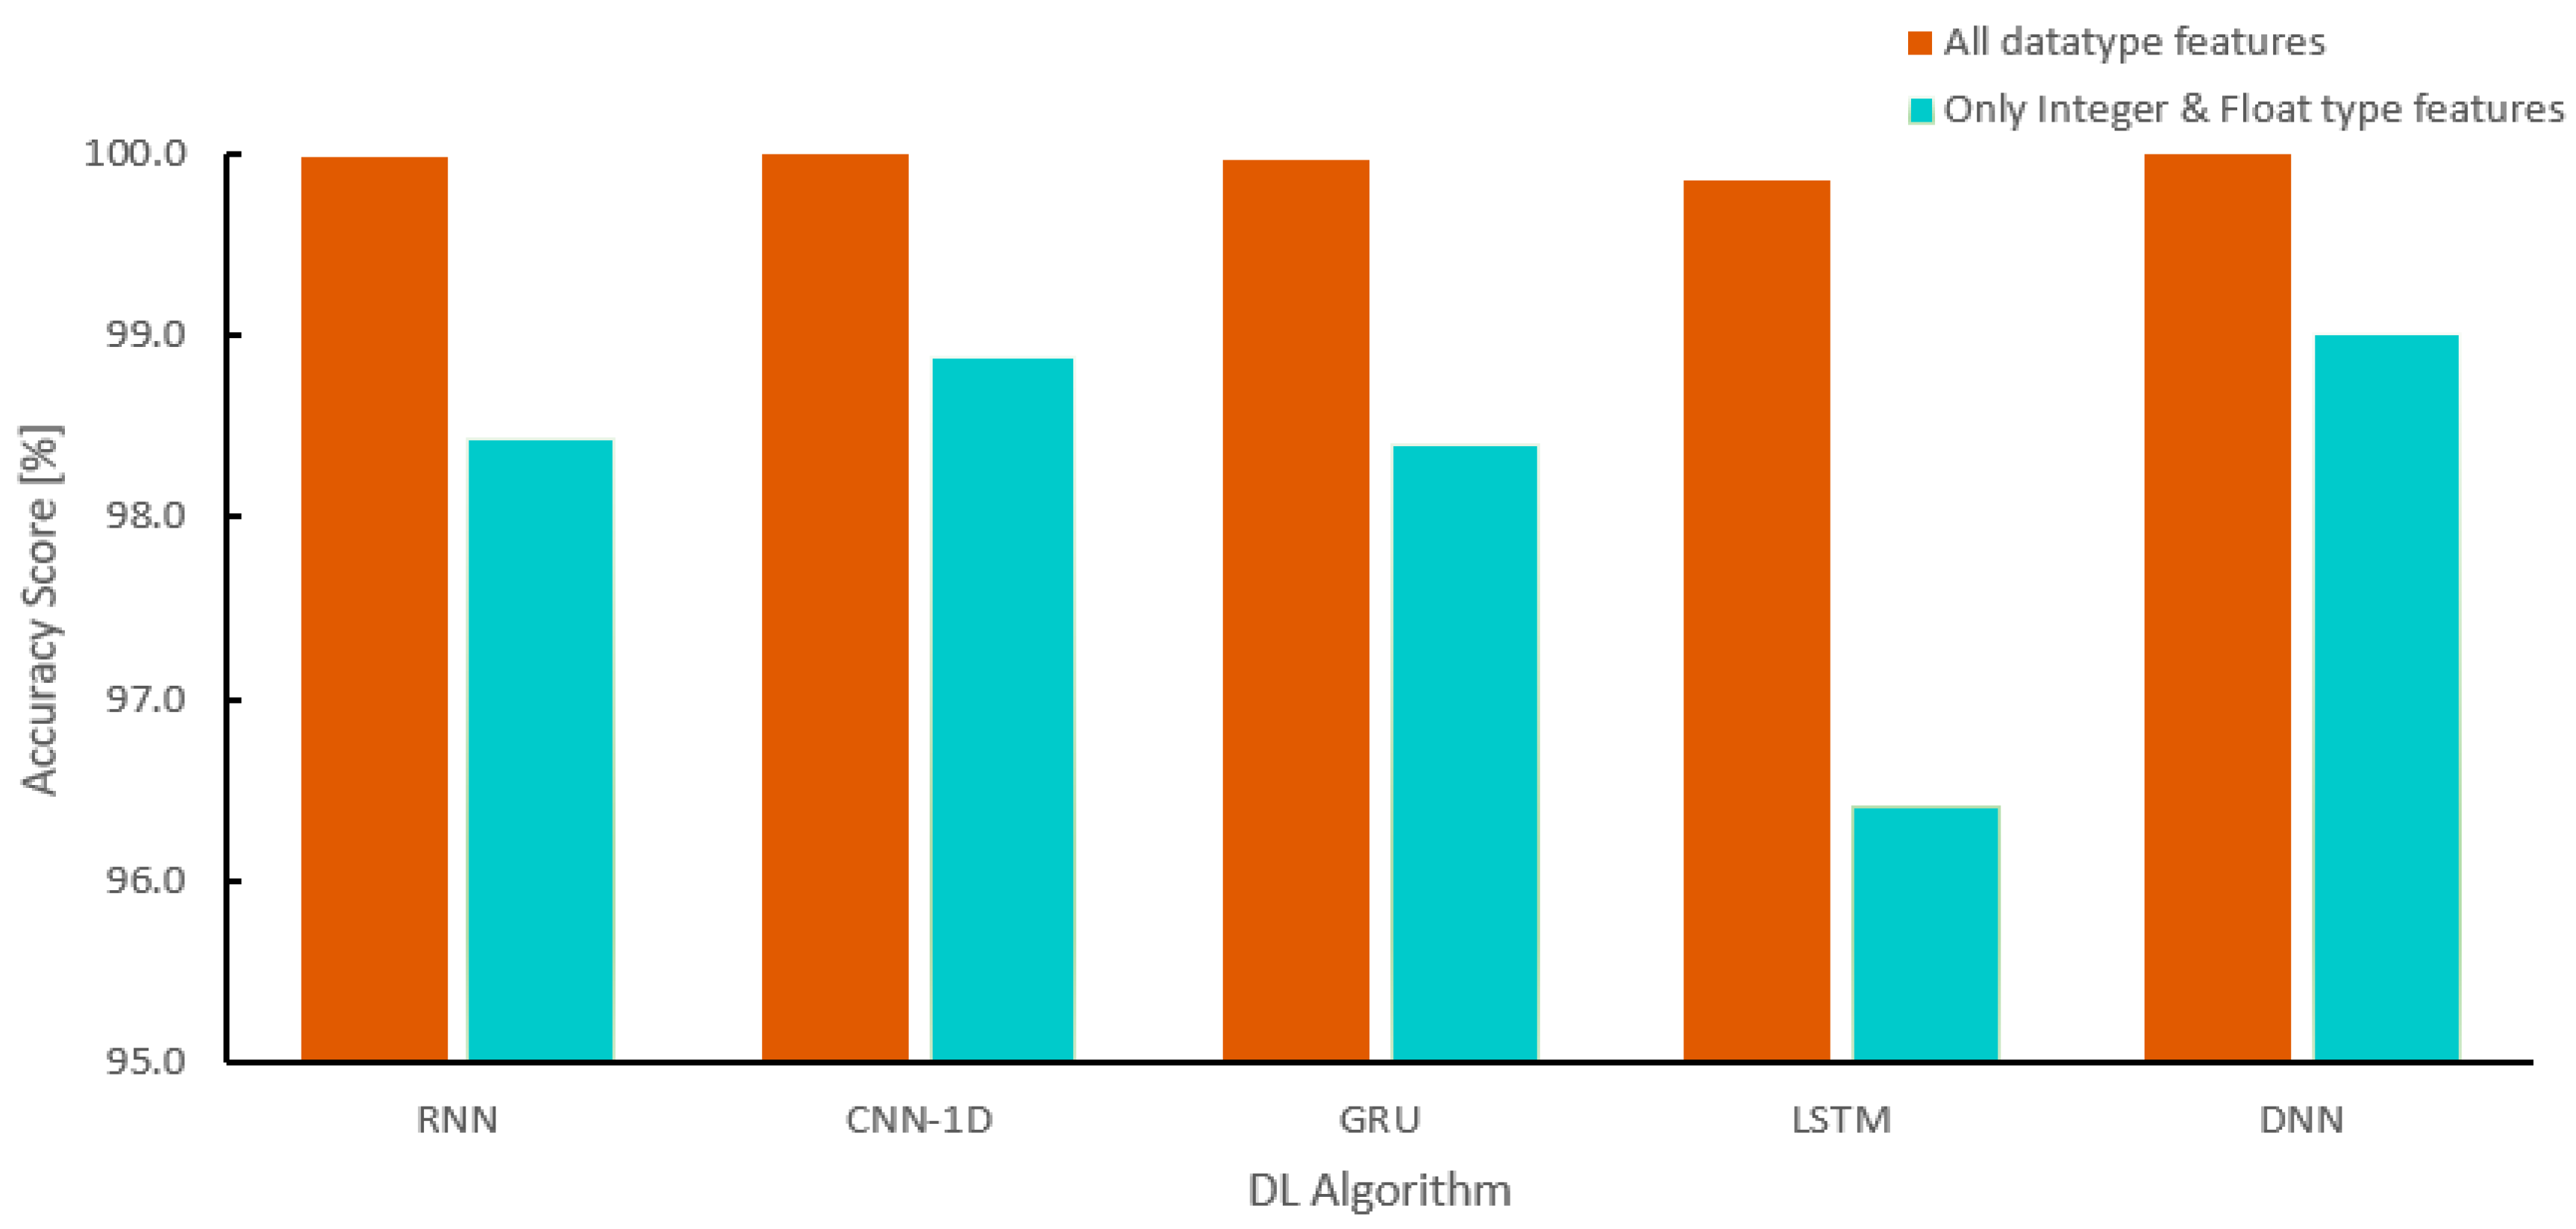
The experiment was performed again, considering the top five features to test the efficiency of all the considered DL methodologies. We observed an improvement of 0.99–3.45% in the detection accuracy for the DL-based NIDS considering the implementation with only integer and float type features, as depicted in Figure 11. The result depicts the importance of using the categorical features to improve the accuracy performance for DL-based NIDS in an IoT environment.
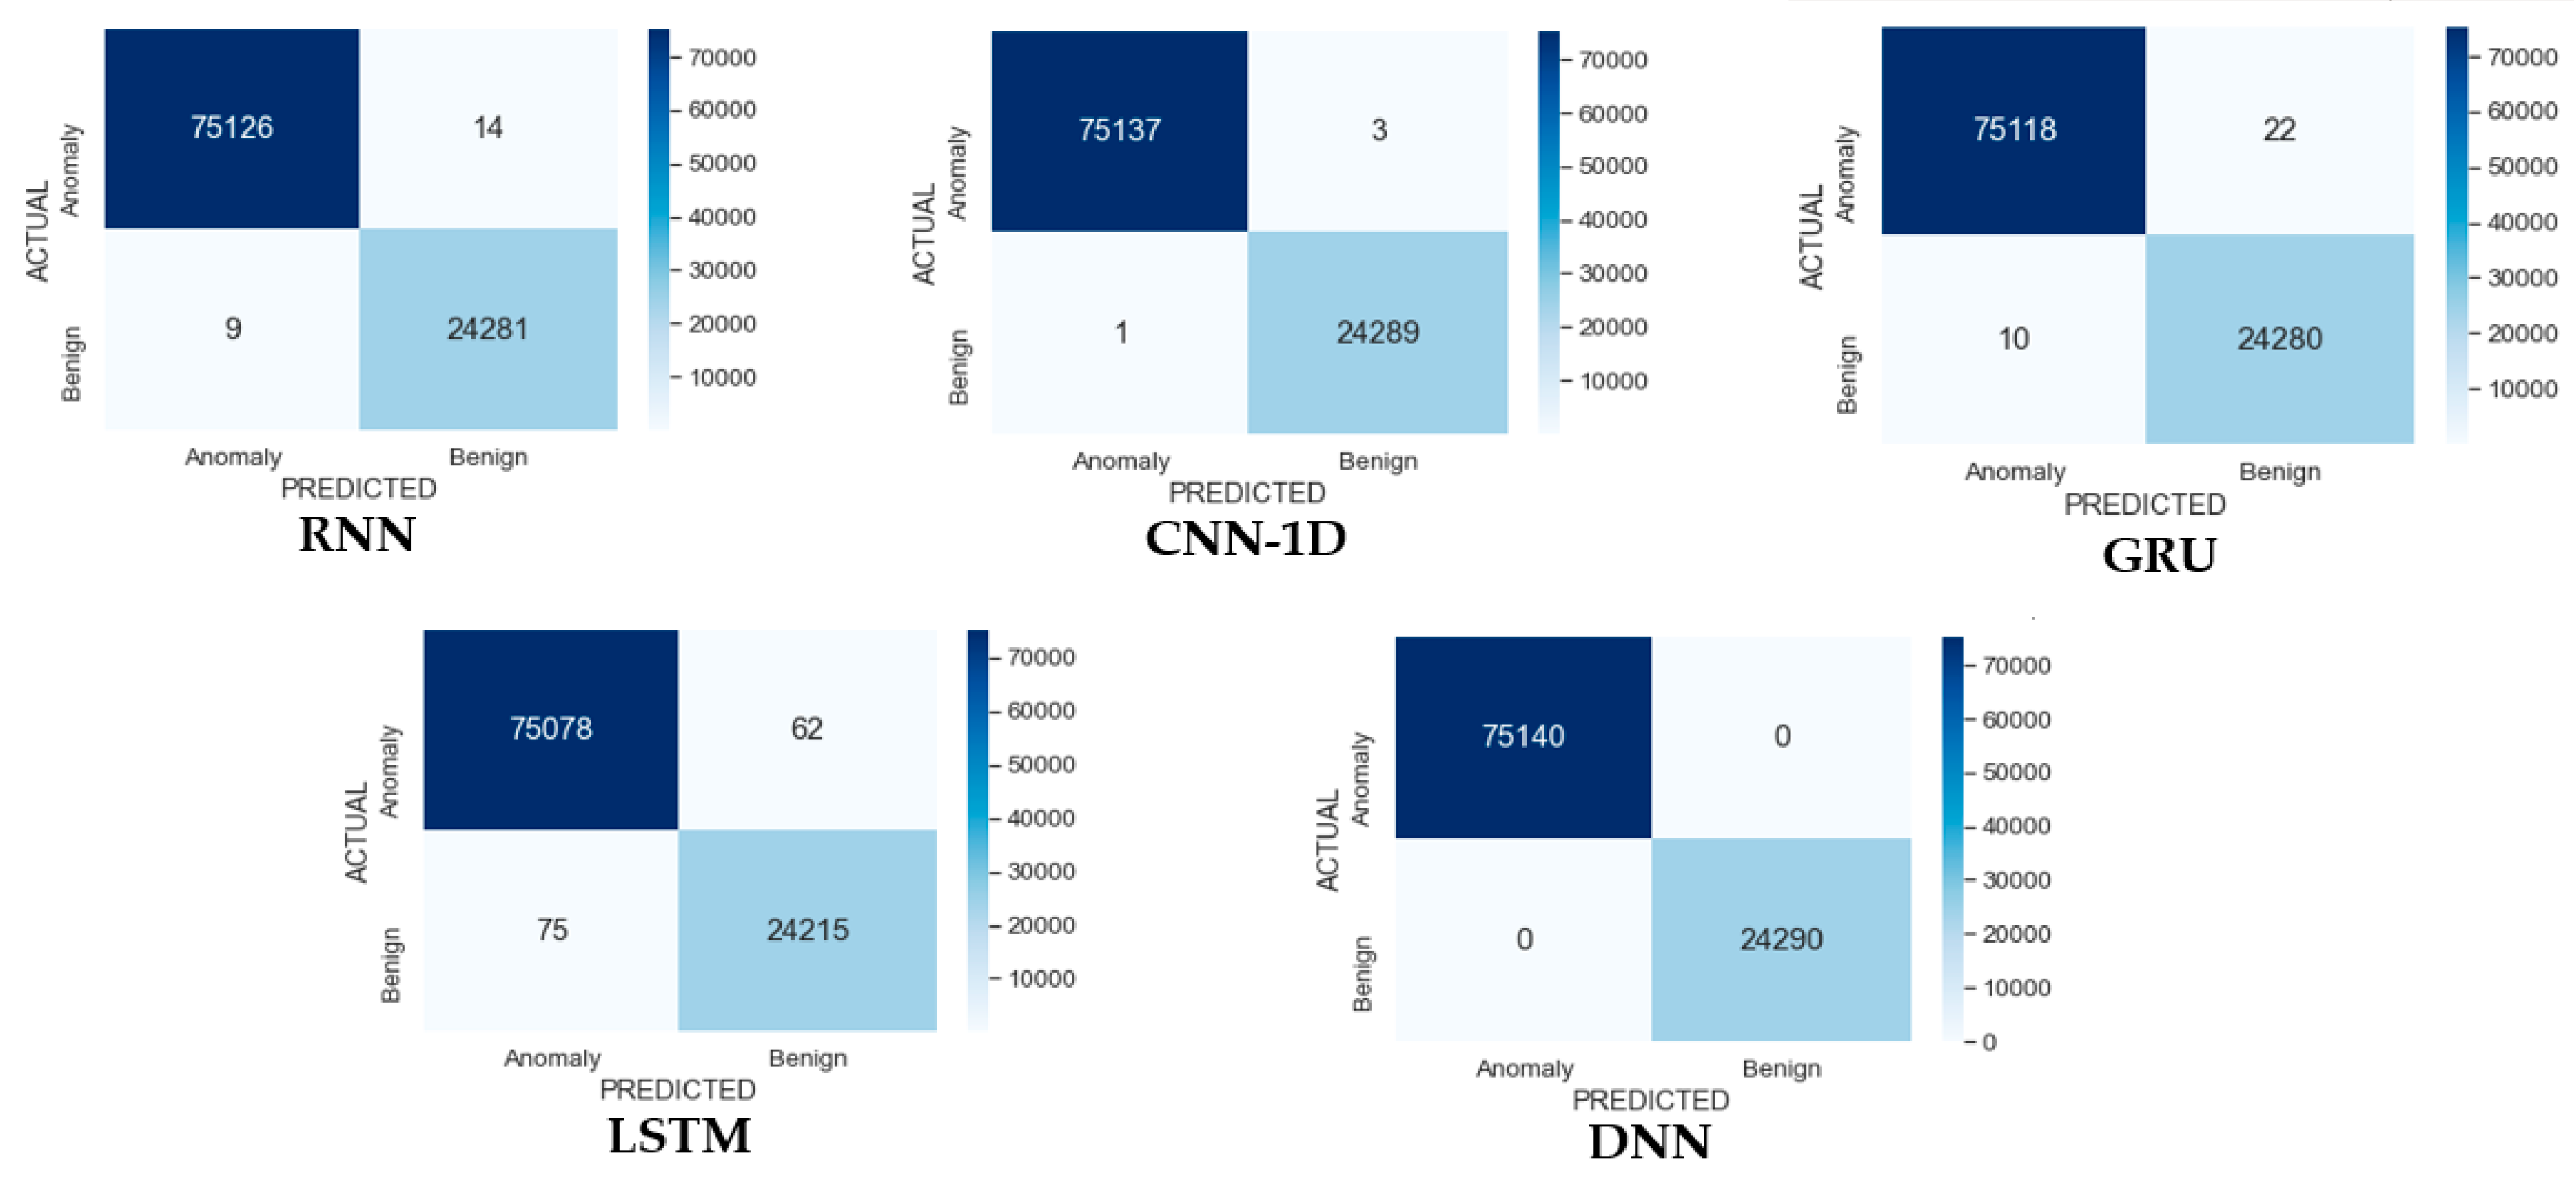
The confusion metrics of the different DL-based NIDS for IoT considering the features given in Table 6 are shown in Figure 12. It was observed that the categorical features have eventually improved the detection performance for all of the DL methodologies. The DNN and CNN-1D detected the anomaly and benign samples with almost 100% accuracy. The GRU, RNN, and LSTM all improved their detection performance, comparing the results obtained while experimenting using only the numerical feature set. We observed that LSTM, among the other considered DL-based methodologies, exhibited more incorrect predictions. We also observed that the DNN achieved this result in just two hidden layers, which have eventually reduced the model complexity. A 100% accuracy for the binary classification stage is also achieved by the authors in their proposed solution [68]. Our work is different from their work in many ways. Firstly, they adopted the ML approach, while we used the DL approach for this study. Secondly, they achieved 100% accuracy results considering the 20 features while we only needed five features. The DL approach is more suitable for an IoT network, as it has shown its superiority to process a huge amount of data to make efficient and correct predictions.
The present study provides a detailed comparative analysis of different DL-based NIDS for an IoT network. The MI score is considered as the feature selection criteria. Only the numerical features were first arranged in descending order, and the DL models were evaluated considering the 80, 32, 16, and 8 feature sets. For these scenarios, DNN achieved the highest detection accuracy of 99.01 compared to the other DL methodologies. We then repeated the experiments that considered the numerical and categorical features. We consider only those features whose MI score was 0.5, which resulted in only five features. The experimental results showed a significant improvement in terms of detection accuracy, with the DNN achieving 100% results.
The present study only considered the binary classification to detect only the anomalies in general. The considered model is not able to identify the exact nature of the anomaly, which is required to design an intrusion prevention mechanism. In addition, the present study only evaluated considering IoT-Botnet 2020 dataset. The proposed methodology needed to be evaluated considering different other IoT-based datasets to check its effectiveness for the considered features set. Moreover, the evaluation of the current research work is performed using only the simulation environment. It should be tested in a real-time environment to check efficiently. The performance of the considered solution should be tested under a large number of IoT sensors.

5. Conclusions

This paper proposes an effective anomaly detection mechanism based on the deep neural network for the IoT network architecture that efficiently learns valuable complex patterns from the IoT network flows to classify traffic as benign and anomalous. The proposed methodology is tested on the newly available IoT-Botnet 2020 dataset. The experimental results demonstrated the proposed model superiority compared to other DL methods by exhibiting a detection accuracy of 99.01% with the false alarm rate of 3.9%, showing an improvement of 0.57–2.6% in terms of the model’s accuracy, while at the same time reducing the FAR by 0.23–7.98%. It was also observed that the model showed a detection rate of 99.9% to detect anomalies and recorded a decrease in the detection rate by 3.8% for detecting the benign traffic, probably due to the imbalanced nature of the dataset. Results also show that the best numerical features in the range of 16–32 calculated using the MI will be the reasonable choice to reduce the model complexity with an almost negligible effect on its performance. In addition, the inclusion of the categorical features further improves detection accuracy by only utilizing the top five features.
For future research, we will extend this work by implementing our solution for the multiclass classification scenarios to find out the exact nature of the detected anomaly. In future work, we will test the proposed model’s effectiveness in a real-time IoT environment.

Author Contributions

Conceptualization, Z.A., A.S.K., J.J.P.C.R. and K.N.; methodology, Z.A., A.S.K., K.N., I.H. and R.H.; validation, Z.A., A.S.K., K.N., I.H. and R.H.; writing—original draft preparation, M.R.H., K.N. and S.T.; writing—review and editing, Z.A., M.R.H., K.N. and S.T.; visualization, M.R.H., K.N. and S.T.; supervision, Z.A., A.S.K., J.J.P.C.R. and K.N.; funding acquisition, Z.A., A.S.K., K.N., I.H. and R.H. All authors have read and agreed to the published version of the manuscript.

Funding

This research is fully funded by Universiti Malaysia Sarawak, Kota Samarahan, Malaysia under the grant number F08/PGRG/1908/2019. A.S.K. received the grant. The sponsors’ website: https://www.riec.unimas.my (accessed on 10 July 2021).

Institutional Review Board Statement

Not applicable.

Informed Consent Statement

Not applicable.

Data Availability Statement

Acknowledgments

The authors would like to thank the editors of Applied Sciences and anonymous reviewers for their time and review of this manuscript and the valuable comments and suggestions on improving the paper from Yong-Jin Park (IEEE Life member and former Director IEEE Region 10).

Conflicts of Interest

The authors declare no conflict of interest. The funders had no role in the design of the study; in the collection, analyses, or interpretation of data; in the writing of the manuscript, or in the decision to publish the results.

References

  1. Harb, H.; Mansour, A.; Nasser, A.; Cruz, E.M.; Diez, I.D.L.T. A Sensor-Based Data Analytics for Patient Monitoring in Connected Healthcare Applications. IEEE Sens. J. 2021, 21, 974–984. [Google Scholar] [CrossRef]
  2. Haider, I.; Khan, K.B.; Haider, M.A.; Saeed, A.; Nisar, K. Automated Robotic System for Assistance of Isolated Patients of Coronavirus (COVID-19). In Proceedings of the 2020 IEEE 23rd International Multitopic Conference (INMIC), Bahawalpur, Pakistan, 5–7 November 2020; pp. 1–6. [Google Scholar]
  3. Hovav, S.; Tsadikovich, D. A network flow model for inventory management and distribution of influenza vaccines through a healthcare supply chain. Oper. Res. Health Care 2015, 5, 49–62. [Google Scholar] [CrossRef]
  4. Sarkar, N.I.; Kuang, A.X.-M.; Nisar, K.; Amphawan, A.; Sarkar, N.I. Performance Studies of Integrated Network Scenarios in a Hospital Environment. Int. J. Inf. Commun. Technol. Hum. Dev. 2014, 6, 35–68. [Google Scholar] [CrossRef] [Green Version]
  5. Sarkar, N.I.; Kuang, A.X.-M.; Nisar, K.; Amphawan, A.; Sarkar, N.I. Hospital Environment Scenarios using WLAN over OPNET Simulation Tool. Int. J. Inf. Commun. Technol. Hum. Dev. 2014, 6, 69–90. [Google Scholar] [CrossRef] [Green Version]
  6. Chowdhry, B.; Shah, A.A.; Harris, N.; Hussain, T.; Nisar, K. Development of a Smart Instrumentation for Analyzing Railway Track Health Monitoring Using Forced Vibration. In Proceedings of the 2020 IEEE 14th International Conference on Application of Information and Communication Technologies (AICT), Tashkent, Uzbekistan, 7–9 October 2020; pp. 1–5. [Google Scholar]
  7. Nisar, K. Smart Home: Multisensor Information Fusion Towards Better Healthcare. Adv. Sci. Lett. 2018, 24, 1896–1901. [Google Scholar] [CrossRef]
  8. Patel, R.; Longini, I.M.; Halloran, M.E. Finding optimal vaccination strategies for pandemic influenza using genetic algorithms. J. Theor. Biol. 2005, 234, 201–212. [Google Scholar] [CrossRef] [PubMed]
  9. Haque, M.R.; Tan, S.C.; Yusoff, Z.; Nisar, K.; Lee, C.K.; Chowdhry, B.; Ali, S.; Memona, S.K.; Kaspin, R. SDN Architecture for UAVs and EVs using Satellite: A Hypothetical Model and New Challenges for Future. In Proceedings of the 2021 IEEE 18th Annual Consumer Communications & Networking Conference (CCNC), Las Vegas, NV, USA, 9–12 January 2021; pp. 1–6. [Google Scholar]
  10. Ahmad, F.; Ahmad, Z.; Kerrache, C.A.; Kurugollu, F.; Adnane, A.; Barka, E. Blockchain in Internet-of-Things: Architecture, Applications and Research Directions. In Proceedings of the 2019 International Conference on Computer and Information Sciences (ICCIS), Aljouf, Saudi Arabia, 3–4 April 2019; pp. 1–6. [Google Scholar]
  11. Mehmood, Y.; Ahmad, F.; Yaqoob, I.; Adnane, A.; Imran, M.; Guizani, S. Internet-of-Things-Based Smart Cities: Recent Advances and Challenges. IEEE Commun. Mag. 2017, 55, 16–24. [Google Scholar] [CrossRef]
  12. Ahmad, Z.; Khan, A.S.; Shiang, C.W.; Abdullah, J.; Ahmad, F. Network intrusion detection system: A systematic study of machine learning and deep learning approaches. Trans. Emerg. Telecommun. Technol. 2021, 32, 4150. [Google Scholar] [CrossRef]
  13. Apruzzese, G.; Andreolini, M.; Marchetti, M.; Colacino, V.G.; Russo, G. AppCon: Mitigating Evasion Attacks to ML Cyber Detectors. Symmetry 2020, 12, 653. [Google Scholar] [CrossRef] [Green Version]
  14. Ferrag, M.A.; Maglaras, L.; Moschoyiannis, S.; Janicke, H. Deep learning for cyber security intrusion detection: Approaches, datasets, and comparative study. J. Inf. Secur. Appl. 2020, 50, 102419. [Google Scholar] [CrossRef]
  15. Xiaolong, H.; Huiqi, Z.; Lunchao, Z.; Nazir, S.; Jun, D.; Shahid Khan, A. Soft Computing and Decision Support System for Software Process Improvement: A Systematic Literature Review. Sci. Program. 2021, 2021, 7295627. [Google Scholar]
  16. Maikol, S.O.; Khan, A.S.; Javed, Y.; Bunsu, A.L.; Petrus, C.; George, H.; Jau, S. A novel authentication and key agreement scheme for countering MITM and impersonation attack in medical facilities. Int. J. Integr. Eng. 2020, 13, 127–135. [Google Scholar]
  17. Nisar, K.; Sabir, Z.; Raja, M.; Ibrahim, A.; Rodrigues, J.; Khan, A.; Gupta, M.; Kamal, A.; Rawat, D. Evolutionary Integrated Heuristic with Gudermannian Neural Networks for Second Kind of Lane–Emden Nonlinear Singular Models. Appl. Sci. 2021, 11, 4725. [Google Scholar] [CrossRef]
  18. Haque, M.R.; Tan, S.C.; Yusoff, Z.; Nisar, K.; Kwang, L.C.; Kaspin, R.; Chowdhry, B.S.; Buyya, R.; Majumder, S.P.; Gupta, M.; et al. Automated Controller Placement for Software-Defined Networks to Resist DDoS Attacks. Comput. Mater. Contin. 2021, 68, 3147–3165. [Google Scholar] [CrossRef]
  19. Haque, M.R.; Tan, S.C.; Yusoff, Z.; Lee, C.K.; Kaspin, R. DDoS Attack Monitoring using Smart Controller Placement in Software Defined Networking Architecture. In Lecture Notes in Electrical Engineering; Springer Science and Business Media LLC: Singapore, 2018; Volume 481, pp. 195–203. [Google Scholar]
  20. Apruzzese, G.; Colajanni, M.; Ferretti, L.; Guido, A.; Marchetti, M. On the effectiveness of machine and deep learning for cyber security. In Proceedings of the 2018 10th International Conference on Cyber Conflict (CyCon), Tallinn, Estonia, 30 May–1 June 2018; pp. 371–390. [Google Scholar]
  21. Waseem, Q.; Alshamrani, S.S.; Nisar, K.; Wan Din, W.I.S.; Alghamdi, A.S. Future Technology: Software-Defined Network (SDN) Forensic. Symmetry 2021, 13, 767. [Google Scholar] [CrossRef]
  22. Nisar, K.; Jimson, E.R.; Hijazi, M.H.A.; Memon, S.K. A survey: Architecture, security threats and application of SDN. J. Ind. Electron. Technol. Appl. 2019, 2, 64–69. [Google Scholar]
  23. Kas, K.N.; Hijazi, M.H.A.; Chen, G.; Sarrafzadeh, A. A Review: Software Defined Networks Management. Proc. Asia Pac. Adv. Netw. 2015, 39, 20. [Google Scholar] [CrossRef] [Green Version]
  24. Ali, N.F.; Said, A.M.; Nisar, K.; Aziz, I.A. A survey on software defined network approaches for achieving energy efficiency in wireless sensor network. In Proceedings of the 2017 IEEE Conference on Wireless Sensors (ICWiSe), Miri, Malaysia, 13–14 November 2017; pp. 1–6. [Google Scholar]
  25. Bovenzi, G.; Aceto, G.; Ciuonzo, D.; Persico, V.; Pescape, A. A Hierarchical Hybrid Intrusion Detection Approach in IoT Scenarios. In Proceedings of the GLOBECOM 2020—2020 IEEE Global Communications Conference, Taipei, Taiwan, 7–11 December 2020; pp. 1–7. [Google Scholar]
  26. Khan, A.S.; Javed, Y.; Abdullah, J.; Zen, K. Trust-based lightweight security protocol for device to device multihop cellular communication (TLwS). J. Ambient. Intell. Humaniz. Comput. 2021, 12, 1–18. [Google Scholar] [CrossRef]
  27. Haque, M.R.; Tan, S.C.; Lee, C.K.; Yusoff, Z.; Ali, S.; Kaspin, I.R.; Ziri, S.R. Analysis of DDoS Attack-Aware Software-Defined Networking Controller Placement in Malaysia. In Recent Trends in Computer Applications; Springer Science and Business Media LLC: Berlin/Heidelberg, Germany, 2018; pp. 175–188. [Google Scholar]
  28. Jimson, E.R.; Nisar, K.; Hijazi, M.H.A. The State of the Art of Software Defined Networking (SDN) Issues in Current Network Architecture and a Solution for Network Management Using the SDN. Int. J. Technol. Diffus. 2019, 10, 33–48. [Google Scholar] [CrossRef] [Green Version]
  29. Ibrahim, A.A.A.; Nisar, K. Future internet and named data networking hourglass, packet and node architecture. J. Ind. Inf. Technol. Appl. 2018, 2, 115–123. [Google Scholar]
  30. Khan, A.S.; Balan, K.; Javed, Y.; Abdullah, J.; Tarmizi, S. Secure trust-based blockchain architecture to prevent attacks in VANET. Sensors 2019, 19, 4954. [Google Scholar] [CrossRef] [Green Version]
  31. Harada, S.; Yan, Z.; Park, Y.-J.; Nisar, K.; Ibrahim, A.A.A. Data aggregation in named data networking. In Proceedings of the TENCON 2017—2017 IEEE Region 10 Conference, Penang, Malaysia, 5–8 November 2017; pp. 1839–1842. [Google Scholar]
  32. Abbasi, I.A.; Khan, A.S.; Ali, S. A Reliable Path Selection and Packet Forwarding Routing Protocol for Vehicular Ad hoc Networks. EURASIP J. Wirel. Commun. Netw. 2018, 236, 1–19. [Google Scholar] [CrossRef] [Green Version]
  33. Nisar, K.; Amphawan, A.; Hassan, S.; Sarkar, N.I. A comprehensive survey on scheduler for VoIP over WLAN. J. Netw. Comput. Appl. 2013, 36, 933–948. [Google Scholar] [CrossRef]
  34. Sattar, F.; Hussain, M.; Nisar, K. A secure architecture for open source VoIP solutions. In Proceedings of the 2011 International Conference on Information and Communication Technologies, Karachi, Pakistan, 23–24 July 2011; pp. 1–6. [Google Scholar]
  35. Nisar, K.; Said, A.M.; Hasbullah, H. Enhanced performance of packet transmission using system model over VoIP network. In Proceedings of the 2010 International Symposium on Information Technology, Kuala Lumpur, Malaysia, 15–17 June 2010; pp. 1005–1008. [Google Scholar] [CrossRef]
  36. Sarkar, N.; Nisar, K.; Babbage, L. Performance Studies on Campus-Wide Focus on FTP, Video and VoIP Ethernet Network. Int. J. Adv. Pervasive Ubiquitous Comput. 2012, 4, 49–59. [Google Scholar] [CrossRef] [Green Version]
  37. Chaudhary, S.; Amphawan, A.; Nisar, K. Realization of free space optics with OFDM under atmospheric turbulence. Optik 2014, 125, 5196–5198. [Google Scholar] [CrossRef]
  38. Amphawan, A.; Mishra, V.; Nisar, K.; Nedniyom, B. Real-time holographic backlighting positioning sensor for enhanced power coupling efficiency into selective launches in multimode fiber. J. Mod. Opt. 2012, 59, 1745–1752. [Google Scholar] [CrossRef]
  39. Abbasi, I.A.; Khan, A.S.; Ali, S. Dynamic Multiple Junction Selection Based Routing protocol for VANETs in city environment. Appl. Sci. 2018, 8, 687. [Google Scholar] [CrossRef] [Green Version]
  40. Khan, A.S.; Lenando, H.; Abdullah, J.; Fisal, N. Secure authentication and key management protocols for mobile multihop WiMAX networks. Jurnal Teknologi 2015, 73, 75–81. [Google Scholar] [CrossRef] [Green Version]
  41. Lawal, I.A.; Said, A.M.; Nisar, K.; Mu’azu, A.A. A distributed QoS-oriented model to improve network performance for fixed WiMAX. Int. J. Recent Trends Eng. Technol. ACEEE 2014, 10, 186–202. [Google Scholar]
  42. Lawal, I.A.; Said, A.M.; Nisar, K.; Shah, P.A.; Mu’azu, A.r.A. Throughput performance improvement for VoIP applications in fixed WiMAX network using client–server model. J. Sci. Int. 2014, 26, 999–1002. [Google Scholar]
  43. Khan, A.S.; Ahmad, Z.; Abdullah, J.; Ahmad, F. A Spectrogram Image-Based Network Anomaly Detection System Using Deep Convolutional Neural Network. IEEE Access 2021, 9, 87079–87093. [Google Scholar] [CrossRef]
  44. Haque, M.R.; Tan, S.C.; Yusoff, Z.; Nisar, K.; Lee, C.K.; Kaspin, R.; Chowdhry, B.; Ali, S.; Memon, S. A Novel DDoS Attack-aware Smart Backup Controller Placement in SDN Design. Ann. Emerg. Technol. Comput. 2020, 4, 75–92. [Google Scholar] [CrossRef]
  45. Chaabouni, N.; Mosbah, M.; Zemmari, A.; Sauvignac, C.; Faruki, P. Network Intrusion Detection for IoT Security Based on Learning Techniques. IEEE Commun. Surv. Tutor. 2019, 21, 2671–2701. [Google Scholar] [CrossRef]
  46. Verwoerd, T.; Hunt, R. Intrusion detection techniques and approaches. Comput. Commun. 2002, 25, 1356–1365. [Google Scholar] [CrossRef]
  47. Li, J.; Qu, Y.; Chao, F.; Shum, H.P.H.; Ho, E.S.L.; Yang, L. Machine Learning Algorithms for Network Intrusion Detection. In Intelligent Systems Reference Library; Springer: Berlin/Heidelberg, Germany, 2018; pp. 151–179. [Google Scholar] [CrossRef]
  48. Prasad, R.; Rohokale, V. Artificial Intelligence and Machine Learning in Cyber Security. In Industrial Internet of Things; Springer Science and Business Media LLC: Berlin/Heidelberg, Germany, 2019; pp. 231–247. [Google Scholar]
  49. Chan, K.Y.; Abdullah, J.; Khan, A.S. A framework for traceable and transparent supply chain management for agri-food sector in malaysia using blockchain technology. Int. J. Adv. Comput. Sci. Appl. 2019, 10, 149–156. [Google Scholar] [CrossRef] [Green Version]
  50. Balan, K.; Khan, A.S.; Julaihi, A.A.; Tarmizi, S.; Pillay, K.S.; Abdulrazak, L.F.; Sallehudin, H. RSSI and Public Key Infrastructure based Secure Communication in Autonomous Vehicular Networks. Int. J. Adv. Comput. Sci. Appl. (IJACSA) 2018, 9, 298–304. [Google Scholar] [CrossRef] [Green Version]
  51. Ali, M.H.; Al Mohammed, B.A.D.; Ismail, A.; Zolkipli, M.F. A New Intrusion Detection System Based on Fast Learning Network and Particle Swarm Optimization. IEEE Access 2018, 6, 20255–20261. [Google Scholar] [CrossRef]
  52. Khan, N.; Abdullah, J.; Khan, A.S. Defending malicious script attacks using machine learning classifiers. Wirel. Commun. Mob. Comput. 2017, 2017. [Google Scholar] [CrossRef]
  53. Yao, H.; Fu, D.; Zhang, P.; Li, M.; Liu, Y. MSML: A Novel Multilevel Semi-Supervised Machine Learning Framework for Intrusion Detection System. IEEE Internet Things J. 2019, 6, 1949–1959. [Google Scholar] [CrossRef] [Green Version]
  54. Shone, N.; Ngoc, T.N.; Phai, V.D.; Shi, Q. A Deep Learning Approach to Network Intrusion Detection. IEEE Trans. Emerg. Top. Comput. Intell. 2018, 2, 41–50. [Google Scholar] [CrossRef] [Green Version]
  55. Khan, N.; Abdullah, J.; Khan, A.S. A dynamic method of detecting malicious scripts using classifiers. Adv. Sci. Lett. 2017, 23, 5352–5355. [Google Scholar] [CrossRef]
  56. Marir, N.; Wang, H.; Feng, G.; Li, B.; Jia, M. Distributed Abnormal Behavior Detection Approach Based on Deep Belief Network and Ensemble SVM Using Spark. IEEE Access 2018, 6, 59657–59671. [Google Scholar] [CrossRef]
  57. Zubair, S.; Fisal, N.; Abazeed, M.B.; Salihu, B.A.; Shahid Khan, A. Lightweight distributed geographical: A lightweight distributed protocol for virtual clustering in geographical forwarding cognitive radio sensor networks. Int. J. Commun. Syst. 2015, 28, 1–18. [Google Scholar] [CrossRef]
  58. Kerrache, C.A.; Ahmad, F.; Ahmad, Z.; Lagraa, N.; Kurugollu, F.; Benamar, N. Towards an Efficient Vehicular Clouds using Mobile Brokers. In Proceedings of the International Conference on Computer and Information Sciences (ICCIS), Aljouf, Saudi Arabia, 3–4 April 2019; pp. 1–5. [Google Scholar] [CrossRef]
  59. Nisar, K.; Sabir, Z.; Raja, M.A.; Ibrahim, A.A.; Erdogan, F.; Haque, M.R.; Rodrigues, J.J.; Rawat, D.B. Design of morlet wavelet neural network for solving a class of singular pantograph nonlinear differential models. IEEE Access 2021. [Google Scholar] [CrossRef]
  60. Xu, C.; Shen, J.; Du, X.; Zhang, F. An Intrusion Detection System Using a Deep Neural Network with Gated Recurrent Units. IEEE Access 2018, 6, 48697–48707. [Google Scholar] [CrossRef]
  61. Xiao, Y.; Xing, C.; Zhang, T.; Zhao, Z. An Intrusion Detection Model Based on Feature Reduction and Convolutional Neural Networks. IEEE Access 2019, 7, 42210–42219. [Google Scholar] [CrossRef]
  62. Jiang, K.; Wang, W.; Wang, A.; Wu, H. Network Intrusion Detection Combined Hybrid Sampling with Deep Hierarchical Network. IEEE Access 2020, 8, 32464–32476. [Google Scholar] [CrossRef]
  63. Khan, A.; Johari, A.; Khan, N.; Julahi, A.; Tarmizi, S. Quantum-Elliptic curve Cryptography for Multihop Communication in 5G Networks. Int. J. Comput. Sci. Netw. Secur. 2017, 17, 357–365. [Google Scholar]
  64. Wang, Z. Deep Learning-Based Intrusion Detection with Adversaries. IEEE Access 2018, 6, 38367–38384. [Google Scholar] [CrossRef]
  65. Vinayakumar, R.; Alazab, M.; Soman, K.P.; Poornachandran, P.; Al-Nemrat, A.; Venkatraman, S. Deep Learning Approach for Intelligent Intrusion Detection System. IEEE Access 2019, 7, 41525–41550. [Google Scholar] [CrossRef]
  66. Gu, S.; Rigazio, L. Towards deep neural network architectures robust to adversarial examples. arXiv 2014, arXiv:1412.5068. [Google Scholar]
  67. Khraisat, A.; Gondal, I.; Vamplew, P.; Kamruzzaman, J.; Alazab, A. A novel Ensemble of Hybrid Intrusion Detection System for Detecting Internet of Things Attacks. Electronics 2019, 8, 1210. [Google Scholar] [CrossRef] [Green Version]
  68. Ullah, I.; Mahmoud, Q.H. A Two-Level Flow-Based Anomalous Activity Detection System for IoT Networks. Electronics 2020, 9, 530. [Google Scholar] [CrossRef] [Green Version]
  69. Goyal, P.; Goyal, A. Comparative study of two most popular packet sniffing tools-Tcpdump and Wireshark. In Proceedings of the 2017 9th International Conference on Computational Intelligence and Communication Networks (CICN), Girne, Cyprus, 16–17 September 2017; pp. 77–81. [Google Scholar]
  70. Hoque, N.; Bhuyan, M.H.; Baishya, R.; Bhattacharyya, D.; Kalita, J. Network attacks: Taxonomy, tools and systems. J. Netw. Comput. Appl. 2014, 40, 307–324. [Google Scholar] [CrossRef]
  71. Ullah, I.; Mahmoud, Q.H. A Technique for Generating a Botnet Dataset for Anomalous Activity Detection in IoT Networks. In Proceedings of the 2020 IEEE International Conference on Systems, Man, and Cybernetics SMC, Toronto, ON, Canada, 11–14 October 2020; pp. 134–140. [Google Scholar] [CrossRef]
  72. Koroniotis, N.; Moustafa, N.; Sitnikova, E.; Turnbull, B. Towards the development of realistic botnet dataset in the Internet of Things for network forensic analytics: Bot-IoT dataset. Future Gener. Comput. Syst. 2019, 100, 779–796. [Google Scholar] [CrossRef] [Green Version]
  73. Ambusaidi, M.A.; He, X.; Nanda, P.; Tan, Z. Building an Intrusion Detection System Using a Filter-Based Feature Selection Algorithm. IEEE Trans. Comput. 2016, 65, 2986–2998. [Google Scholar] [CrossRef] [Green Version]
  74. Saleem, M.A.; Alyas, T.; Asfandayar; Ahmad, R.; Farooq, A.; Ali, K.; Idrees, M.; Khan, A.S. Systematic literature review of identifying issues in software cost estimation techniques. Int. J. Adv. Comput. Sci. Appl. 2019, 10, 341–346. [Google Scholar] [CrossRef] [Green Version]
  75. Usman, M.; Zubair, M.; Ahmad, Z.; Zaidi, M.; Ijyas, T.; Parayangat, M.; Wajid, M.; Shiblee, M.; Ali, S.J. Heart rate detection and classification from speech spectral features using machine learning. Arch. Acoust. 2021, 46, 41–53. [Google Scholar] [CrossRef]
  76. Usman, M.; Ahmad, Z.; Wajid, M. Dataset of Raw and Pre-processed Speech Signals, Mel Frequency Cepstral Coefficients of Speech and Heart Rate Measurements. In Proceedings of the 5th International Conference on Signal Processing, Computing and Control (ISPCC), Solan, India, 10–12 October 2019; pp. 376–379. [Google Scholar] [CrossRef] [Green Version]
  77. Bisong, E. Google Colaboratory. In Building Machine Learning and Deep Learning Models on Google Cloud Platform; Apress: Berkeley, CA, USA, 2019; pp. 59–64. [Google Scholar]
  78. Dildar, M.S.; Khan, N.; Abdullah, J.B.; Khan, A.S. Effective way to defend the hypervisor attacks in cloud computing. In Proceedings of the 2nd International Conference on Anti-Cyber Crimes, ICACC, Abha, Saudi Arabia, 26–27 March 2017; pp. 154–159. [Google Scholar]
  79. Google Research Colaboratory. 2021. Available online: https://colab.research.google.com (accessed on 10 July 2021).
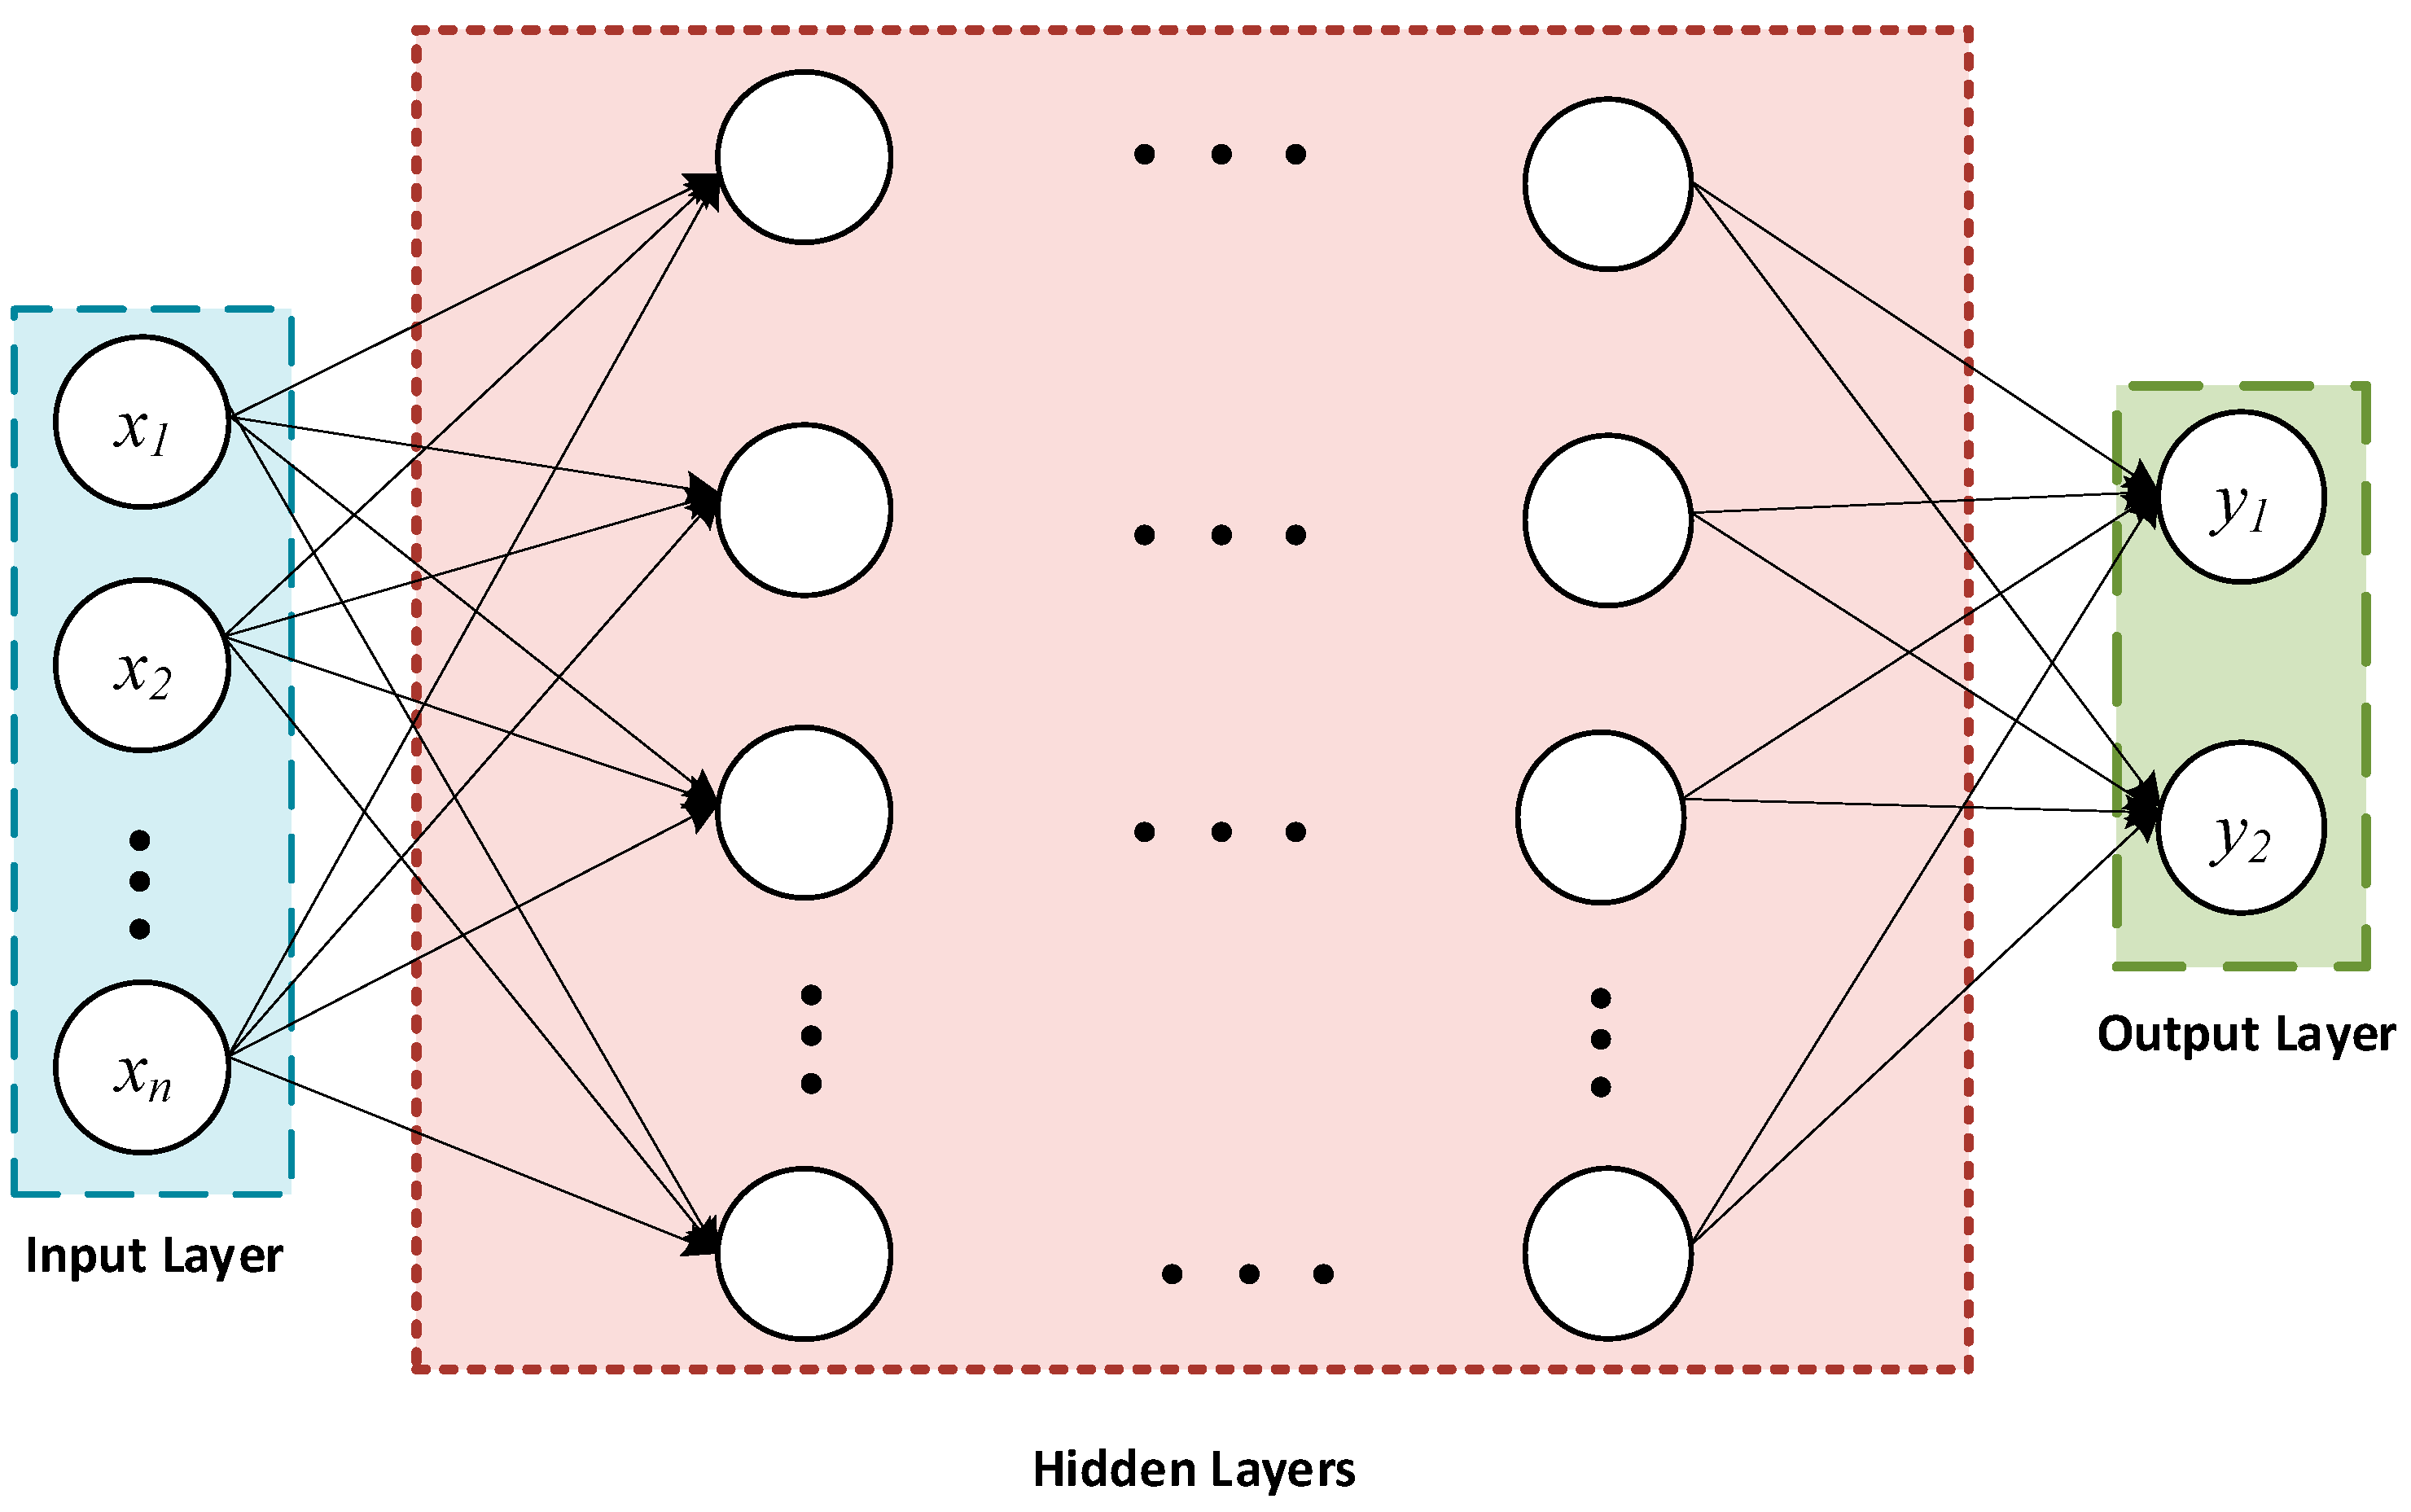
Figure 1. A general Deep Neural Network architecture.
Applsci 11 07050 g001
Figure 2. A three-layered IoT architecture.
Applsci 11 07050 g002
Figure 3. Proposed Methodology.
Applsci 11 07050 g003
Figure 4. Numerical features of the Bot-IoT dataset arranged in descending order based on MI score.
Applsci 11 07050 g004
Figure 5. Performance Evaluation Metrics for different DL-based IDS methodologies.
Applsci 11 07050 g005
Figure 6. Performance of different DL-based IDS schemes in terms of FAR and FNR.
Applsci 11 07050 g006
Figure 7. Improvement in DNN’s performance comparing other DL-based schemes.
Applsci 11 07050 g007
Figure 8. Accuracy [%] of DL-based schemes for the different number of features.
Applsci 11 07050 g008
Figure 9. The confusion matrix of DNN-IDS methodology considering the different number of features.
Applsci 11 07050 g009
Figure 10. All types of features of the Bot-IoT dataset arranged in descending order based on MI score.
Applsci 11 07050 g010
Figure 11. Comparison of Accuracy scores considering different features of different data types.
Applsci 11 07050 g011
Figure 12. The confusion matrix of DL-NIDS methodology considering the top 05 features with MI > 0.5.
Applsci 11 07050 g012
Table 1. IoT-Botnet 2020 Dataset Distribution.
CategoryIoT-Botnet DatasetThis Study
No. of RecordsNo. of RecordsTrain [75%]Test [25%]
Benign971979719772,90724,290
Anomaly1843192300520225,38075,140
Total Samples1940389397717298,28799,430
Table 2. IoT-Botnet 2020 Dataset Feature set.
FeatureData TypeFeature Data TypeFeature Data TypeFeature Data Type
Flow_ID CategoricalFlow_IAT_MeanFloatPkt_Len_Max FloatSubflow_Fwd_PktsInteger
Src_IP CategoricalFlow_IAT_Std, FloatPkt_Len_MeanFloatSubflow_Fwd_BytsInteger
Src_Port IntegerFlow_IAT_Max FloatPkt_Len_Std FloatSubflow_Bwd_PktsInteger
Dst_IP CategoricalFlow_IAT_Min FloatPkt_Len_Var FloatSubflow_Bwd_Byts Integer
Dst_Port IntegerFwd_IAT_Tot FloatFIN_Flag_Cnt IntegerInit_Fwd_Win_Byts Integer
Protocol IntegerFwd_IAT_Mean FloatSYN_Flag_Cnt IntegerInit_Bwd_Win_Byts Integer
TimestampCategoricalBwd_IAT_Mean FloatRST_Flag_Cnt IntegerFwd_Act_Data_Pkts Integer
Flow_DurationIntegerFwd_IAT_Max FloatPSH_Flag_CntIntegerFwd_Seg_Size_Min Integer
Tot_Fwd_Pkts IntegerFwd_IAT_Min FloatACK_Flag_CntIntegerActive_Mean Float
Tot_Bwd_Pkts IntegerBwd_IAT_Tot FloatURG_Flag_CntIntegerActive_Std Float
TotLen_Fwd_Pkts FloatBwd_IAT_Mean.1 FloatCWE_Flag_CountIntegerActive_Max Float
TotLen_Bwd_Pkts FloatBwd_IAT_Std FloatECE_Flag_CntIntegerActive_Min Float
Fwd_Pkt_Len_Max FloatBwd_IAT_MaxFloatDown/Up_RatioFloatIdle_Mean Float
Fwd_Pkt_Len_Min FloatBwd_IAT_MinFloatPkt_Size_AvgFloatIdle_Std Float
Fwd_Pkt_Len_MeanFloatFwd_PSH_FlagsIntegerFwd_Seg_Size_AvgFloatIdle_Max Float
Fwd Pkt Len StdFloatBwd_PSH_Flags IntegerBwd_Seg_Size_Avg FloatIdle_Min Float
Bwd Pkt Len MaxFloatFwd_URG_Flags IntegerFwd_Byts/b_Avg FloatLabel Integer
Bwd Pkt Len MinFloatBwd_URG_Flags IntegerFwd_Pkts/b_AvgIntegerCat Categorical
Bwd Pkt Len MeanFloatBwd_Header_Len IntegerFwd_Blk_Rate_AvgIntegerSub_CatCategorical
Bwd_Pkt_Len_Std FloatFwd_Pkts/sFloatBwd_Byts/b_AvgInteger
Flow_Byts/sFloatBwd_Pkts/s FloatBwd_Pkts/b_AvgInteger
Flow_Pkts/s FloatPkt_Len_Min FloatBwd_Blk_Rate_AvgInteger
Table 3. A Confusion Matrix.
PREDICTED CLASS
ANOMALYBENIGN
ACTUAL CLASSANOMALYTrue Positive ( T P )False Negative ( F N )
BENIGNFalse Positive ( F P )True Negative ( T N )
Table 4. Performance Evaluation metrics score [%].
DL
Algorithms
AccuracyPrecisionRecallF1 ScoreFARTNRFNR
RNN98.43598.57997.17097.8505.30394.6970.357
CNN-1D98.88299.11397.85798.4664.14695.8540.140
GRU98.39498.49197.14397.7955.30394.6970.411
LSTM96.41096.59493.59794.98011.90288.0980.904
DNN99.01099.30498.02098.6423.91596.0850.044
Table 5. Performance Evaluation metrics score of individual classes [%].
DL AlgorithmsAnomalyBenign
PrecisionRecallF1-ScorePrecisionRecallF1-Score
RNN98.30999.64398.97298.84894.69796.728
CNN-1D98.67699.86099.26599.55195.85497.668
GRU98.30899.58998.94498.67494.69796.645
LSTM96.26399.09697.65996.92588.09892.301
DNN98.75099.95699.34999.85996.08597.936
Table 6. Top Features with MI score 0.5 .
FeatureMI ScoreFeatureMI ScoreFeatureMI Score
Cat_Normal0.694397Sub_Cat_Normal0.693928Src_IP0.693317
Dst_IP0.573648Src_Port0.559126
Publisher’s Note: MDPI stays neutral with regard to jurisdictional claims in published maps and institutional affiliations.