Article

Fault Location and Restoration of Microgrids via Particle Swarm Optimization

Department of Industrial Education and Technology, National Changhua University of Education, No. 2, Shida Rd., Changhua 500, Taiwan
*
Authors to whom correspondence should be addressed.
Appl. Sci. 2021, 11(15), 7036; https://doi.org/10.3390/app11157036
Submission received: 27 June 2021 / Revised: 25 July 2021 / Accepted: 28 July 2021 / Published: 30 July 2021
(This article belongs to the Special Issue Smart Service Technology for Industrial Applications)

Abstract

:
This aim of this work was to develop an integrated fault location and restoration approach for microgrids (MGs). The work contains two parts. Part I presents the fault location algorithm, and Part II shows the restoration algorithm. The proposed algorithms are implemented by particle swarm optimization (PSO). The fault location algorithm is based on network connection matrices, which are the modifications of bus-injection to branch-current and branch-current to bus-voltage (BCBV) matrices, to form the new system topology. The backward/forward sweep approach is used for the prefault power flow analysis. After the occurrence of a fault, the voltage variation at each bus is calculated by using the Zbus modification algorithm to modify Zbus. Subsequently, the voltage error matrix is computed to search for the fault section by using PSO. After the allocation of the fault section, the multi-objective function is implemented by PSO for optimal restoration with its constraints. Finally, the IEEE 37-bus test system connected to distributed generations was utilized as the sample system for a series simulation and analysis. The outcomes demonstrated that the proposed optimal algorithm can effectively solve fault location and restoration problems in MGs.

1. Introduction

Microgrids (MGs) can be regarded as a “set of load clusters, distributed generations (DGs), and energy storage systems” [1,2,3]. In terms of the traditional power grid, MGs are the partial active networks in distribution systems. Therefore, the type and ownership of MGs can vary considerably, such as utility and customer MGs. Utility MGs include distribution substations, main transformers, full feeders, partial feeders, or distribution transformer-level MGs. However, regardless of their type, MGs are capable of operating in grid-tied and islanding modes through the point of common coupling, which is the connection point between the MGs and the main grid that is created by a static switch.
Traditional passive distribution networks, which do not have DG interconnection, spend more than half an hour on fault detection, isolation, and restoration (FDIR). As a result of the high penetration of DGs in feeders to form active distribution networks, large amounts of data are available and are received by the feeder dispatch control center or distribution dispatch control center; consequently, the FDIR concept in distribution contingencies is different, in which rigorous fault current calculation approaches are proposed by DGs [4,5,6,7]. Besides, the advanced information and communication techniques in FDIR are proposed to restore power to as many systems as possible and to reduce power restoration time after the occurrence of feeder faults in a radial-type feeder arrangement [8,9,10]. In the past few decades, many customers in rural distribution networks served by power companies have experienced long power outages, especially those in upstream networks. A recent, possible solution for rapid and effective restoration is to operate these feeders as MGs because DGs composed of photovoltaics and wind power are interconnected in rural distribution feeders.
The key points of FDIR in MGs for outages attributed to overhead conductors or underground cables are fault location and restoration algorithms; therefore, IEEE Std C37.114 [11] and EPPRI [12] have presented essential data and approaches for distribution fault location. Gush et al. [13] proposed fault detection and location in a microgrid using mathematical morphology and recursive least-square methods to detect and classify the faults in microgrids. Zheng et al. [14] proposed a method for early detection and area location of short-circuit faults in microgrid based on the relationship between the first peak value of fault current wavelet energy spectrum. Hong et al. [15] also presented a fault detection, classification, and localization method that is based on a multi-resolution analysis of the discrete wavelet transform and a Taguchi-based artificial neural network. Wang et al. [16] proposed an effective ground fault location scheme using unsynchronized data for multi-terminal lines; this scheme does not require the data from each terminal to be synchronized. Yang et al. [17] presented a joint power restoration approach in active distribution networks that combines DG local restoration and switcher operation-based restoration to enhance self-healing. Gush et al. [18] proposed an intelligent fault classification and location identification method for microgrids using discrete orthonormal Stockwell transform (DOST)-based optimized multi-kernel extreme learning machine (MKELM). Wang et al. [19] proposed a decentralized outage detection algorithm that uses AMI meters to obtain the total number of customers and the total amount of lost load in the outage area. The ability to perform a black start is vital for MGs. Hence, Wang et al. [20] proposed a parallel restoration strategy that considers the characteristics of DGs for MG black starts. These state-of-the-art studies presented power restoration approaches in modern active distribution networks and revealed that MGs are distinct from traditional passive radial-type networks.
Swarm intelligence (SI) is the collective behavior of decentralized, self-organized systems, which is usually inspired by nature such as biological systems. SI has been used for a wide range of engineering applications, including power systems, for its simple rules and ability to solve any type of problem. Ahmed et al. [21] have discussed the advantages and disadvantages of the genetic algorithm (GA), artificial bee colony (ABC), etc., for fault location estimation. Li et al. [22] proposed a combined biogeography-based optimization with a population competition algorithm method to plan a substation location. Abdelwanis et al. [23] used the coyote optimization algorithm to estimate the parameters of transformers. Niccolai et al. [24] used the evolutionary algorithms to optimize the deployment of electric vehicle-charging stations.
MGs provide feasible and reliable power restoration after an upstream system outage, such as transmission line, main transformer, and feeder failures. In this paper, the network connection matrices are used to quickly form the system topology before and after the occurrence of a fault, and the voltage error matrix is computed to search for the fault section by using PSO instead of brute force. After the allocation of the fault section, the multi-objective function is also implemented by PSO for optimal restoration with its constraints. Consequently, an integrated fault location and restoration approach for MGs is proposed to effectively solve the FDIR problem in MGs. This paper is divided into six sections. Section 1 introduces the background and objective of the study. Section 2 describes the flow chart of the proposed approach. Section 3 explains the fault location algorithm and solution procedure. Section 4 presents the power restoration algorithm and solution procedure. Section 5 discusses the simulation results. Section 6 presents the conclusion.

2. Problem Description of Fault Location and Service Restoration in MGs

Fault location and restoration problems in MGs can be divided into two layers. The flow chart of the proposed approach is shown in Figure 1. The first priority is to establish the network topology by using bus connection matrices based on graph theory; the bus impedance matrix (ZBus) can be easily obtained by multiplying the bus-injection to the branch-current (BIBC) and the branch-current to bus-voltage (BCBV) matrices [25,26] according to the system topology, which changes during pre-fault and fault conditions.
The methods used for fault detection and isolation are summarized as follows:
(1)
Impedance method;
(2)
High-frequency components and wavelet transform;
(3)
Artificial neural network;
(4)
Comparison measurement and simulation value;
(5)
Hybrid method.
In general, the fault current contributed by the upstream main grid and DGs causes bus voltage variation, and it is used to determine the fault location in MGs. Brahma [15] used synchronized voltage and current measurements to detect the fault section in distribution systems with high DG penetration; however, how to effectively rebuild the ZBus after the fault has occurred is the key factor. Unfortunately, much of the available research is weak on this point, and therefore, the aim of this work is to effectively rebuild the ZBus corresponding to the network topology under post-fault conduction. The concept used in the proposed approach in this paper is based on the impedance method, PSO, and the synchronized voltage and current measurement technique proposed in [15]. A distinct, systematic and effective graph theory-based algorithm is proposed for fault location in MGs. Therefore, only a minor modification of the BIBC matrix built in the pre-fault stage is needed in the fault stage; and a new, fast, and effective ZBus is derived. This approach is applicable to unbalanced distribution networks and is different from the traditional ZBus modification method, which is used in three-phase balanced systems. Service restoration implemented by PSO algorithm follows fault detection and isolation and is aimed at a minimum number of switches and loss of electricity service.

3. Derivation of Fault Location Approach

The fault location approach proposed in this study is described in detail. The first step of the proposed method is to calculate the pre-fault and fault bus voltages. Therefore, a fast and systematic power flow method should be developed to avoid rebuilding ZBus due to the different network topologies before and after the occurrence of a fault. Consequently, graph theory is applied to develop the bus impedance matrix for the power flow solution and fault current calculation. Finally, the proposed voltage error matrix (VEM) and particle swarm optimization (PSO) are used to determine the fault location. The detailed theory of the proposed method is described here.

3.1. Graph Theory-Based Power Flow Algorithm

A combination of ZBus, graph theory and backward/forward sweep algorithm are applied in the power flow analysis. A systematic approach, graph theory, is used to build incidence matrices that correspond to network topologies. The proposed algorithm uses the A incidence matrix, which is the element–bus incidence matrix, and the K matrix, which is the branch–path incidence matrix. The BIBC and BCBV matrices can be established according to the network topology based on these matrices. Furthermore, the BIBC and BCBV matrices are applied in the power flow algorithm. The solution procedure of the proposed power flow is described as follows.
Step 1: Establish A matrix. Derive K matrix using Equation (1). Build the BIBC matrix using Equation (2).
K = [ A 1 ] t
[ B I B C ] = K
Step 2: Transpose the BIBC matrix and add the primitive line impedance, which means total series impedance between two connection buses into the corresponding non-zero element position to derive the BCBV matrix.
Step 3: Build the bus impedance matrix using Equation (3) by multiplying the BIBC and BCBV matrices.
[ Z B u s ] = [ B I B C ]   [ B C B V ]
Step 4: Calculate the equivalent bus injection current at each bus connected to the source or load using Equation (4), where Pi and Qi are active and the reactive power at each bus, Vik is the bus voltage magnitude, which is set to 1.0 pu at the initial condition.
I i k = ( P i + j Q i V i k )
Step 5: Compute the voltage derivation of each bus using Equation (5).
[ Δ V k ] = [ Z B u s ] [ I k ]
Step 6: Using Equation (6) to update the bus voltage, where V n o _ l o a d is the no-load voltage at each bus, i.e., the bus voltage is assumed as 1.0 pu, that is,
[ V k + 1 ] = [ V n o _ l o a d ] [ Δ V k ]
Step 7: Check the convergence by Equation (7). If Equation (7) is true, then there is no convergence; therefore, proceed to Step 4; otherwise, end the solution procedure. ε is the maximum toleration, that is
m a x i ( | I i k + 1 | | I i k | ) > ε

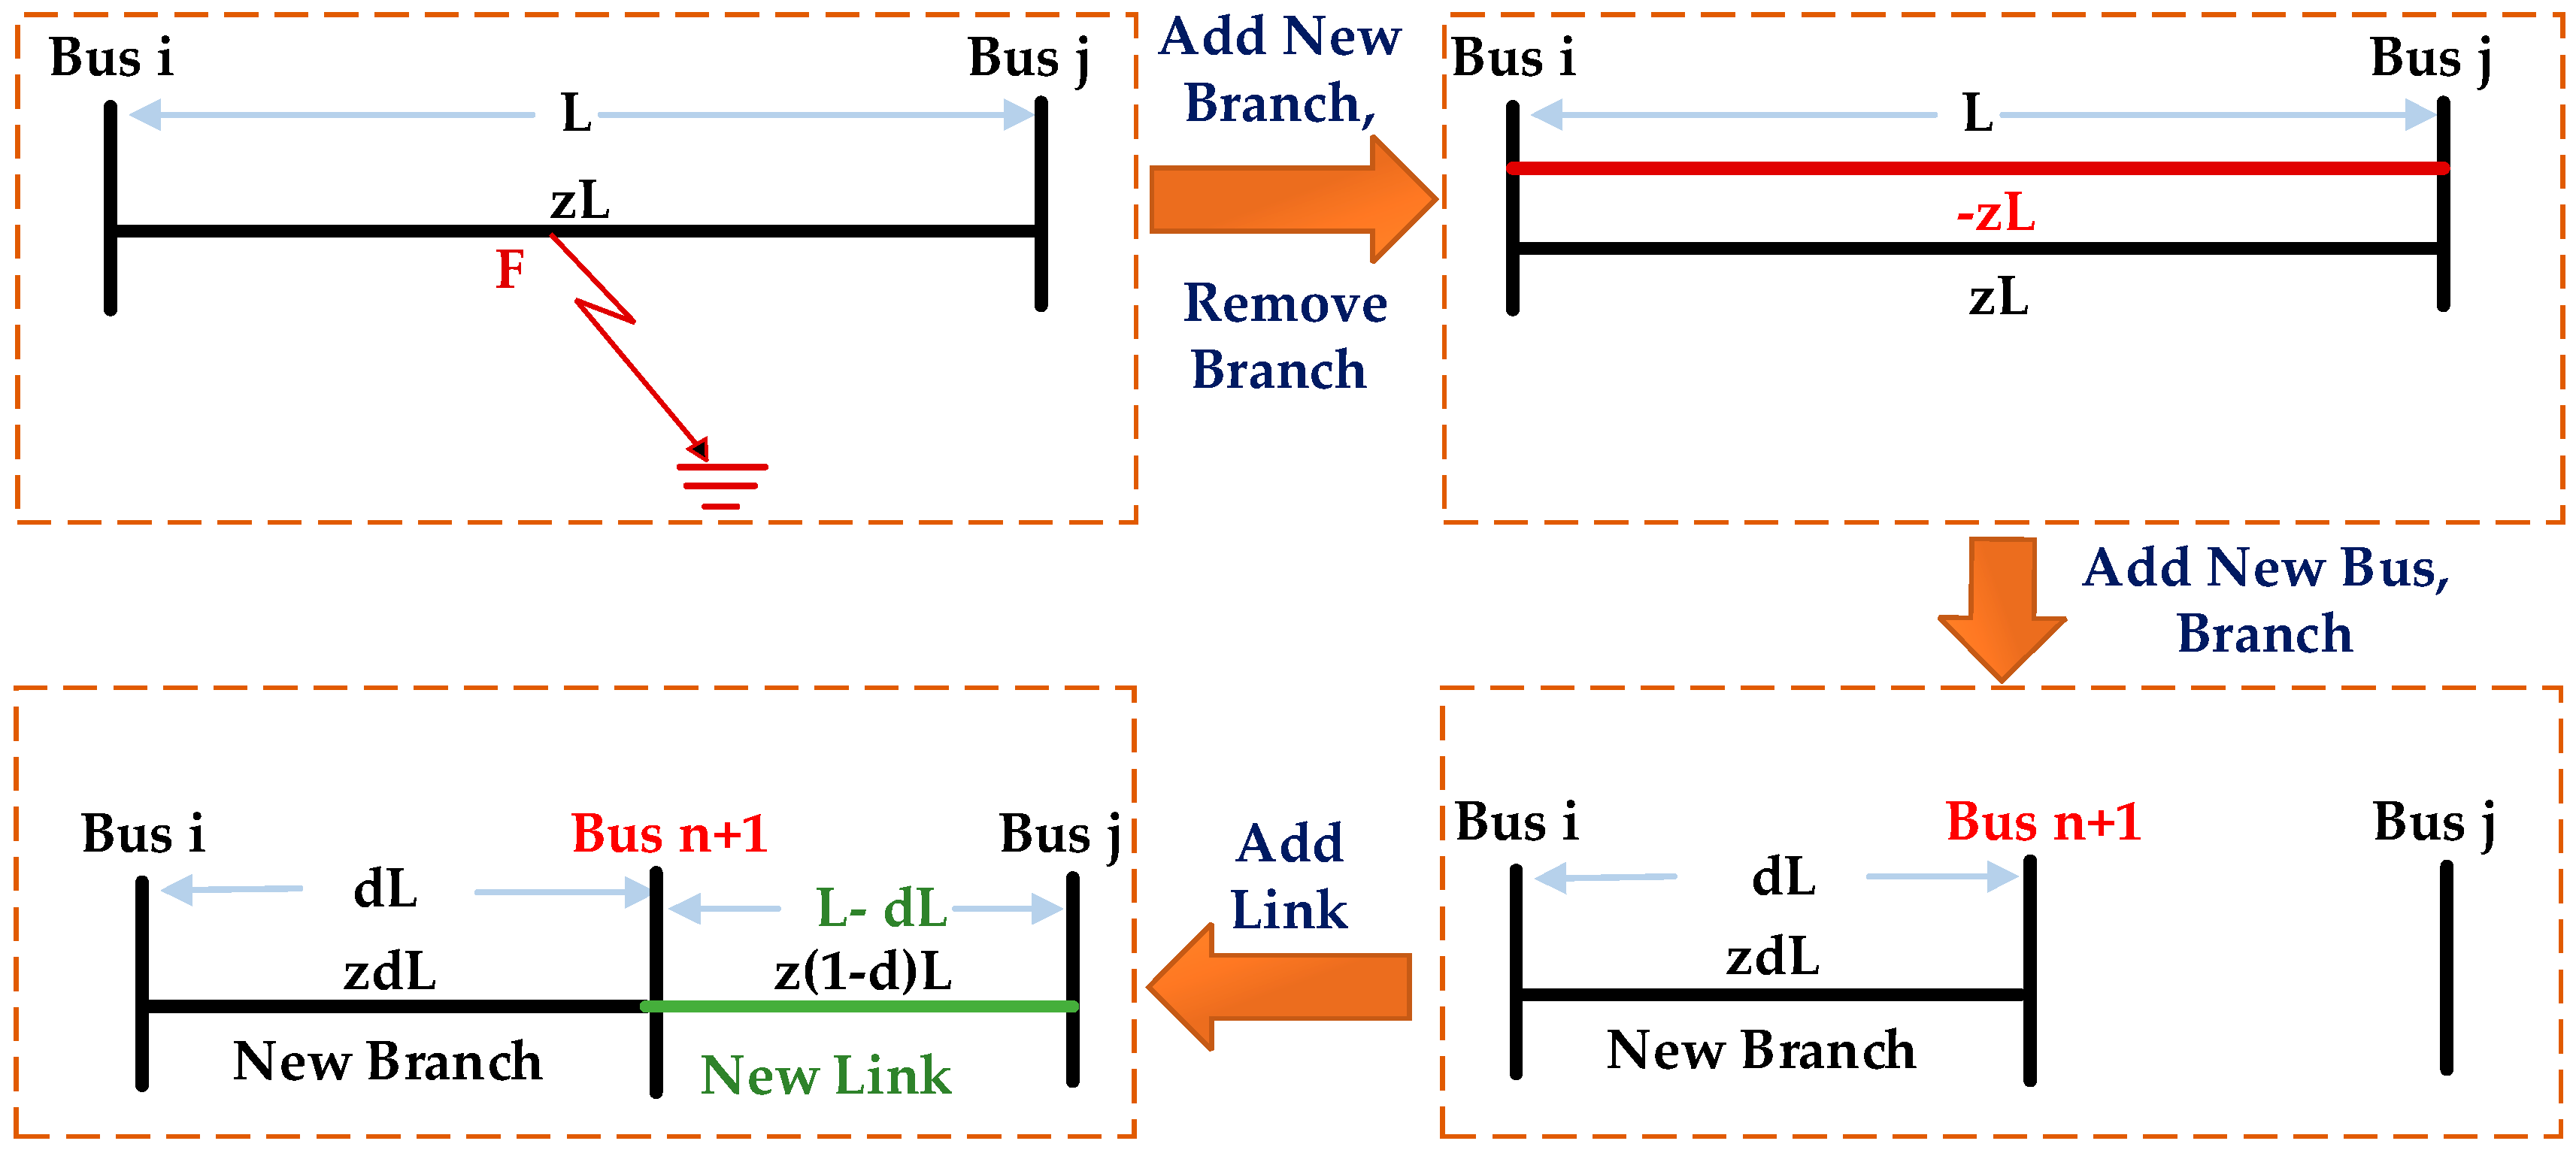
3.2. Fault Location Alogrithm Based on ZBus

The proposed fault location algorithm uses the bus voltage variation, which is caused by the fault current contributed by the upstream utility grid, and distributed energy resources to determine fault locations. A fast ZBus modified algorithm based on the BIBC and BCBV matrices is necessary for the rigid computation of the bus voltage variations before and after the occurrence of a fault. Therefore, ZBus can be built by using Equation (3) according to the pre-fault network topology. ZBus needs to be modified when a short-circuit fault occurs at bus k. We assumed that the MGs are equipped with measuring devices placed at the output terminals of each DG unit. During fault conditions, the values of zero-sequence, positive-sequence, and negative-sequence voltages and currents are recorded by the measuring devices and can be used to obtain the zero-, positive-, and negative-sequence Thevenin impedances of the DGs [27], respectively. The phase frame impedance of the DGs is calculated by using Equation (8), where a = e j 2 π 3 , Z S is the sequence impedance. The derived Thevenin impedances of all DGs are added as branches from the connected buses to the reference bus. Consequently, ZBus can be modified according to the minor changes in the BIBC and BCBV matrices.
Z a b c = ( Z S a Z S a b Z S a c Z S b a Z S b Z S b c Z S c a Z S c b Z S c ) = 1 3 ( 1 1 1 1 a a 2 1 a 2 a ) ( Z S ( 0 ) 0 0 0 Z S ( 1 ) 0 0 0 Z S ( 2 ) ) ( 1 1 1 1 a 2 a 1 a a 2 )
While a three-phase short-circuit fault occurs at bus j, the bus voltage can be expressed as the pre-fault voltage plus the voltage deviation caused by the fault current by Equation (9). The voltage at faulted bus j can be obtained by Equation (10) and can also be derived by multiplying the fault current by the fault impedance as shown in Equation (11).
[ V 1 a b c ( F ) V j a b c ( F ) V n a b c ( F ) ] = [ V 1 a b c ( 0 ) V j a b c ( 0 ) V n a b c ( 0 ) ] + [ Z 11 a b c Z 1 j a b c Z 1 n a b c Z j 1 a b c Z j j a b c Z j n a b c Z n 1 a b c Z n j a b c Z n n a b c ] [ 0 I j a b c ( F ) 0 ]
V j a b c ( F ) = V j a b c ( 0 ) Z j j a b c I j a b c ( F )
V j a b c ( F ) = Z f a b c I j a b c ( F )
Therefore, the fault current can be obtained from Equations (10) and (11), as shown in Equation (12), for the three-phase bolted fault. Z f a b c = 0 , and V j a b c ( F ) = 0 .
I j a b c ( F ) = V j a b c ( 0 ) Z j j a b c + Z f a b c
where
V j a b c ( 0 ) is the pre-fault three-phase voltage at bus j,
I j a b c ( F ) is the fault three-phase current from bus j to the ground,
Z j j a b c is the equivalent three-phase impedance from bus j and can be obtained from ZBus,
Z f a b c is the three-phase fault impedance.
Using Equation (12), the bus voltage derivation at bus i due to a fault at bus j is expressed as Equation (13).
Δ V i j a b c = Z b u s ( i ,   j ) × I j a b c ( F )
The three-phase bus voltage derivation at all DG buses for the assumed fault location can be calculated by Equation (13). The first step of the proposed algorithm is to calculate the voltage error at each bus, as shown in Equation (14). The voltage error at bus j is expressed as the norm of the difference between the voltage derivation and the value of the measured voltage. In real-time application, the voltage derivation ( Δ V S ( i ) f ( j ) a b c ) at bus j is caused by the fault current contributed by source bus i, which represents the upstream utility grid or DG. The value of the measured voltage ( Δ V S ( i ) m e a s . a b c ) can be obtained by the synchronized voltage and current measurement device, with millisecond level response time installed in each fault current contributed source, from the energy management system of the MG, and m in Equation (14) represents the number of fault current sources. For an n-bus MG, the VEM can be established, as shown in Equation (15). The smallest value of the element in the VEM denotes the bus with the short-circuit fault. It is noteworthy that the fault current is generally about ten times the normal load current; besides, the fault current contributed by DG is two times the rated output current limited by inverter of photovoltaic. Therefore, the measurement device is able to distinguish the fault current and normal current contributed by load and DG, and then it can be determined whether the bus voltage deviation is caused by fault current or normal current. Additionally, the computing time depends on the bus number of the system; fortunately, this is not a problem for MGs, which the system is relatively smaller than a distribution feeder, such as a partial feeder MG or a community MG.
v e j = i = 1 m ( Δ V S ( i ) f ( j ) a Δ V S ( i ) m e a s . a ) 2 + ( Δ V S ( i ) f ( j ) b Δ V S ( i ) m e a s . b ) 2 + ( Δ V S ( i ) f ( j ) c Δ V S ( i ) m e a s . c ) 2
V E M = [ v e 1 v e j v e n ] ,   B u s   number = 1 , , n

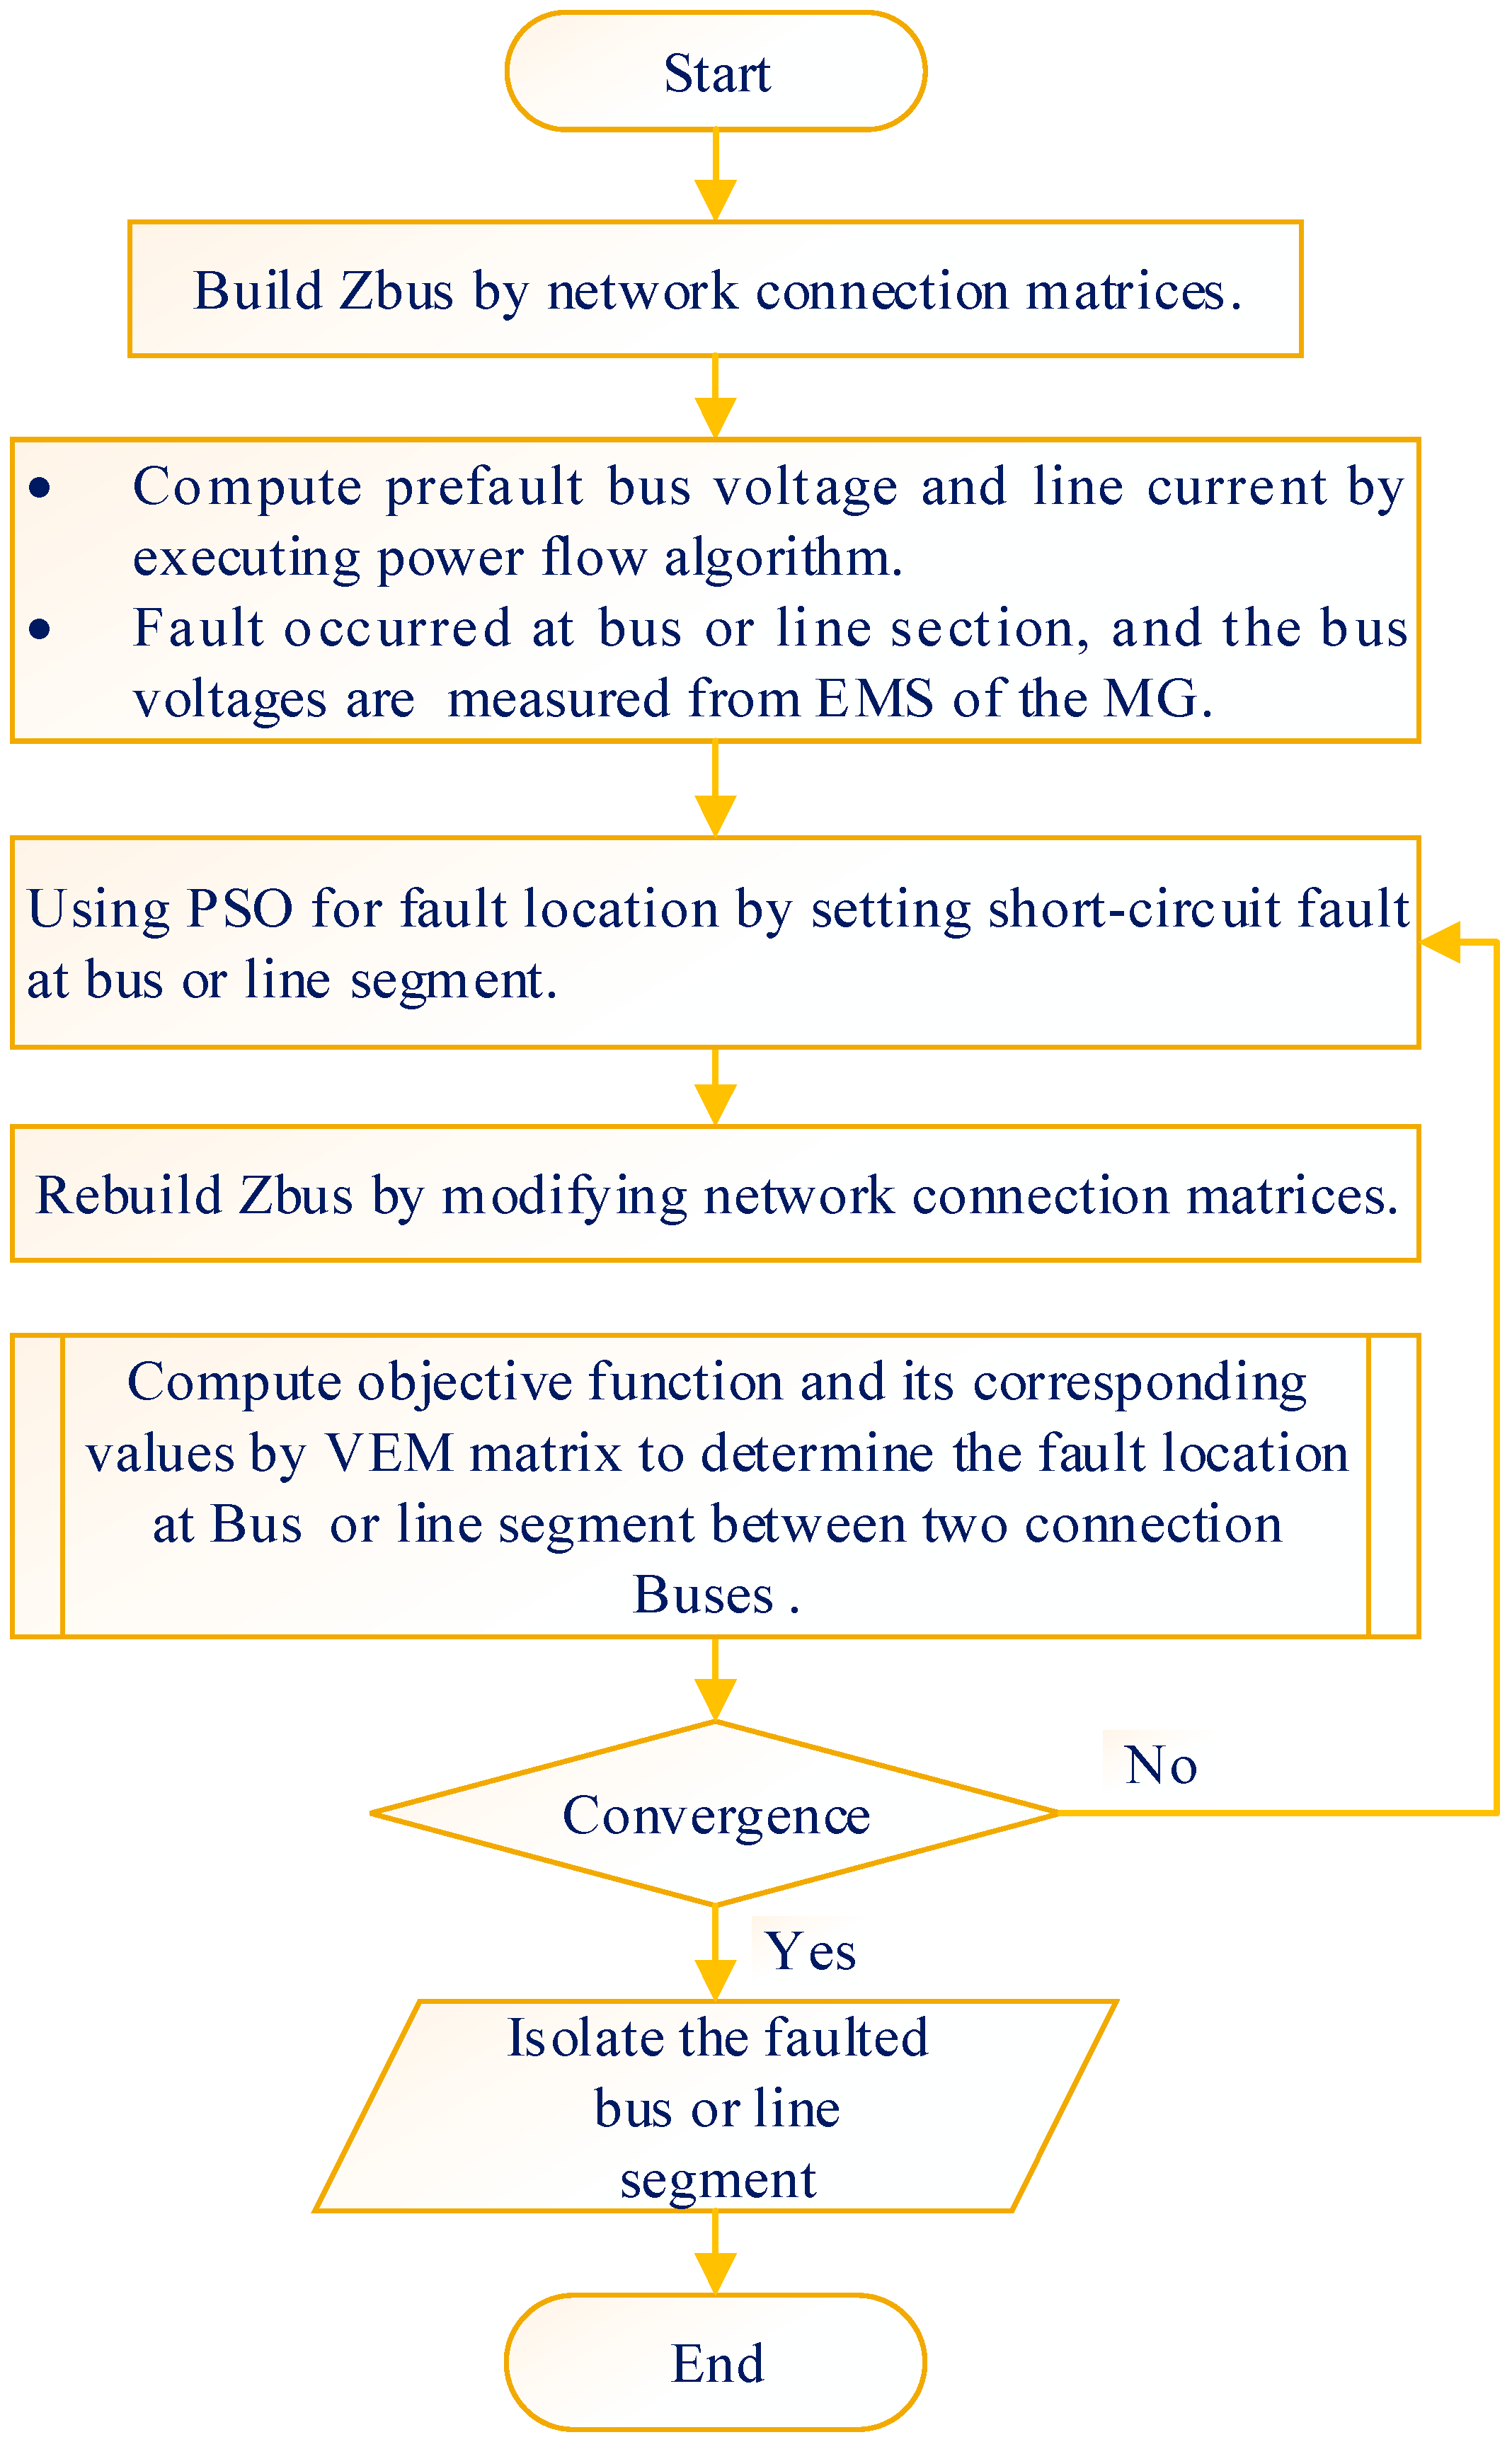
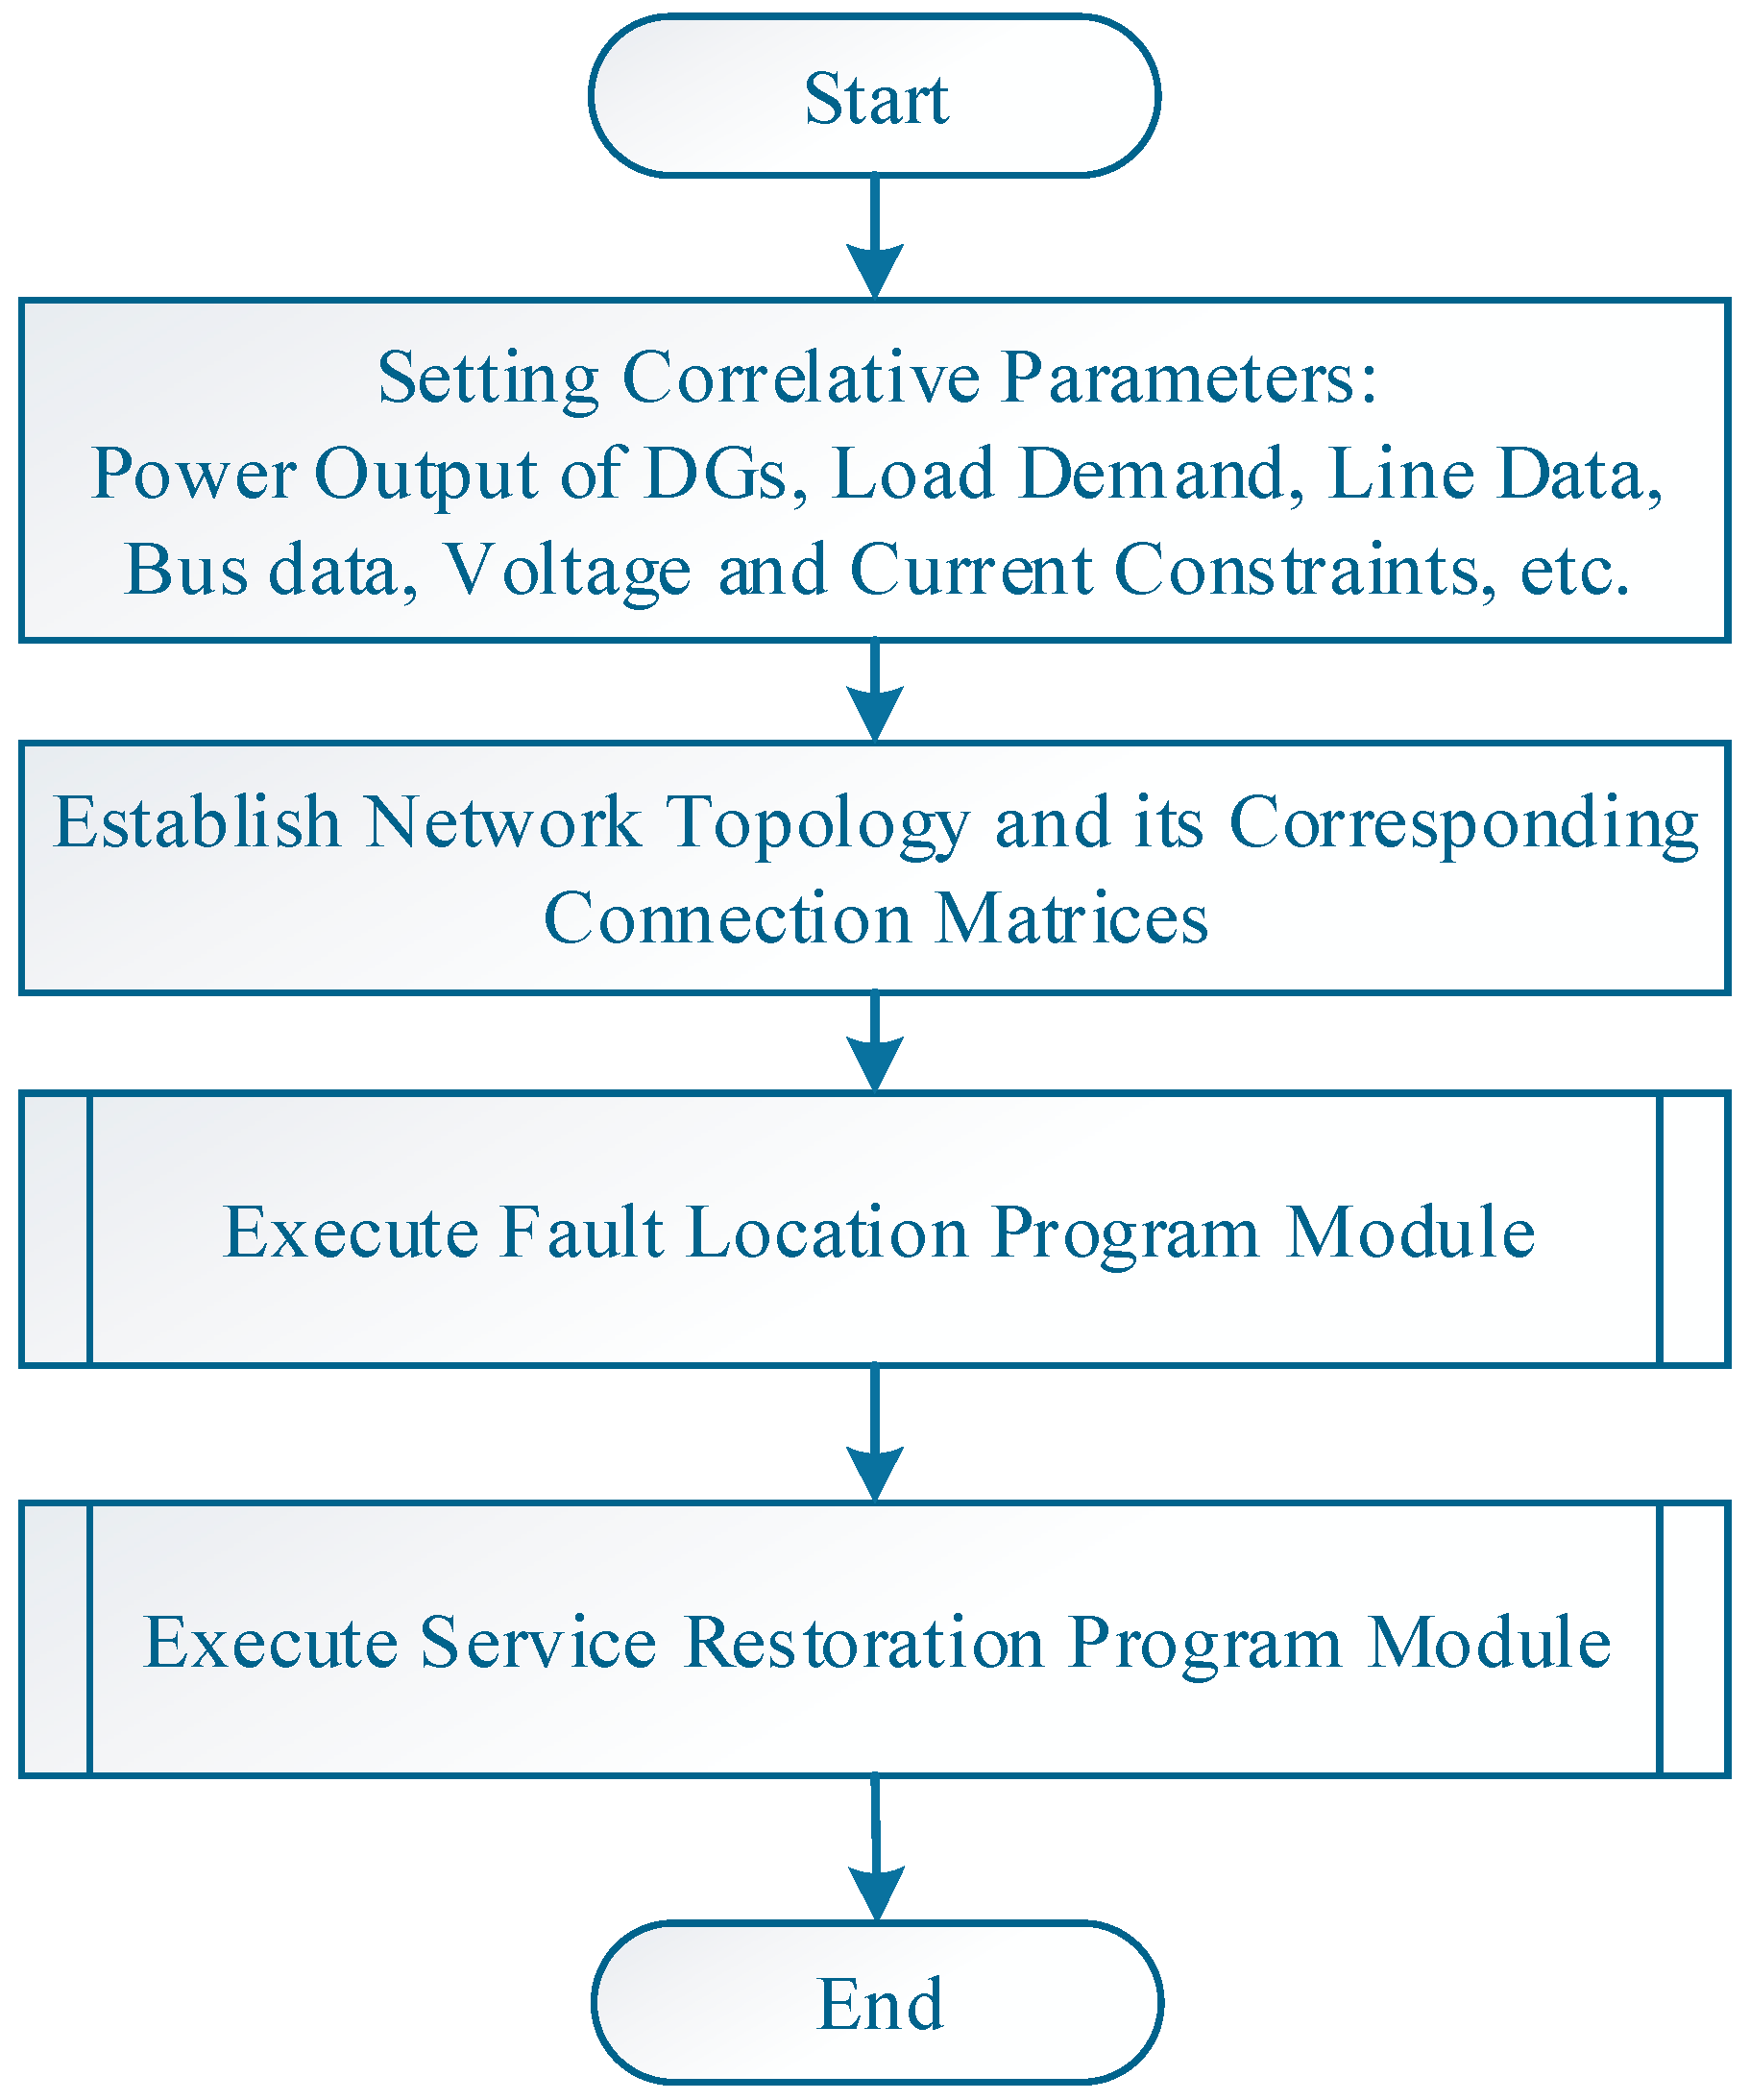
3.3. Solution Procedure of the Proposed Fault Location Algorithm

Short-circuit faults may occur at the bus or in the line segment. Thus, ZBus can be modified on two conditions. If the fault occurs at the bus, then ZBus does not need to be modified. Otherwise, if the fault occurs in the line segment, a negative impedance in the line segment should be added to remove the original line segment. Then, a virtual bus that is assumed to be in the middle of the line segment, as well as two elements, should be added, with one element added as a new branch from the existing bus to the virtual bus, and with the other element added as a new link from the virtual bus to the other existing bus; the procedure is shown in Figure 2. Therefore, the dimension of the BIBC matrix becomes ( n + 1 ) × ( n + 1 ) , and the new ZBus can be derived by using Equation (3). The fault point is assumed at the virtual bus. In this study, PSO [28,29] is used to search for the faulted bus, and the assumed faulted bus is modeled as a particle whose objective function is shown in Equation (16). The fault will be detected according to the minimal value of the voltage error in the VEM. The proposed fault location approach of the MG is shown in Figure 3.
F = min   v e i ,   v e i V E M

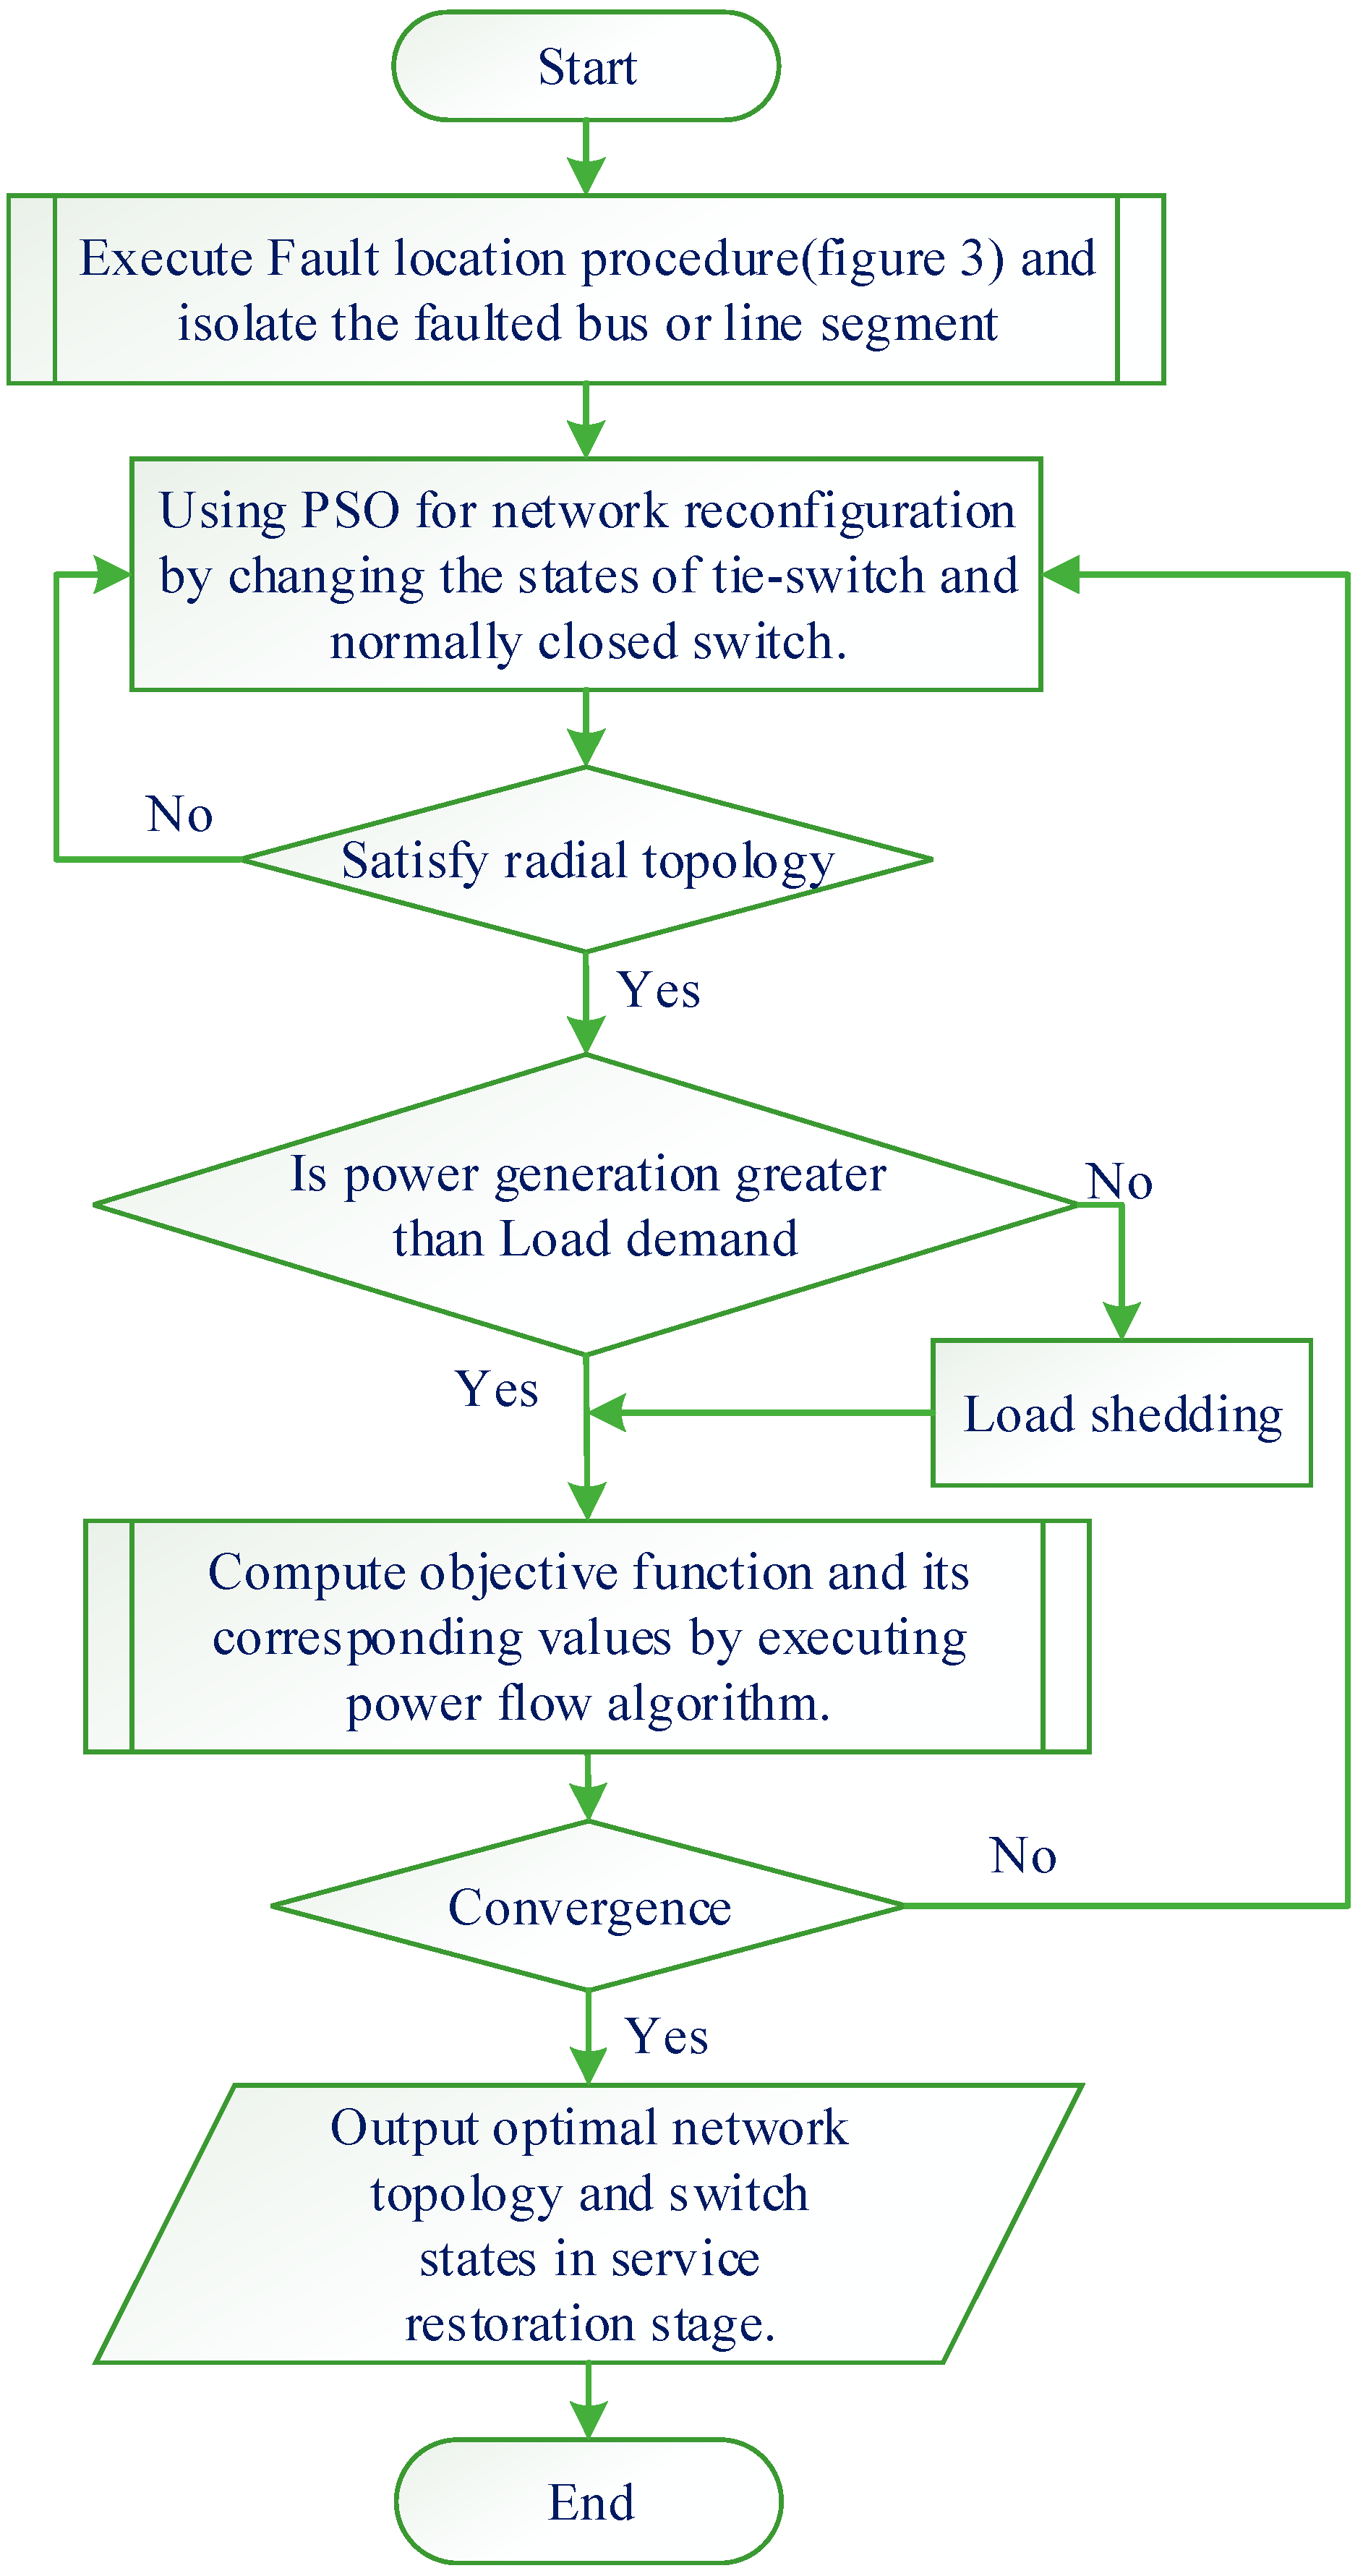
4. Proposed Service Restoration Approach

MGs are capable of grid-tied and islanding operations integrated with DGs and loads. Therefore, electricity service restoration can be divided into two operation modes. Regardless of the operation mode, service restoration is aimed at reducing the out-of-service un-faulted zone and then minimizing its effect. Consequently, the service restoration problem can be described as the minimization of a multi-objective non-linear problem that is composed of the loss of load service, the number of switch operations, and power loss, as shown in Equation (17).
min   F = w 1 × P l o s s s e r v i c e P l o s s s e r v i c e min P l o s s s e r v i c e max P l o s s s e r v i c e min + w 2 × n o p s n o p s min n o p s max n o p s min + w 3 × P l o s s P l o s s min P l o s s max P l o s s min
subject to
w 1 + w 2 + w 3 = 1
I I max
V min V V max
where P l o s s s e r v i c e denotes the loss of load service; n o p s represents the number of switch operations; P l o s s denotes the system power loss; w i denotes a weighting factor that can be adjusted for the requirement; I max is the ampere capacity of the conductor; and V min and V max represent the lower and upper limits of bus voltage, respectively. The related parameters of the objective function and constraints are set to w 1 = 0.2, w 2 = 0.1, and w 3 = 0.7. Furthermore, the lower and upper limits of the bus voltage are 0.95–1.05 pu, and the ampere capacity is 300 A.
By applying the PSO algorithm to solve the proposed service restoration approach, the A matrix is built according to the switch status and must be transferred to the PSO algorithm to obtain the corresponding network topology. The power flow algorithm is used to compute the specified network topology, and the value of the proposed function of each particle is obtained. PSO, which is a combination of the pbest and gbest, allows a particle to quickly and correctly adjust, thereby resulting in rapid convergence using Equations (21)–(25).
V n k + 1 = V n k + c 1 × r a n d 1 × ( p b e s t n k s n k )
V n k + 1 = V n k + c 2 × r a n d 2 × ( g b e s t k s n k )
V n k + 1 = w × V n k + c 1 × r a n d 1 × ( p b e s t n k s n k ) + c 2 × r a n d 2 × ( g b e s t k s n k )
s n k + 1 = s n k + v n k + 1
w = w max ( w max w min ) × k k max
where V n k denotes the velocity of the nth particle at the kth iteration; s n k represents the kth position of the nth particle; the learning factors are represented as c 1 and c 2 ; the random numbers of rand1 and rand2 are between 0 and 1; p b e s t n k denotes the best value of the nth particle at the kth iteration; and g b e s t k denotes the global best value at the kth iteration. wmax, and wmin are the maximum and minimum of the inertia weighting value, respectively, which are set to wmax = 0.9, wmin = 0.2, so in Equation (25) this means that the weighting value of inertial velocity is decreased from 0.9 to 0.2; n denotes the particle number; and kmax denotes the maximum iteration. In this study, the related parameters of PSO were set to n = 500; the maximum iteration number was 200; c1 = 2, and c2 = 2. The detailed solution procedure of the service restoration is illustrated in Figure 4.

5. Numerical Results and Discussions

The MG modified from the IEEE 37-bus test system was utilized as a sample system to verify the effectiveness of the proposed method. The original IEEE 37-bus test system is a traditional distribution network whose line and bus data are shown in [30]. The system is a three-phase unbalanced passive network that is only connected with loads. The simulation results under grid-tied and islanding operation modes are discussed in the following sections.

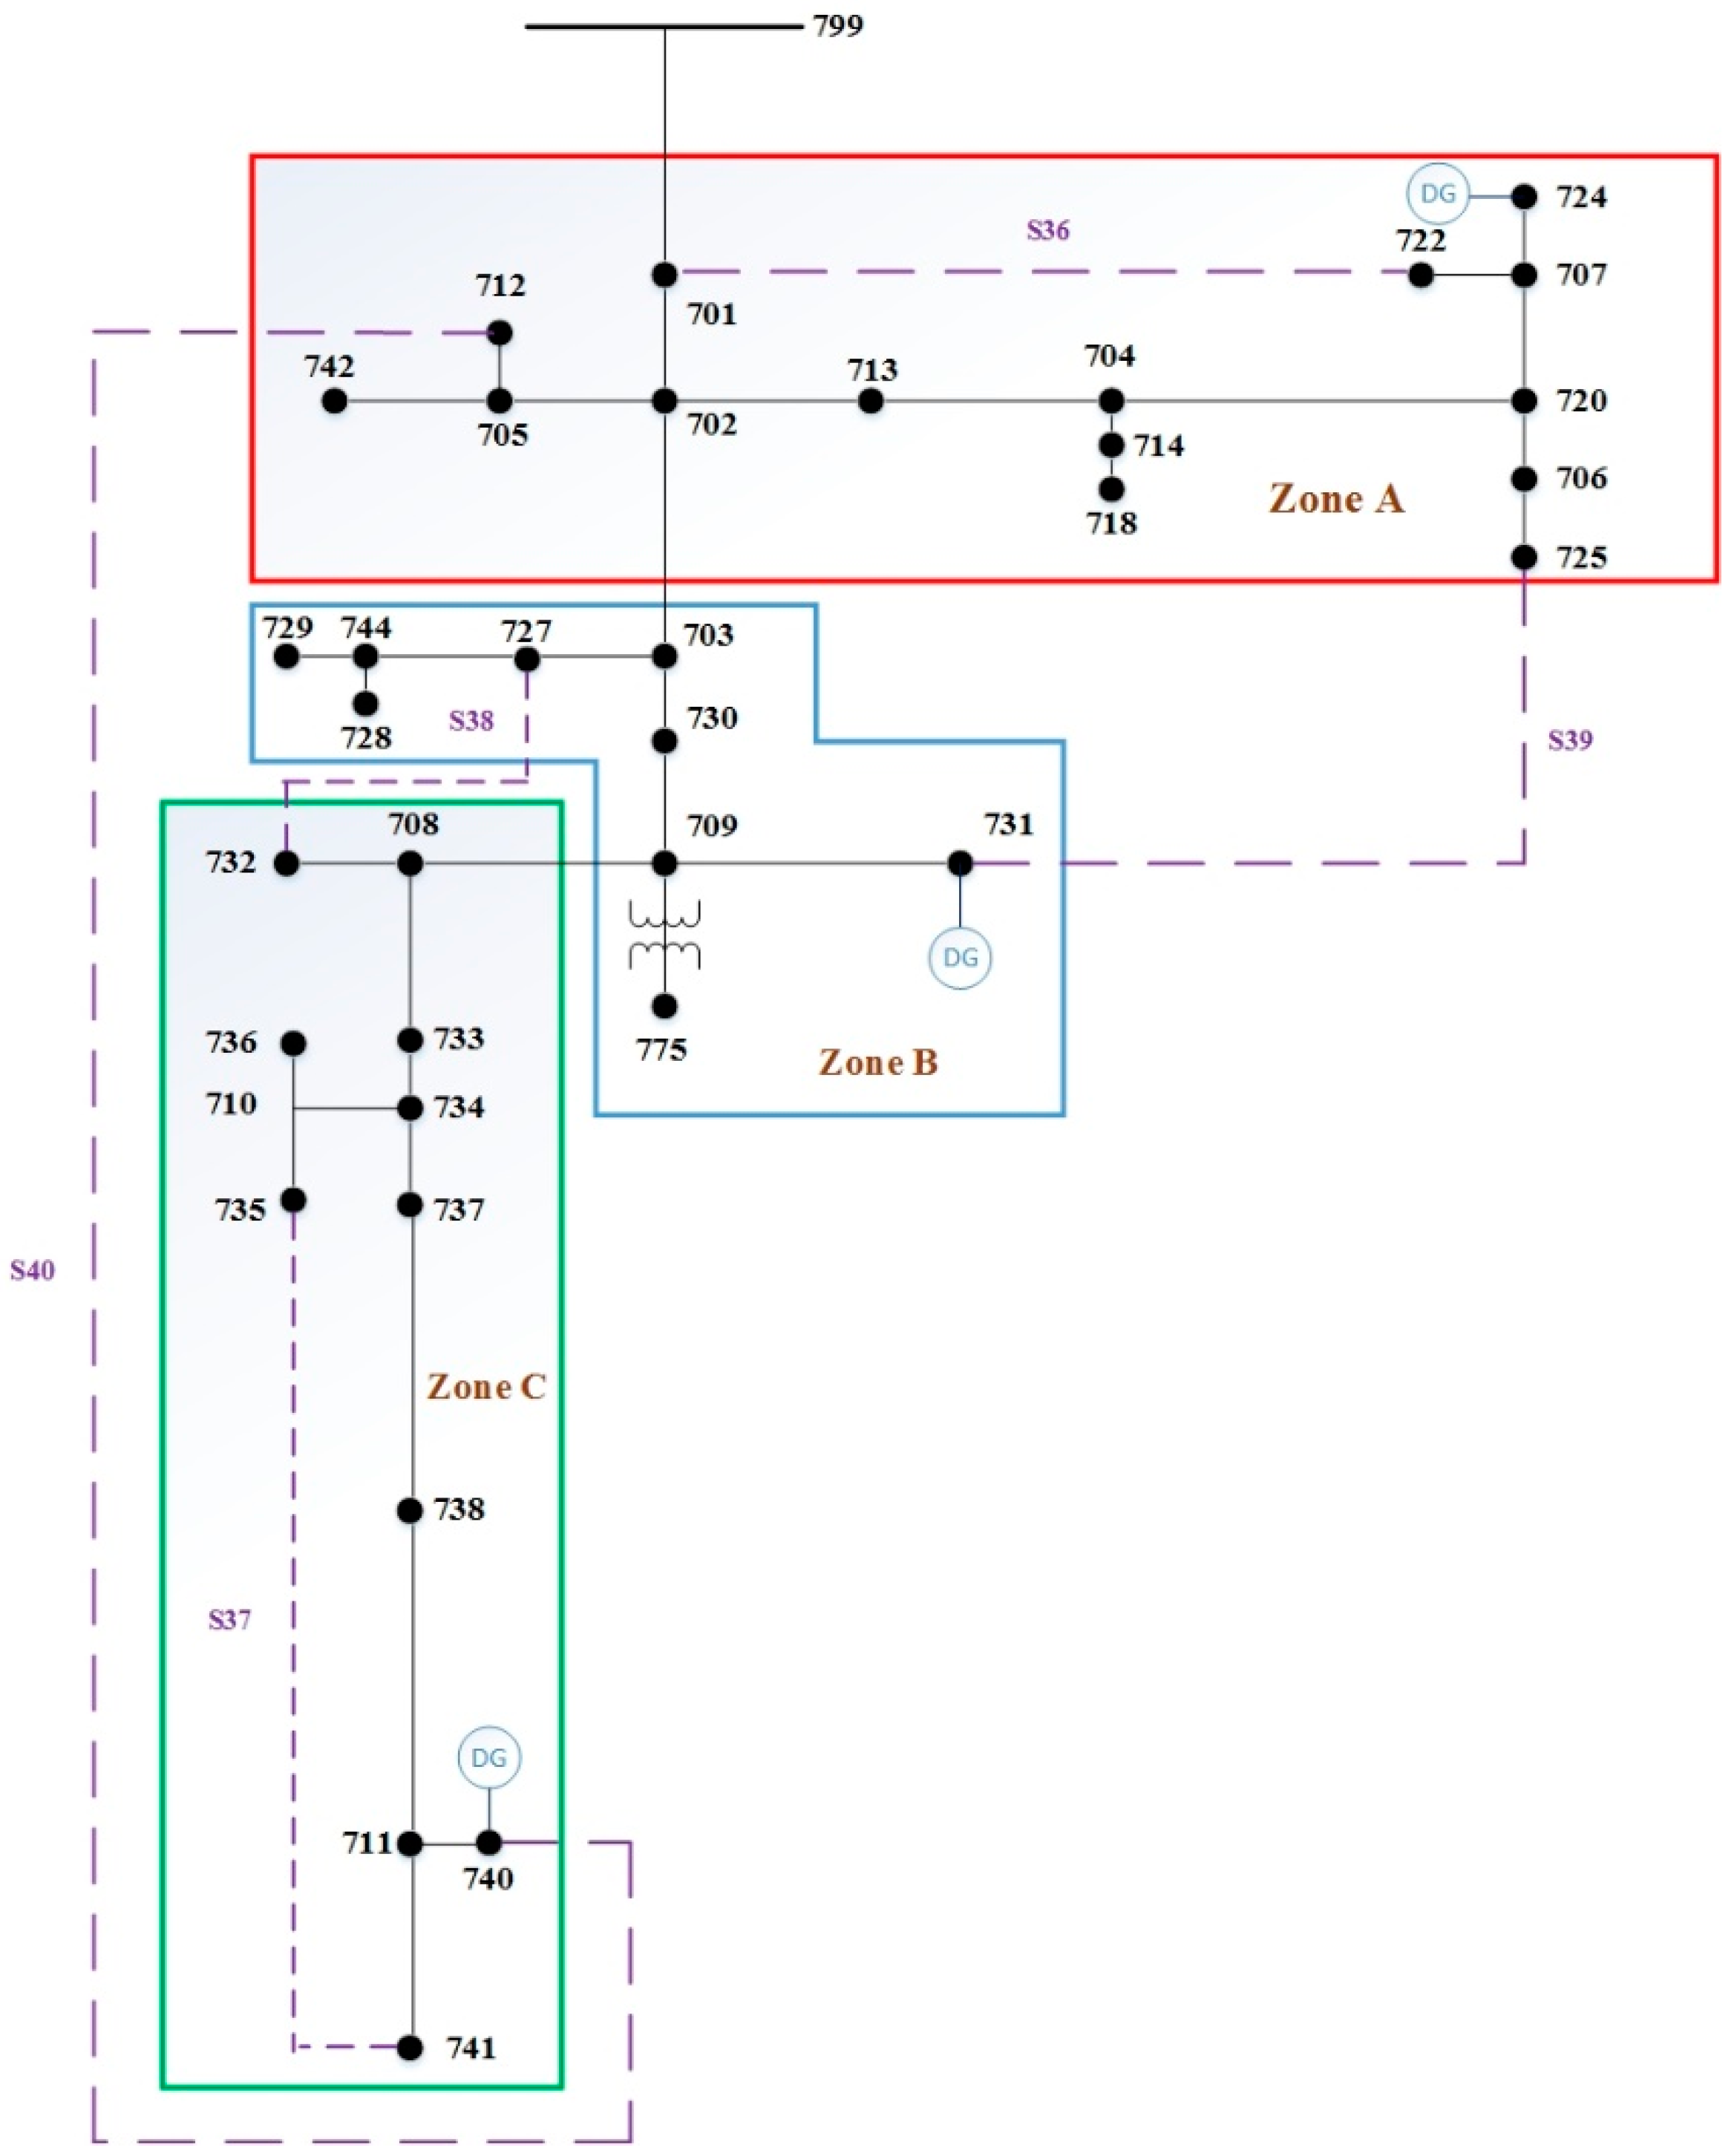
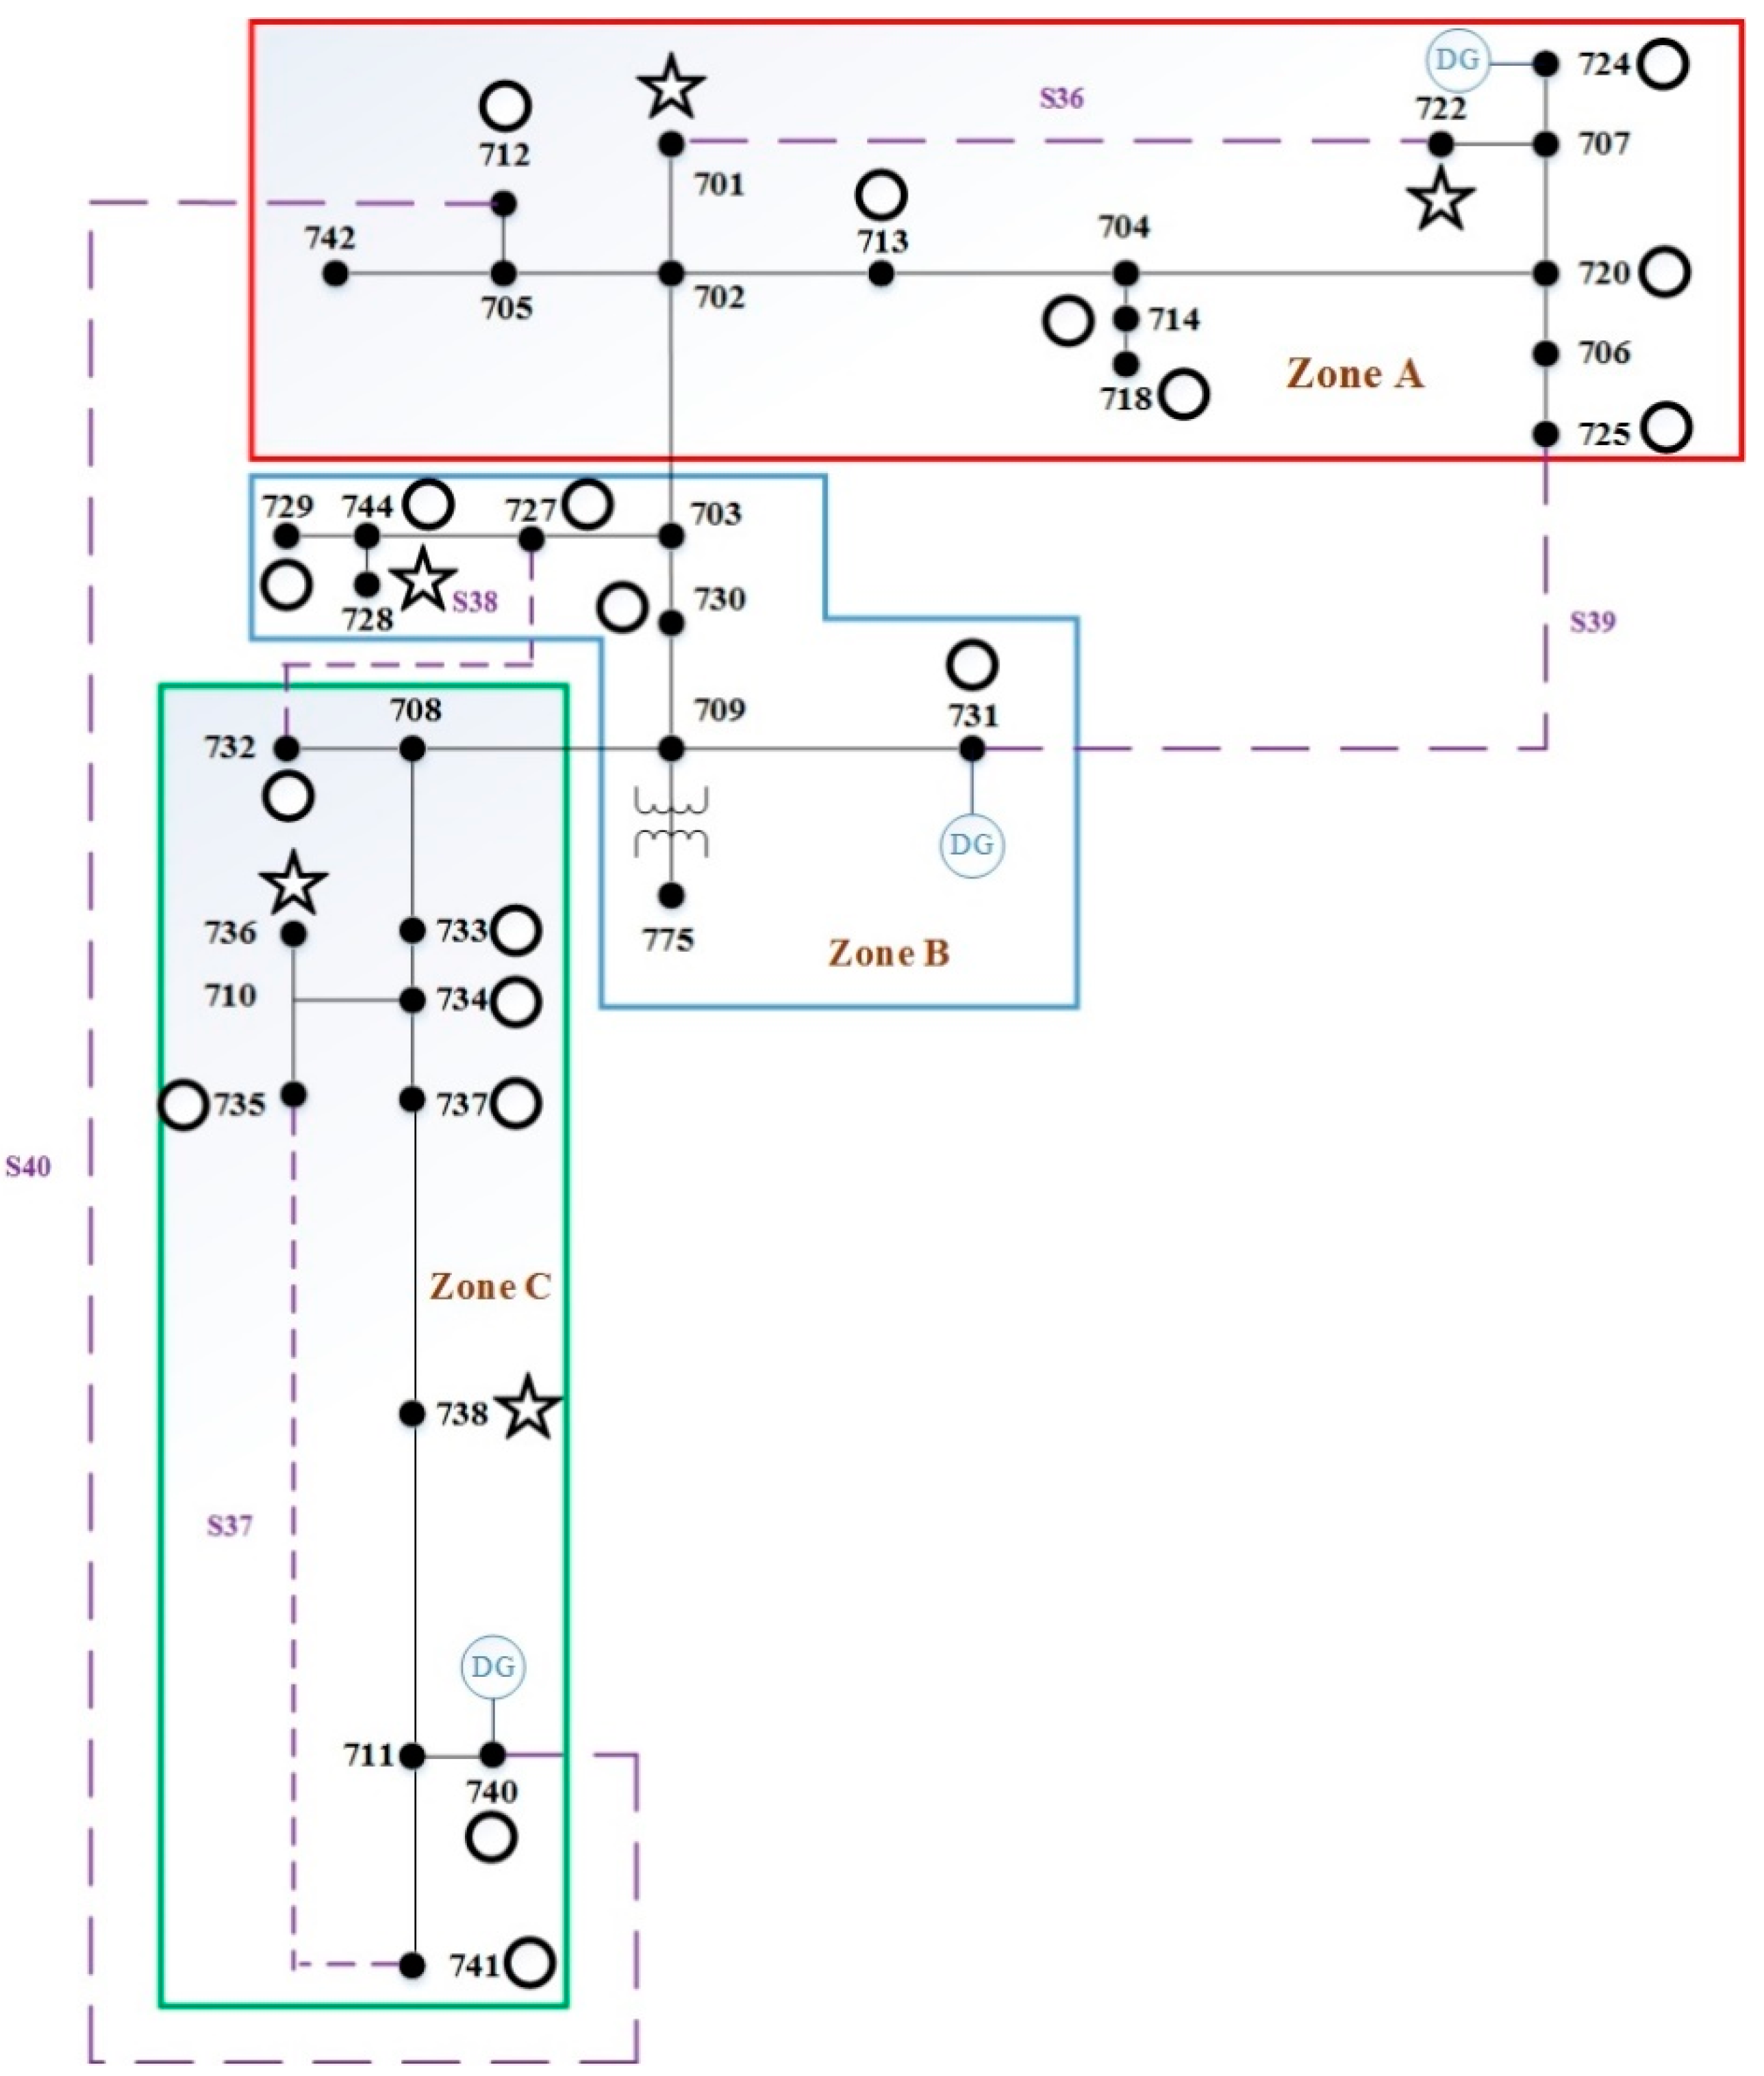
5.1. Description of the Sample System and Simulation Scenarios

The MG sample system was modified on the basis of the IEEE 37-bus test system (Figure 5). Five new tie lines and switches were added as follows. S36 was installed between buses 701 and 722. S37 was installed between buses 735 and 741. S38 was installed between buses 727 and 732. S39 was installed between buses 725 and 731. S40 was installed between buses 712 and 740. In addition, the DGs were connected at buses 724, 731, and 740. The parameters of the tie switches and lines are shown in Table 1. The power outputs of the DG at buses 724, 731, and 740 are 595, 460, and 150 kW, respectively.
The simulation scenarios are presented in Table 2, and the scenarios are explained as follows.
Scenario 1: A single-point fault in the line segment is assumed between buses 702 and 703. This fault is used to simulate a situation in which most of the downstream areas of the MG are affected due to the fault that occurred in the upstream of the MG.
Scenario 2: A double-point fault in a line segment is assumed: one point is between buses 702 and 703, and the other point is between buses 727 and 703. This fault is used to simulate multiple power outages in downstream areas. Multiple tie switches and lines must be operated at the same time for service restoration.
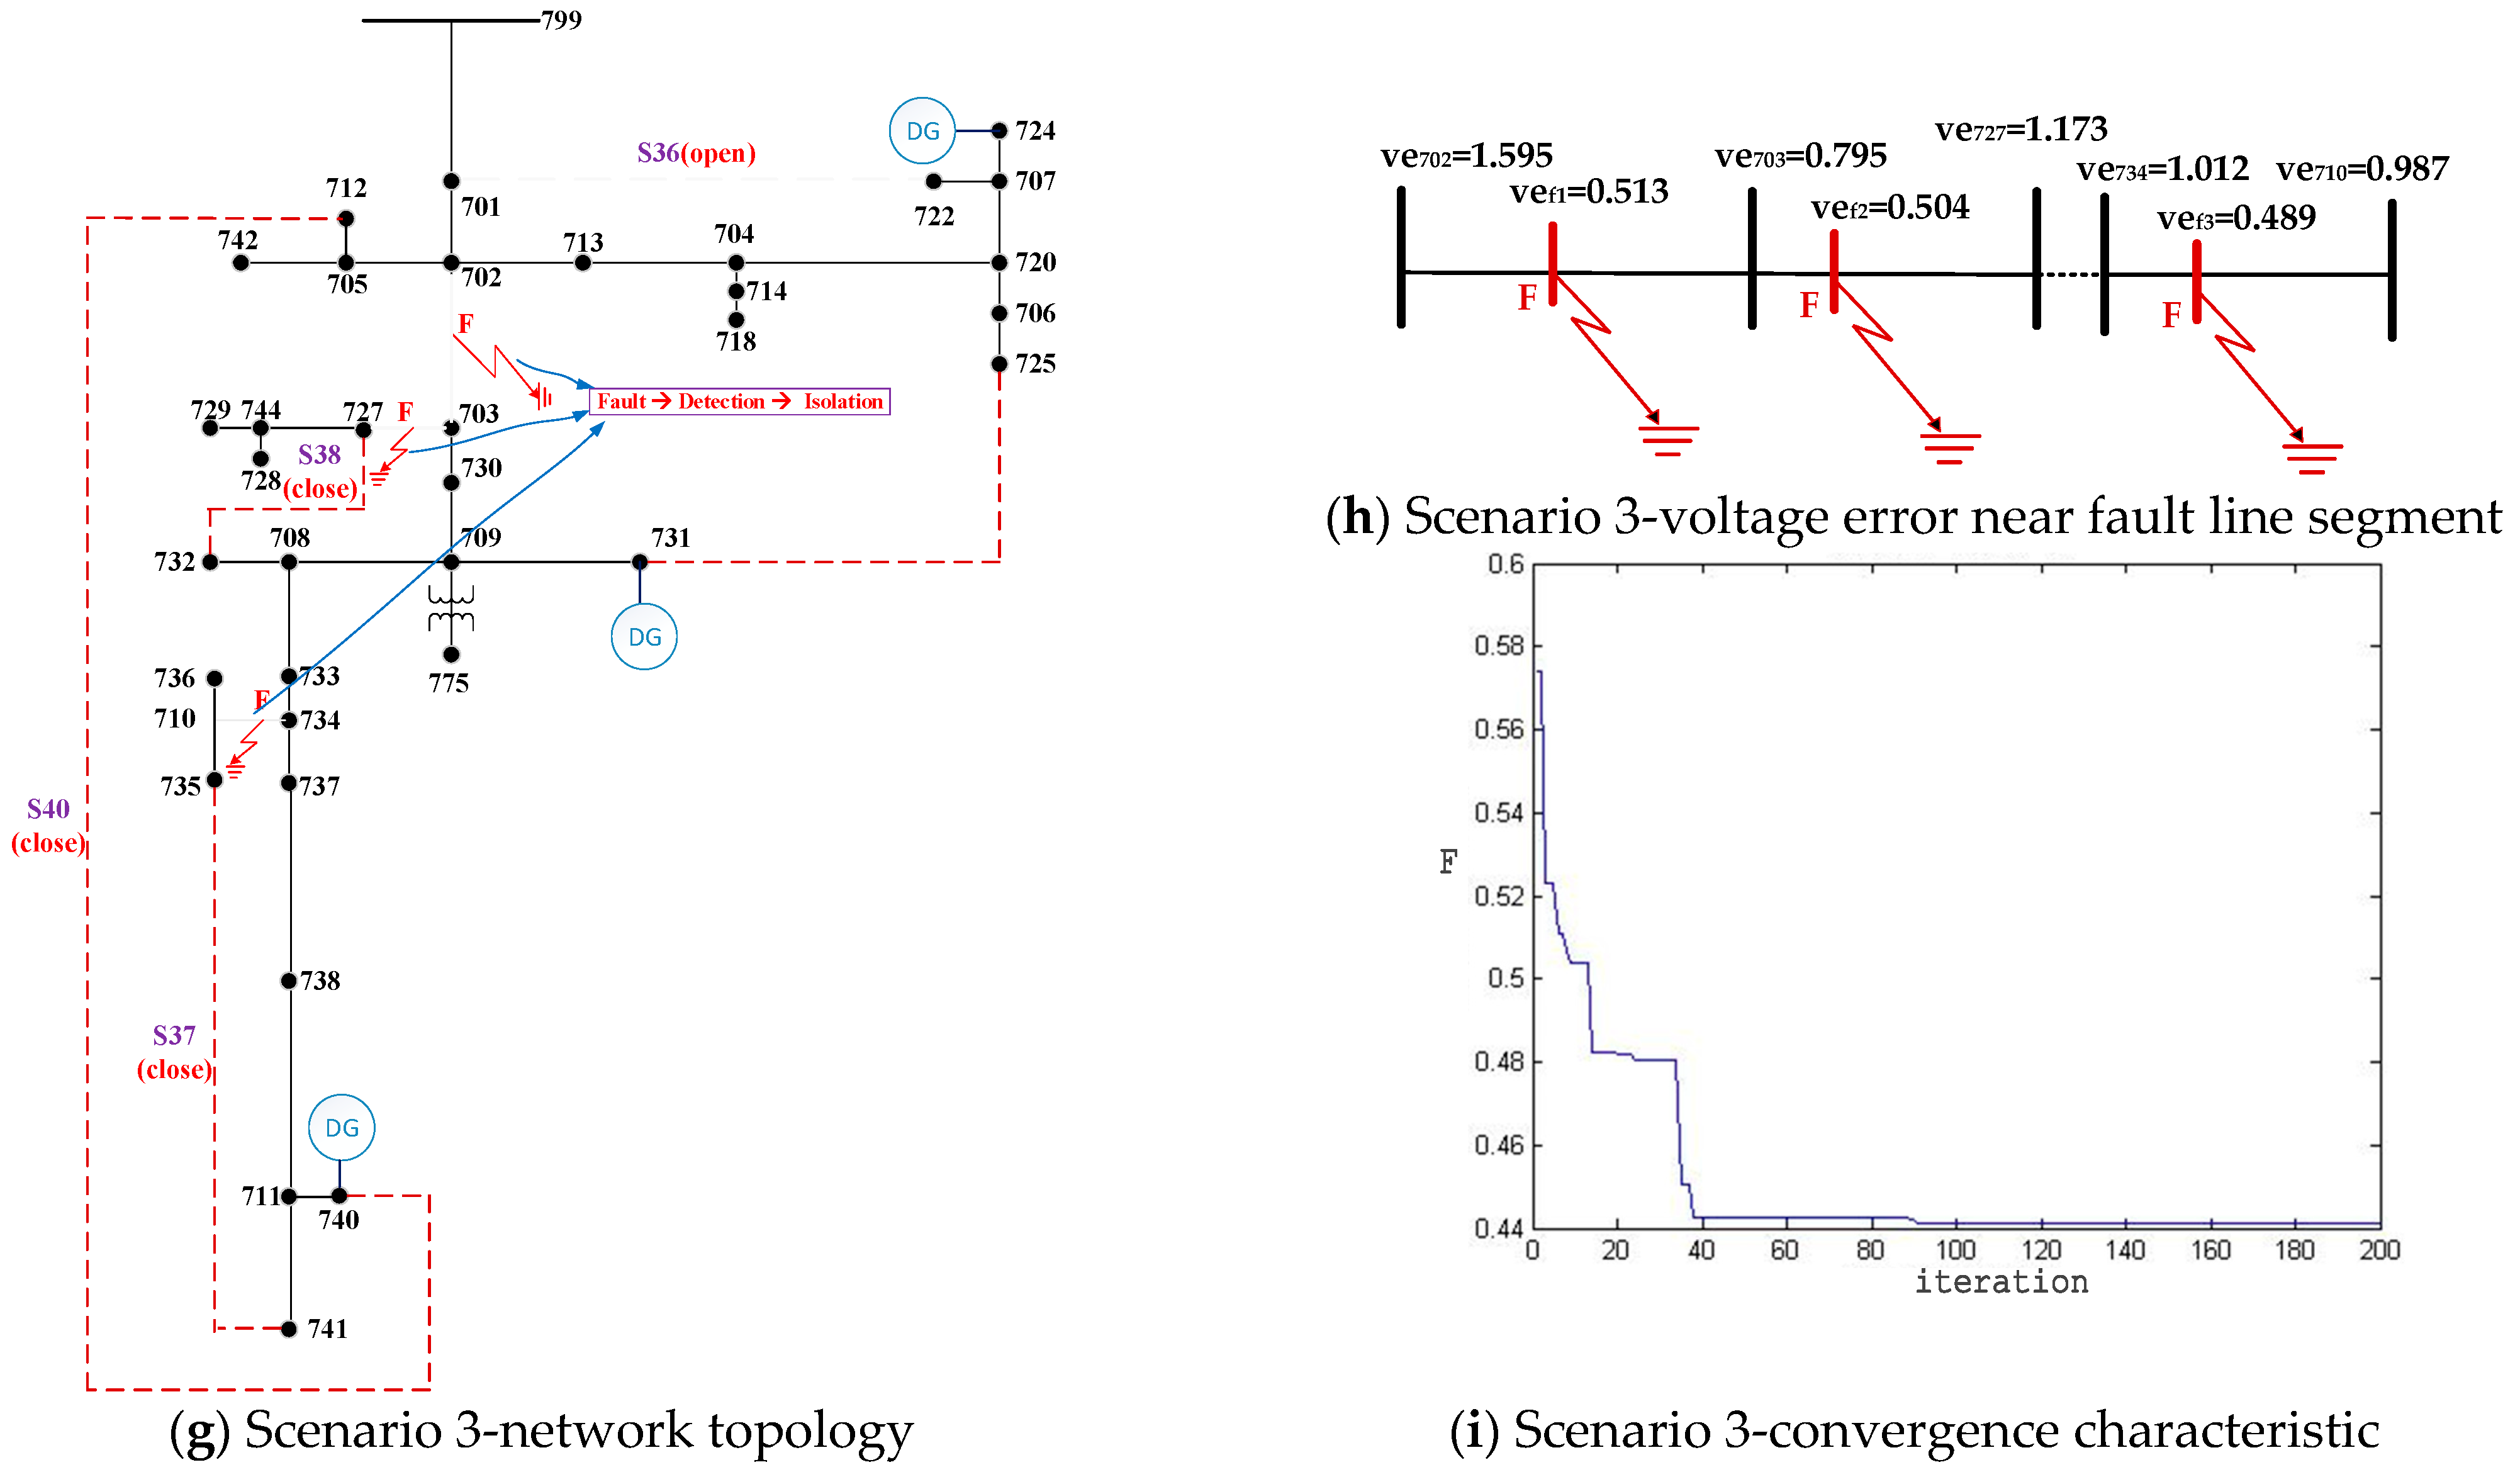
Scenario 3: A triple-point fault in the line segment is assumed. The multiple fault points are between buses 702 and 703, buses 727 and 703, and buses 710 and 734. This fault is used to simulate power generation less than the load demand in the downstream islanded area. Load shedding is required for this situation.
In this study, a co-analysis and simulation platform was established (Figure 6). The sample system was built in OpenDSS [31] and MATLAB: the value of the measured voltage of the sample system was obtained by OpenDSS, and the proposed fault location, service restoration, and power flow algorithms were coded in MATLAB.

5.2. Grid-Tied Operation

Table 3 illustrates the simulation results of the sample system and the scenarios assumed in Section 5.1 according to the proposed fault location and service restoration algorithms in this study. The network topologies, voltage error values near the fault line segment, and convergence characteristics including the fault location and restoration objective functions in Equations (16) and (17) that correspond to each scenario are illustrated in Figure 7a–c.
In Scenario 1, a three-phase bolted short-circuit fault occurs in line segment 702–703, which is between buses 702 and 703. Fault is detected in line segment 702–703 according to the minimal value of the voltage deviation in the VEM using the proposed fault location algorithm (Equation (16)). The proposed service restoration algorithm is used to restore power supply to the un-faulted area. Therefore, according to the convergence of the numerical results of the objective function and the related constraints (Equations (17)–(19)), the switch between line segment 708–709 is opened, and two tie switches (i.e., S39 and S40) are closed to form the network topology (Figure 7a). The service restoration percentage is 100% because of the fault that occurs in the line segment, and the operations of the tie switches successfully restore electricity service. The power loss is 62.47 kW in this radial type topology, and all the line currents and bus voltages satisfy their limits.
In Scenario 2, the fault type is the same as that in Scenario 1, that is, a double fault occurring in line segments 702–703 and 727–703. These two fault points are detected by two minimal values in the VEM. The switch between line segment 708–733 is opened, and three tie switches, namely, S38, S39, and S40, are closed to form the network topology, as shown in Figure 7b. Similar to Scenario 1, the service restoration percentage is 100%, the power loss is 61.47 kW, all the line currents are less than 300 A, and the bus voltages are within 0.95–1.05 pu. The simulation results illustrate that the combined fault location and restoration approach is capable of dealing with double-point fault conditions.
In Scenario 3, a triple fault occurs in line segments 702–703, 727–703, and 710–734. These multiple fault points are detected by three minimal values in the VEM. The switch between line segment 708–733 is opened, and four tie switches, namely, S37, S38, S39, and S40, are closed to form the network topology, as shown in Figure 7c. Similarly, the service restoration percentage is 100%, the power loss is 60.46 kW, and all the line currents and the bus voltages do not violate these limits. The outcomes demonstrate that the proposed approach is capable of multiple-point fault detection, isolation, and restoration.

5.3. Islanding Operation

A single-line diagram of the sample system under islanding operation mode is shown in Figure 8. In islanding operation mode, the available power output of the DGs plays a key role in ensuring the stable operation of the system because no utility power grid acts as a swing bus. System frequency and voltage magnitude are kept constant in accordance with the power balance principle. Consequently, if the power generation of DGs is greater than the load demand, then the optimal dispatch method automatically adjusts the power output to meet the power balance requirement. Otherwise, the load shedding strategy should be used to maintain power balance. The loads are classified into critical and common loads. The symbol of critical load is expressed as “O,” and the symbol of non-critical load is represented as “☆” (Figure 8). The first priority of load shedding is non-critical load and then critical load. The simulation results of the sample system and the assumed scenarios are listed in Table 4. In Scenario 1, the fault is detected in line segment 702–703 according to the minimal value of voltage deviation in the VEM. The tie switch S39 is closed to form a network topology (Figure 8). The service restoration percentage is 83.61% because the power output of the DGs is less than the load demand. Load shedding is required to keep the power balance. In addition, the power loss is 22.27 kW, and all the line currents and bus voltages satisfy their limits. In Scenario 2, these two fault points are detected by two minimal values in the VEM. Then, two tie switches, namely, S38 and S39, are closed to form the network topology (Figure 8). The service restoration percentage is 83.61%, the power loss is 22.41 kW, all the line currents are less than 300 A, and the bus voltages are within 0.95–1.05 pu. In Scenario 3, the multiple-point fault is detected by three minimal values in the VEM. Three tie switches, namely, S37, S38, and S39, are closed to form the network topology. Similarly, the service restoration percentage is 83.61%, the power loss is 22.4 kW, and all the line currents and the bus voltages do not violate the limits.

6. Conclusions

In this study, a fault location and service restoration algorithm was developed and integrated for three-phase short-circuit fault detection, isolation, and restoration in MGs. The proposed approach is based on a fast-computing algorithm and the measured data from the EMS of MGs. Therefore, graph theory is used to establish BIBC and BCBV matrices for the corresponding network topology. The bus impedance matrix is effective and easy to build and modify for pre-fault and post-fault analyses, without the need for the time-consuming rebuilding of a bus impedance matrix due to topology changes. Consequently, the bus impedance matrix is convenient to use in pre-fault power flow analysis and the calculation of post-fault bus voltage change caused by the fault current contributed by the upstream power gird and DGs. The multi-objective function, which is composed of load shedding, switch operations, and power loss with voltage drop and ampere capacity constraints, is proposed for service restoration. These algorithms are implemented by PSO for fault location and optimal service restoration. The MG modified from the IEEE 37-bus was used as the sample system to demonstrate the feasibility of the proposed approach. The proposed approach was coded using MATLAB and executed on a Windows 10 Intel® Core™ i7-10700F CPU @2.9 GHz personal computer, and the average computing time of each scenario of the IEEE 37-bus was less than 1 s. The numerical results illustrate a maximal service restoration percentage with minimum switch operations and power loss under both operating modes. The outcomes show that the proposed approach is capable of detecting, isolating, and restoring three-phase short-circuit faults under the grid-tied and islanding operating modes of MGs.

Author Contributions

The original idea for the proposed algorithm for fault location and service restoration in MGs was presented by W.-T.H., K.-C.Y. The service restoration algorithm was coded by W.-C.L., and the fault location algorithm was coded by C.-C.M. The simulation scenarios and results were checked by H.-T.C. All authors have read and agreed to the published version of the manuscript.

Funding

This research received no external funding.

Institutional Review Board Statement

Not applicable.

Informed Consent Statement

Not applicable.

Acknowledgments

The authors are grateful for financial support from the Ministry of Science and Technology, Taiwan, under Grant MOST 109-2221-E-018-004-MY2, and the Institute of Nuclear Energy Research of Taiwan through its grant no. 110A007.

Conflicts of Interest

The authors declare no conflict of interest.

References

  1. Lasseter, R.H. MicroGrids. IEEE Power Energy Mag. 2007, 5, 78–94. [Google Scholar]
  2. Nigim Khaled, A.; Lee, W.J. Micro Grid Integration Opportunities and Challenges. In Proceedings of the IEEE Power Engineering Society General Meeting, Tampa, FL, USA, 24–28 June 2007; pp. 1–6. [Google Scholar]
  3. Lasseter, R.H.; Paigi, P. Microgrid: A Conceptual Solution. In Proceedings of the IEEE Power Electronics Specialists Conference, Aachen, Germany, 20–25 June 2004; pp. 4285–4290. [Google Scholar]
  4. Xu, G.; Wu, S.; Tan, Y. Island Partition of Distribution System with Distributed Generators Considering Protection of Vulnerable Nodes. Appl. Sci. 2017, 7, 1057. [Google Scholar] [CrossRef] [Green Version]
  5. Orozco-Henao, C.; Suman Bretas, A.; Marín-Quintero, J.; Herrera-Orozco, A.; Pulgarín-Rivera, J.D.; Velez, J.C. Adaptive Impedance-Based Fault Location Algorithm for Active Distribution Networks. Appl. Sci. 2018, 8, 1563. [Google Scholar] [CrossRef] [Green Version]
  6. Zayandehroodi, H.; Mohamed, A.; Shareef, H.; Mohammadjafari, M. Determining exact fault location in a distribution network in presence of DGs using RBF neural networks. In Proceedings of the 2011 IEEE International Conference on Information Reuse & Integration, Las Vegas, NV, USA, 3–5 August 2011; pp. 424–438. [Google Scholar]
  7. Hany, F.H.; Youssef, T.; Cintuglu, M.H.; Mohammed, O.A. Multi-Agent-Based Technique for Fault Location, Isolation, and Service Restoration. IEEE Trans. Ind. Appl. 2017, 53, 1841–1851. [Google Scholar]
  8. Shahid, M.U.; Khan, M.M.; Hashmi, K.; Habib, S.; Jiang, H.; Tang, H. A Control Methodology for Load Sharing System Restoration in Islanded DC Micro Grid with Faulty Communication Links. Electronics 2018, 7, 90. [Google Scholar] [CrossRef] [Green Version]
  9. Zhao, Z.; Ooi, B.T. Feasibility of fast restoration of power systems by micro-grids. IET Gener. Transm. Distrib. 2017, 12, 126–132. [Google Scholar] [CrossRef]
  10. Le, D.P.; Bui, D.M.; Ngo, C.C.; Le, A.M.T. FLISR Approach for Smart Distribution Networks Using E-Terra Software—A Case Study. Energies 2018, 11, 3333. [Google Scholar] [CrossRef] [Green Version]
  11. IEEE Std C37.114. IEEE Guide for Determining Fault Location on AC Transmission and Distribution Lines; IEEE: Piscataway, NJ, USA, 2005; pp. 1–36. [Google Scholar]
  12. EPRI. Distribution Fault Location: 2004 Field Data and Analysis; Electric Power Research Institute, Inc.: Palo Alto, CA, USA, 2006. [Google Scholar]
  13. Gush, T.; Bukhari, S.B.A.; Haider, R.; Admasie, S.; Oh, Y.U.; Cho, G.Y.; Kim, C.H. Fault detection and location in a microgrid using mathematical morphology and recursive least square methods. Int. J. Electr. Power Energy Syst. 2018, 102, 324–331. [Google Scholar] [CrossRef]
  14. Zheng, X.; Zeng, Y.; Zhao, M.; Venkatesh, B. Early Identification and Location of Short-Circuit Fault in Grid-Connected AC Microgrid. IEEE Trans. Smart Grid 2021, 2869–2878. [Google Scholar] [CrossRef]
  15. Hong, Y.; Cabatac, M.T.A.M. Fault Detection, Classification, and Location by Static Switch in Microgrids Using Wavelet Transform and Taguchi-Based Artificial Neural Network. IEEE Syst. J. 2019, 14, 2725–2735. [Google Scholar] [CrossRef]
  16. Wang, D.; Ning, Y.; Zhang, C. An Effective Ground Fault Location Scheme Using Unsynchronized Data for Multi-Terminal Lines. Energies 2018, 11, 2957. [Google Scholar] [CrossRef] [Green Version]
  17. Yang, Q.; Jiang, L.; Ehsan, A.; Gao, Y.; Guo, S. Robust Power Supply Restoration for Self-Healing Active Distribution Networks Considering the Availability of Distributed Generation. Energies 2018, 11, 210. [Google Scholar] [CrossRef] [Green Version]
  18. Gush, T.; Bukhari, S.B.A.; Mehmood, K.K.; Admasie, S.; Kim, J.-S.; Kim, C.-H. Intelligent Fault Classification and Location Identification Method for Microgrids Using Discrete Orthonormal Stockwell Transform-Based Optimized Multi-Kernel Extreme Learning Machine. Energies 2019, 12, 4504. [Google Scholar] [CrossRef] [Green Version]
  19. Wang, Z.; Wang, J. Service restoration based on AMI and networked MGs under extreme weather events. IET Gener. Transm. Distrib. 2017, 11, 401–408. [Google Scholar] [CrossRef]
  20. Wang, J.; Mu, L.; Zhang, F.; Zhang, X. A Parallel Restoration for Black Start of Microgrids Considering Characteristics of Distributed Generations. Energies 2018, 11, 1. [Google Scholar] [CrossRef] [Green Version]
  21. Ahmed, A.S.; Attia, M.A.; Hamed, N.M.; Abdelaziz, A.Y. Abdelaziz, Modern optimization algorithms for fault location estimation in power systems. Eng. Sci. Technol. Int. J. 2017, 20, 1475–1485. [Google Scholar] [CrossRef]
  22. Li, L.L.; Yang, Y.F.; Wang, C.H.; Lin, K.P. Biogeography-based optimization based on population competition strategy for solving the substation location problem. Expert Syst. Appl. 2018, 97, 290–302. [Google Scholar] [CrossRef]
  23. Abdelwanis, M.I.; Abaza, A.; El-Sehiemy, R.A.; Ibrahim, M.N.; Rezk, H. Parameter Estimation of Electric Power Transformers Using Coyote Optimization Algorithm with Experimental Verification. IEEE Access 2020, 8, 50036–50044. [Google Scholar] [CrossRef]
  24. Niccolai, A.; Bettini, L.; Zich, R. Optimization of electric vehicles charging station deployment by means of evolutionary algorithms. Int. J. Intell. Syst. 2021. [Google Scholar] [CrossRef]
  25. Chen, T.H.; Yang, N.C. Three-phase power-flow by direct ZBR method for unbalanced radial distribution systems. IET Gener. Transm. Distrib. 2009, 3, 903–910. [Google Scholar] [CrossRef]
  26. Teng, J.H. A network-topology based three: Phase load flow for distribution systems. Proc. Natl. Sci. Counc. ROC (A) 2000, 24, 259–264. [Google Scholar]
  27. Barker, P.; Mello, R.W. Determining the impact of distributed generation on power systems: Part 1—Radial power systems. In Proceedings of the 2000 Power Engineering Society Summer Meeting, Seattle, WA, USA, 16–20 July 2000; pp. 1645–1658. [Google Scholar]
  28. Kennedy, J.; Eberhart, R.C. Particle swarm optimization. In Proceedings of the ICNN’95—International Conference on Neural Networks, Perth, WA, Australia, 27 November–1 December 1995; pp. 1942–1948. [Google Scholar]
  29. Eberhart, R.C.; Kennedy, J. A new optimizer using particle swarm theory. In Proceedings of the Sixth International Symposium on Micro Machine and Human Science, Nagoya, Japan, 4–6 October 1995; pp. 39–43. [Google Scholar]
  30. Distribution Test Feeders. Available online: http://ewh.ieee.org/soc/pes/dsacom/testfeeders/index.html (accessed on 1 May 2019).
  31. Dugan, R.C.; McDermott, T.E. An Open Source Platform for Collaborating on Smart Grid Research. In Proceedings of the 2011 IEEE Power and Energy Society General Meeting, Detroit, MI, USA, 24–28 July 2011; pp. 1–7. [Google Scholar]
Figure 1. Proposed fault detection, isolation, and restoration of MGs.
Applsci 11 07036 g001
Figure 2. ZBus modification procedure for adding a virtual bus.
Applsci 11 07036 g002
Figure 3. Proposed fault location approach of the MG.
Applsci 11 07036 g003
Figure 4. Proposed service restoration algorithm of the MG.
Applsci 11 07036 g004
Figure 5. Single-line diagram of the sample system.
Applsci 11 07036 g005
Figure 6. Co-analysis and simulation platform.
Applsci 11 07036 g006
Figure 7. Network topologies, voltage errors, and convergence characteristics of the sample system after service restoration.
Applsci 11 07036 g007aApplsci 11 07036 g007b
Figure 8. Single-line diagram of the sample system under islanding operation mode.
Applsci 11 07036 g008
Table 1. Parameters of tie switches and lines.
Switch No.From BusTo BusLength(m)VoltagePhase
S3670172291.444.8 kVABC
S37741735152.404.8 kVABC
S3872773260.964.8 kVABC
S39725731243.844.8 kVABC
S40712740457.204.8 kVABC
Table 2. Fault point assumption of each scenario.
ScenarioFault TypeFault Point between Two Buses
Scenario 1Three-phase short-circuit bolted fault702–703
Scenario 2Three-phase short-circuit bolted fault702–703, 727–703
Scenario 3Three-phase short-circuit bolted fault702–703, 727–703, 710–734
Table 3. Simulation results under grid-tied operation mode.
ScenarioFault LocationSwitchRestoration(%)Power LossRadial Type
OpenCloseOperation Number
1702–703S(708–709)S39 S403100%62.67 kWYes
2702–703
727–703
S(708–733)S38 S39
S40
4100%61.47 kWYes
3702–703
727–703
710–734
S(708–733)S37 S38
S39
S40
5100%60.46 kWYes
Table 4. Simulation results under islanding operation mode.
ScenarioFault LocationSwitchLoad Shedding
Bus
Restoration (%)Power LossRadial Type
OpenCloseOperation Number
1702–703-S391701
722
728
735
736
737
738
83.61%22.27 kWYes
2702–703
727–703
-S38
S39
283.61%22.41 kWYes
3702–703
727–703
710–734
-S37
S38
S39
383.61%22.40 kWYes
Publisher’s Note: MDPI stays neutral with regard to jurisdictional claims in published maps and institutional affiliations.

