
Effect of Citrate on the Size and the Magnetic Properties of Primary Fe3O4 Nanoparticles and Their Aggregates


Abstract
:
1. Introduction
2. Materials and Methods
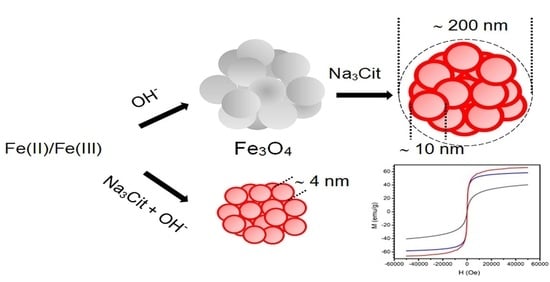
2.1. Preparation of Fe3O4 NPs
2.2. XRD Measurements
2.3. DLS Measurements
2.4. Magnetization Curves
2.5. EPR Measurements
3. Results
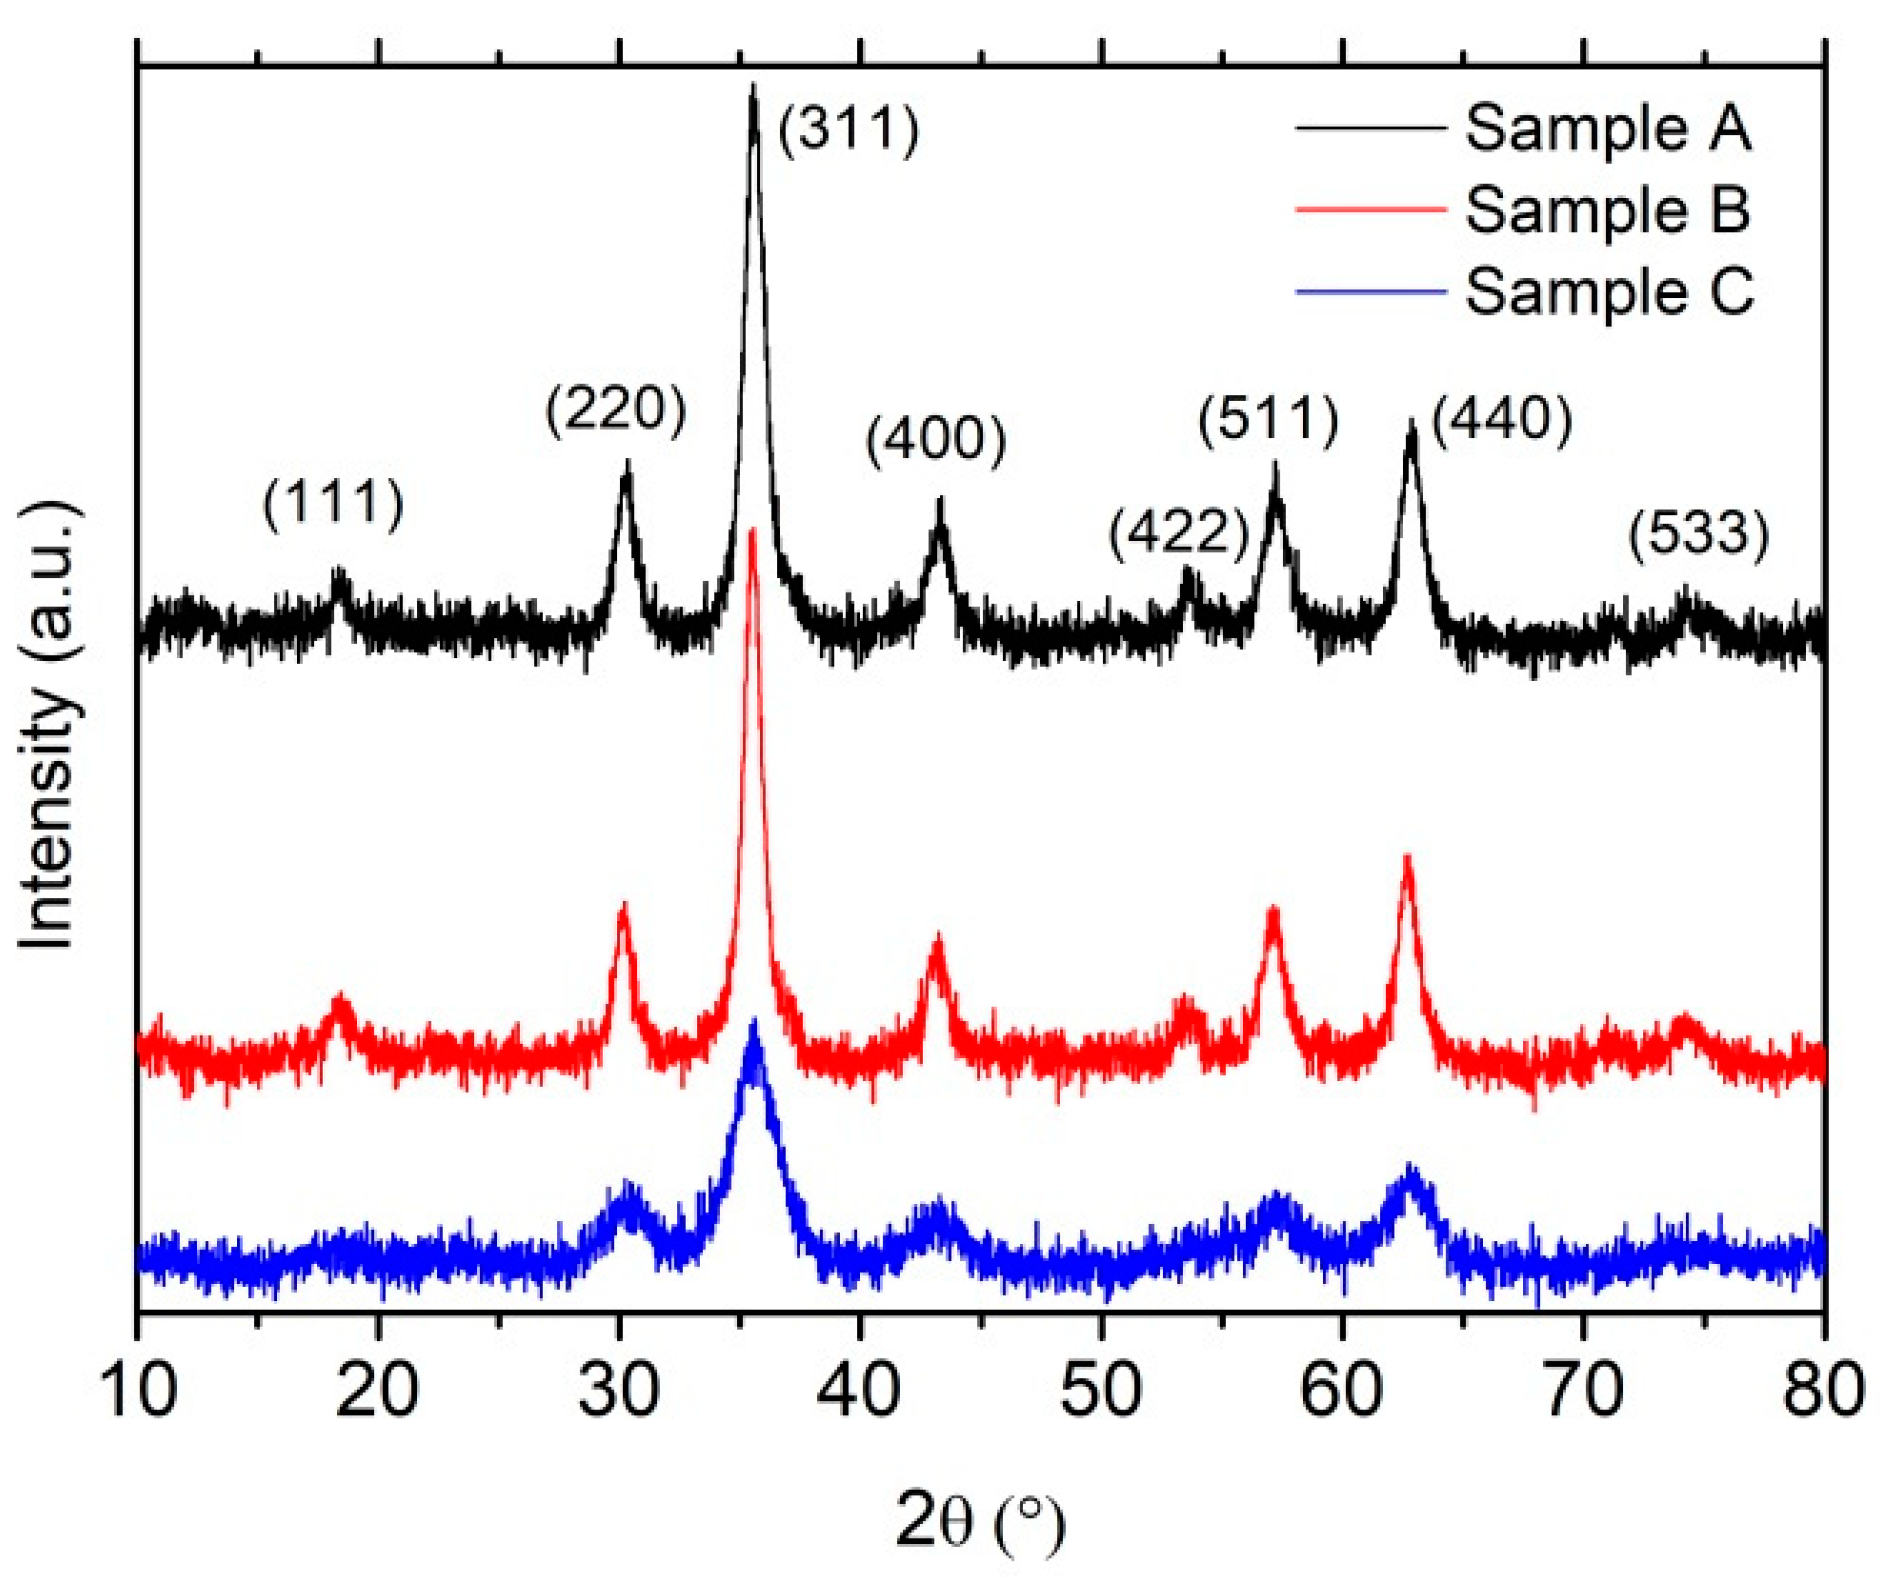
3.1. XRD
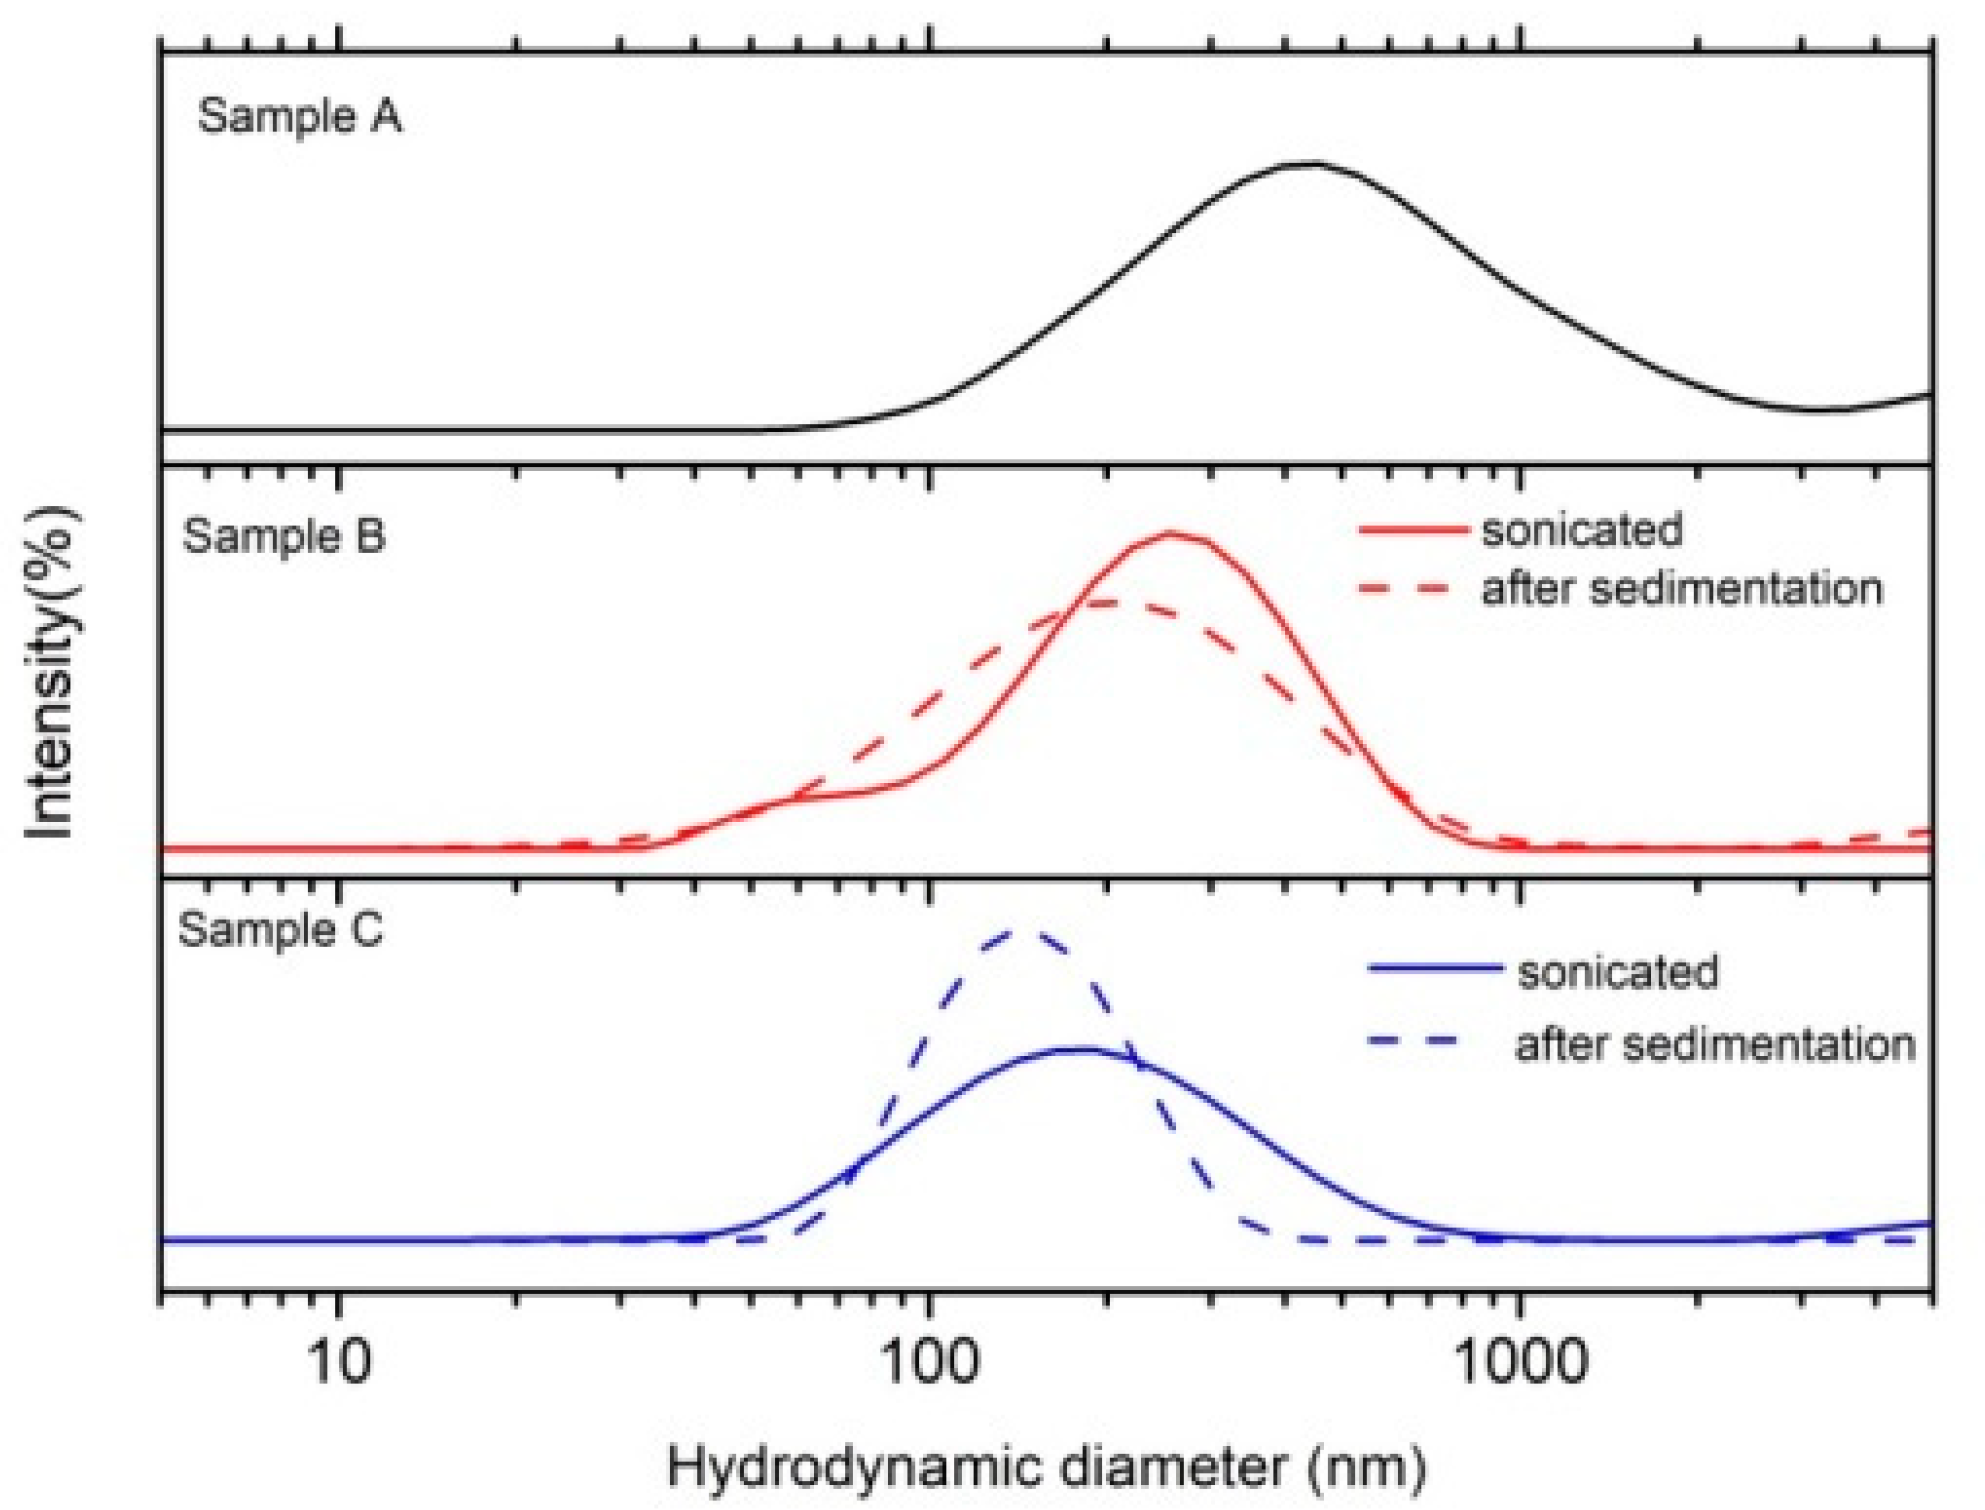
3.2. DLS
3.3. Magnetic Properties
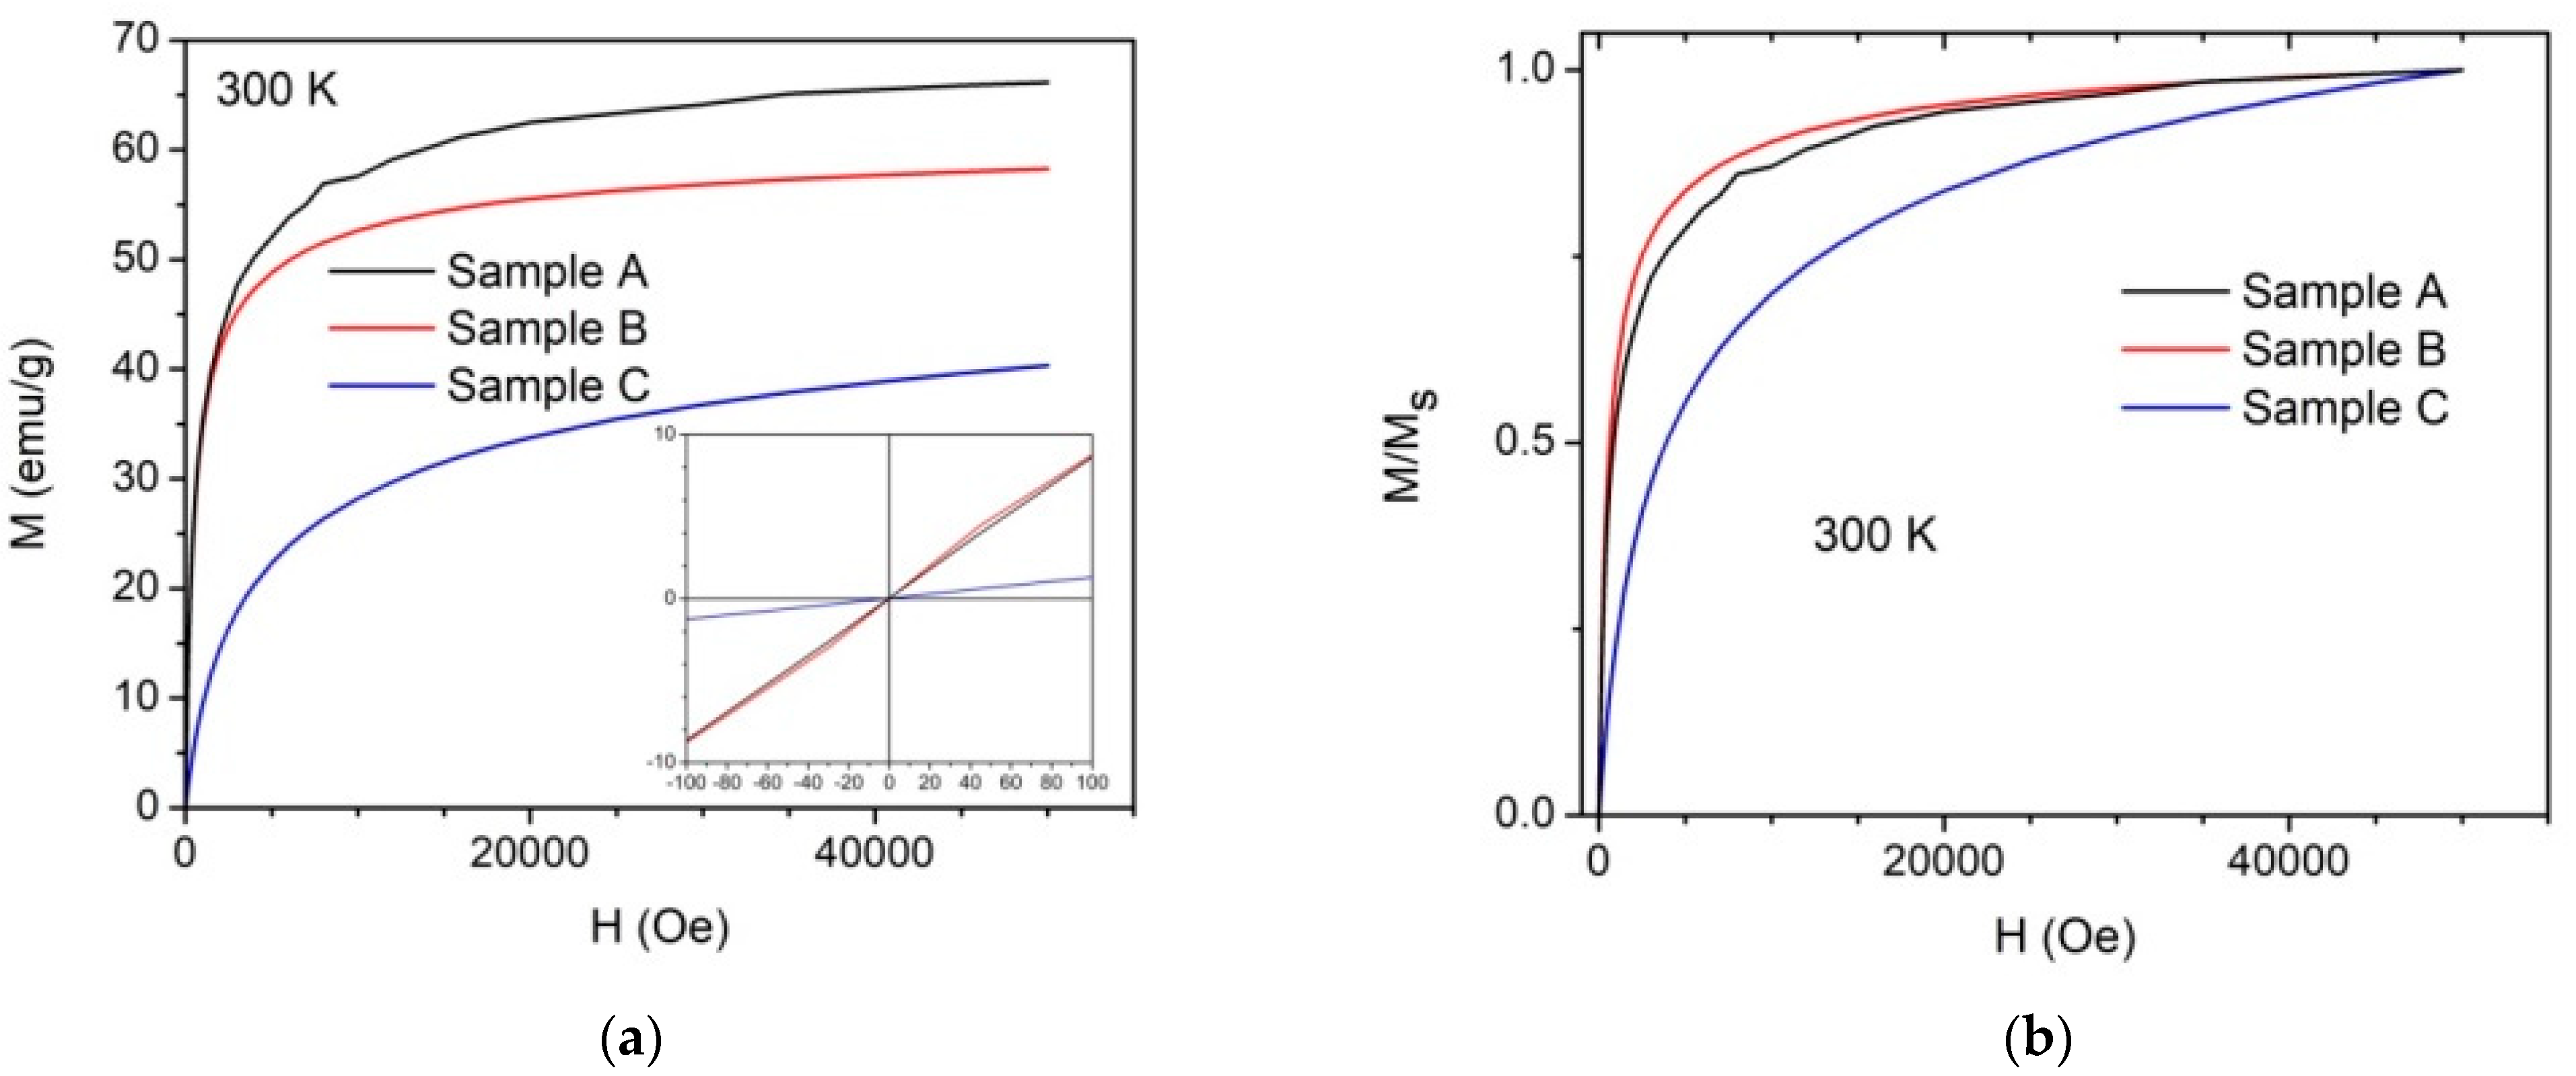
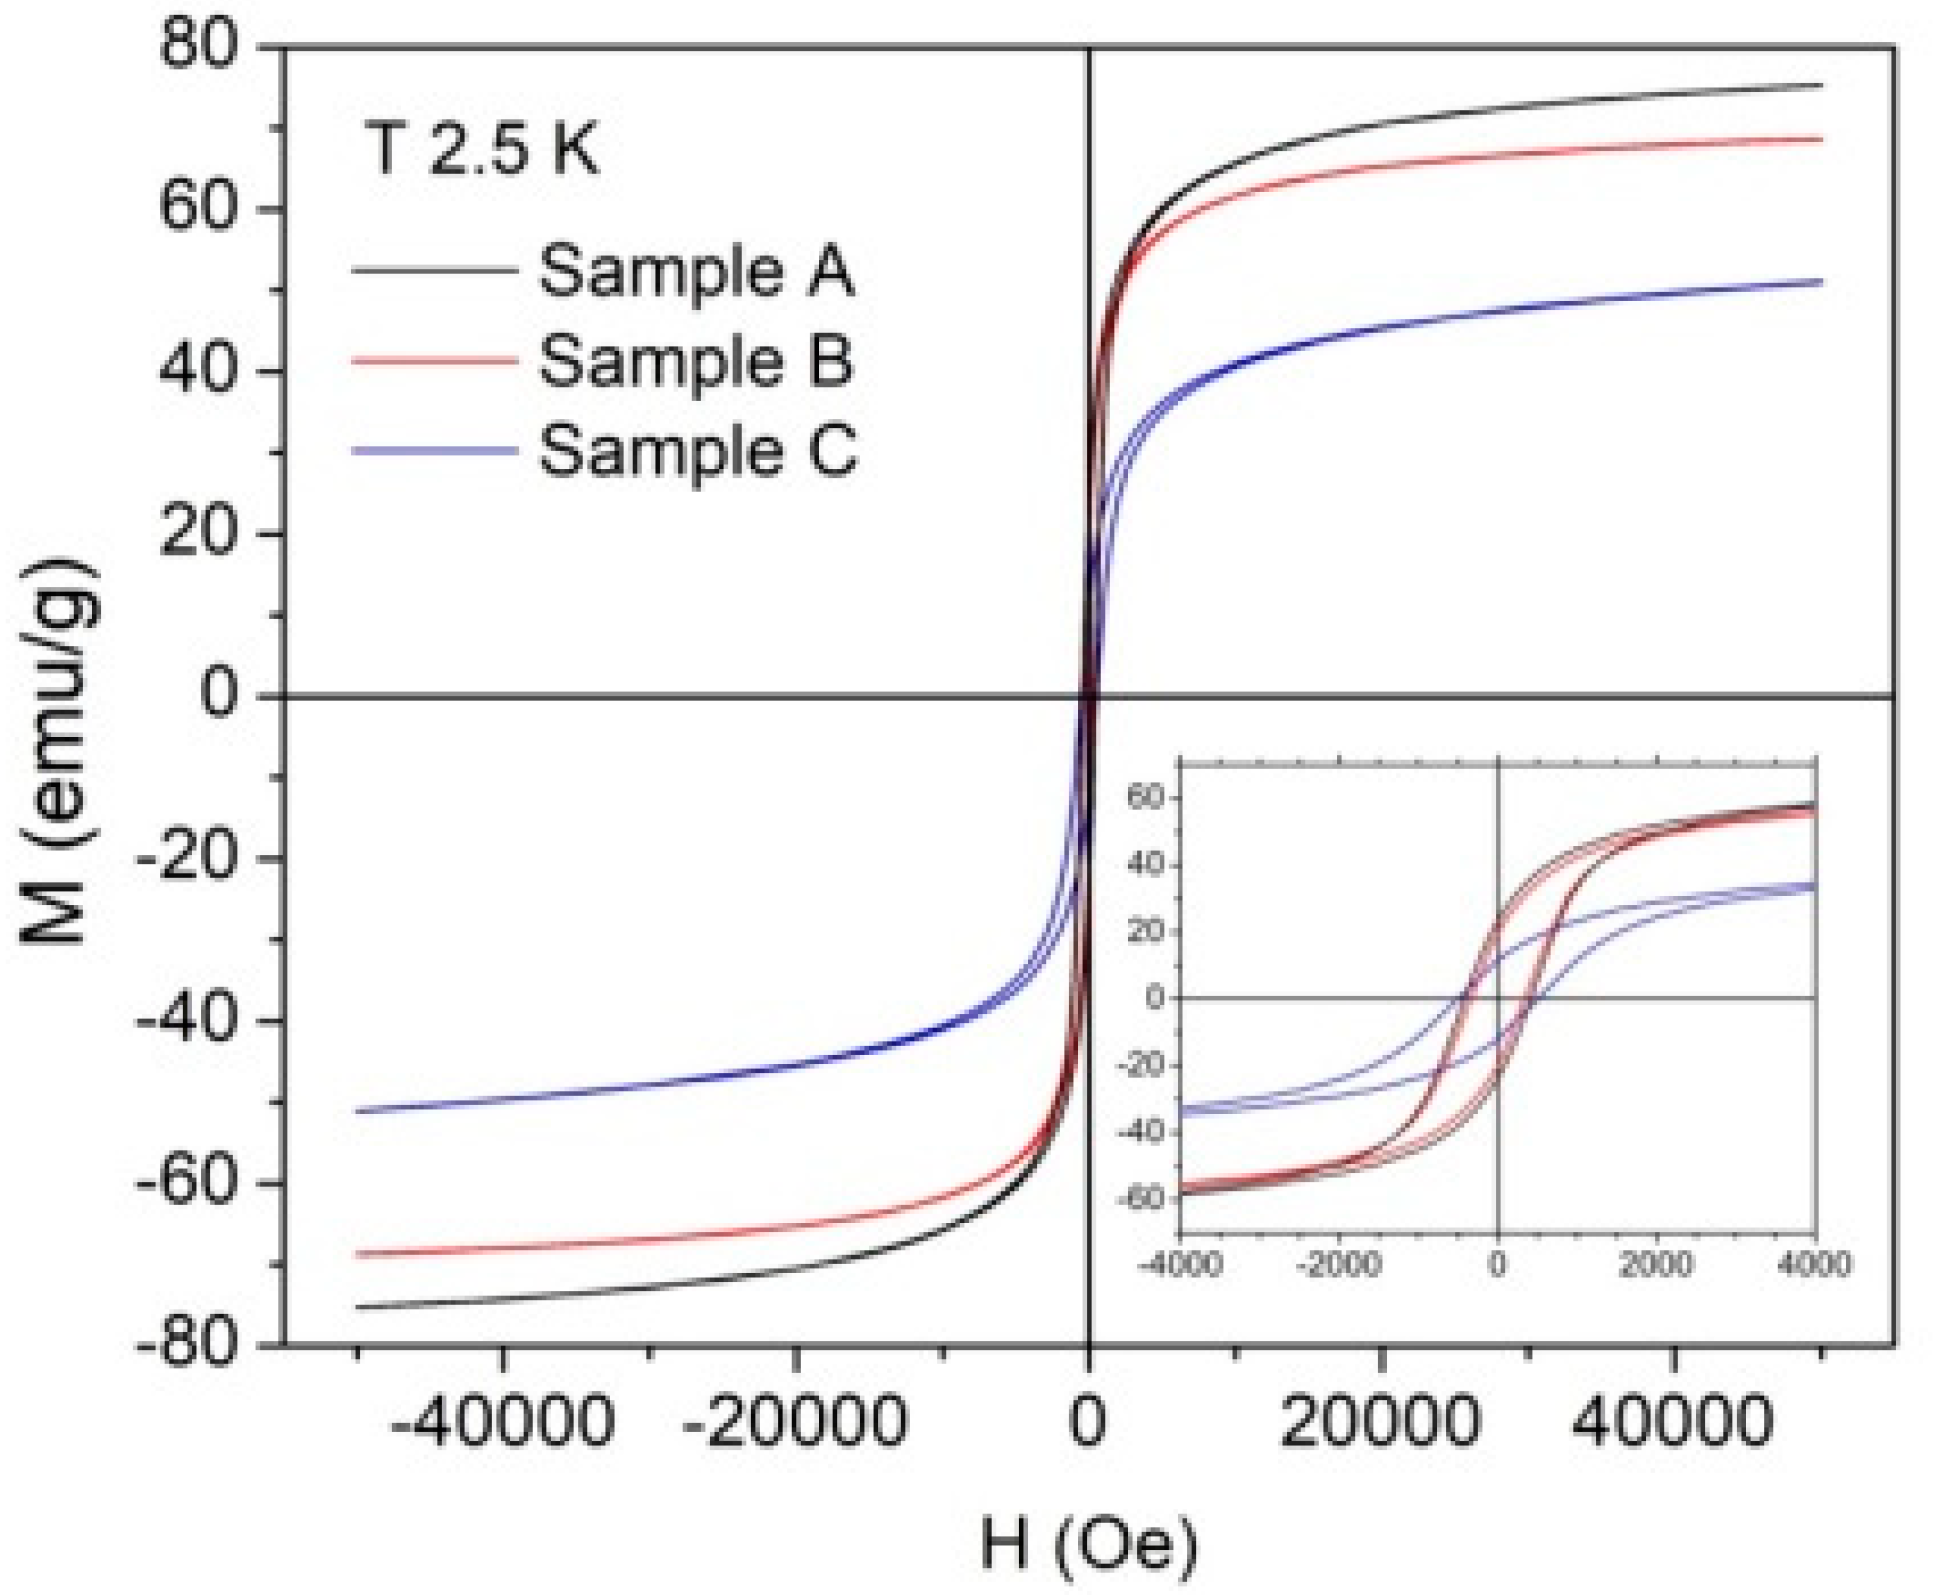
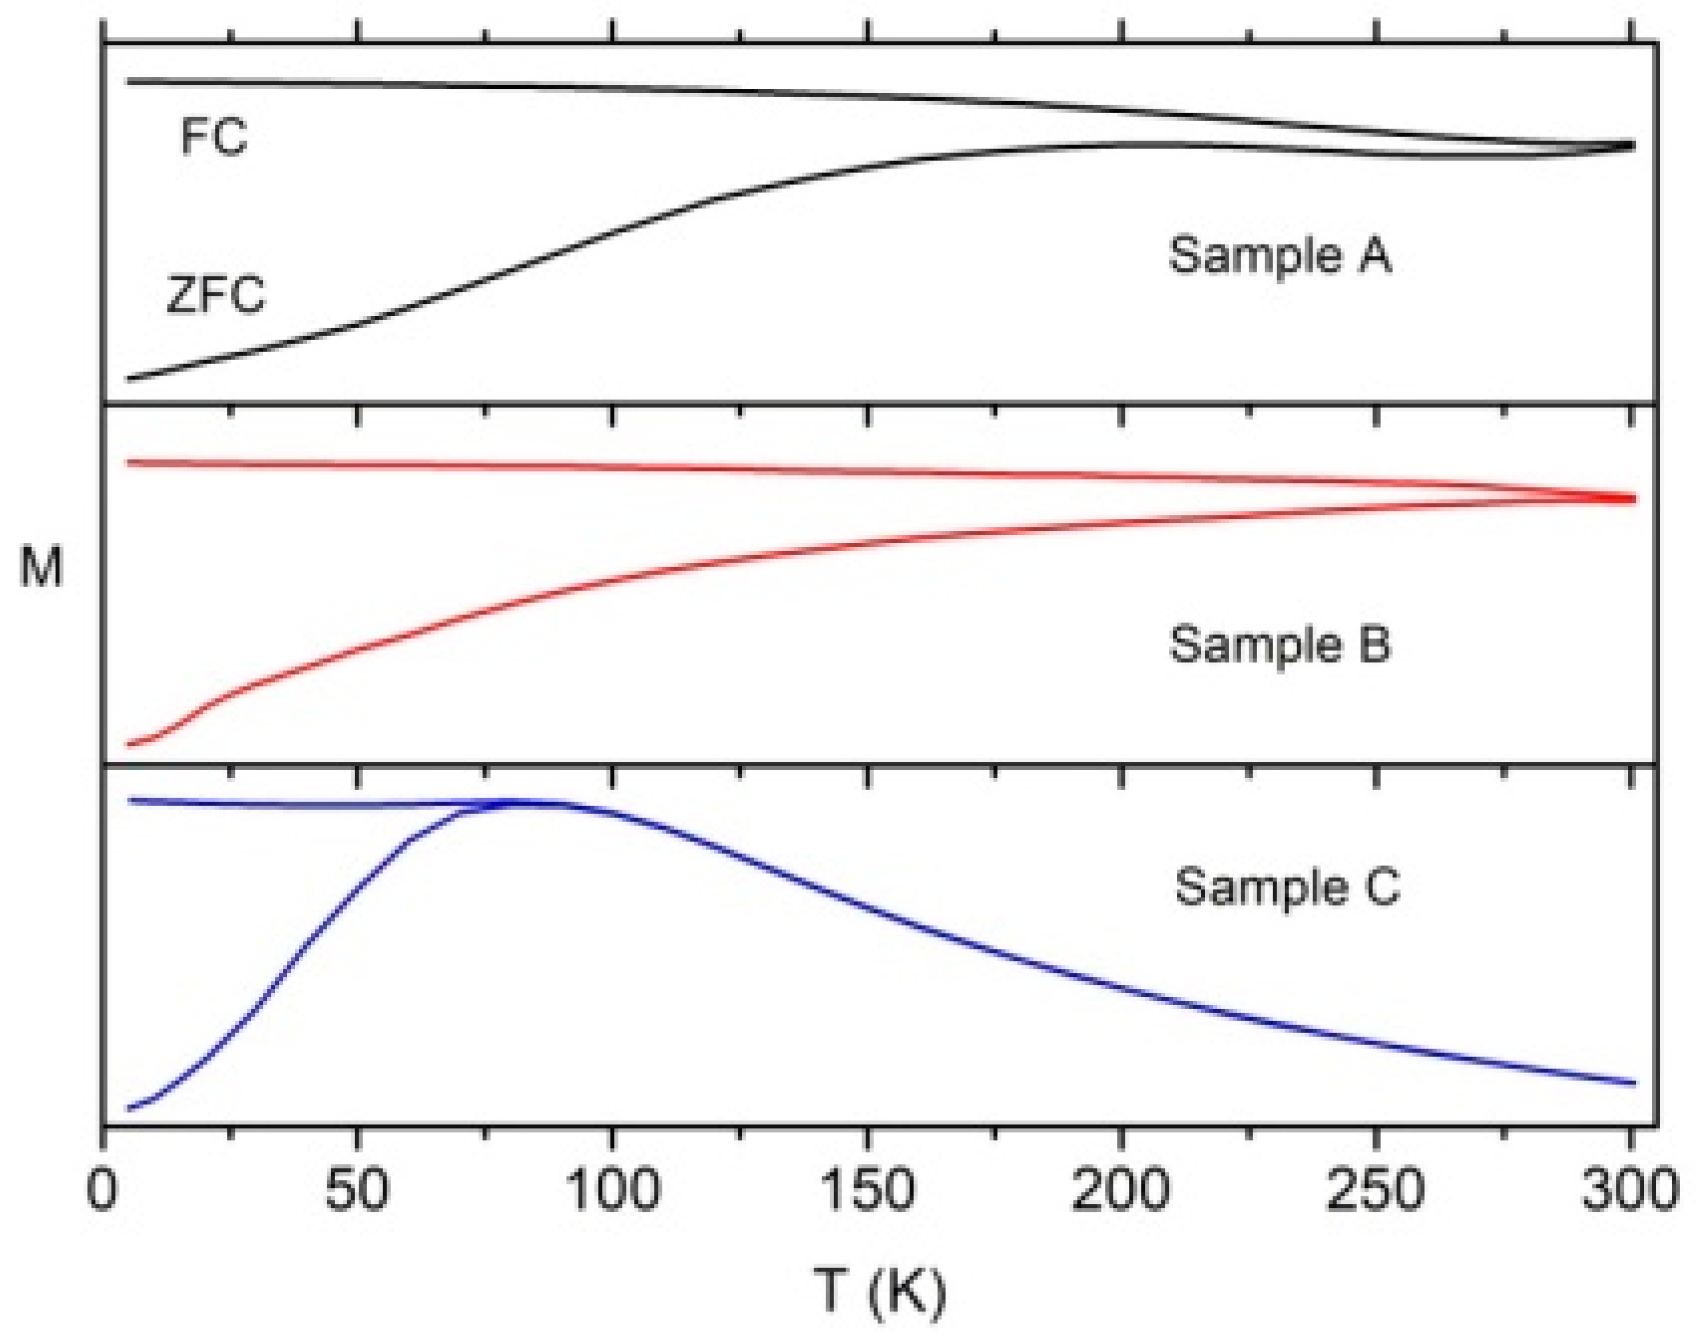
3.3.1. Magnetization Measurements
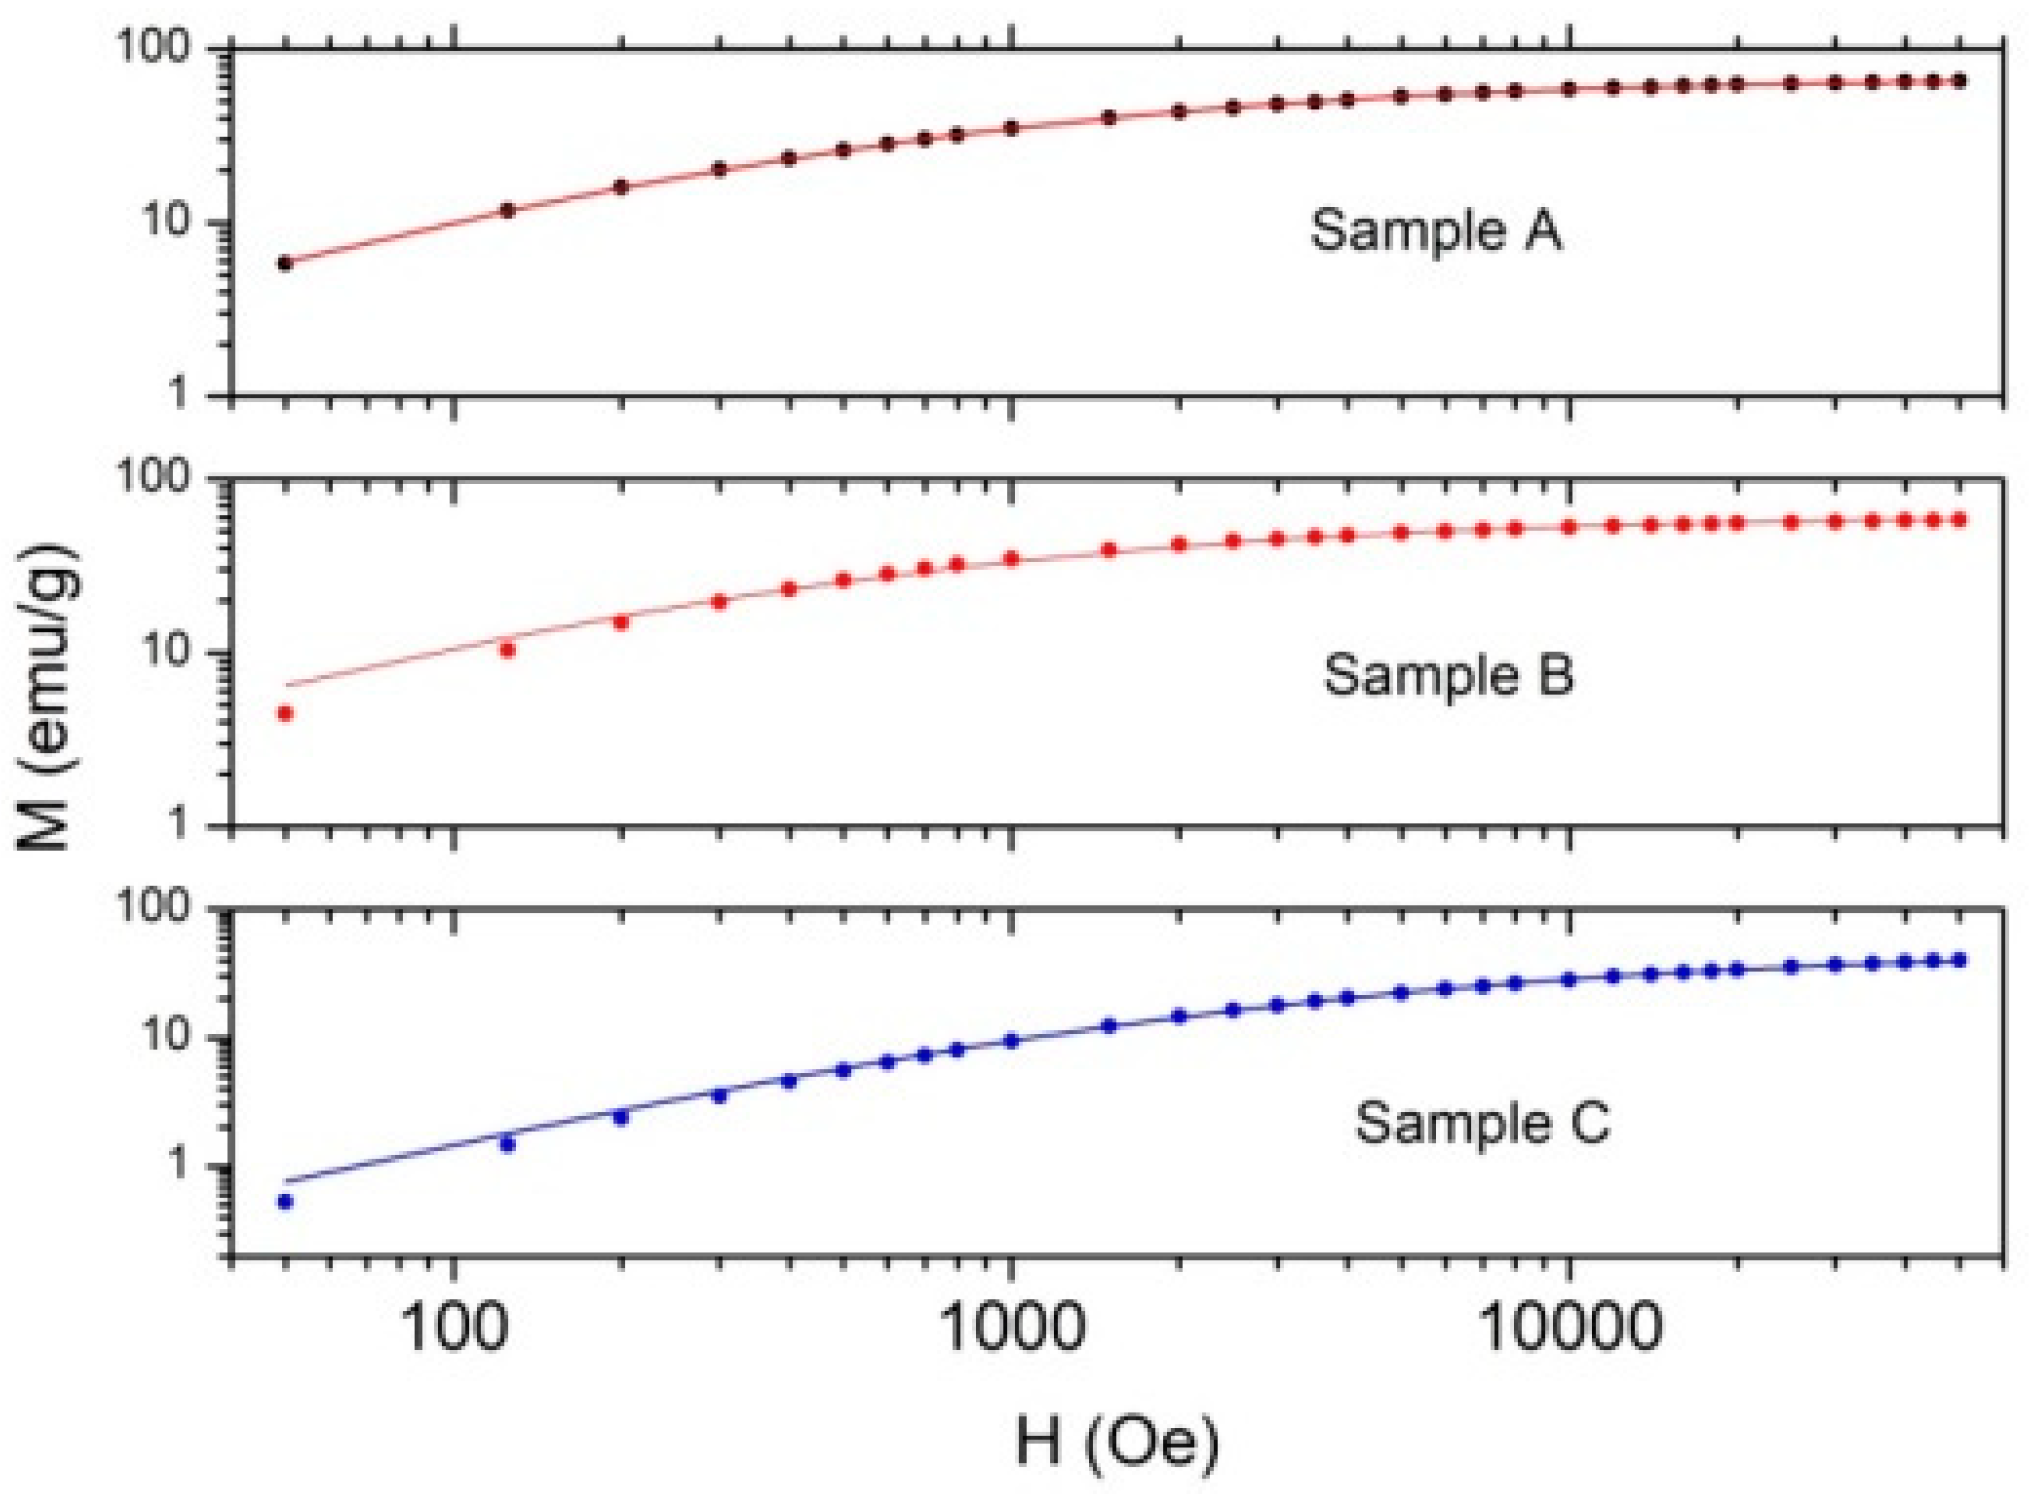
3.3.2. Size of the Magnetic Domains
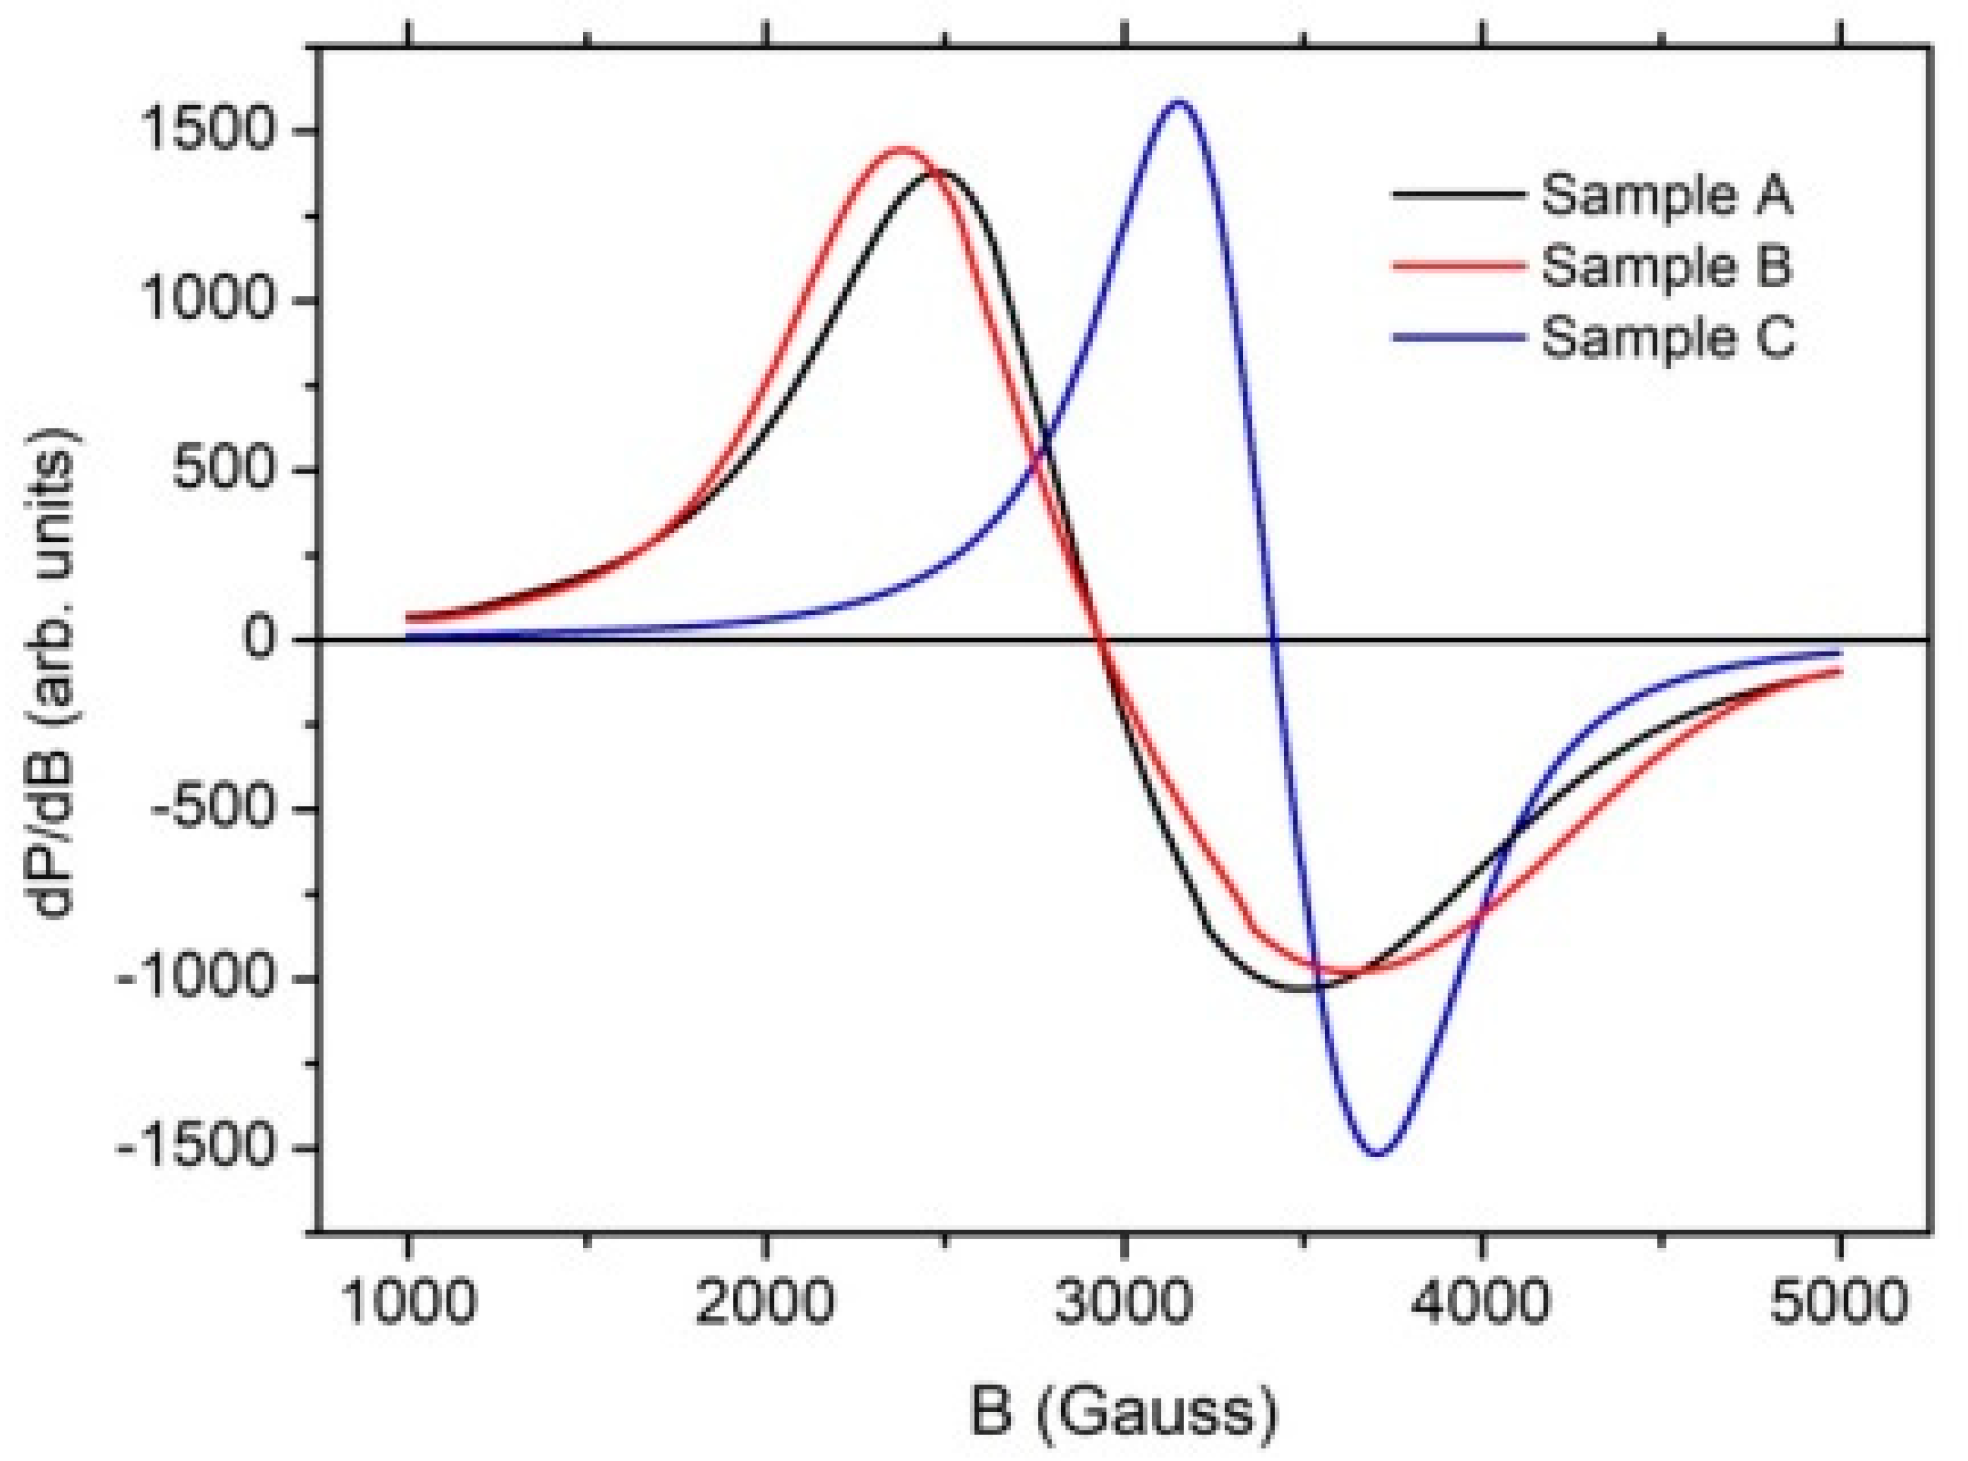
3.3.3. EPR
4. Conclusions
Supplementary Materials
Author Contributions
Funding
Institutional Review Board Statement
Informed Consent Statement
Data Availability Statement
Acknowledgments
Conflicts of Interest
References
- Massart, R. Preparation of aqueous magnetic liquids in alkaline and acidic Media. IEEE Trans. Magn. 1981, 17, 1247–1248. [Google Scholar] [CrossRef]
- Ahn, T.; Kim, J.H.; Yang, H.; Lee, J.W.; Kim, J. Formation pathways of magnetite nanoparticles by coprecipitation method. J. Phys. Chem. C 2012, 116, 6069–6076. [Google Scholar] [CrossRef]
- Baumgartener, J.; Dey, A.; Le Coadou, C.; Fratzl, P.; Sommerdijk, N.A.J.M.; Faivre, D. Nucleation and growth of magnetite from solution. Nat. Mater. 2013, 12, 310–314. [Google Scholar] [CrossRef] [PubMed]
- Widdrat, M.; Schneck, E.; Reichel, V.; Baumgartner, J.; Bertinetti, L.; Habraken, W.; Bente, K.; Fratzl, P.; Faivre, D. Combined experimental and theoretical approach to the kinetics of magnetite crystal growth form primary particles. J. Phys. Chem. Lett. 2017, 8, 1132–1136. [Google Scholar] [CrossRef] [Green Version]
- La Grow, A.P.; Besenhard, M.O.; Hodzic, A.; Sergides, A.; Borgart, L.K.; Gavriilidis, A.; Thanh, N.T.K. Unravelling the growth mechanism of the co-precipitation of iron oxide nanoparticles with the aid of synchrotron X-ray diffraction in solution. Nanoscale 2019, 11, 6620–6628. [Google Scholar] [CrossRef] [Green Version]
- Iida, H.; Takayanagi, K.; Nakanishi, T.; Osaka, T. Synthesis of Fe3O4 nanoparticles with various sizes and magnetic properties by controlled hydrolysis. J. Colloid Interface Sci. 2007, 314, 274–280. [Google Scholar] [CrossRef] [PubMed]
- Aphesteguy, J.C.; Kurlyandskaya, G.V.; de Celis, J.P.; Safronov, A.P.; Schegoleva, N.N. Magnetite nanoparticles prepared by co-precipitation method in different conditions. Mater. Chem. Phys. 2015, 161, 243–249. [Google Scholar] [CrossRef]
- Klencsár, Z.; Ábrahám, A.; Szabó, L.; Szabó, E.G.; Stichleutner, S.; Kuzmann, E.; Homonnay, Z.; Tolnai, G. The effect of preparation conditions on magnetite nanoparticles obtained by chemical co-precipitation. Mater. Chem. Phys. 2019, 223, 122–132. [Google Scholar] [CrossRef]
- Schwaminger, S.P.; Syhr, C.; Berensmeier, S. Controlled synthesis of magnetic iron oxide nanoparticles: Magnetite or maghemite? Crystals 2020, 10, 214. [Google Scholar] [CrossRef] [Green Version]
- Kosmulski, M. The pH dependent surface charging and points of zero charge.VII. Update. Adv. Colloid Interface Sci. 2018, 251, 115–138. [Google Scholar] [CrossRef]
- Tombácz, E.; Toth, I.Y.; Nesztor, D.; Illés, E.; Hajdú, A.; Szekers, M.; Vékás, L. Adsorption of organic acids on magnetite nanoparticles, pH-dependent colloidal stability and salt tolerance. Colloids Surf. A 2013, 435, 91–96. [Google Scholar] [CrossRef] [Green Version]
- Kharisov, B.I.; Dias, R.H.V.; Kharissova, O.V.; Vazquez, A.; Peña, Y.; Gómez, I. Solubilization, dispersion and stabilization of magnetic nanoparticles in water and non-aqueous solvents: Recent trends. RSC Adv. 2014, 4, 45354–45381. [Google Scholar] [CrossRef]
- Moore, T.L.; Rodriguez-Lorenzo, L.; Hirsch, V.; Balog, S.; Urban, D.; Jud, C.; Rothen-Rutishauser, B.; Lattuada, M.; Alke Petri-Fink, A. Nanoparticle colloidal stability in cell culture media and impact on cellular interactions. Chem. Soc. Rev. 2015, 44, 6287–6305. [Google Scholar] [CrossRef] [PubMed] [Green Version]
- Pujari, S.; Scheres, L.; Marcelis, T.M.; Zuilhof, H. Covalent surface modification of oxide surfaces. Angew. Chem. Int. Ed. 2014, 53, 6322–6356. [Google Scholar] [CrossRef] [PubMed]
- Park, J.; Shumaker-Parry, J.S. Structural study of citrate layers on gold nanoparticles: Role of intermolecular interactions in stabilizing nanoparticles. J. Am. Chem. Soc. 2014, 136, 1907–1921. [Google Scholar] [CrossRef] [PubMed]
- Franco-Ulloha, S.; Tatulli, G.; Bore, S.L.; Moglianetti, M.; Pompa, P.P.; Cascella, M.; De Vivo, M. Dispersion state phase diagram of citrate-coated metallic nanoparticles in saline solutions. Nat. Commun. 2020, 11, 5422. [Google Scholar] [CrossRef] [PubMed]
- Mudunkotuwa, I.A.; Grassian, V.H. Citric acid adsorption on TiO2 nanoparticles in aqueous suspensions at acidic and circumneutral pH: Surface coverage, surface speciation, and its impact on nanoparticle-nanoparticle interactions. J. Am. Chem. Soc. 2010, 132, 14986–14994. [Google Scholar] [CrossRef]
- Laurent, S.; Forge, D.; Port, M.; Roch, A.; Robic, C.; Vander Elst, L.; Robert, N.; Muller, R.N. Magnetic iron oxide nanoparticles: Synthesis, stabilization, vectorization, physicochemical characterizations, and biological applications. Chem. Rev. 2008, 108, 2064–2110. [Google Scholar] [CrossRef]
- Kotsmar, C.; Yoon, K.Y.; Yu, H.; Ryoo, S.Y.; Barth, J.; Shao, S.; Prodanović, M.; Milner, T.E.; Bryant, L.S.; Huh, C.; et al. Stable citrate-coated iron oxide superparamagnetic nanoclusters at high salinity. Ind. Eng. Chem. Res. 2010, 49, 12435–12443. [Google Scholar] [CrossRef]
- Liu, J.; Sun, Z.; Deng, Y.; Zou, Y.; Li, C.; Guo, X.; Xiong, L.; Gao, Y.; Li, F.; Zhao, D. Highly water-dispersible biocompatible magnetite particles with low cytotoxicity stabilized by citrate groups. Angew. Chem. Int. Ed. 2009, 48, 5875–5879. [Google Scholar] [CrossRef]
- Gutiérrez, L.; Costo, R.; Grüttner, C.; Westphal, F.; Gehrke, N.; Heinke, D.; Fornara, A.; Pankhurst, Q.A.; Johansson, C.; Veintemillas-Verdaguera, S.; et al. Synthesis methods to prepare single- and multi-core iron oxide nanoparticles for biomedical applications. Dalton Trans. 2015, 44, 2943–2952. [Google Scholar] [CrossRef]
- Yoon, K.Y.; Xue, Z.; Fei, Y.; Lee, J.H.; Cheng, V.; Bagaria, H.G.; Huh, C.; Bryant, S.L.; Kong, S.D.; Ngo, V.W.; et al. Control of magnetite primary particle size in aqueous dispersions of nanoclusters for high magnetic susceptibilities. J. Colloid Interface Sci. 2016, 462, 359–367. [Google Scholar] [CrossRef]
- Kirillov, V.L.; Balaev, D.A.; Semenov, S.V.; Shaikhutdinov, K.A.; Martyanov, O.N. Size control in the formation of magnetite nanoparticles in the presence of citrate ions. Mater. Chem. Phys. 2014, 145, 75–81. [Google Scholar] [CrossRef]
- Pielaszek, R. FW15/45M method for determination of the grain sizedistribution from powder diffraction line profile. J. Alloys Compd. 2004, 382, 128–132. [Google Scholar] [CrossRef]
- Scardi, P.; Leoni, M. Diffraction line profiles from polydisperse crystalline systems. Acta Cryst. A 2001, 57, 604–613. [Google Scholar] [CrossRef] [Green Version]
- David, W.I.F.; Scardi, P.; Leoni, M. Domain size analysis in the Rietveld method. Mater. Sci. Forum 2010, 651, 187–200. [Google Scholar] [CrossRef]
- El-Hilo, M. Nano-particle magnetism with a dispersion of particle sizes. J. Appl. Phys. 2012, 103915. [Google Scholar] [CrossRef]
- Woodward, R.C.; Heeris, J.; St. Pierre, T.G.; Saunders, M.; Gilbert, E.P.; Rutnakornpituk, M.; Zhange, Q.; Rifflee, J.S. A comparison of methods for the measurement of the particle-size distribution of magnetic nanoparticles. J. Appl. Cryst. 2007, 40, s495–s500. [Google Scholar] [CrossRef]
- Dehsari, H.S.; Ksenofontov, V.; Möller, A.; Jakob, G.; Asadi, K. Determining magnetite/maghemite composition and core-shell nanostructure from magnetization curve for iron oxide nanoparticles. J. Phys. Chem. C 2018, 122, 28292–28301. [Google Scholar] [CrossRef]
- Chiche, D.; Digne, M.; Revel, R.; Chanéac, C.; Jolivet, J. Accurate determination of oxide nanoparticle size and shape based on x-ray powder pattern simulation: Application to Boehmite AlOOH. J. Phys. Chem. C 2008, 112, 8524–8533. [Google Scholar] [CrossRef]
- Williamson, G.K.; Hall, W.H. X-ray line broadening from filed aluminium and wolfram. Acta Metall. 1953, 1, 22–31. [Google Scholar] [CrossRef]
- Nath, D.; Singh, F.; Das, R. X-ray diffraction analysis by Williamson-Hall, Halder-Wagner and size-strain plot methods of CdSe nanoparticles: A comparative study. Mater. Chem. Phys. 2020, 239, 122021. [Google Scholar] [CrossRef]
- Mirabello, G.; Keizer, A.; Bomans, P.H.H.; Kovács, A.; Dunin-Borkowki, E.R.; Sommerdijk, N.A.J.M.; Friedrich, H. Understanding the formation mechanism of magnetite mesocrystals with (cryo-)electron microscopy. Chem. Mater. 2019, 31, 7320–7328. [Google Scholar] [CrossRef] [Green Version]
- Sturm, V.E.; Cölfen, H. Mesocrystals: Structural and morphogentic aspects. Chem. Soc. Rev. 2016, 45, 5821–5833. [Google Scholar] [CrossRef] [Green Version]
- Gávilan, H.; Sánchez, H.E.; Brollo, M.E.F.; Asìn, L.; Moerner, K.K.; Frandsen, C.; Lázaro, F.J.; Serna, C.J.; Veintemillas-Verdaguer, S.; Puerto Morales, M.; et al. Formation mechanism of maghemite nanoflowers synthesized by a polyol-mediated process. ACS Omega 2017, 2, 7172–7184. [Google Scholar] [CrossRef] [PubMed] [Green Version]
- Caizer, C. Handbook of Nanoparticles; Aliofkhazarei, M., Ed.; Springer International Publishing: Cham, Switzerland, 2016. [Google Scholar]
- Batlle, X.; Peréz, N.; Guardia, P.; Iglesias, O.; Labarta, A.; Bartolomé, F.; García, L.M.; Bartolomé, J.; Roca, A.G.; Morales, M.P.; et al. Magnetic nanoparticles with bulklike properties. J. Appl. Phys. 2011, 109, 07B524. [Google Scholar] [CrossRef] [Green Version]
- Stoner, E.C.; Wohlfarth, E.P. A mechanism of magnetic hysteresis in heterogeneous alloys. Philos. Trans. R. Soc. A 1948, 240, 599. [Google Scholar] [CrossRef]
- Baumgartner, J.; Bertinetti, L.; Widdrat, M.; Hirt, A.M.; Faivre, D. Formation of magnetite nanoparticles at low temperature: From superparamagnetic to stable single domain particles. PLoS ONE 2013, 8, e57070. [Google Scholar] [CrossRef]
- Mandel, K.; Hutter, F.; Gellermann, C.; Sextl, G. Stabilisation effects of superparamagnetic nanoparticles on clustering in nanocomposite microparticles and on magnetic behavior. J. Magn. Magn. Mater. 2013, 331, 269–275. [Google Scholar] [CrossRef]
- Ge, J.; Hu, Y.; Biasini, M.; Beyermann, W.P.; Yadong, Y. Superparamagnetic magnetite colloidal nanocrystal clusters. Angew. Chem. Int. Ed. 2007, 46, 4342–4345. [Google Scholar] [CrossRef]
- Reichel, V.; Kumari, M.; Bereczk-Tompa, E.; Scheck, E.; Diehle, P.; Pósfai, M.; Hirt, A.M.; Duchamp, M.; Dunin-Borkowski, R.E.; Faivre, D. Single crystalline superstructured stable single domain magnetite nanoparticles. Sci. Rep. 2017, 7, 45484. [Google Scholar] [CrossRef] [PubMed] [Green Version]
- Chen, D.-X.; Sanchez, A.; Taboada, E.; Roig, A.; Sun, N.; Gu, H.-C. Size determination of superparamagnetic nanoparticles from magnetization curve. J. Appl. Phys. 2009, 105, 083924. [Google Scholar] [CrossRef]
- El-Hilo, M.; Chantrell, R.W. Rationalisation of distribution functions for models of nanoparticle magnetism. J. Magn. Magn. Mater. 2012, 324, 2593–2595. [Google Scholar] [CrossRef]
- Mørup, S.; Hansen, M.F.; Frandsen, C. Magnetic interactions between nanoparticles. Beilstein J. Nanotechnol. 2010, 1, 182–190. [Google Scholar] [CrossRef] [Green Version]
- Morais, P.C.; Lara, M.C.F.L.; Tronconi, A.L.; Tourinho, F.A.; Pereira, A.R.; Pelegrini, F. Magnetic particle-particle interaction in frozen magnetic fluids. J. App. Phys. 1996, 79, 7931–7935. [Google Scholar] [CrossRef]


| Sample A (Bare Fe3O4 NPs) | a0 (nm) | <D> (nm) | σ (nm) |
|---|---|---|---|
| Scherrer | 0.837 | 8.4 ± 0.3 | - |
| Williamson-Hall | - | 8.6 ± 0.7 | - |
| Pielaszek | - | 8.7 ± 0.5 | 3.8 ± 0.6 |
| Rietveld (PM2K) | 0.836 | 9.7 ± 0.1 | 2.4 ± 0.1 |
| Sample B (Fe3O4 NPs cit. ex situ) | |||
| Scherrer | 0.837 | 9.2 ± 0.5 | - |
| Williamson-Hall | - | 9.6 ± 1.5 | - |
| Pielaszek | - | 8.9 ± 0.8 | 4.1 ± 0.7 |
| Rietveld (PM2K) | 0.838 | 10.3 ± 0.7 | 2.6 ± 0.2 |
| Sample C (Fe3O4 NPs cit. in situ) | |||
| Scherrer | 0.837 | 3.4 ± 0.3 | - |
| Williamson-Hall | - | 4.0 ± 1.0 | - |
| Pielaszek | - | 3.7 ± 0.3 | 1.6 ± 0.5 |
| Rietveld (PM2K) | 0.838 | 4.6 ± 0.2 | 0.9 ± 0.2 |
| <D> (nm) | σ (nm) | σ/<D> | a0 (nm) | |
|---|---|---|---|---|
| Bare NPs (sample A) | 8.8 ± 0.7 | 3.1 ± 0.4 | 0.35 ± 0.07 | 0.837 ± 0.001 |
| Sample B (Fe3O4 NPs cit. ex situ) | 9.5 ± 0.9 | 3.3 ± 0.4 | 0.35 ± 0.07 | 0.837 ± 0.001 |
| Sample C (Fe3O4 NPs cit. in situ) | 3.9 ± 0.5 | 1.2 ± 0.4 | 0.31 ± 0.14 | 0.837 ± 0.001 |
| Hydrodynamic Diameter (nm) | PDI | ζ-Potential (mV) | |
|---|---|---|---|
| Sample A | 398 ± 22 | 0.39 ± 0.1 | 16 ± 1 |
| (1 week after preparation) | - | - | - |
| Sample B | 194 ± 6 | 0.29 ± 0.06 | −58 ± 3 |
| (1 week after preparation) | 155 ± 2 | 0.41 ± 0.02 | −55 ± 2 |
| Sample C | 163 ± 3 | 0.30 ± 0.02 | −65 ± 5 |
| (1 week after preparation) | 136 ± 3 | 0.12 ± 0.02 | −71 ± 2 |
| Sample | Ms (emu/g) at 300 K | Ms (emu/g) at 2.5 K | Mr/Ms | Hc (Oe) |
|---|---|---|---|---|
| A (bare NPs) | 66 | 74 | 0.31 | 423 |
| B (Fe3O4 NPs cit. ex situ) | 58 | 68 | 0.29 | 342 |
| C (Fe3O4 NPs cit. in situ) | 40 | 51 | 0.23 | 511 |
| Sample | <Dm> (nm) | σ (nm) | σ/<Dm> | Ms (emu/g) |
|---|---|---|---|---|
| A | 8.7 ± 0.6 | 5.1 ± 0.1 | 0.6 ± 0.1 | 67 ± 1 |
| B | 9.9 ± 0.5 | 4.9 ± 0.2 | 0.5 ± 0.1 | 58 ± 1 |
| C | 5.1 ± 0.6 | 2.8 ± 0.1 | 0.5 ± 0.1 | 46 ± 1 |
| Sample | B0 (Gauss) | g | ∆B (Gauss) | A |
|---|---|---|---|---|
| A | 2932 | 2.41 ± 0.01 | 989 | 1.25 |
| B | 2939 | 2.41 ± 0.01 | 1160 | 1.27 |
| C | 3417 | 2.06 ± 0.01 | 555 | 1.10 |
Publisher’s Note: MDPI stays neutral with regard to jurisdictional claims in published maps and institutional affiliations. |
© 2021 by the authors. Licensee MDPI, Basel, Switzerland. This article is an open access article distributed under the terms and conditions of the Creative Commons Attribution (CC BY) license (https://creativecommons.org/licenses/by/4.0/).
Share and Cite
Atrei, A.; Mahdizadeh, F.F.; Baratto, M.C.; Scala, A. Effect of Citrate on the Size and the Magnetic Properties of Primary Fe3O4 Nanoparticles and Their Aggregates. Appl. Sci. 2021, 11, 6974. https://doi.org/10.3390/app11156974
Atrei A, Mahdizadeh FF, Baratto MC, Scala A. Effect of Citrate on the Size and the Magnetic Properties of Primary Fe3O4 Nanoparticles and Their Aggregates. Applied Sciences. 2021; 11(15):6974. https://doi.org/10.3390/app11156974
Chicago/Turabian StyleAtrei, Andrea, Fariba Fahmideh Mahdizadeh, Maria Camilla Baratto, and Andrea Scala. 2021. "Effect of Citrate on the Size and the Magnetic Properties of Primary Fe3O4 Nanoparticles and Their Aggregates" Applied Sciences 11, no. 15: 6974. https://doi.org/10.3390/app11156974
APA StyleAtrei, A., Mahdizadeh, F. F., Baratto, M. C., & Scala, A. (2021). Effect of Citrate on the Size and the Magnetic Properties of Primary Fe3O4 Nanoparticles and Their Aggregates. Applied Sciences, 11(15), 6974. https://doi.org/10.3390/app11156974