Article

Imperfections of Scalar Approximation in Calibration of Computer-Generated Holograms for Optical Surface Measurements

1
Key Laboratory of Optical System Advanced Manufacturing Technology, Changchun Institute of Optics, Fine Mechanics and Physics, Chinese Academy of Sciences, Changchun 130033, China
2
University of Chinese Academy of Sciences, Beijing 100049, China
*
Authors to whom correspondence should be addressed.
Appl. Sci. 2021, 11(15), 6897; https://doi.org/10.3390/app11156897
Submission received: 1 July 2021 / Revised: 23 July 2021 / Accepted: 24 July 2021 / Published: 27 July 2021

Abstract

:
Computer-generated hologram (CGH) null correctors are used as accuracy standards for interferometric measurements of optical surfaces and optical systems. Diffractive optics calibrators (DOCs) have been developed to evaluate the phase tolerance of CGHs based on scalar approximation by measuring variations in duty cycle and etching depth. However, if the grating period of a CGH < 5λ, the scalar approximation is not accurate for phase analysis and reconstruction. In this study, the measurement errors of DOCs with small-period CGHs were investigated and experimentally verified. Results show that the imperfections of scalar approximation in CGHs cannot be ignored and the development of rigorous evaluation methods to improve the measurement accuracy of CGHs is of great practical significance.

1. Introduction

Astronomy is an ancient science that has far-reaching and wide-ranging effects on human beings. However, further development in this field requires new advanced experimental equipment. Astronomical telescopes are an indispensable tool for observing distant planets, galaxies, and other astronomical objects. Aspherical and freeform optics have been extensively used in astronomical telescopes to improve imaging performance, reduce size, and minimize weight [1]. For example, our research team produced a SiC aspherical mirror with a form accuracy and a root-mean-square (RMS) of 18 nm over a 4 m aperture [2,3]. However, aspheric surfaces cannot be measured directly using an interferometer. Instead, it is necessary to use a corrector to change a spherical wavefront to an aspherical one, and the interferometer can then be adopted for aspherical testing, as for a general sphere [4].
In recent years, diffractive optical elements have played an important role in the field of imaging systems [5], X-ray focusing [6], laser beam shaping [7] and optical system testing [8]. Computer-generated holograms (CGHs) are specially designed diffractive optical elements that can create reference wavefronts for arbitrary aspherical surfaces. They are convenient and efficient correctors used to test the form accuracy of aspherical mirrors. To some extent, the accuracy and validity of interferometric measurements depend on the accuracy of the CGHs. Therefore, CGH fabrication errors must be budgeted or calibrated accurately.
The duty cycle and etching depth are two important geometric parameters of CGHs, which determine the diffraction efficiency and phase modulation. These geometric parameters of CGHs can be measured directly using a white light interferometer [9] or a scanning electron microscope [10]. However, these methods represent local micro-investigations, and they cannot be used to evaluate the accuracy of CGHs directly. Diffractive optics calibrators (DOCs) are a promising method for the accurate measurements of CGHs based on spectroscopic scatterometry [11,12,13]. According to scalar approximation theory, the duty cycle and etching depth of the CGHs can be determined simultaneously by fitting the measured intensities from spectroscopic scatterometry to the grating parametric model [14]. However, the scalar approximation has imperfections for small-period structures that led to phase errors, which will cause the fitting results to be inaccurate in the DOCs as well.
This study aims to ascertain the measurement errors in DOCs using rigorous finite-difference time-domain (FDTD) simulations for cases when scalar approximation fails to accurately describe CGHs in optical testing. Measurements of the fabrication errors of two gratings will be used to verify the imperfections in the scalar approximation for the evaluation of CGHs. The results will show that the effects of imperfections cannot be ignored in small-period structures. There is great significance in the development of rigorous evaluation methods to improve the accuracy of CGH measurements.

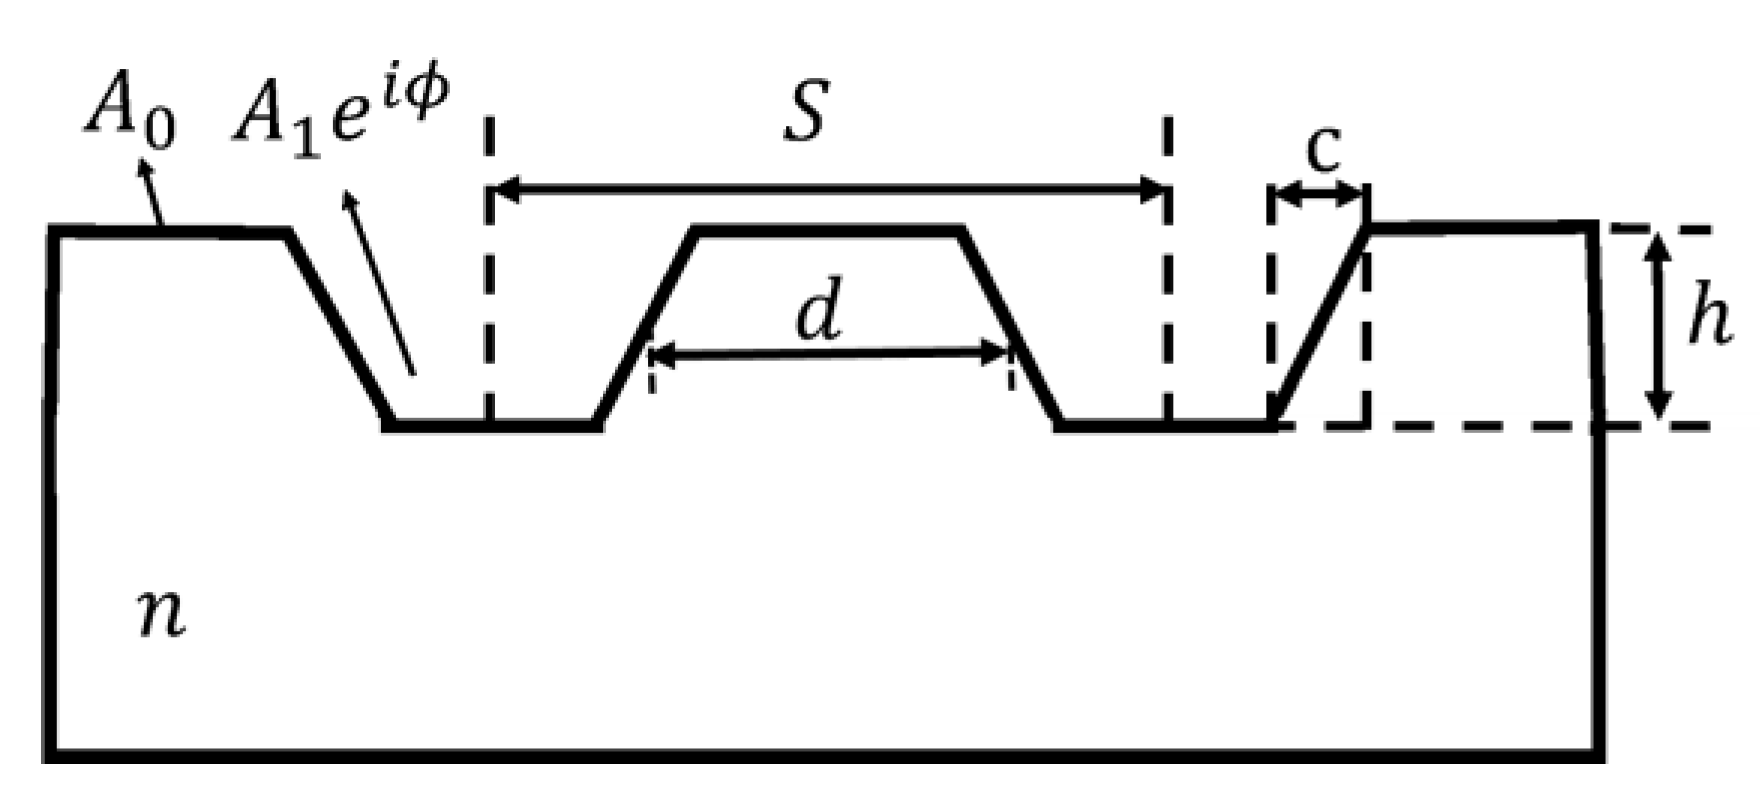
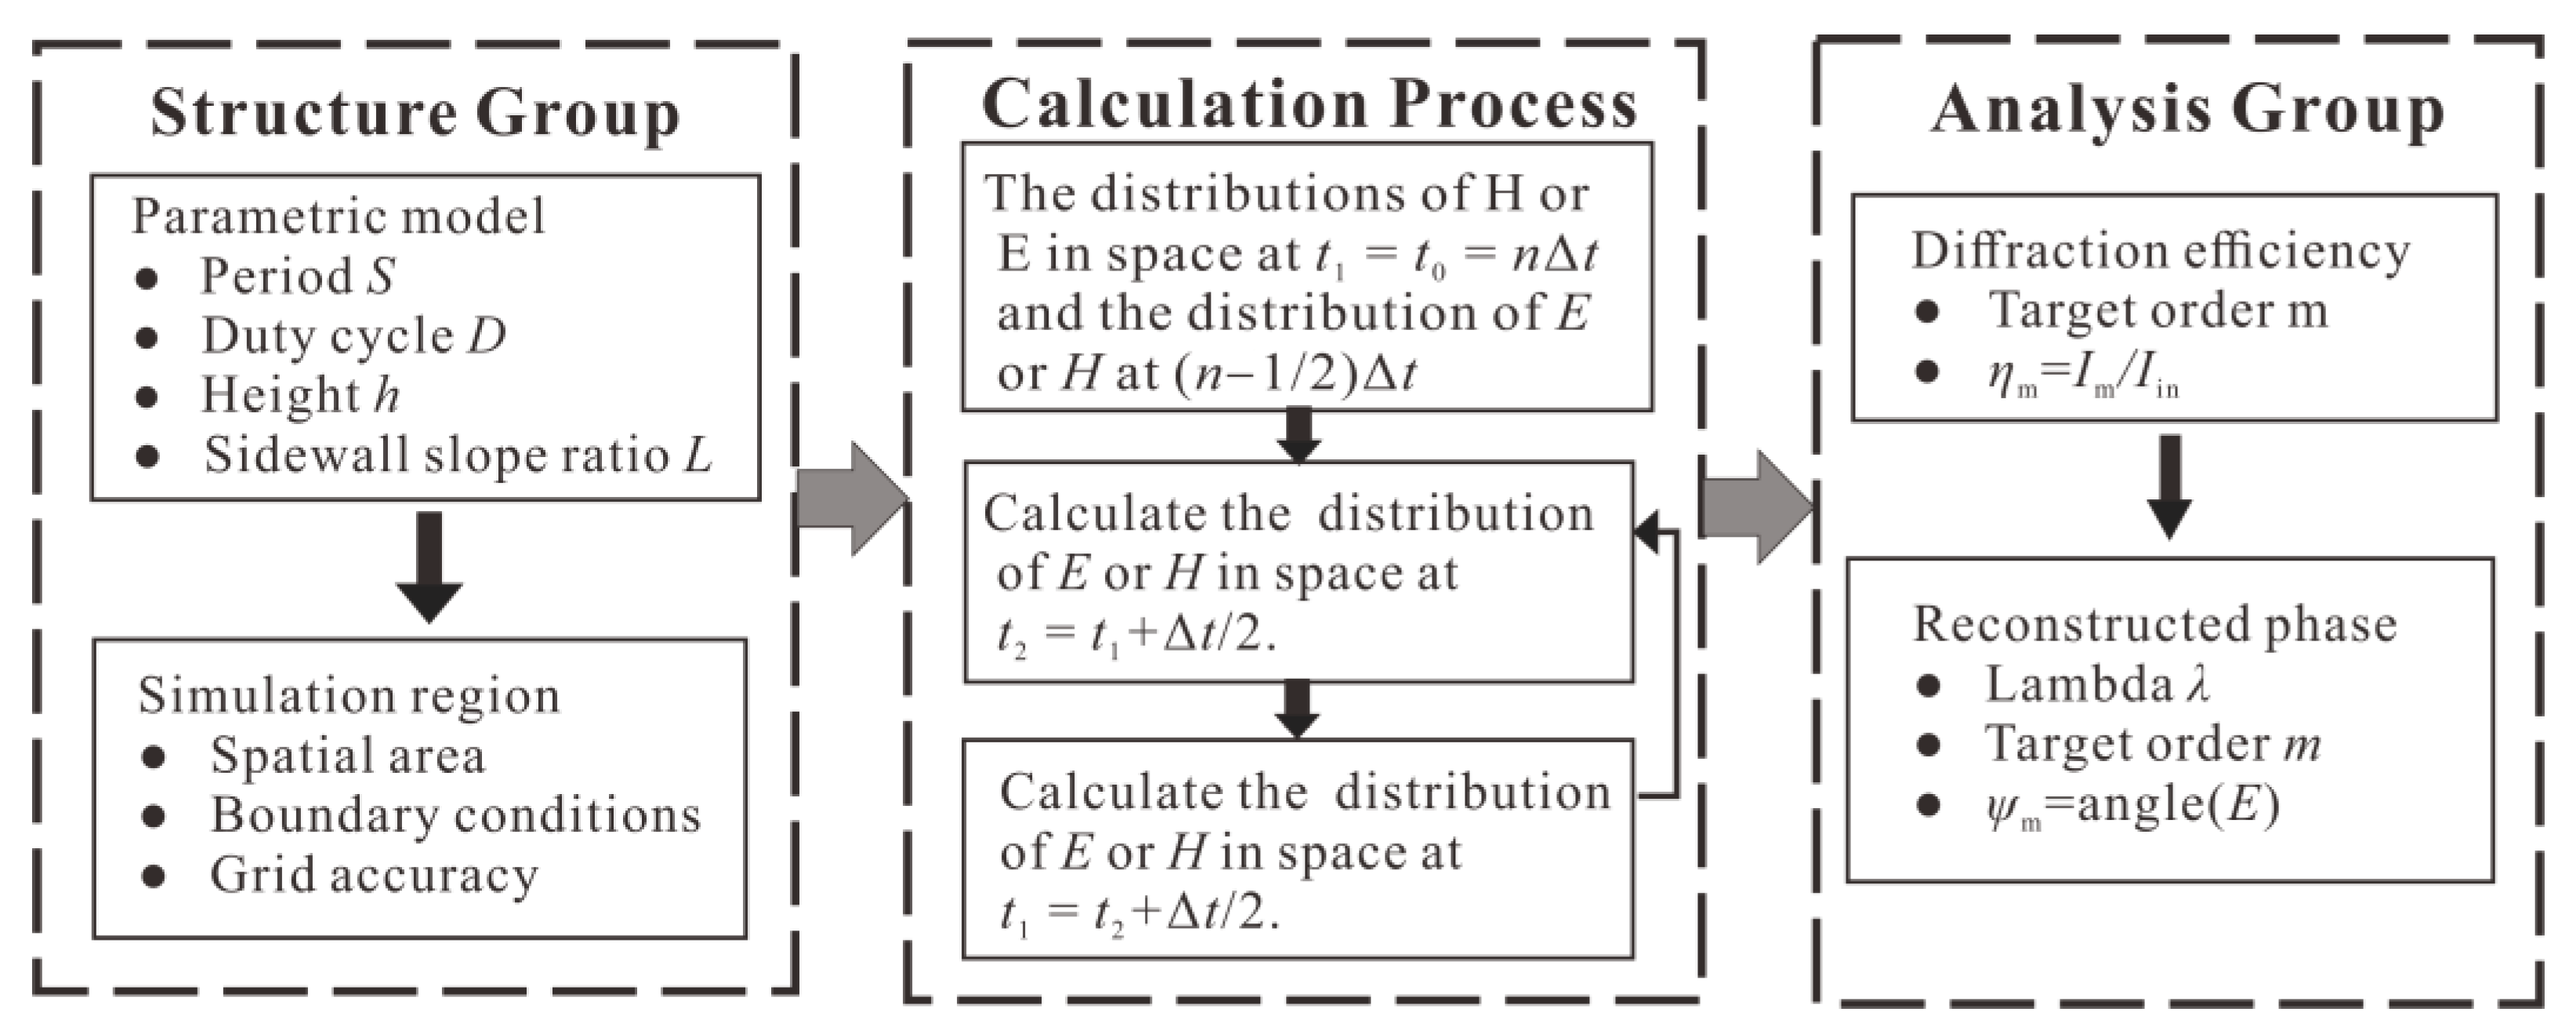
2. Parametric Model and Methods

A binary linear grating model was selected as the simulation model, which was widely used to study the sensitivity of the wavefront to CGH fabrication errors [15,16,17]. The lithography process forms a sidewall slope in the microstructure of CGHs. Therefore, a trapezoidal geometry was introduced to describe a binary grating with a sidewall slope, as shown in Figure 1. For a normal incident plane wavefront of λ, the output wavefront function can be expressed according to [11],
u ( x ) = A 0 + ( A 1 e i ϕ A 0 ) r e c t ( x d ) 1 c r e c t ( x c ) 1 S c o m b ( x S )
where the symbol * represents the convolution operation and the related variables are defined in Figure 1.
According to the scalar diffraction theory, the far-field diffraction wavefront U(ξ) is obtained via a simple Fourier transform of u(x).
U ( ξ ) = F { u ( x ) } = { A 0 δ ( ξ ) + [ A 1 cos ( ϕ ) A 0 ] D s i n c ( b ξ ) s i n c ( c ξ ) m = m = + δ ( ξ m S ) } + i { A 1 sin ( ϕ ) D s i n c ( b ξ ) s i n c ( c ξ ) m = m = + δ ( ξ m S ) ]
Therefore, diffraction wavefronts of different orders can be written as follows:
U ( ξ ) = { { A 0 + [ A 1 cos ( ϕ ) A 0 ] D } + i { A 1 sin ( ϕ ) D }    m = 0 { [ A 1 cos ( ϕ ) A 0 ] D sin c ( m D ) sin c ( m L ) }     m = ± 1 , ± 2 , + i { A 1 sin ( ϕ ) D sin c ( m D ) sin c ( m L ) ]
The diffraction efficiency ηscalar and output phase ψscalar can be obtained by,
η s c a l a r = { A 0 2 ( 1 D ) 2 + A 1 2 D 2 + 2 A 0 A 1 D ( 1 D ) cos ( ϕ )        m = 0 { A 0 2 + A 1 2 2 A 0 A 1 cos ( ϕ ) } D 2 sin c 2 ( m D ) sin c 2 ( m L ) m = ± 1 , ± 2 ,
and, as follows:
tan ψ s c a l a r = Im { U ( ξ ) } Re { U ( ξ ) } = { A 1 D sin ( ϕ ) A 0 ( 1 D ) + A 1 D cos ( ϕ )    m = 0 A 1 sin ( ϕ ) A 0 + A 1 cos ( ϕ )      m = ± 1 , ± 2 ,
If the periods of the CGHs are far larger than the wavelength, the scalar approximation is sufficiently accurate. However, it will exhibit imperfections for regions with small periods. The FDTD simulation is introduced for rigorous calculations, and the flow is illustrated in Figure 2. First, the structure group is constructed according to the parametric grating model. Periodicity is set as a boundary condition in the direction along which the gratings are arranged repeatedly. To calculate the electromagnetic field based on FDTD, the simulation region is discretized into spatial grids, and adjacent field components along any axis are separated by grid space steps of 1/2.
The iterative calculation process is similar to the leapfrog calculation of the time step [18]. The numerical value of the electromagnetic field at the current moment can be obtained using the results of the electromagnetic field at the previous moment. Moreover, the numerical solution for the temporal varying electric and magnetic fields can be obtained by completing the calculation using this process for the entire space domain at each moment. Finally, analysis groups were established to calculate the transmission efficiency and phase based on the above calculations. Following this approach, the output results ηm and ψm for different orders m were obtained.

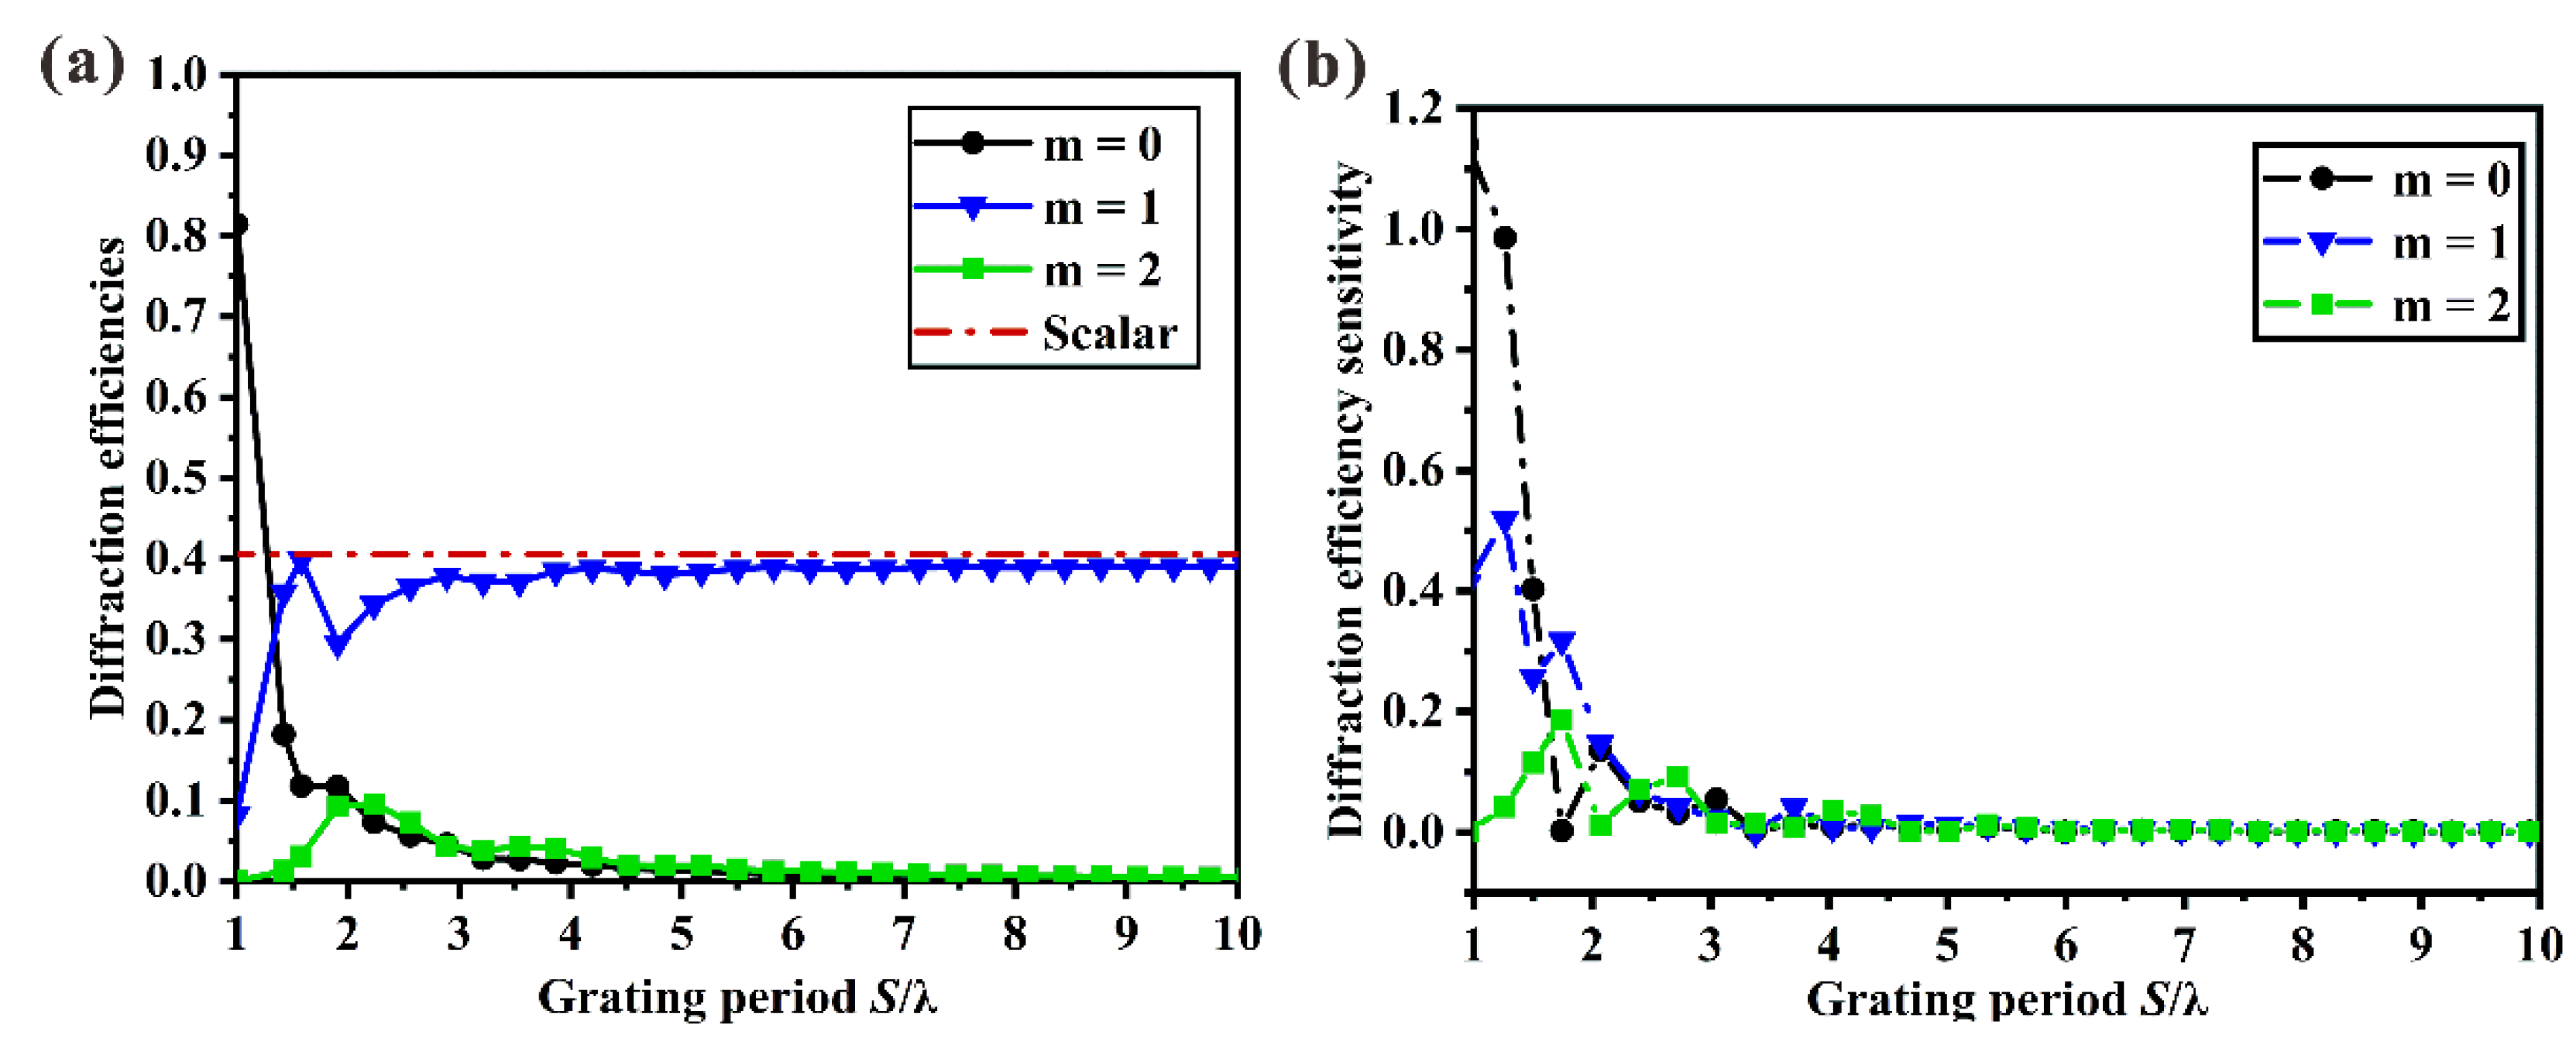
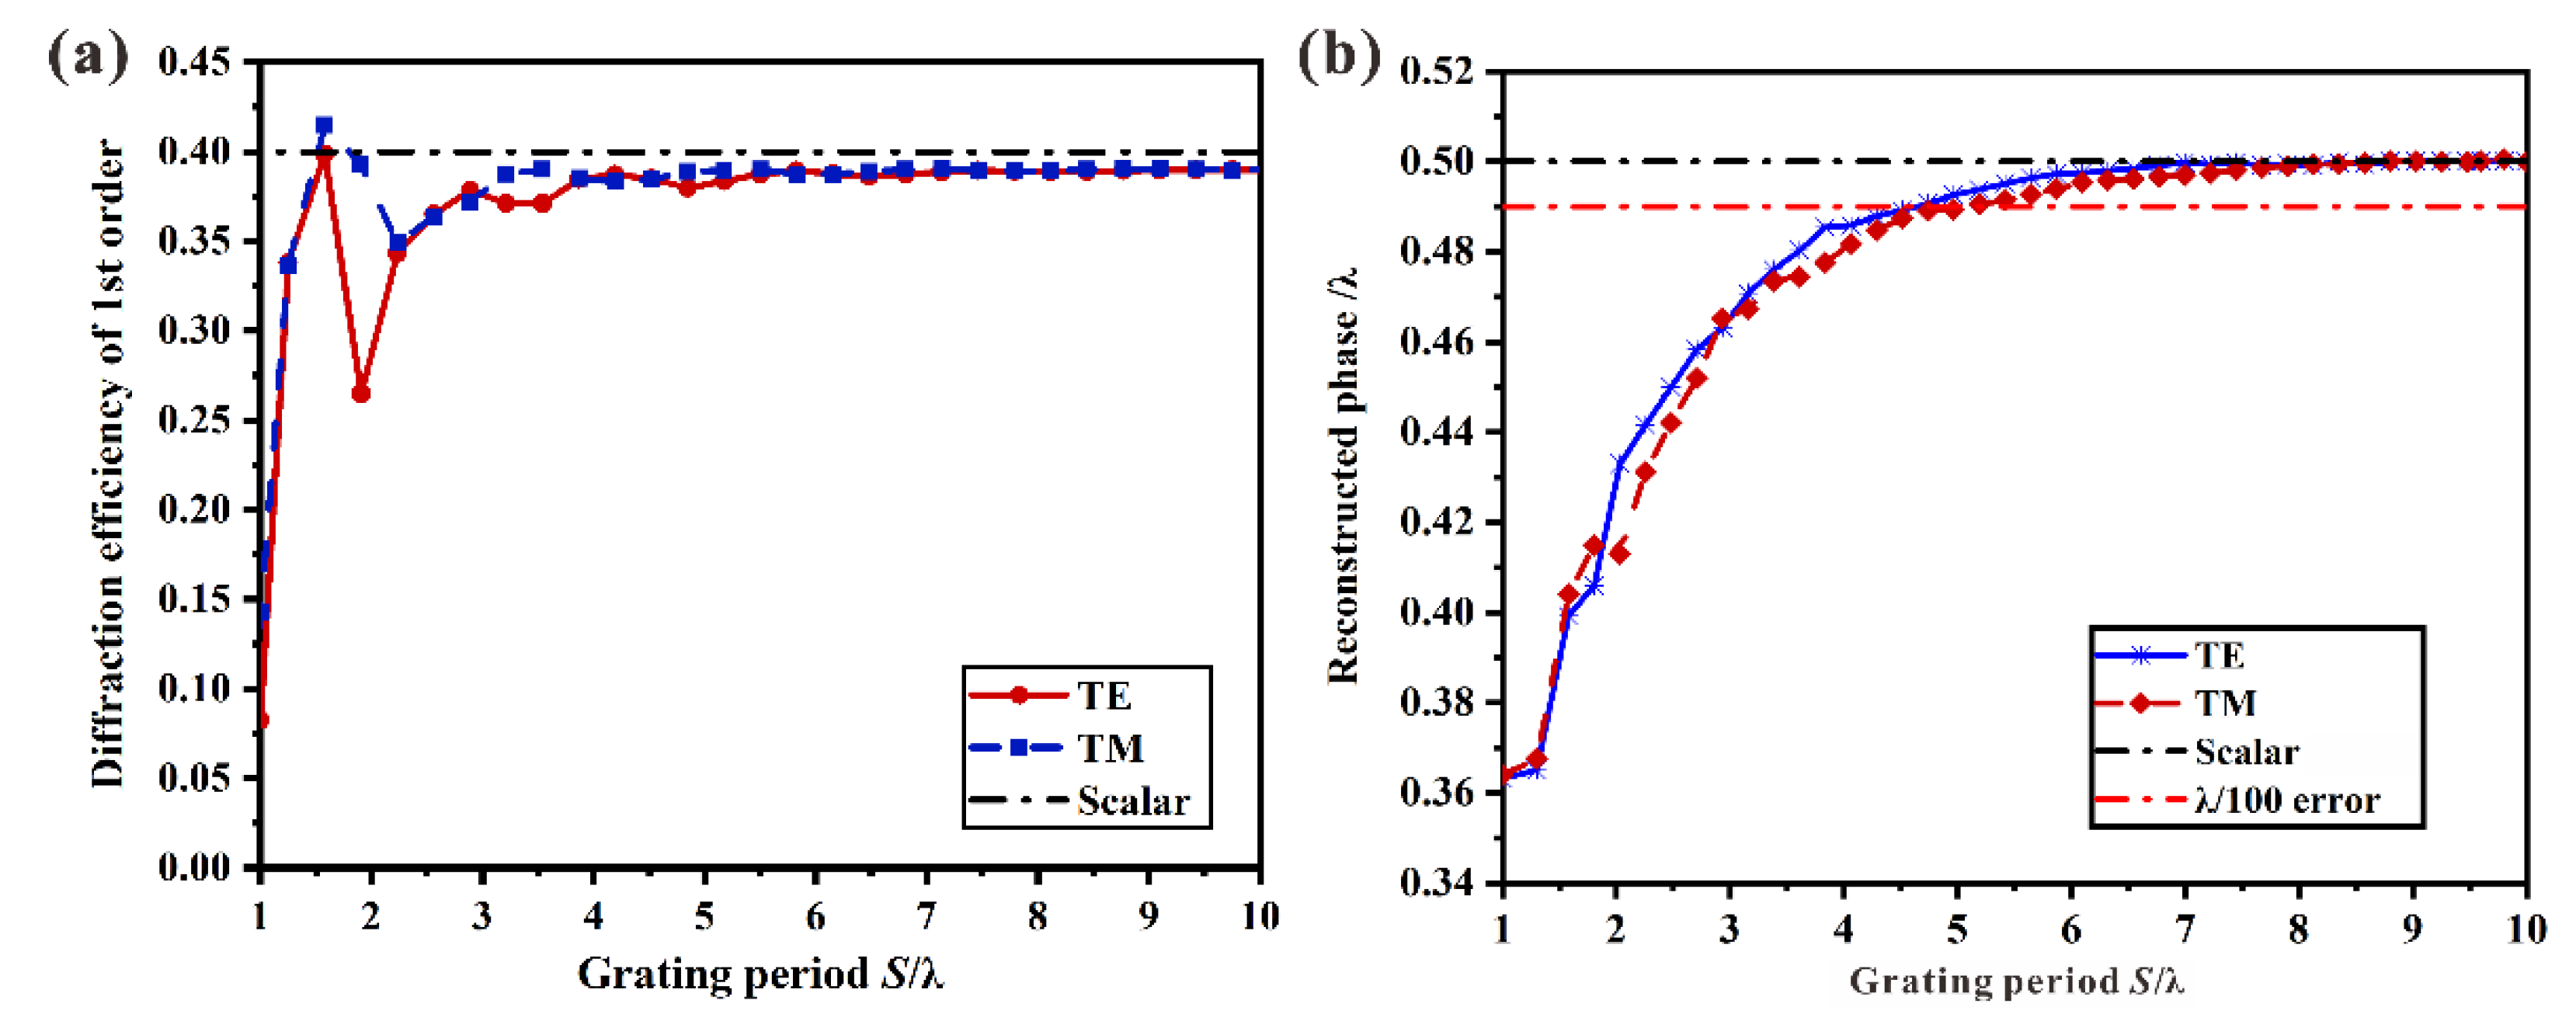
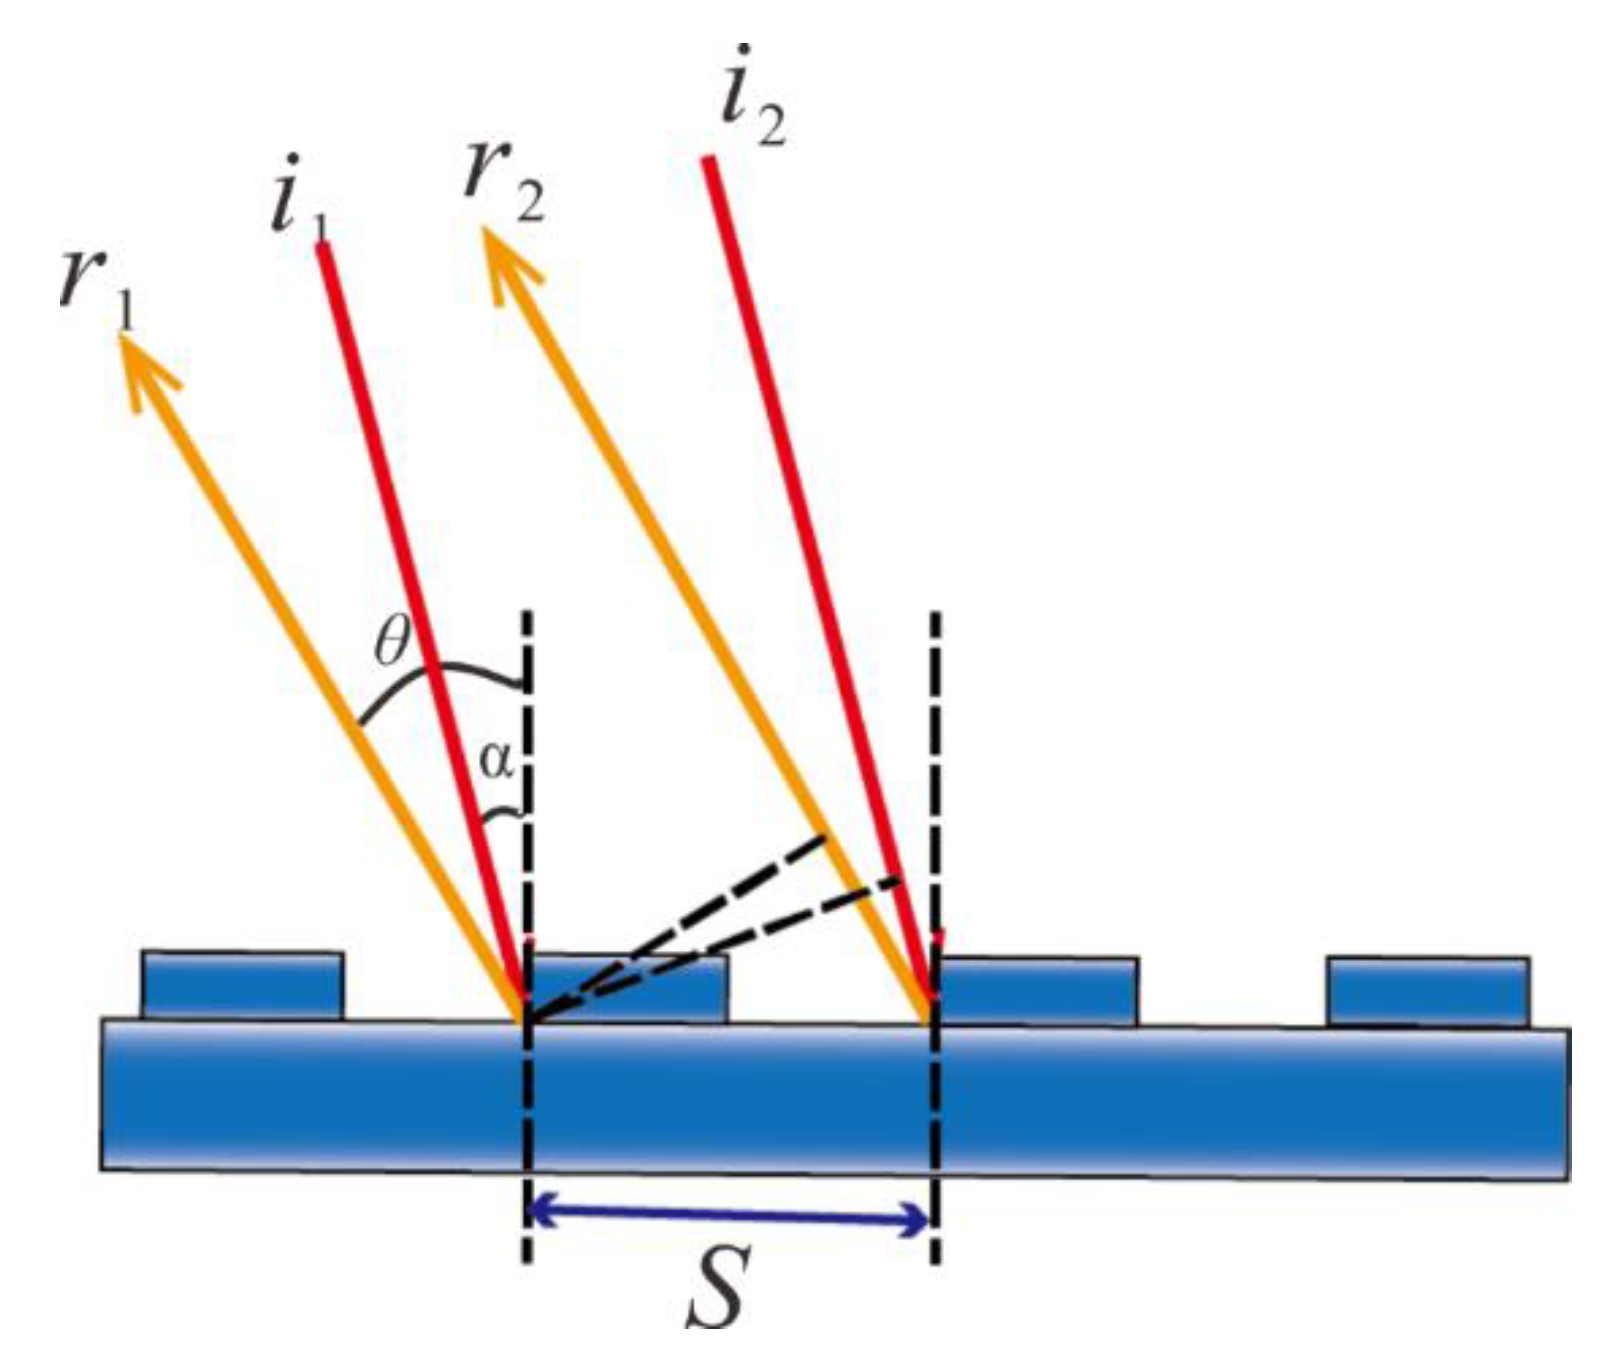
3. Imperfections of Scalar Approximation

3.1. Threshold Value

In DOCs, diffraction efficiencies are the most important reference data for fitting the parametric model to obtain local geometric parameters. Deviations in the intensity distribution directly affect the accuracy of the reconstructed surface relief. To compare the diffraction efficiencies, calculations were conducted for different order transmission gratings with duty cycles D of 0.5. The transmitted light becomes evanescent when the grating period is less than the incident wavelength, thus the interval from λ to 10λ was discussed.
As shown in Figure 3a, the scalar results were similar to the rigorous values when the period was larger than 4λ. However, the scalar approximation was inaccurate when the period of the CGH was less than 4λ, and the deviation increased as the period decreased. As shown in Figure 3b, the diffraction efficiency was more sensitive to smaller period gratings.
In addition to the diffraction efficiency, the deviation in the transverse electric (TE) and transverse magnetic (TM) polarization calculation results is also different. Polarization must be considered in rigorous calculations, but it is completely ignored in scalar approximations. The calculated results for the first-order diffraction efficiency and phase variance with the grating period subject to TE and TM polarizations are shown in Figure 4. There is a sudden and significant change when the period is approximately equal to 2λ. This is a typical phenomenon caused by the redistribution of energy induced by the abrupt change in the electromagnetic field.
In Figure 4b, the reconstructed phases subject to TE and TM polarizations are consistent. When the grating period approaches 5λ, the phase deviation between the approximation and rigorous results reaches 1/100λ. In terms of the application of CGHs, the phase accuracy requirement is stricter than the diffraction efficiency. Therefore, the validity of the scalar approximation must be reconsidered when the grating period is less than 3 μm (~5λ).

3.2. Phase Sensitivity

Another notable imperfection of the scalar approximation for DOCs is the analysis of phase sensitivity. According to Equation (5), the phase reconstructed by scalar approximation is independent of the duty cycle D and sidewall slope L. However, as shown in Figure 5, it is significantly different from the rigorous calculation results for gratings with small periods. The depth of the grating corresponds to a 0.5 wavefront phase change in the simulation. As shown in Figure 5a, the reconstructed phase of the first order is a function of the period and duty cycle. The smaller the grating period, the more sensitive it is to the phase deviation caused by the duty cycle variation. The deviation between the scalar and rigorous phases was set to 1/100λ as a reference, and the range where the deviation meets the requirement decreased rapidly with decreasing periods.
The reconstructed phase of the gratings with sidewall slope errors was also calculated by rigorous simulation, as shown in Figure 5b. The sensitivity of the phase error to the sidewall slope was still dependent on the grating period. Compared with the duty cycle error, the phase deviation caused by the sidewall slope was not obvious, and the fluctuation was globally controlled within 1/100λ for periods greater than 1 μm. Therefore, the phase error caused by the sidewall slope can be ignored.

3.3. Reconstruction Errors

In the above analysis, the scalar approximation has obvious imperfections in the diffraction efficiencies and phase sensitivity when the grating period is less than 5λ. These imperfections lead to errors in the geometric reconstruction of the etching depth and duty cycle of the DOC. Hence, these errors for 2, 4, and 6 μm gratings were analyzed.
For geometric parameter reconstruction by the DOC, several data libraries of diffraction efficiencies were established based on rigorous calculations. Using the rigorous simulation method FDTD, the diffraction efficiencies of different orders ηrig,i were obtained for various duty cycles and etching depths. With the use of Equation (4), the scalar approximation data ηscalar,i were calculated, and the diffraction orders from 0 to 7 were selected for geometric parameter reconstruction. The data libraries were searched for the minimum difference between ηrig and ηscalar, which corresponds to the duty cycle D and etching depth h, according to the following principle:
min { i = 1 7 | η r i g , i ( D , h ) η s c a l a r , i ( D 0 , h 0 ) | }
where
Δ D = D D 0   and   Δ h = h h 0
As the period decreased, the deviations in the geometric parameters reconstructions obtained via scalar approximation and rigorous calculation increased. The reconstruction errors were 0.105 for duty cycle and 180 nm for etching depth with 2 μm period gratings. These deviations in the CGH measurement are unacceptable. For the duty cycle error in Figure 6a–c, the obvious reconstruction errors are concentrated in regions where the depth is large. The areas with obvious depth error distributions are concentrated at the two extremes of the small duty cycle in Figure 6d–f. Even though the reconstruction errors decrease as the period increases, the maximum depth error reaches 53 nm, even for a period of 6 μm. In DOCs, geometric errors in the surface relief reconstruction lead directly to the accuracy evaluation for the reference wavefront of a CGH. Thus, it affects the testing and machining accuracy of the aspheric mirrors.
Based on the above analysis, the deviation of the wavefront caused by reconstruction geometric errors due to the imperfections of scalar approximation in DOC was analyzed. The deviation is given by the absolute phase difference Δ ψ between the ideal grating and the grating with variations in geometric parameters such as the duty cycle and etching depth. The wavefront deviation can be expressed as follows:
Δ W e r r o r = Δ ψ 2 π
Duty cycle errors within 10% and depth errors within 100 nm were introduced to the 2, 4, and 6 μm gratings. As shown in Figure 7a–c, the wavefront deviation caused by duty cycle errors was more sensitive to small-period gratings. A 10% duty cycle error in the 2 μm-period produced a wavefront deviation of 0.009λ. When the period was greater than 3 μm, the deviation caused by the duty cycle error was less than 0.005λ. Compared with the duty cycle, the depth error was the primary factor that affected the reference wavefront of the CGH. When the reconstruction depth error exceeds approximately 30 nm, the wavefront deviation is as high as 0.01λ even if the period is greater than 3 μm in Figure 7d–f. These results are vital for quality control during the DOC measurements. Therefore, it is necessary to pay attention to the imperfections of scalar approximation for CGH with small-period structures.

4. Experimental Verification and Discussion

To verify the imperfections of scalar approximation, two gratings with periods of 2 and 4 μm were measured and compared experimentally. The design parameters included a duty cycle of 0.5 and an etching depth of 400 nm. They were manufactured using laser direct writing and scanning ion beam etching [19].

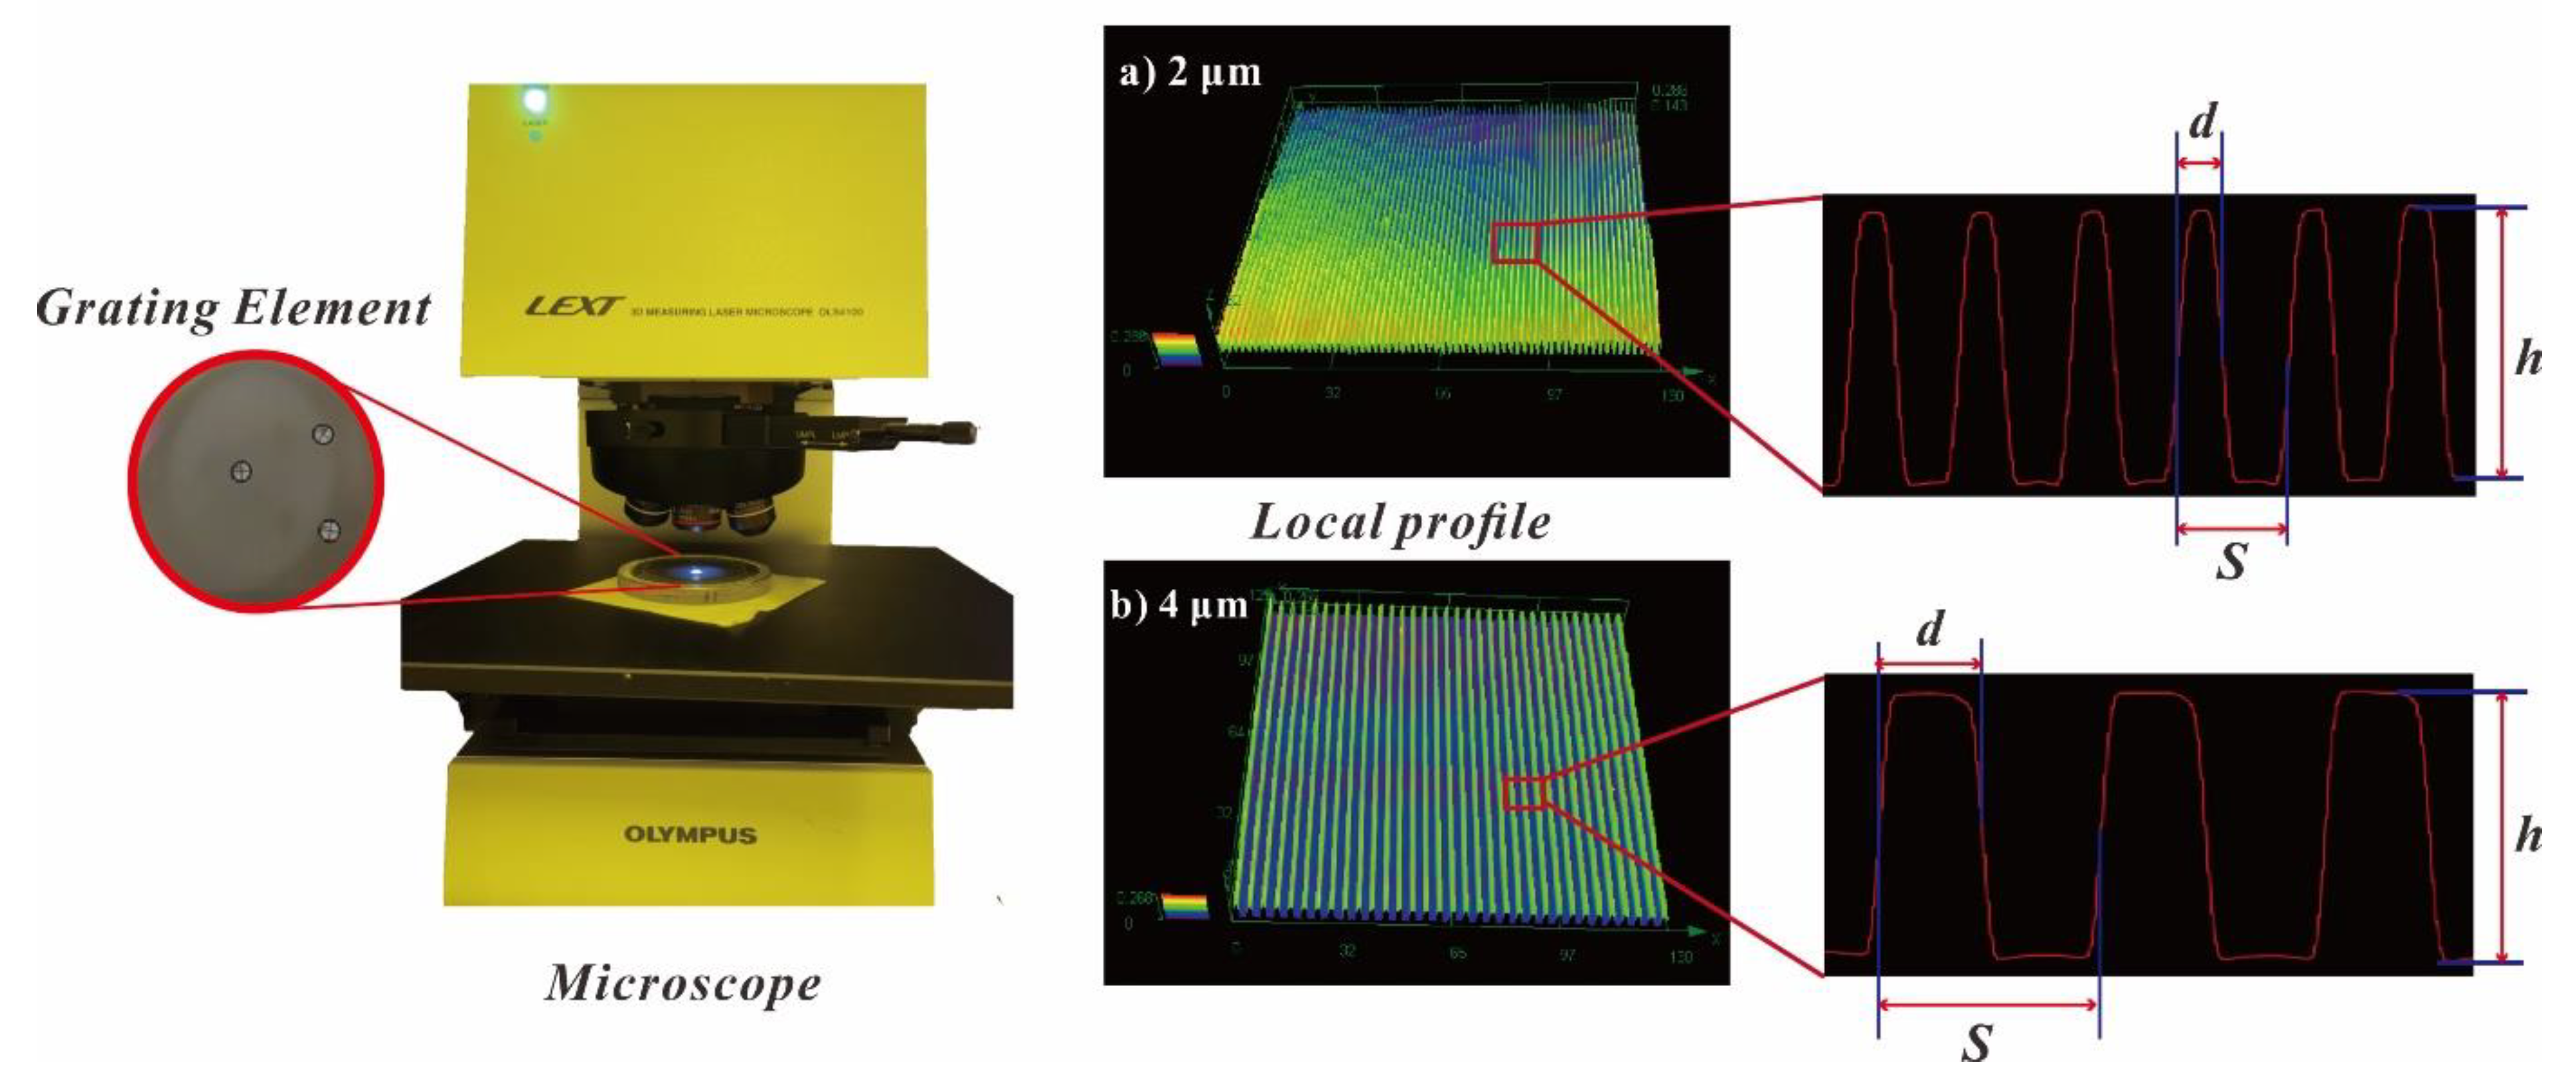
4.1. Profile Consistency of Gratings

Ten sample points of two experimental gratings were respectively measured to examine the profile consistency. A confocal microscope (OLS 4100, Olympus, Japan) with the objective lens MPLAPON100XLTEX was used to observe and measure the geometric parameters. The local profiles of the two gratings are shown in Figure 8 and the measurement data are listed in Table 1. Meanwhile, the average (AVG) and standard deviation (STD) of measurement data were calculated. For linear gratings, the duty cycle D and etching depth h were the main sources of fabrication errors. The linewidth d was measured using the midpoint of the ridge as the reference.
According to the measurement data in Table 1, the etching depth is the main source of fabrication errors, and the depth errors of two gratings are all approximately equal to 10 nm. As for the duty cycle errors, the consistency of the 4 μm grating is better than that of the 2 μm grating. However, the duty cycle errors can be ignored in scalar approximation. Therefore, the evaluation results of the two grating wavefronts are almost the same based on scalar approximation.

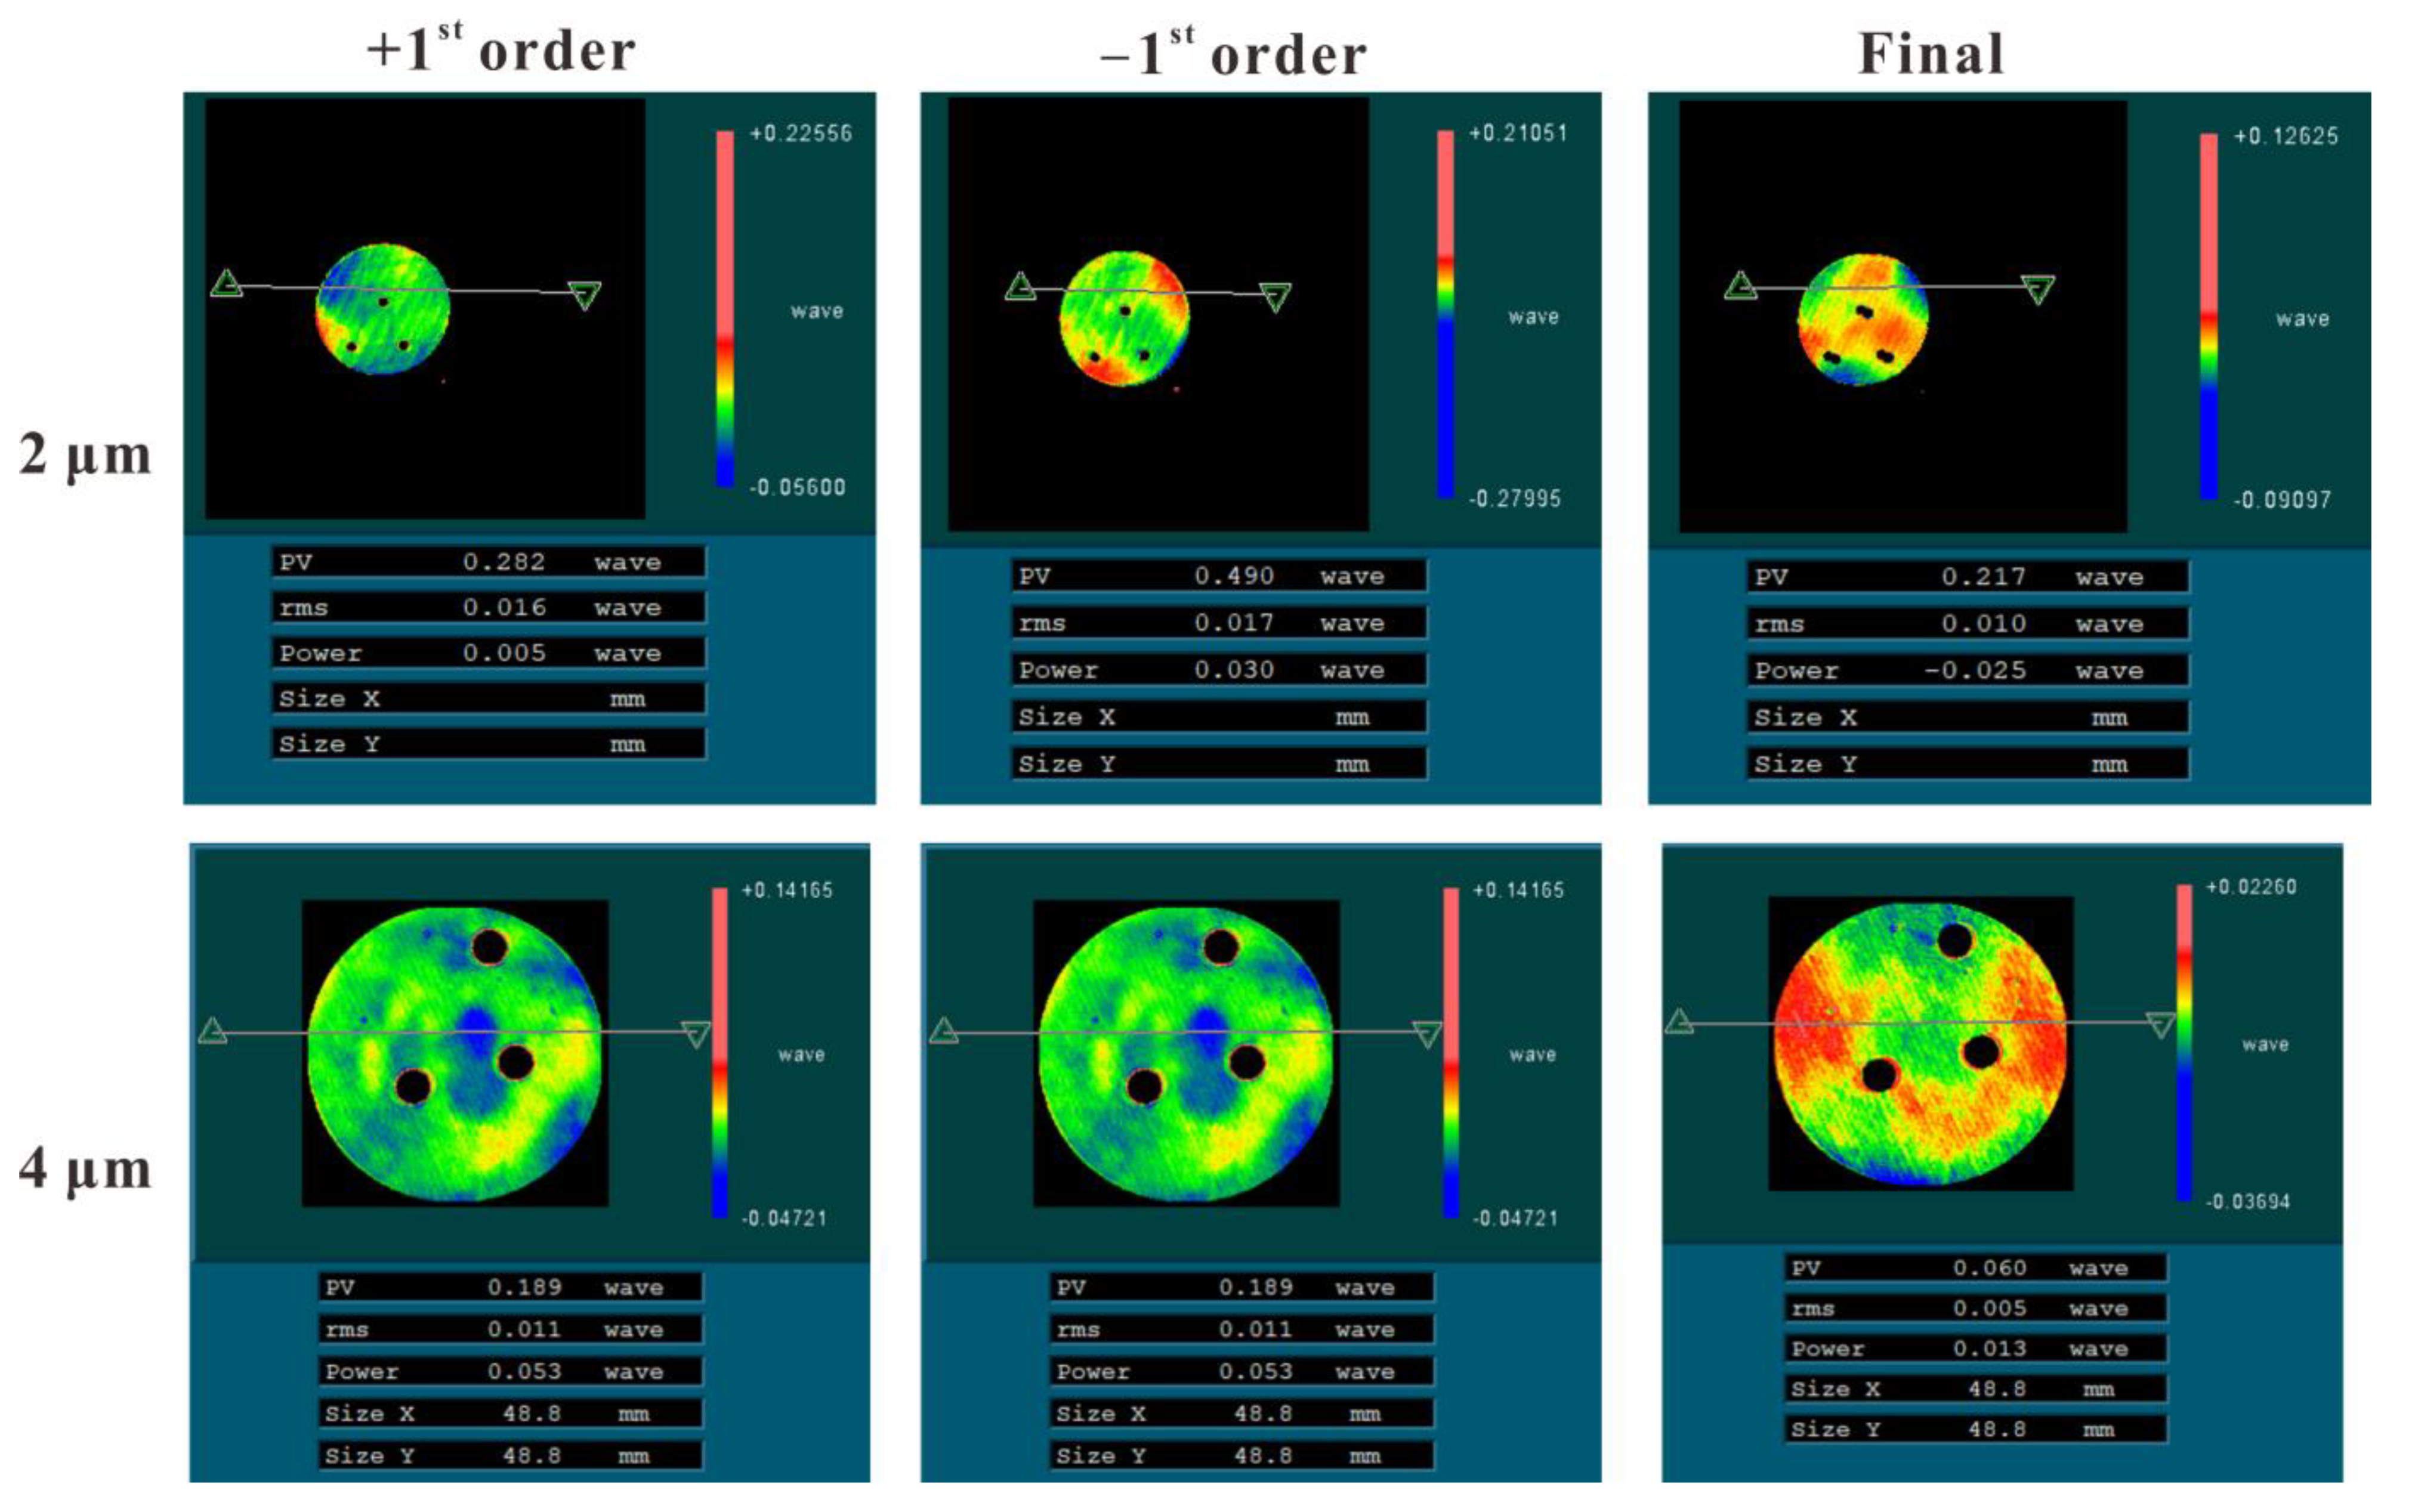
4.2. Wavefront Aberrations Evaluation

To specify the errors of the gratings, an absolute interferometric test method based on a Fizeau interferometer was introduced. The He–Ne laser was operated at a wavelength of 632.8 nm in the interferometer. The gratings were measured in reflection as shown in Figure 9, where the incident angle α and diffraction angle   θ conform to:
S ( sin α + sin θ ) = m λ
If α is equal to θ , the tested grating and interferometer would be collimated, and the incident wave diffracted back along the same optical path. The incident angle α of the plane wave satisfies the following equation:
α = arcsin ( m λ 2 S )
The light path for testing realized self-collimation. As shown in Figure 10, the wavefronts of the +1st (W+1) and −1st (W−1) diffracted orders were measured to determine the effects of fabrication errors.
The direct measurement interferometry W+1 or W1 contained aberrations from the interferometer system Winf, the substrate surface figure error Wsub, and the fabrication error of elements Wfab. Thus, the wavefront of tests W+1 and W1 can be respectively expressed by the following two equations:
W + 1 = W i n f + W s u b + W f a b + 1
and,
W 1 = W i n f + W s u b + W f a b 1
When the wavefront was generated in the −1st diffracted order, the aberration of the fabrication errors was complementary to the +1st diffracted order. That is, as follows:
W f a b 1 = W f a b + 1
Thus, the aberrations in W i n f and W s u b could be eliminated by subtracting Equation (12) from Equation (11), and the effect of the fabrication errors was obtained as follows:
W f a b + 1 = 1 2 ( W + 1 W 1 )
Based on this absolute testing method, the wavefront quality evaluation of the two gratings was executed. The test results were recorded in Table 2. As shown in Figure 11, the wavefront aberration of the 4 μm grating had a RMS value of 0.005λ, while that of the 2 μm grating had a RMS value of 0.01λ. The wavefront of small period grating appears more sensitive to fabrication errors.
The wavefront aberrations of two gratings are distinguished, but the scalar approximation indicates that the wavefront aberrations are almost the same. Therefore, experimental results show the inaccuracy of scalar approximation in measuring CGHs with small periods, and the imperfections cannot be ignored.
Conversely, the wavefront aberrations caused by duty cycle errors, which are not considered in scalar approximation, cannot be ignored according to our rigorous analysis in Section 3. The aberration of the 2 μm grating in Figure 11 is more serious than that of the 4 μm grating and proves the imperfections of scalar approximation for structures with small periods.
Scalar approximation fails to accurately describe and evaluate CGHs with small periods in optical testing due to the imperfections. If the rigorous methods can be promoted and developed, the reconstruction accuracy of CGH can be greatly improved. However, it is difficult to design CGHs with rigorous vector method today due to the complex description of light propagation and lack of no effective vector optimization methods. Based on the latest research results [20], we are now developing a more effective and flexible method to design perfect CGHs to solve the limitations of imperfections.

5. Conclusions

This study explored the imperfections of scalar approximation for diffractive optics calibrators in calibration of computer-generated holograms. The findings are summarized as follows:
(1)
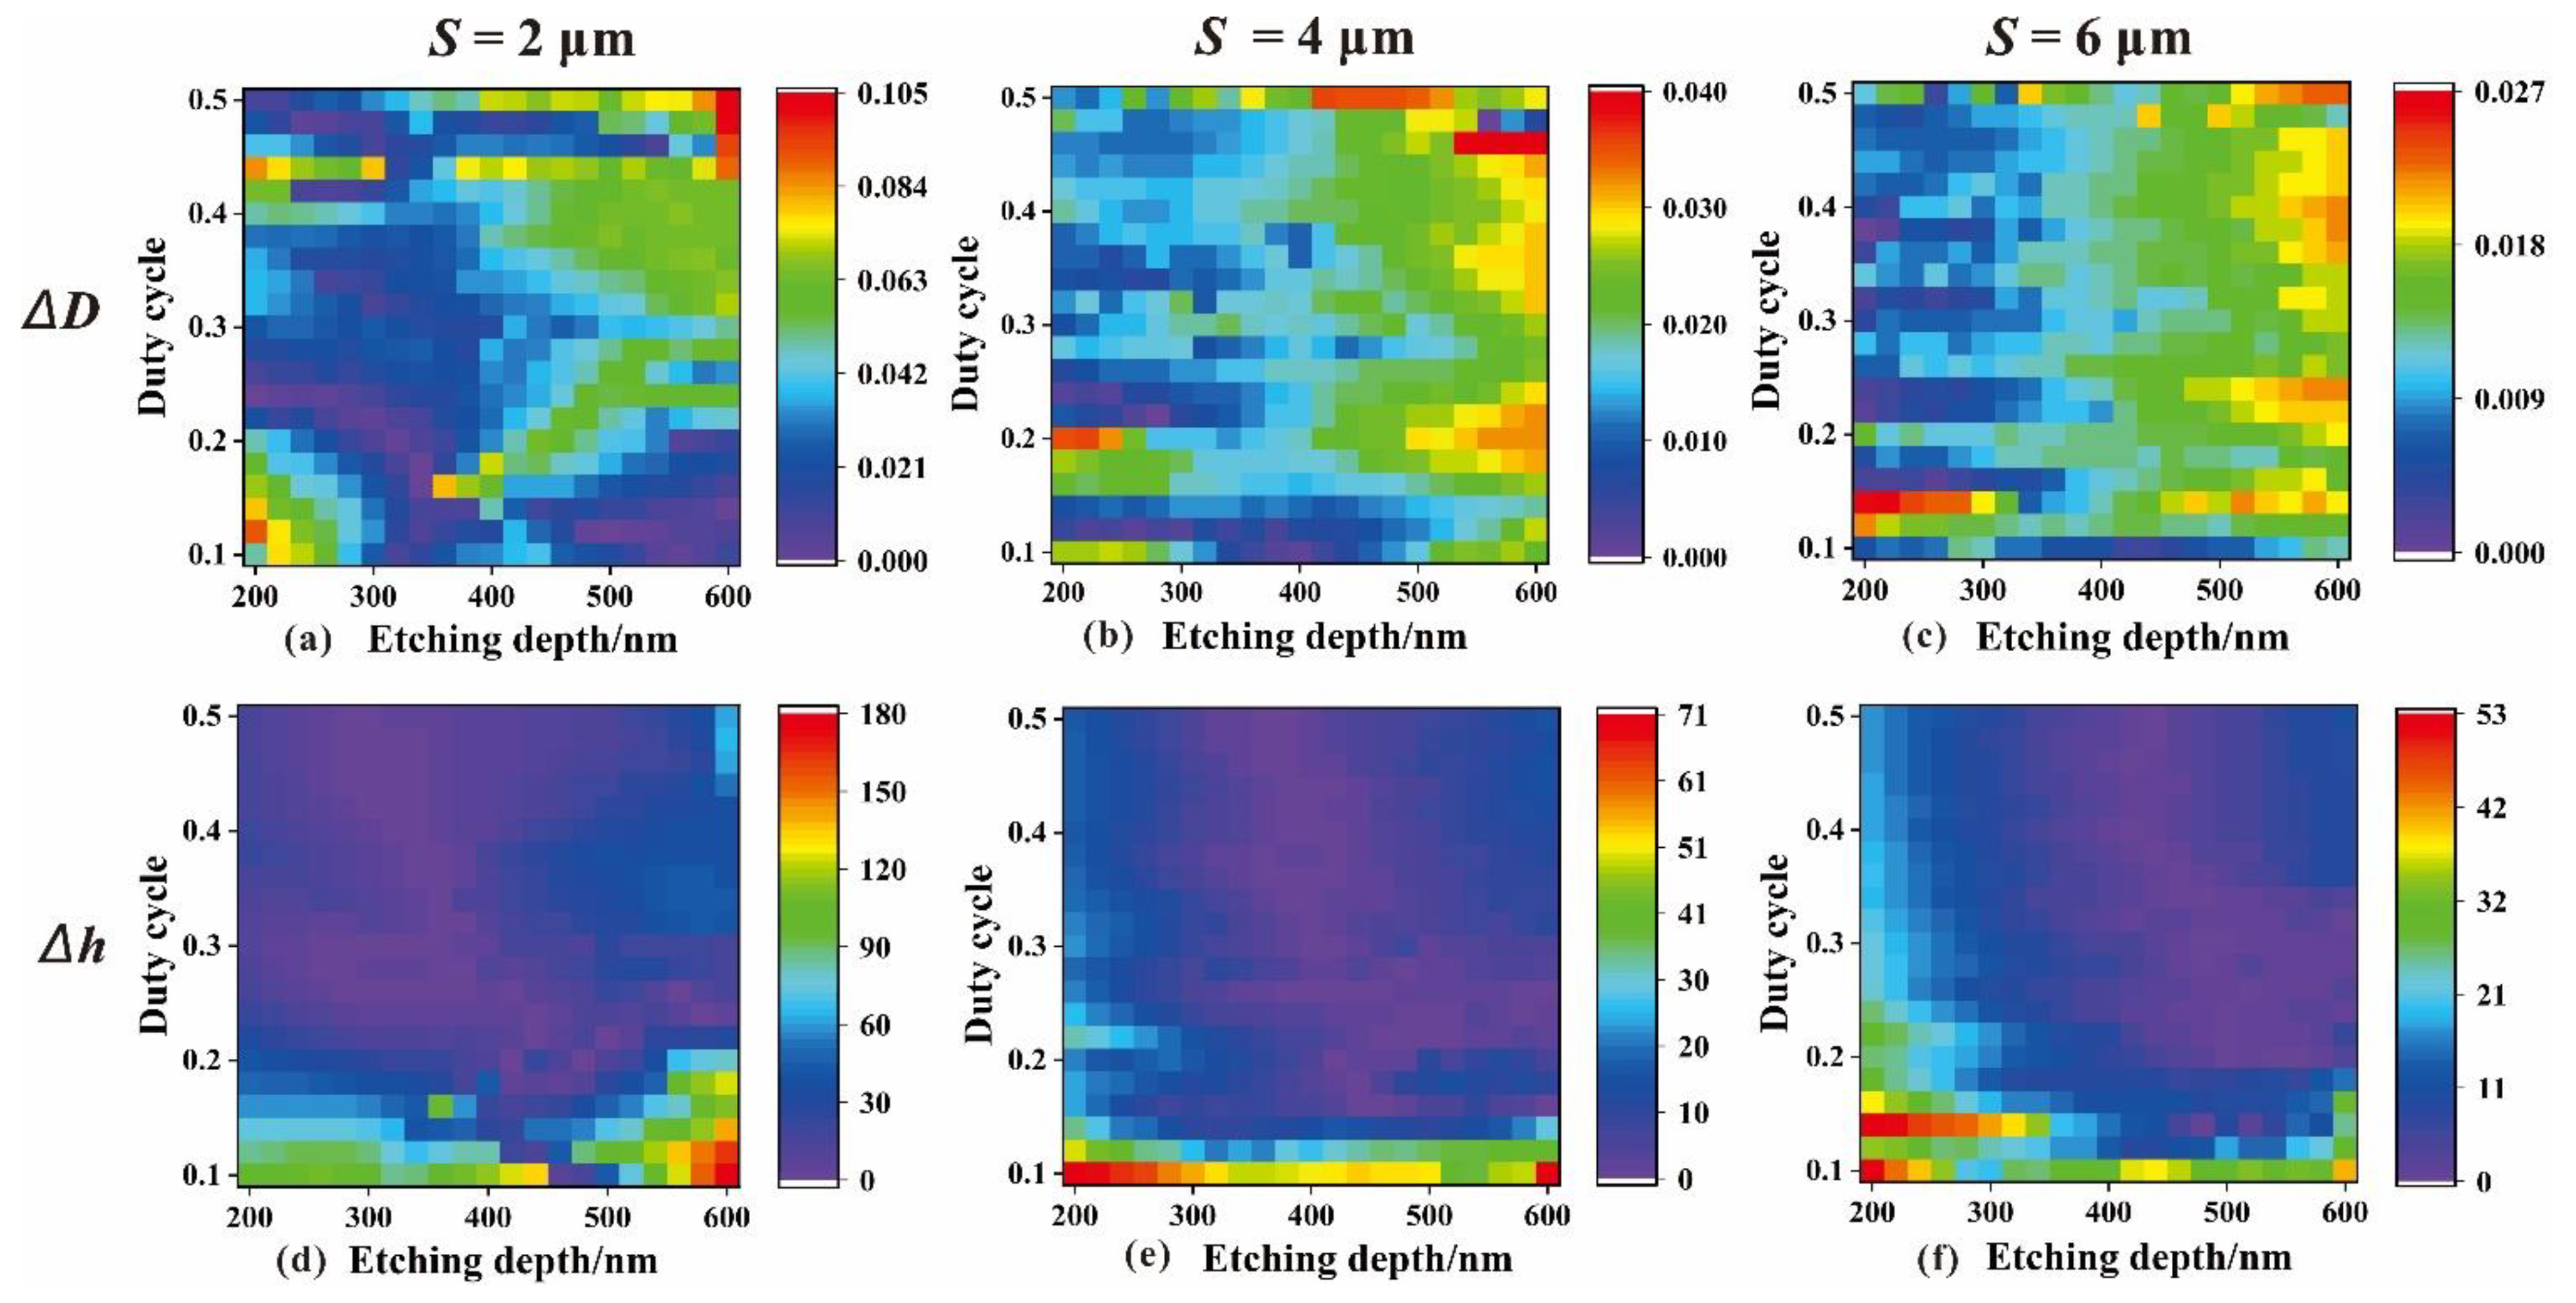
When the grating period is less than 5λ, the scalar approximation fails to accurately describe the characteristics of CGH by diffractive optics calibrators.
(2)
Reconstruction geometric errors are concentrated in cases in which the period is small and the depth is large. For example, a 10% error for the duty cycle and a 180 nm error for the depth are introduced owing to the imperfections of scalar approximation in the 2 μm grating case.
(3)
Wavefront aberration is more sensitive to fabrication errors in small-period regions of a CGH, and the effect of the duty cycle error on the wavefront cannot be ignored.
In future, the developing method for CGHs with small periods to solve the imperfections of scalar approximation will be presented in another article.

Author Contributions

Performing conceptualization, investigation, experimental methodology and drafting the original manuscript, Y.B.; supervision, funding acquisition, writing—review & editing, Z.Z.; guiding the research conducted, treatment of the experimental data, R.W. and T.C.; resources, funding acquisition, X.W.; resources and project administration, X.Z. All authors have read and agreed to the published version of the manuscript.

Funding

This work was supported by the National Nature Science Foundation of China (Nos. 51775531, 11803037). This work was partially supported by the Advanced Science Key Research Project, Chinese Academy of Science (No. QYZDJ-SSW-JSC038), Key Foreign Cooperation Projects of International Cooperation Bureau, Chinese Academy of Science (181722KYSB20180015).

Institutional Review Board Statement

Not applicable.

Informed Consent Statement

Not applicable.

Data Availability Statement

Not applicable.

Conflicts of Interest

The authors declare that they have no conflicts of interest.

References

  1. Wu, Y.; Wang, L.; Yu, J.; Yu, B.; Jin, C. Design method for off-axis aspheric reflective optical system with extremely low aberration and large field of view. Appl. Opt. 2020, 59, 10185–10193. [Google Scholar] [CrossRef] [PubMed]
  2. Ge, Z.; Congcong, C.; Binchao, D.; Qi, C.; Jianxun, B. Fabricating of Φ4m CIOMP-SiC mirror blank. In Proceedings of the 9th International Symposium on Advanced Optical Manufacturing and Testing Technologies: Large Mirrors and Telescopes. International Society for Optics and Photonics, Chengdu, China, 26–28 June 2018. [Google Scholar] [CrossRef]
  3. Bai, Y.; Li, L.; Xue, D.; Zhang, X. Rapid fabrication of a silicon modification layer on silicon carbide substrate. Appl. Opt. 2016, 55, 5814–5820. [Google Scholar] [CrossRef]
  4. Malacara, D. Optical Shop Testing, 3rd ed.; John Wiley & Sons: Hoboken, NJ, USA, 2007. [Google Scholar]
  5. Mohammad, N.; Meem, M.; Shen, B.; Wang, P.; Menon, R. Broadband imaging with one planar diffractive lens. Sci. Rep. 2018, 8, 2799. [Google Scholar] [CrossRef] [Green Version]
  6. Sasa, B.; Mauro, P.; Holger, F.; Martin, D.; Chapman, H.N.; Morgan, A.J. X-ray focusing with efficient high-NA multilayer Laue lenses. Light Sci. Appl. 2018, 7, 1–9. [Google Scholar] [CrossRef]
  7. Feng, W.; Zhiyu, Z.; Ruoqiu, W.; Xuefeng, Z.; Xu, Y.; Shiliang, L.; Feng, Z. Distortion measurement of optical system using phase diffractive beam splitter. Opt. Express 2019, 27, 29803–29816. [Google Scholar] [CrossRef]
  8. Peng, J.; Chen, X.; Zhang, X.; Fu, T.; Ren, J. Optimal design of tilt carrier frequency computer-generated holograms to measure aspherics. Appl. Opt. 2015, 54, 7433–7441. [Google Scholar] [CrossRef] [PubMed]
  9. Lin, H.; Chen, S.; Shuai, X. Characterization of the contribution of CGH fabrication error to measurement uncertainty in null test. In Proceedings of the AOPC 2017: Optoelectronics and Micro/Nano-Optics. International Society for Optics and Photonics, Beijing, China, 4–6 June 2017. [Google Scholar] [CrossRef]
  10. Gan, Z.; Peng, X.; Chen, S.; Guan, C. Evaluation of wavefront errors introduced by pattern distortion of computer-generated holograms. Optik 2019, 185, 699–706. [Google Scholar] [CrossRef]
  11. Cai, W.; Zhou, P.; Zhao, C.; Burge, J.H. Diffractive optics calibrator: Measurement of etching variations for binary computer-generated holograms. Appl. Opt. 2014, 53, 2477–2486. [Google Scholar] [CrossRef] [PubMed]
  12. Korolkov, V.P.; Konchenko, A.S.; Poleshchuk, A.G. Application of fiber spectrometers for etch depth measurement of binary computer-generated holograms. In Proceedings of the Application of fiber spectrometers for etch depth measurement of binary computer-generated hologram, Chengdu, China, 31 January 2013. [Google Scholar] [CrossRef]
  13. Korolkov, V.P.; Konchenko, A.S.; Cherkashin, V.V. Etch depth mapping of phase binary computer-generated holograms by means of specular spectroscopic scatterometry. Opt. Eng. 2013, 52, 72. [Google Scholar] [CrossRef]
  14. Cai, W.; Zhou, P.; Zhao, C.; Burge, J.H. Diffractive optics calibrator: Design and construction. Opt. Eng. 2013, 52, 124101. [Google Scholar] [CrossRef]
  15. Zhou, P.; Burge, J.H. Optimal design of computer-generated holograms to minimize sensitivity to fabrication errors. Opt. Express 2007, 15, 15410–15417. [Google Scholar] [CrossRef] [PubMed]
  16. Chang, Y.C.; Zhou, P.; Burge, J.H. Analysis of phase sensitivity for binary computer-generated holograms. Appl. Opt. 2006, 45, 4223–4234. [Google Scholar] [CrossRef] [PubMed]
  17. Stuerwald, S. Error compensation in computer generated hologram-based form testing of aspheres. Appl. Opt. 2014, 53, 8249–8255. [Google Scholar] [CrossRef] [PubMed]
  18. Changqing, W.; Xili, Z. Finite Difference Time Domain Method in Electromagnetic Field Calculation; Peking University Press: Beijing, China, 2014. [Google Scholar]
  19. Wang, R.; Zhang, Z.; Bai, Z.; Wang, Z.; Yin, X.; Kong, L.; Deng, W.; Xue, D.; Zhang, X. Scanning ion beam etching: A method for the fabrication of computer-generated hologram with nanometric accuracy for aspherical testing. Opt. Lasers Eng. 2021, 139, 106503. [Google Scholar] [CrossRef]
  20. Hu, Y.; Wang, Z.; Wang, X.; Ji, S.; Zhang, C.; Li, J.; Zhu, W.; Wu, D.; Chu, J. Efficient full-path optical calculation of scalar and vector diffraction using the Bluestein method. Light Sci. Appl. 2020, 9, 119. [Google Scholar] [CrossRef] [PubMed]
Figure 1. Cross-section of the binary linear grating model. Herein, S is the period, h is the etching depth, c is the project length of sidewall in the horizontal direction and d is the width of the grating ridge. The duty cycle D is defined as D = d/S and the sidewall slope ratio L is given by L = c/S. In addition, A0 and A1 correspond to the amplitude of the output wavefront from the unetched and etched areas of the grating, respectively. For a phase grating made of a material with refractive index n, the phase step ϕ is defined as 2π(n − 1)h/λ, where λ is the wavelength of incident light set to 632.8 nm.
Applsci 11 06897 g001
Figure 2. Process of rigorous simulations based on the finite-difference time-domain (FDTD) method. E and H denote the electric and magnetic fields, respectively.
Applsci 11 06897 g002
Figure 3. Comparison of the diffraction efficiency of scalar approximation and rigorous simulation for a binary grating with a duty cycle of 0.5. (a) Efficiencies of different orders (m = 0, m = 1, m = 2) and (b) sensitivity of the efficiencies of these orders with the respect to the period. The sensitivity function is defined as η m / S .
Applsci 11 06897 g003
Figure 4. Comparison of illumination in transverse electric (TE) and transverse magnetic (TM) polarized light for (a) diffraction efficiency and (b) phase generated by transmission grating with a variable period.
Applsci 11 06897 g004
Figure 5. Reconstructed phase based on scalar approximation and rigorous simulation for the grating model with (a) a variable duty cycle or (b) a variable sidewall slope ratio, for different periods subject to TE polarization.
Applsci 11 06897 g005
Figure 6. Reconstruction geometric errors for duty cycle D (0.1–0.5) and etching depth h (200–600 nm) with scalar approximation and rigorous calculations. (ac) and (df) indicate the duty cycle errors Δ D and etching depth errors Δ h in reconstruction for gratings with periods of 2, 4, or 6 μm, respectively. The step was set to 0.2 for the duty cycle D0 and 20 nm for the depth h0. The sampling of the search step was 0.001 for D and 1 nm for h in the rigorous simulation. The values of the color bars indicate the deviation in D and h (nm).
Applsci 11 06897 g006
Figure 7. Wavefront deviations caused by errors in the duty cycle (ac) or etching depth (df) from the geometric reconstruction of 2, 4, and 6 μm gratings. The duty cycle error was less than 10% and the depth error was less than 100 nm. The grating model had an etching depth of 400 nm and a duty cycle of 0.5.
Applsci 11 06897 g007
Figure 8. Parameter measurements for grating profiles observed with confocal microscopy. The lateral resolution of the confocal microscope was 0.12 μm and the vertical was 0.01 μm. S, d and h represents period, ridge width and etching depth of gratings, respectively. (a,b) are the local profiles of 2 μm and 4 μm gratings.
Applsci 11 06897 g008
Figure 9. Linear grating in the case of reflection.
Applsci 11 06897 g009
Figure 10. Schematics of the absolute test method for linear gratings. Optical configuration includes (a) normal incidence, (b) +1st diffracted wavefront and (c) −1st diffracted wavefront.
Applsci 11 06897 g010
Figure 11. Wavefront aberration of ±1 diffraction orders and final data for S = 2 and 4 μm grating elements caused by fabrication errors.
Applsci 11 06897 g011
Table 1. Measurement data for the gratings with periods of 2 and 4 μm.
PointsS = 2 μmS = 4 μm
S [μm]d [μm]h [nm]DS [μm]d [μm]h [nm]D
12.0320.9043900.44494.0641.8293920.4500
21.9050.8503890.44623.9371.7723900.4501
32.0320.9043880.44494.0641.8293930.4500
42.0320.9023900.44394.0641.8323910.4508
52.0320.9043910.44494.0641.8293910.4500
62.0320.9043890.44493.9371.7723900.4501
71.9050.8503890.44624.0641.8293920.4500
82.0320.9043900.44494.0641.8323920.4508
92.0320.9023900.44393.9371.7723910.4501
102.0320.9023880.44394.0641.8293930.4500
AVG2.0070.8933890.44484.0261.8123910.4502
STD0.0540.02210.00080.0610.02810.0003
Table 2. The RMS values of test results in Figure 11.
+1st Order/λ−1st Order/λFinal Result/λ
S = 2 μm0.0160.0170.010
S = 4 μm0.0110.0110.005
Publisher’s Note: MDPI stays neutral with regard to jurisdictional claims in published maps and institutional affiliations.

