Abstract
The most common index for diagnosing Sleep Apnea Syndrome (SAS) is the Apnea-Hypopnea Index (AHI), defined as the average count of apnea/hypopnea events per sleeping hour. Despite its broad use in automated systems for SAS severity estimation, researchers now focus on individual event time detection rather than the insufficient classification of the patient in SAS severity groups. Towards this direction, in this work, we aim at the detection of the exact time location of apnea/hypopnea events. We particularly examine the hypothesis of employing a standard Voice Activity Detection (VAD) algorithm to extract breathing segments during sleep and identify the respiratory events from severely altered breathing amplitude within the event. The algorithm, which is tested only in severe and moderate patients, is applied to recordings from a tracheal and an ambient microphone. It proves good sensitivity for apneas, reaching 81% and 70.4% for the two microphones, respectively, and moderate sensitivity to hypopneas—approx. 50% were identified. The algorithm also presents an adequate estimator of the Mean Apnea Duration index—defined as the average duration of the detected events—for patients with severe or moderate apnea, with mean error 1.7 s and 3.2 s for the two microphones, respectively.
1. Introduction
The Sleep Apnea Syndrome (SAS) is a breathing disorder that was recognized as a pathologic chronic condition in the late 70s [1]. It is now proven that this syndrome, characterized by frequent cessation or partial reduction of the breathing process [2,3], is linked to severe daytime fatigue [4,5], headaches, depression [5,6], and an increased risk of work and vehicle accidents [7,8,9]. In the long term, this syndrome is a strong risk factor for severe pathological conditions such as hypertension [10,11] and cardiovascular diseases [12].
The clinical gold standard for diagnosing apnea syndrome is polysomnography, a full-night, supervised sleep study that is performed in a laboratory and includes continuous monitoring of the respiratory, cardiac, and neurological activity of the body during sleep [13]. The most common index for quantifying the level of severity of the syndrome is the Apnea-Hypopnea Index (AHI), defined as the average count of apnea or hypopnea events per hour of sleep. An apneic event is defined as a severe reduction (more than 90%) in the airflow during respiration for at least 10 s while a hypopneic event is a partial reduction of the airflow (at least 30%) of the same minimum duration, provided related oxygen desaturation or arousal is present [2]. Despite its broad use, recent studies suggest that the AHI is considered rather insufficient in providing a clear view of the syndrome’s severity and the health state of the patient [14,15]. Due to the observed inter- and intra-night variation of the AHI [16], sleep scientists suggest employing additional indices reflecting the severity of the syndrome such as: the Oxygen Desaturation Index (ODI) [17]—defined as the number of events of blood oxygen drop greater than 4% per hour of sleep—the Respiratory Distress Index (RDI) [14]—defined as the combined number of apnea and hypopnea events along with the respiratory event-related arousals per sleeping hour—and the Mean Apnea Duration (MAD) index [18]—defined as the average duration of all apneic/hypopneic events. It is also highly recommended to focus on each specific apnea/hypopnea episode rather than their average count [14]. The exact time localization of apnea/hypopnea events during the night offers the capacity to study their specific characteristics, e.g., their duration. Indeed, recent studies suggest a correlation link between the MAD with hypertension and mortality rate, for patients suffering from severe or moderate apnea syndrome [18,19,20]. The MAD index, despite being extracted as the average over the entire set of apnea/hypopnea events, requires a precise detection of the onset and termination of each event.
The gold standard for apnea diagnosis—polysomnography (PSG)—is inconvenient for the patient while the cost for in-hospital examination of the syndrome renders remote diagnosis through accurate portable apnea detection systems imperative. Audio recording and particularly tracheal sound have been employed as a signal to detect SAS severity [21,22,23,24,25]. The recent advances in neural networks render them particularly attractive also in this field of application, providing promising results [26,27]. Specifically, Nakano et al. developed a deep neural network capable of detecting sleep apnea events from tracheal sound with a detection resolution of 15 s by employing more than 1800 patients reporting accuracy of more than 90% in classifying the AHI in the four main severity groups [26]. Research by Kim et al. based on machine learning techniques used 120 patients to classify the four severity groups with an accuracy of approx. 88%. In general, neural network approaches are highly dependent on the number of patients participating in the training and validation sets, while the reported accuracy is expected to be reduced when applied in the real-time processing of audio recordings. Additionally, the time detection of apnea/hypopnea events is rarely performed [26,28,29] with the developed diagnostic tools focusing mainly on the SAS severity estimation [21,27]. Particularly, Saha et al. [28] were the first to indicate the importance of detecting individual events and discussing the time detection accuracy to discriminate between false and true positive detections. They reported a mean error of approx. 5 s in individual events detection, however, they admitted the need for further investigation in the field due to restrictions related to small sample size (69 patients) and the use of additional sensing elements [28]. Alshaer et al. [29] also studied pattern recognition techniques to detect individual events rather than specific sound features for patient classification. However their study—employing only 50 patients—does not report on the time detection error of the episodes but only on the AHI reporting accuracy of ~88% [29]. Therefore, the field remains open in more approaches that could enrich our understanding of the sound features that are able to identify apneic or hypopneic events during sleep.
In this context and based on the new requirements for deeper study of the characteristics of diagnosed SAS, as described above, we developed a simple algorithm for apnea/hypopnea events detection in patients diagnosed with severe or moderate SAS. The proposed algorithm is based on breathing sound recordings solely, by making use of the annotated events according to the interpretation of polysomnographic data. More specifically, we employ breathing sound recordings from tracheal and ambient microphones during the entire night and we investigate the hypothesis of using standard voice activity detection (VAD) algorithms for identifying breathing sound during sleep. Breathing sound detection, performed by VAD algorithms can provide information on the time detection of apnea and hypopnea events [30]. The proposed algorithm profits from (a) a validation process relying on a multitudinous dataset of patients diagnosed with “severe” or “moderate” apnea syndrome, (b) increased sensitivity in the detection of apneic/hypopneic events, and (c) adequate accuracy in the detection of the MAD of a patient with severe or moderate SAS. Thus, although it cannot be used as a standalone process for SAS diagnosis, we envision the use of it for (a) further examination of the patients with SAS at home to improve the treatment they receive, as well as, (b) for deeper understanding of the breathing sound and its potential employment in apnea related applications, and (c) as part of automated systems for apnea scoring in a hospital, which take into consideration the sound characteristics of audio recordings from tracheal or ambient microphones.
2. Methods
2.1. Polysomnograms and Audio Data Collection and Storage
The presented study was based on the collection of polysomnographic data from 239 patients undergoing polysomnography (PSG) in the Sleep Study Unit of Sismanoglio General Hospital of Athens and diagnosed with “severe” or “moderate” SAS. In the supervised sleep study, the standard protocol for split PSG was followed [2]. According to this protocol, if a patient exhibits severe apnea within the first approx. 4 h of sleep, then the second part of the (typically 8-h long) PSG study is used for titration to the optimal pressure level that should be used by a continuous positive airway pressure (CPAP) device. Eventually, the second part of the PSG study was excluded from the herein proposed algorithmic process. All the PSG recorded signals, comprising an electrocardiogram, an electrooculogram, an electromyogram, a flow rate signal recorded through pressure and thermal sensors, the respiratory effort signals monitoring the thoracoabdominal movement, and a low-quality tracheal contact microphone were stored in EDF files through the PSG monitoring software “Sleepware G3”.
Along with the PSG system, a separate system of dual-channel audio recording was installed (Figure 1). A portable multitrack recorder (Tascam DR-680 MK II) was used to acquire and store audio signals from (a) a contact electret microphone (Clockaudio CTH100, 900 Ω input impedance) placed on the trachea of the patient and (b) an ambient, omnidirectional, condenser microphone (Behringer ECM8000, electret, 900 Ω input impedance) located approx. 1 m over the position of the patient’s head. The contact tracheal microphone exhibits a spectral response in the range of 350 Hz—8 kHz while the ambient microphone has a flat frequency response in the range of 15 Hz—20 kHz. The breathing sound signals by each one of these microphones were sampled at 48 kHz and were stored in dual-channel uncompressed WAV files. The maximum time length of each WAV file was approx. 2 h and the entire night recording was stored in consecutive files of the same duration.
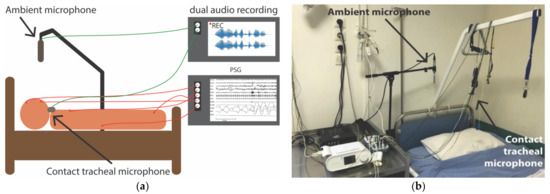
Figure 1.
Setup of polysomnography records and dual audio recordings: (a) Schematic indicating the signals acquisition; (b) Photograph of the room of sleep study unit where the position of the ambient microphone can be observed.
The data collection process was in full compliance with the European regulations for personal data protection [31]. The local ethics committee of Sismanoglio General Hospital of Athens approved the described data acquisition process, provided signed consent was given by the participating subjects. The patients participating in this study were asked to provide signed consent for the use of the recordings—both PSG and audio—during their sleep study, provided the removal of any data that might lead to their identification. All relevant information was removed by the clinical staff prior to any processing of the data for the purposes of this research study.
2.2. Data Annotation and Medical Diagnosis
The medical characterization of the PSG recordings was performed by the clinical team of the Sleep Study Unit of Sismanoglio General Hospital of Athens. The respiratory events and sleep stages labeling followed the standard protocol for Sleep Apnea Diagnosis [2]. The respiratory episodes related to this research study included apnea and hypopnea events: Apneas are defined as events of at least 10 s duration (3 respiratory cycles) with a severe reduction in the airflow (more than 90%), while hypopneas are defined as events of the same duration that are characterized by a moderate (at least 30%) reduction in the airflow, provided the event is associated with a relative oxygen desaturation drop of at least 3% or with arousal [2]. Further categorization of apneic events includes their characterization as “central”—in which no respiratory effort is present—, “obstructive”—in which respiratory effort is present during the entire event—, or “mixed” apnea, involving characteristics of both previous categories. According to the latest update of the Sleep Apnea Syndrome annotation protocol, hypopneas should not be accompanied by further subcategorization and are considered obstructive hypopneas.
The identification and classification of respiratory events lead to the extraction of the total count of apnea/hypopnea events per sleeping hour. This value defined as the AHI is the most frequently used for the extraction of a final diagnosis of sleep apnea syndrome, by characterizing the patient in one of the following classes: non-apnea (AHI < 5 episodes/h), mild apnea (5 episodes/h ≤ AHI < 15 episodes/hour), moderate apnea (15 episodes/h ≤ AHI < 30 episodes/hour), severe apnea (AHI ≥ 30 episodes/h). In this study, we kept and examined only the patients that suffered from severe or moderate SAS.
The acquired data and the annotations of sleep stages and apnea events are publicly available [32]. The online dataset is part of an ongoing research project, thus, further expansion is expected in the following months/years.
2.3. Audio Recordings Synchronization with PSG Channels
The PSG and the audio recording systems were activated manually by the specialist supervising each PSG study, within a time difference of a few seconds. Precise calculation of the time delay in order to transfer the information of time occurrence of apnea events in the audio recordings was imperative. The synchronization was performed by the use of the low-quality contact microphone incorporated in the PSG system. This second contact microphone, recording tracheal sound through the entire night, had a sampling frequency of 500 Hz, which was too low to be able to provide high-quality breathing sound recording. The synchronization algorithm was applied to signal excerpts of a total length of 20 min and it included the steps described here: (a) Filtering and downsampling of the high-quality contact microphone so that the two sensors had a common sampling rate of 500 Hz. (b) Envelope extraction of the two signals based on Hilbert transformation. (c) Extraction of the cross-correlation of the two signal envelopes, and (d) Determination of the time point of maximum cross-correlation, which gave the time delay between the acquired signals. The accuracy of the time delay determination was important to assure optimum validation of any system for apnea/hypopnea events detection. Thus, manual observation of all signals was performed to verify that the maximum error in the time delay did not exceed 2 s.
2.4. Audio Signal Processing for the Detection of Breathing and the Extraction of Apnea/ Hypopnea Events
The rationale of our proposed methodology was based on the following assumptions: (a) a VAD is capable of detecting breathing sounds as well (an assumption that has already been made before, e.g., [30], but is also supported by the findings reported herein) (b) the detection of breathing sounds (or their absence, for the subject matter) can be used to infer episodes of breathing that has completely stopped or has severely altered, and (c) completely stopped or severely altered breathing corresponds to apneic or hypopneic episodes, respectively.
The proposed algorithm was designed for application in real-time processing of audio recordings but its use was herein emulated with stored WAV files with a maximum duration of approx. 2 h each. A window length of 0.1 s and an equal slide step (i.e., no overlap) were used to parse each stored WAV file. For each window, the probability of breathing was calculated using a statistical model-based VAD that was efficient in low signal-to-noise environments [33]. Particular emphasis was paid to estimating the noise power spectral density [34] by extracting the power spectral density in all frequency bands, as described in [34]. Then, the noise variance was used to estimate the posterior signal-to-noise ratio (SNR)—defined as the power of the observed noise signal to the noise power—and the prior SNR—defined as the power of the clean signal to the noise power—according to the minimum mean-square error (MMSE) short-time spectral amplitude estimator [35]. A block diagram of our proposed algorithm is depicted in Figure 2 Hidden Markov Model.
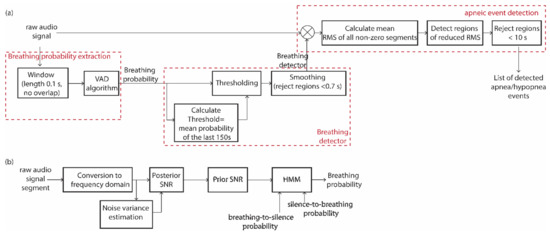
Figure 2.
(a) Block diagram of the audio signal processing for the extraction of the list of detected apnea events from raw audio recordings. It comprises: (i) the breathing probability extraction algorithm, (ii) the conversion of the breathing probability to a breathing detector, and (iii) the detection of apneic events based on the raw audio signal and the breathing detector. (b) Block diagram of the VAD algorithm that is analytically described in [33,34,35].
Next, we calculated the breathing probability within each frame using a hidden Markov model (HMM) that relies on the a priori breathing-to-silence and silence-to-breathing probabilities as defined [33]. In our case, these probabilities were calculated within the time duration of a typical respiratory cycle that was assumed to be equal to 4 s. As such, the aforementioned a priori probabilities were calculated within 40 non-overlapping sliding windows of a duration of 0.1 s each. Among these frames, 2 were expected to represent a transition from silence to breathing and 2 a transition from breathing to silence. Thus, the two factors were both selected as equal to 5%.
Since the sound characteristics of breathing and background noise are expected to be altered throughout the entire night recording, it was expected that the average breathing probability (averaged over 40 consecutive 0.1 s windows) would also be volatile. Thereupon, we used a probability normalization step in order to detect the transitions from inhalation/exhalation to silence and vice versa. The threshold that determines the transition from the breathing to the non-breathing state and vice versa was selected to be equal to the mean breathing probability of the latest 150 s of the observed audio signal (Figure 2a). The final detector derived by the breathing probability for the entire audio signal (Figure 3a) was smoothed by rejecting all detected regions that lasted less than 0.7 s (Figure 2a) since shorter durations are rather unlikely to represent a complete inhalation or exhalation process (Figure 3b). The exact threshold value of 0.7 s was determined by taking into account the theoretical duration of a breathing cycle (3 to 5 s), combined with the expected imbalance between inhalation and exhalation duration. Thus, in normal cases, the minimum inhalation frame was expected to last approximately 1 s. To increase the precision in determining this threshold, we focused on extensive observation of the acquired audio signals and trial and error selections that led to the final value of 0.7 s.
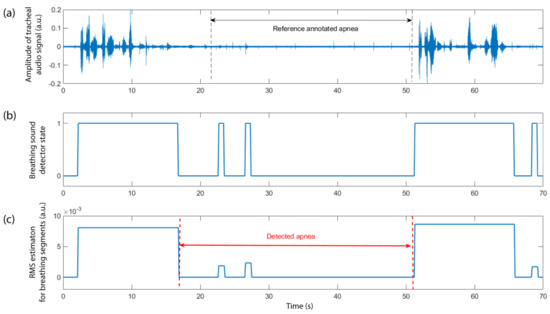
Figure 3.
Steps of the described methodology for extracting the apnea/hypopnea event detector based on the raw audio signal: (a) The audio signal, in this case, is recorded from the trachea of the patient. The annotated reference apneic event, from approx. the 22nd s until the 51st s of the represented signal excerpt is denoted by the two vertical dashed lines. The breathing activity is obvious before and after the event, while some low-level audio activity can also be observed during the event. (b) The breathing detector state, as described in Section 2.3, results in the detection of all breathing activity within the selected audio excerpt (1 denotes active, 0 denotes inactive). (c) The weighted detector, in which instead of 0 and 1 (corresponding to silence and breathing states), we have 0 for silence and non-zero values corresponding to the mean RMS of the audio signal within each detected breathing frame. The detected apneic event is also depicted.
The output of the breathing detector consisted of zeros and ones to denote breathing or non-breathing respectively and was used to mask the audio signal in order to provide an output with the original audio signal in fragments of detected breathing and zero elsewhere (Figure 2a). For each detected breathing segment, the average root mean square (RMS) value was extracted and used as a representative metric of this segment (Figure 2a). Therefore, we ended up with a weighted breathing detector, with each detected frame represented by the mean RMS value of the audio signal within the frame (Figure 3c). We assumed that an apnea or hypopnea event presented a radically reduced breathing activity within the event. Thus, we selected all regions of the weighted detector in which the mean RMS value of the detected breathing frames within this region was reduced by at least 50% as compared to the RMS values of the previous and following detected breathing frames (Figure 2a). The selected episodes should last at least 10 s but not more than 150 s. The upper threshold in apnea/hypopnea event duration was estimated based on statistics of previously reported datasets [36] and the dataset used in this study, both resulted in a maximum scored apnea duration slightly above 2 min. The threshold of 150 s was considered a safe selection to include all events of the maximum expected duration. We also selected a separating value of at least 8 s between the detected events. Indeed, statistically, we observed two complete respiratory cycles separating adjacent apneic episodes (corresponding to 6–10 s). The optimum value of 8 s was selected through a trial and error process. Thus, all events detected closer than this value to previously identified episodes were rejected as false detections.
2.5. Methodology for Validating the Performance of the Algorithmic Process
To validate the performance of the developed algorithmic process, we quantified the sensitivity and precision in the detection of the total count of apneic or hypopneic episodes irrespectively of the patient they belong to. These two metrics were defined as:
where TP is the count of True Positive detections, FN is the count of False Negative detections, and FP is the count of False Positive detections. An episode was considered as TP if there was an overlap between the detected and annotated event. If an annotated episode did not present any overlap with the detected events, it was considered as non-detected, i.e., as FN. If a detected episode did not have any overlap with the annotated events, it was eventually counted as FP.
For each detected episode, we also extracted the relationship between the detected event duration and the duration of the corresponding reference event as annotated by the clinical team. The determination of the algorithmic performance in the level of the events was the first purpose of this work, focusing on the possibility to accurately detect in time the apneic episodes and extract information relevant to each event.
In addition to the above factors, we also examined the duration distribution of all detected events—both true and false positive—compared to the distribution of the reference annotated events and we compared the MAD index estimated for each patient with the reference MAD index, derived by the reference episodes.
3. Results
3.1. Demographics of the Patients Participating in Dataset
The patients participating in this dataset were adults that followed a complete sleep study in the Sismanoglio Sleep Study Unit as a result of previous complaints of daytime fatigue and sleepiness or loud snoring. They all belonged in the categories of “severe” or “moderate” apnea patients. Table 1 presents basic anthropometric factors such as gender and the age of the patients. It is clear that the patients participating in the study covered a wide range of ages (23–88 years). The age distribution for men and women presented a similar average value and range. The values indicated in Table 1 were compared for the population of “Severe” and “Moderate” classes by the use of the Wilcoxon rank-sum test for independent samples in two populations [37], not following the normal distribution. The non-fitting with the normal distribution was verified by the use of the Kolmogorov-Smirnov test [37]. The male patients represented 74% of the total count of participating adults, which was expected due to the higher prevalence of SAS in the male population. “Severe” patients of SAS, based on the performed diagnosis, represented 85% of the examined population with the rest being categorized in the class of “Moderate”. The main reason leading to this imbalance was that, in clinical practice, most of the patients seeking diagnosis who were prescribed to the PSG study, were those who present severe symptoms of apnea or have increased risk factors of suffering from the syndrome. Additionally, the presence of very few cases (less than 10) of normal participants or patients suffering from mild apnea, inevitably excluded the possibility to examine the performance of the proposed algorithm in these classes and extract safe results. Therefore, these classes were excluded, even from the demographics Table 1, while the corresponding factors and indices can be extracted by examining the complete online available dataset [32].

Table 1.
Basic anthropometric factors and indices associated with Sleep Apnea Syndrome (SAS), for the population participating in this study.
3.2. The Developed Apnea Detector Can Identify 73.6% and 65.3% of All Annotated Events, from Tracheal and Ambient Sound Recordings, Respectively
The total number of annotated events in the used dataset was 57,967. When using the tracheal sound recordings, we could identify 42,671 episodes. The corresponding value of detected events for the ambient sound recordings was slightly decreased, reaching 37,969 episodes. The above sensitivity proved the dominance of the selected pattern of sound in audio recordings of apnea/hypopnea events. More precisely, this pattern was anticipated with strong frequency in all apnea events—comprising the categories of obstructive apnea, central apnea, and mixed apnea—in which the sensitivity reached 81% for the tracheal microphone and 70.4% for the ambient microphone (Table 2). The sensitivity for both microphones was much reduced in the case of hypopneas, in which the presence of loud snoring during the actual event should not only be anticipated but was also used as a characteristic for the identification of the event in manual scoring [2].
Table 2.
The sensitivity exhibited by the system for apnea/hypopnea events detected for all subcategories of apneic events, based on tracheal and ambient sound analysis.
3.3. The Sensitivity Examined for Each Patient Reaches a Maximum of 99.4% of Events, however, the Mean Precision per Patient Is Kept in Moderate Level Not Exceeding 50%
We examined the sensitivity performed by the above-described algorithmic process for each patient separately. The mean sensitivity was 71.5% for the contact microphone (tracheal recordings) and 64.1% for the ambient microphone (distant recordings). However, the maximum sensitivity per patient was 99.4% and 99.5% (Table 3) for the two microphones, respectively; we also identified patients where the sensitivity was much lower than the mean value.
Table 3.
The sensitivity and precision per patient with the additional information of the severity group in which they belong based on the delivered apnea diagnosis.
The extracted precision per patient was moderate, with the mean value not exceeding 50.6% for the tracheal audio recordings and 45.9% for the ambient audio recordings. Among the examined patients, some cases from the severe class exhibited a precision even higher than 90%, however, the overall estimation of the moderate precision rendered further processing imperative to discriminate between true and false-positive detections.
The breathing sound may be strongly altered between the male and female population, however; in this process, we used common processes for all patients, independently of their gender. Taking into consideration the reduced number of women searching for apnea diagnosis in the hospital, compared to men, we did not observe significant differences between the two gender populations in the sensitivity and precision of apnea/hypopnea events detection (Table 4).
Table 4.
The sensitivity and precision per patient with the additional information of paitent gender to examine the performance of the developed algorithm in the different gender groups.
3.4. The Mean Duration Difference between Detected and Reference Events Is 3.2 s for Tracheal Breathing Sound and 5.3 s for Ambient Breathing Sound
By examining the duration distribution of both the reference labeled events and the detected events (Figure 4), independently of the patient to whom they belong, we observed a similar distribution, with an increased number of short events (<20 s) and a slightly reduced number of detected events in the range 23–33 s. This pattern was observed for both microphones. For the contact microphone, the average and maximum duration of the set of detected episodes were 16.7 s and 148.7 s respectively. For the ambient microphone, the average and maximum duration for the detected events were 15.2 s and 149.9 s, respectively. The corresponding values for the set of reference events—annotated by the clinical team—were 19.2 and 128.5 s.
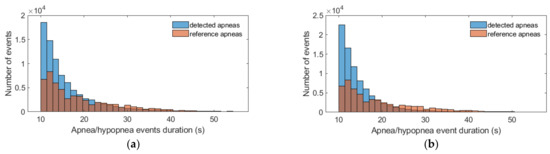
Figure 4.
Distribution of the duration of the set of reference apnea/hypopnea events—annotated by the clinical team—and the set of detected apnea/hypopnea episodes. (a) Tracheal contact microphone; (b) Ambient microphone. Despite the presence of a few events with duration in the range 60–150 s, we opted for presenting only the range 10–60 s to clearly indicate the strong differences between the examined distributions.
We also examined the duration difference for the true positive detected events and their corresponding reference episodes. By considering the mean difference for all pairs of episodes (reference and detected), the duration of the events was underestimated by 3.2 s for tracheal sound recordings and 5.3 s for ambient sound recordings (Figure 5). More precisely, for the contact microphone, the error in the duration of the events was in the range of −17.3 s to 23.8 s for 95% of all annotated events. The corresponding range for the ambient microphone was slightly widened: −19.1 s to 29.8 s. It was particularly interesting that for the ambient microphone recordings, the mean duration difference between the detected and the corresponding reference event represented 10.51% of the duration of the corresponding reference event. For the case of the tracheal microphone recordings, this percentage was 4.43%.
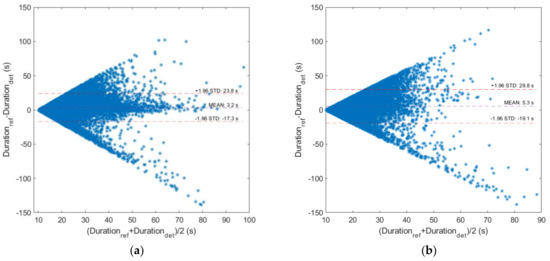
Figure 5.
Bland-Altman diagrams for the reference and detected duration of all true positive apnea/hypopnea events: (a) for the case of tracheal sound recordings; (b) for the case of ambient sound recordings.
We also examined the difference in the detected and reference duration in different event categories. In particular, we classified detected events with respect to their reference duration in two categories: short-length events (10–20 s) and long events (>20 s). The difference between the reference and the detected duration provided smaller errors in the case of short length duration (see Supplementary Materials). The categorization of the events with respect to the type of the episode (apneas and hypopneas) provided minor differences in the duration error between these main classes (see Supplementary Materials), keeping in mind that the total number of detected apneas was much larger than the corresponding count of detected hypopneas (Table 2).
3.5. The Mean Apnea Duration of Each Patient Is Estimated with a Mean Error of 1.7 s for Tracheal Microphone and 3.2 s for the Ambient Microphone
The Mean Apnea Duration (MAD) is an index indicative of the severity of the consequences of SAS. It is an index extracted for each patient by taking into account all apnea and hypopnea events. In the dataset we used, the mean error in the estimated MAD index for the tracheal sound was 1.7 s below the corresponding value of the reference MAD index of the patients. Based on the Bland- Altman plots illustrated in Figure 6, 95% of the patients in this dataset did not exceed the error margin of −8.7 s to 12 s. For the ambient microphone, these error values were slightly higher with the mean error in MAD estimation being 3.2 s below the reference value and the error margin for the majority of the patients (95%) being (−9.3 s, 15.8 s).

Figure 6.
Bland-Altman diagrams for the reference and estimated Mean Apnea Duration (MAD) index for all patients of the dataset: (a) based on tracheal sound recordings; (b) based on ambient sound recordings.
4. Discussion
The developed algorithm is based on a well-established signal processing methodology for VAD [33,34,35]. VAD algorithms have been widely used in breathing detection [30] and their application, especially in audio recordings during the night, are believed to perform particularly well due to the absence of speech. The hypothesis examined here is the possibility to identify the exact time location of apnea/hypopnea events by the estimation of the mean RMS value of the audio signal during the detected breathing segments. The achieved sensitivity proves that the proposed pattern is indeed present in the majority of apneic episodes (81%) and also half of the hypopneas exhibited by a patient with moderate or severe apnea syndrome. The algorithm developed was tested also for the case of an ambient microphone where its performance is slightly reduced.
A comparison between the sensitivity provided by the two independently employed microphones can give a clear view of their performance in detecting apnea and hypopnea episodes. In the case of apnea events, a systematically increased sensitivity is observed for the tracheal microphone (approx. 11%) as compared to the ambient microphone. This is exclusively attributed to the fact that the tracheal microphone is in direct contact with the source producing the targeted sound—the patient’s trachea—and it is practically insensitive to any external noise. The ambient microphone is sensitive to environmental noise, particularly in the sleep study unit, the air condition sound, the sound of any other equipment in the room, and the speech from clinical staff supervising the study. However, in the case of hypopneas, the difference in the provided sensitivity is much lower. The developed algorithm does not categorize breathing sounds in different frequency bands or in classes of breathing and snoring. Thus, mild breathing and snoring may be monitored to have the same sound level, when recorded by the contact microphone. This is expected to be the case more often in hypopneas, in which some inhalation sounds are expected within the event. The ambient microphone may give a clearer view of these events, by performing better in the aforementioned discrimination.
Despite the good sensitivity, the algorithmic process presents moderate precision, providing a lot of false-positive detections per patient. Based on the extracted distribution of the estimated and reference events, it is clear that the low precision is attributed to an overestimation of the number of short-length episodes—10 s to 20 s—(Figure 4) by both microphones. The medium-length events—25 to 35 s—are slightly underestimated. The detected duration of the events seems to present negligible error differences in the cases of events produced when the patient is in supine or lateral position (“right” and “left” side), while the same results are produced when we follow a categorization of the detected events with respect to sleep stages (REM, non REM) (see Supplementary Material). However, future steps in a deeper examination of the factors affecting the detected duration error (time spent in ‘supine’ position in the hospital and at home, the ratio between REM/non-REM stages duration) are imperative for accurate interpretation of these results
Overall, the number of detected events is higher than the number of reference events. The problem of increased false detection rate is higher for patients with moderate SAS, compared to those with severe SAS. We have to mention here that the algorithm in its current version is not intended for use in the extraction of the AHI; this was beyond the scope of the present work. Such use would lead to severe overestimation of AHI (see also Supplementary Materials). Further analysis of the properties of the detected episodes may result in effective discrimination between true and false positive episodes, which should be among future perspectives.
MAD is an index attracting increasing interest by the scientific community as it can be indicative of the severity of the syndrome and the general health status of the patients with severe or moderate SAS. Particularly, long average apnea duration is related to morning tiredness and hypertension in patients [19], as well as with significantly worse blood oxygen levels and sleep parameters such as significantly shorter sleep latency, reduced duration of NREM 3 stage, and increased arousal index [20]. The extraction of the MAD requires the accurate time localization of apneic and hypopneic events and not just an estimation of breathing sound features. In this paper, we provide an algorithmic process for an adequate estimation of the MAD of each patient. Based on tracheal sound recordings, the MAD index is underestimated for the cases of patients with a MAD greater than 20 s. This underestimation is worsened in the case of ambient microphone recordings. For only a few cases of patients with a low MAD index (10 to 20 s), there is an overestimation of the MAD index by the developed algorithm (see Supplementary Materials). For the majority of the patients (160 out of 239, 66.5%), the absolute error in the estimation of the MAD index does not exceed 5 s. This error can be partially explained by the resolution in time scoring of reference apneas in the corresponding software used by the clinical team (Sleepware G3) and the error of synchronization of the audio signals with the signals from polysomnography—estimated to be at a maximum of 2 s.
Based on the aforementioned results, we believe that the conducted study contributes to a better understanding of the breathing sound features during an apnea/hypopnea event. The present study proves that VAD algorithms can be used with increased sensitivity in the identification of apnea/hypopnea events. The VAD algorithm employed in this study is one of the first and simplest algorithms, in terms of computational complexity, developed in the field of voice activity detection, profiting especially from the accuracy in the noise estimation. This is of crucial importance in the field of sleep breathing detection since breathing/snoring characteristics are much closer to noise than those of speech. Future steps in this field of application include testing of more sophisticated approaches, especially those depending on the latest advances in deep learning techniques [38]. Concerning the possible clinical applications, this study can prove beneficial for: (a) the inclusion of automated sound analysis as part of the laboratory PSG interpretation, indeed, for the time being, breathing audio recordings are practically excluded from the apnea events scoring process; (b) home-based systems focusing on individual events detection to screen the progress of the disease in diagnosed patients, and; (c) home-based systems aiming at identifying the syndrome’s severity based on the MAD estimation. This is particularly important, taking into account that the MAD estimation is not included in home-based systems proposed in the literature, as well as the MAD is expected to be clearer when studied in the home environment than in the hospital, due to its dependence on sleep stages and sleep convenience.
5. Conclusions
The algorithm used in this work is based on VAD for breathing state identification and the extraction of apnea and hypopnea events during night sleep. It proves a good sensitivity of 81% for all apnea episodes and a moderate sensitivity of 53.7% for hypopnea events when an audio breathing signal is recorded through a tracheal contact microphone. Ambient microphone recordings have also been tested and present slightly reduced sensitivity to both apneas and hypopneas. While precision is still a drawback, with false-positive detection rate being elevated, the algorithms can provide an adequate estimation of the MAD index for the patient examined. In this study, we focused on severe and moderate classes of SAS.
Supplementary Materials
Supplementary materials can be found at https://www.mdpi.com/article/10.3390/app11156888/s1. Figure S1: Correlation plots of Mean Apnea Duration (MAD) index for patient with ‘severe’ and ‘moderate’ Sleep Apnea Syndrome (SAS), Figure S2: Performance of the provided algorithm in estimating the AHI by the use of tracheal sound recordings, Figure S3: Performance of the provided algorithm in estimating the AHI by the use of ambient microphone sound recordings, Figure S4: Box plots for the duration of all reference and detected apnea events, Figure S5: Box plot of the duration difference between the reference and the detected apnea/hypopnea events, Figure S6: Box plots for the duration difference between all reference and detected events when classified in two main categories based on their reference duration, Figure S7: Box plots for the duration difference between all reference and detected events when classified in two main categories based on the episode type, Figure S8: Box plots for the duration difference between all reference and detected events when classified in two main categories based on the body position, Figure S9: Box plots for the duration difference between all reference and detected events when classified in two main categories based on the sleep stage.
Author Contributions
Conceptualization G.K., S.A.M., S.M.P.; Experiment design and setup S.A.M., N.-A.T., S.M.P.; Methodology, development and validation G.K., L.K.; Literature review G.K., L.K.; Article drafting G.K.; Critical revision of the article: S.M.P. All authors have read and agreed to the published version of the manuscript.
Funding
This research has been co-financed by the European Union and Greek national funds through the Operational Program Competitiveness, Entrepreneurship and Innovation, under the call RESEARCH–CREATE–INNOVATE (project code: T1EDK-03957_ Automatic Pre-Hospital, In-Home, Sleep Apnea Examination).
Institutional Review Board Statement
The study was conducted according to the guidelines of the Declaration of Helsinki, and approved by the Local ethics committee of Sismanoglio Hospital.
Informed Consent Statement
Informed consent was obtained from all subjects involved in the study.
Data Availability Statement
The dataset “PSG-Audio” used in this report is publicly available at: http://www.dx.doi.org/10.11922/sciencedb.00345 [32].
Acknowledgments
We acknowledge the contribution of the clinical team of Sismanogleio General Hospital of Athens—Amfilochiou Anastasia, Kastanakis Emmanouil, Maniou Chrysoula and Tsiafaki, Xanthi—for events annotation and characterization of all polysomnogram recordings.
Conflicts of Interest
The authors declare no conflict of interest. The funders had no role in the design of the study; in the collection, analyses, or interpretation of data; in the writing of the manuscript, or in the decision to publish the results.
References
- Guilleminault, C. Obstructive Sleep Apnea: The Clinical Syndrome and Historical Perspective. Med. Clin. North Am. 1985, 69, 1187–1203. [Google Scholar] [CrossRef]
- Berry, R.B.; Brooks, R.; Gamaldo, C.E.; Harding, S.M.; Marcus, C.L.; Vaughn, B.V. The AASM Manual for the Scoring of Sleep and Associated Events. Am. Acad. Sleep Med. 2013, 53, 1689–1699. [Google Scholar] [CrossRef]
- Tsara, V.; Amfilochiou, A.; Papagrigorakis, J.M.; Georgopoulos, D.; Liolios, E.; Kadiths, A.; Koudoumnakis, E.; Aulonitou, E.; Emporiadou, M.; Tsakanikos, M.; et al. Guidelines for Diagnosing and Treating Sleep related Breathing Disorders in Adults and Children (Part 3: Obstructive Sleep Apnea in Children, Diagnosis and Treatment). Hippokratia 2010, 14, 57–62. [Google Scholar] [PubMed]
- Engleman, H.M.; Douglas, N.J. Sleep · 4: Sleepiness, cognitive function, and quality of life in obstructive apnoea/hypopnoea syndrome. Thorax 2004, 59, 618–622. [Google Scholar] [CrossRef] [Green Version]
- Engleman, H. Neuropsychological function in obstructive sleep apnoea. Sleep Med. Rev. 1999, 3, 59–78. [Google Scholar] [CrossRef]
- Lacasse, Y.; Godbout, C.; Series, F. Health-related quality of life in obstructive sleep apnoea. Eur. Respir. J. 2002, 19, 499–503. [Google Scholar] [CrossRef] [Green Version]
- Haraldsson, P.-O.; Carenfelt, C.; Diderichsen, F.; Nygren, Å.; Tingvall, C. Clinical Symptoms of Sleep Apnea Syndrome and Automobile Accidents. ORL 1990, 52, 57–62. [Google Scholar] [CrossRef]
- Pack, A.I.; Dinges, D.; Maislin, G. A Study of Prevalence of Sleep Apnea among Commercial Truck Drivers; Publication No. DOT-RT-02-030; Federal Motor Carrier Safety Administration: Washington, DC, USA, 2002. [Google Scholar]
- Horstmann, S.; Hess, C.W.; Bassetti, C.; Gugger, M.; Mathis, J. Sleepiness-related accidents in sleep apnea patients. Sleep 2000, 23, 1–7. [Google Scholar] [CrossRef] [Green Version]
- Fletcher, E.C.; DeBehnke, R.D.; Lovoi, M.S.; Gorin, A.B. Undiagnosed Sleep Apnea in Patients with Essential Hypertension. Ann. Intern. Med. 1985, 103, 190–195. [Google Scholar] [CrossRef]
- Wolk, R.; Shamsuzzaman, A.S.; Somers, V.K. Obesity, Sleep Apnea, and Hypertension. Hypertension 2003, 42, 1067–1074. [Google Scholar] [CrossRef]
- Bauters, F.; Rietzschel, E.R.; Hertegonne, K.B.C.; Chirinos, J.A. The Link between Obstructive Sleep Apnea and Cardiovascular Disease. Curr. Atheroscler. Rep. 2016, 18, 1–11. [Google Scholar] [CrossRef]
- Jafari, B.; Mohsenin, V. Polysomnography. Clin. Chest Med. 2010, 31, 287–297. [Google Scholar] [CrossRef]
- Kapur, V.K.; Donovan, L.M. Why a Single Index to Measure Sleep Apnea Is Not Enough. J. Clin. Sleep Med. 2019, 15, 683–684. [Google Scholar] [CrossRef] [Green Version]
- Cho, J.H. Both the Duration of Apnea and the Number of Apneas Are Important in Obstructive Sleep Apnea Syndrome. Sleep Med. Res. 2020, 11, 149–151. [Google Scholar] [CrossRef]
- Nikkonen, S.; Töyräs, J.; Mervaala, E.; Myllymaa, S.; Terrill, P.; Leppänen, T. Intra-night variation in apnea-hypopnea index affects diagnostics and prognostics of obstructive sleep apnea. Sleep Breath. 2020, 24, 379–386. [Google Scholar] [CrossRef] [Green Version]
- Temirbekoy, D.; Gunes, S.; Yazici, Z.M.; Sayin, I. The Ignored Parameter in the Diagnosis of Obstructive Sleep Apnea Syndrome The Oxygen Desaturation Index. Turk Otolarengoloji Arsivi/Turkish Arch. Otolaryngol. 2018, 1–6. [Google Scholar] [CrossRef]
- Wu, H.; Zhan, X.; Zhao, M.; Wei, Y. Mean apnea–hypopnea duration (but not apnea–hypopnea index) is associated with worse hypertension in patients with obstructive sleep apnea. Medicine 2016, 95, e5493. [Google Scholar] [CrossRef]
- Saraç, S.; Afsar, G.C. Effect of mean apnea-hypopnea duration in patients with obstructive sleep apnea on clinical and polysomnography parameter. Sleep Breath. 2019, 24, 77–81. [Google Scholar] [CrossRef]
- Zhan, X.; Fang, F.; Wu, C.; Pinto, J.M.; Wei, Y. A Retrospective Study to Compare the Use of the Mean Apnea-Hypopnea Duration and the Apnea-Hypopnea Index with Blood Oxygenation and Sleep Patterns in Patients with Obstructive Sleep Apnea Diagnosed by Polysomnography. Med Sci. Monit. 2018, 24, 1887–1893. [Google Scholar] [CrossRef] [Green Version]
- Shokrollahi, M.; Saha, S.; Hadi, P.; Rudzicz, F.; Yadollahi, A. Snoring sound classification from respiratory signal. In Proceedings of the 2016 38th Annual International Conference of the IEEE Engineering in Medicine and Biology Society (EMBC), Orlando, FL, USA, 16–20 August 2016; pp. 3215–3218. [Google Scholar] [CrossRef]
- Yadollahi, A.; Moussavi, Z. Acoustic obstructive sleep apnea detection. In Proceedings of the 2009 Annual International Conference of the IEEE Engineering in Medicine and Biology Society, Minneapolis, MN, USA, 3–6 September 2009; pp. 7110–7113. [Google Scholar] [CrossRef]
- Penzel, T.; Sabil, A. The use of tracheal sounds for the diagnosis of sleep apnoea. Breathe 2017, 13, e37–e45. [Google Scholar] [CrossRef]
- Glos, M.; Sabil, A.; Jelavic, K.S.; Baffet, G.; Schöbel, C.; Fietze, I.; Penzel, T. Tracheal sound analysis for detection of sleep disordered breathing: A comparison to detection using an oronasal thermistor. Somnologie 2019, 23, 80–85. [Google Scholar] [CrossRef] [Green Version]
- Nakano, H.; Hirayama, K.; Sadamitsu, Y.; Toshimitsu, A.; Fujita, H.; Shin, S.; Tanigawa, T. Monitoring Sound To Quantify Snoring and Sleep Apnea. J. Clin. Sleep Med. 2014, 10, 73–78. [Google Scholar] [CrossRef]
- Nakano, H.; Furukawa, T.; Tanigawa, T. Tracheal Sound Analysis Using a Deep Neural Network to Detect Sleep Apnea. J. Clin. Sleep Med. 2019, 15, 1125–1133. [Google Scholar] [CrossRef] [Green Version]
- Kim, T.; Kim, J.-W.; Lee, K. Detection of sleep disordered breathing severity using acoustic biomarker and machine learning techniques. Biomed. Eng. Online 2018, 17, 1–19. [Google Scholar] [CrossRef] [Green Version]
- Saha, S.; Kabir, M.; Ghahjaverestan, N.M.; Hafezi, M.; Gavrilovic, B.; Zhu, K.; Alshaer, H.; Yadollahi, A. Portable diagnosis of sleep apnea with the validation of individual event detection. Sleep Med. 2020, 69, 51–57. [Google Scholar] [CrossRef]
- Alshaer, H.; Fernie, G.; Maki, E.; Bradley, T.D. Validation of an automated algorithm for detecting apneas and hypopneas by acoustic analysis of breath sounds. Sleep Med. 2013, 14, 562–571. [Google Scholar] [CrossRef]
- Almazaydeh, L.; Elleithy, K.; Faezipour, M.; Abushakra, A. Apnea Detection based on Respiratory Signal Classification. Procedia Comput. Sci. 2013, 21, 310–316. [Google Scholar] [CrossRef] [Green Version]
- The European Commission. Regulation (EU) 2016/679 of the European Parliament and of the Council of 27 April 2016 on the Protection of Natural Persons with Regard to the Processing of Personal Data and on the Free Movement of Such Data, and Repealing Directive 95/46/Ec (General Data). 2016. Available online: https://eur-lex.europa.eu/legal-content/EN/TXT/PDF/?uri=CELEX:32016R0679 (accessed on 24 July 2021).
- Korompili, G.; Amfilochiou, A.; Kokkalas, L.; Mitilineos, S.A.; Tatlas, N.-A.; Kouvaras, M.; Kastanakis, E.; Maniou, C.; Potirakis, S.M. PSG-Audio. Science Data Bank. 2020. Available online: http://www.doi.org/10.11922/sciencedb.00345 (accessed on 24 July 2021).
- Sohn, J.; Kim, N.S.; Sung, W. A statistical model-based voice activity detection. IEEE Signal Process. Lett. 1999, 6, 1–3. [Google Scholar] [CrossRef]
- Martin, R. Noise power spectral density estimation based on optimal smoothing and minimum statistics. IEEE Trans. Speech Audio Process. 2001, 9, 504–512. [Google Scholar] [CrossRef] [Green Version]
- Ephraim, Y.; Malah, D. Speech enhancement using a minimum-mean square error short-time spectral amplitude estimator. IEEE Trans. Acoust. Speech Signal Process. 1984, 32, 1109–1121. [Google Scholar] [CrossRef] [Green Version]
- Leppänen, T.; Töyräs, J.; Muraja-Murro, A.; Kupari, S.; Tiihonen, P.; Mervaala, E.; Kulkas, A. Length of Individual Apnea Events Is Increased by Supine Position and Modulated by Severity of Obstructive Sleep Apnea. Sleep Disord. 2016, 2016, 1–13. [Google Scholar] [CrossRef] [PubMed] [Green Version]
- Leslie, J.; Gibbons, J.D. Nonparametric Statistical Inference. J. R. Stat. Soc. Ser. A (Gen.) 1986, 149, 275. [Google Scholar] [CrossRef]
- Tong, S.; Gu, H.; Yu, K. A comparative study of robustness of deep learing approaches for VAD. In Proceedings of the 2016 IEEE International Conference on Acoustics, Speech and Signal Processing (ICASSP), Shanghai, China, 20–25 March 2016; pp. 5695–5699. [Google Scholar] [CrossRef]
Publisher’s Note: MDPI stays neutral with regard to jurisdictional claims in published maps and institutional affiliations. |
© 2021 by the authors. Licensee MDPI, Basel, Switzerland. This article is an open access article distributed under the terms and conditions of the Creative Commons Attribution (CC BY) license (https://creativecommons.org/licenses/by/4.0/).