Article

The Variation in 3D Face Shapes of Dutch Children for Mask Design

1
Faculty of Industrial Design Engineering, Delft University of Technology, 2628 CE Delft, The Netherlands
2
School of Global Entrepreneurship and Information Communication Technology, Handong Global University, Pohang 37554, Korea
*
Author to whom correspondence should be addressed.
Appl. Sci. 2021, 11(15), 6843; https://doi.org/10.3390/app11156843
Submission received: 30 March 2021 / Revised: 26 May 2021 / Accepted: 28 May 2021 / Published: 25 July 2021
(This article belongs to the Special Issue Novel Approaches and Applications in Ergonomic Design)

Abstract

:
The use of 3D anthropometric data of children’s heads and faces has great potential in the development of protective gear and medical products that need to provide a close fit in order to function well. Given the lack of detailed data of this kind, the aim of this study is to map the size and shape variation of Dutch children’s heads and faces and investigate possible implications for the design of a ventilation mask. In this study, a dataset of heads and faces of 303 Dutch children aged six months to seven years consisting of traditional measurements and 3D scans were analysed. A principal component analysis (PCA) of facial measurements was performed to map the variation of the children’s face shapes. The first principal component describes the overall size, whilst the second principal component captures the more width related variation of the face. After establishing a homology between the 3D scanned face shapes, a second principal component analysis was done on the point coordinates, revealing the most prominent variations in 3D shape within the sample.

1. Introduction

Anthropometric information is commonly used in the design and evaluation of numerous applications such as workplaces, tools, clothing and wearables. Designers look to translate key body dimensions to relevant product shape and size in order to achieve a good fit. Traditional 1D anthropometric measurements are not able to capture the shape of the human body. However, this morphological information is becoming more important in the development of products such as apparel, backpacks, orthoses and headwear that need to closely fit a part of the body.
In headwear, a good fit is often required in order for the product to function properly. This is especially important in protective gear or medical products as the fit of these products could have a direct impact on the wearer’s health and safety [1,2,3,4]. Thus, anthropometric information of the head and face is necessary to describe the variation in size and shape in order to develop a product that fits the user. Previous research has demonstrated the benefit of using 3D anthropometric data in order to understand the morphological variation of the head and face as well as in the improvement of product fit. Various researchers have studied the anthropometric variation of heads and faces based on 3D head scan data [5,6,7] in order to develop new sizing systems [8,9,10], in order to generate representative models [8,11,12,13] or to improve the fit of certain products [14,15,16,17].
Previous studies all focus on adults, but relatively few studies have been carried out on 3D scan data for children using similar forms of analysis. In addition, the availability of 3D anthropometric data of children’s heads and faces for designers is limited. Anthropometric surveys targeting children are a necessity as it has already been determined that children cannot be considered small adults, and thus that one cannot simply downsize a product designed for adults because body proportions are different especially in early childhood [18,19]. Detailed head and facial anthropometric data of children enable designers to create products with a better fit and by doing so, increasing safety and comfort of, for example, helmets [20], pollution masks [21], oxygen masks [22] and other medical devices [23]. Furthermore, the anthropometric data of children also give insights in age related differences or growth, which is essential for designers when designing a product for children [24]. For example, Bradtmiller [20] conducted a 3D anthropometric study of children (n = 1035) for the development of better fitting helmets for American children aged 2 to 18. Based on the (3D) anthropometric data, he defined a new sizing system and subsequently generated head forms representing each size for helmet design. More recently, researchers have gathered 3D scans of children in order to analyse and extract shape information for the design of facial masks for both medical and commercial applications [25,26,27,28].
After collecting the 3D scanned data, one of the challenges a designer encounters is to try to accommodate the variation in shape. This is especially true when developing a product that needs to closely fit a certain part of the body [29]. In order to do so, anthropometric information is translated into a sizing system and/or product dimensions. A common way of determining this is by identifying one or two key dimensions (or sizing parameters) that can be translated into product dimensions [1,29,30]. However, with a product that needs a close fit, such as a ventilation mask, two dimensions are not sufficient to describe the shape variation of the face [1,30]. One way of incorporating more dimensions into the design or a sizing system is by mapping the variation of multiple key-dimensions by means of a principal component analysis (PCA) [29,31]. PCA is a technique to increase interpretability of large datasets that consist of a high number of interrelated variables by dimensionality reduction. It generates a new set of uncorrelated (orthogonal) variables to describe the dataset while preserving as much of the variation present in the dataset. Studies have shown that a multivariate approach results in a more accurate representation of the variation compared to bivariate analysis for applications in sizing system development [1,29,31,32].
Currently, PCA remains the most commonly used form of analysis of 3D anthropometric data sets. PCA has been used to study shape variation or extract relevant information for the development of fit test panels, defining sizing systems, or determining product dimensions [29,33,34]. In addition, PCA has been conducted in order to study body shape differences in children [35]. The input variables for a PCA can vary from measurements, landmark locations or point-cloud data/3D geometric models [1,5,11,36,37,38]. The outcome of a PCA is not widely used in design practice because of its complexity [39], and it is not directly applicable in the design process for it does not offer an intuitive description of the shape [6]. Nevertheless, it does offer a method to present a complex and rich data set in a more understandable way. In order for the designers to be able to use this information in the design process, representative or average shape models that represent the variance of the target population are usually generated based on these analyses [5,37]. Designers can then use these representative 3D face models to adapt their designs to the target group. In this way, protective equipment of medical products that needs to fit a children’s head or face can be developed.
Therefore, the aim of this study is to present and analyse the shape variation of Dutch children’s faces, and, more specifically, the area relevant for the design of a ventilation mask, by conducting both a measurement based PCA and shape based PCA. In addition, this paper investigates possible implications for the design of the ventilation mask and discusses the applicability for designers of both PCAs.

2. Method

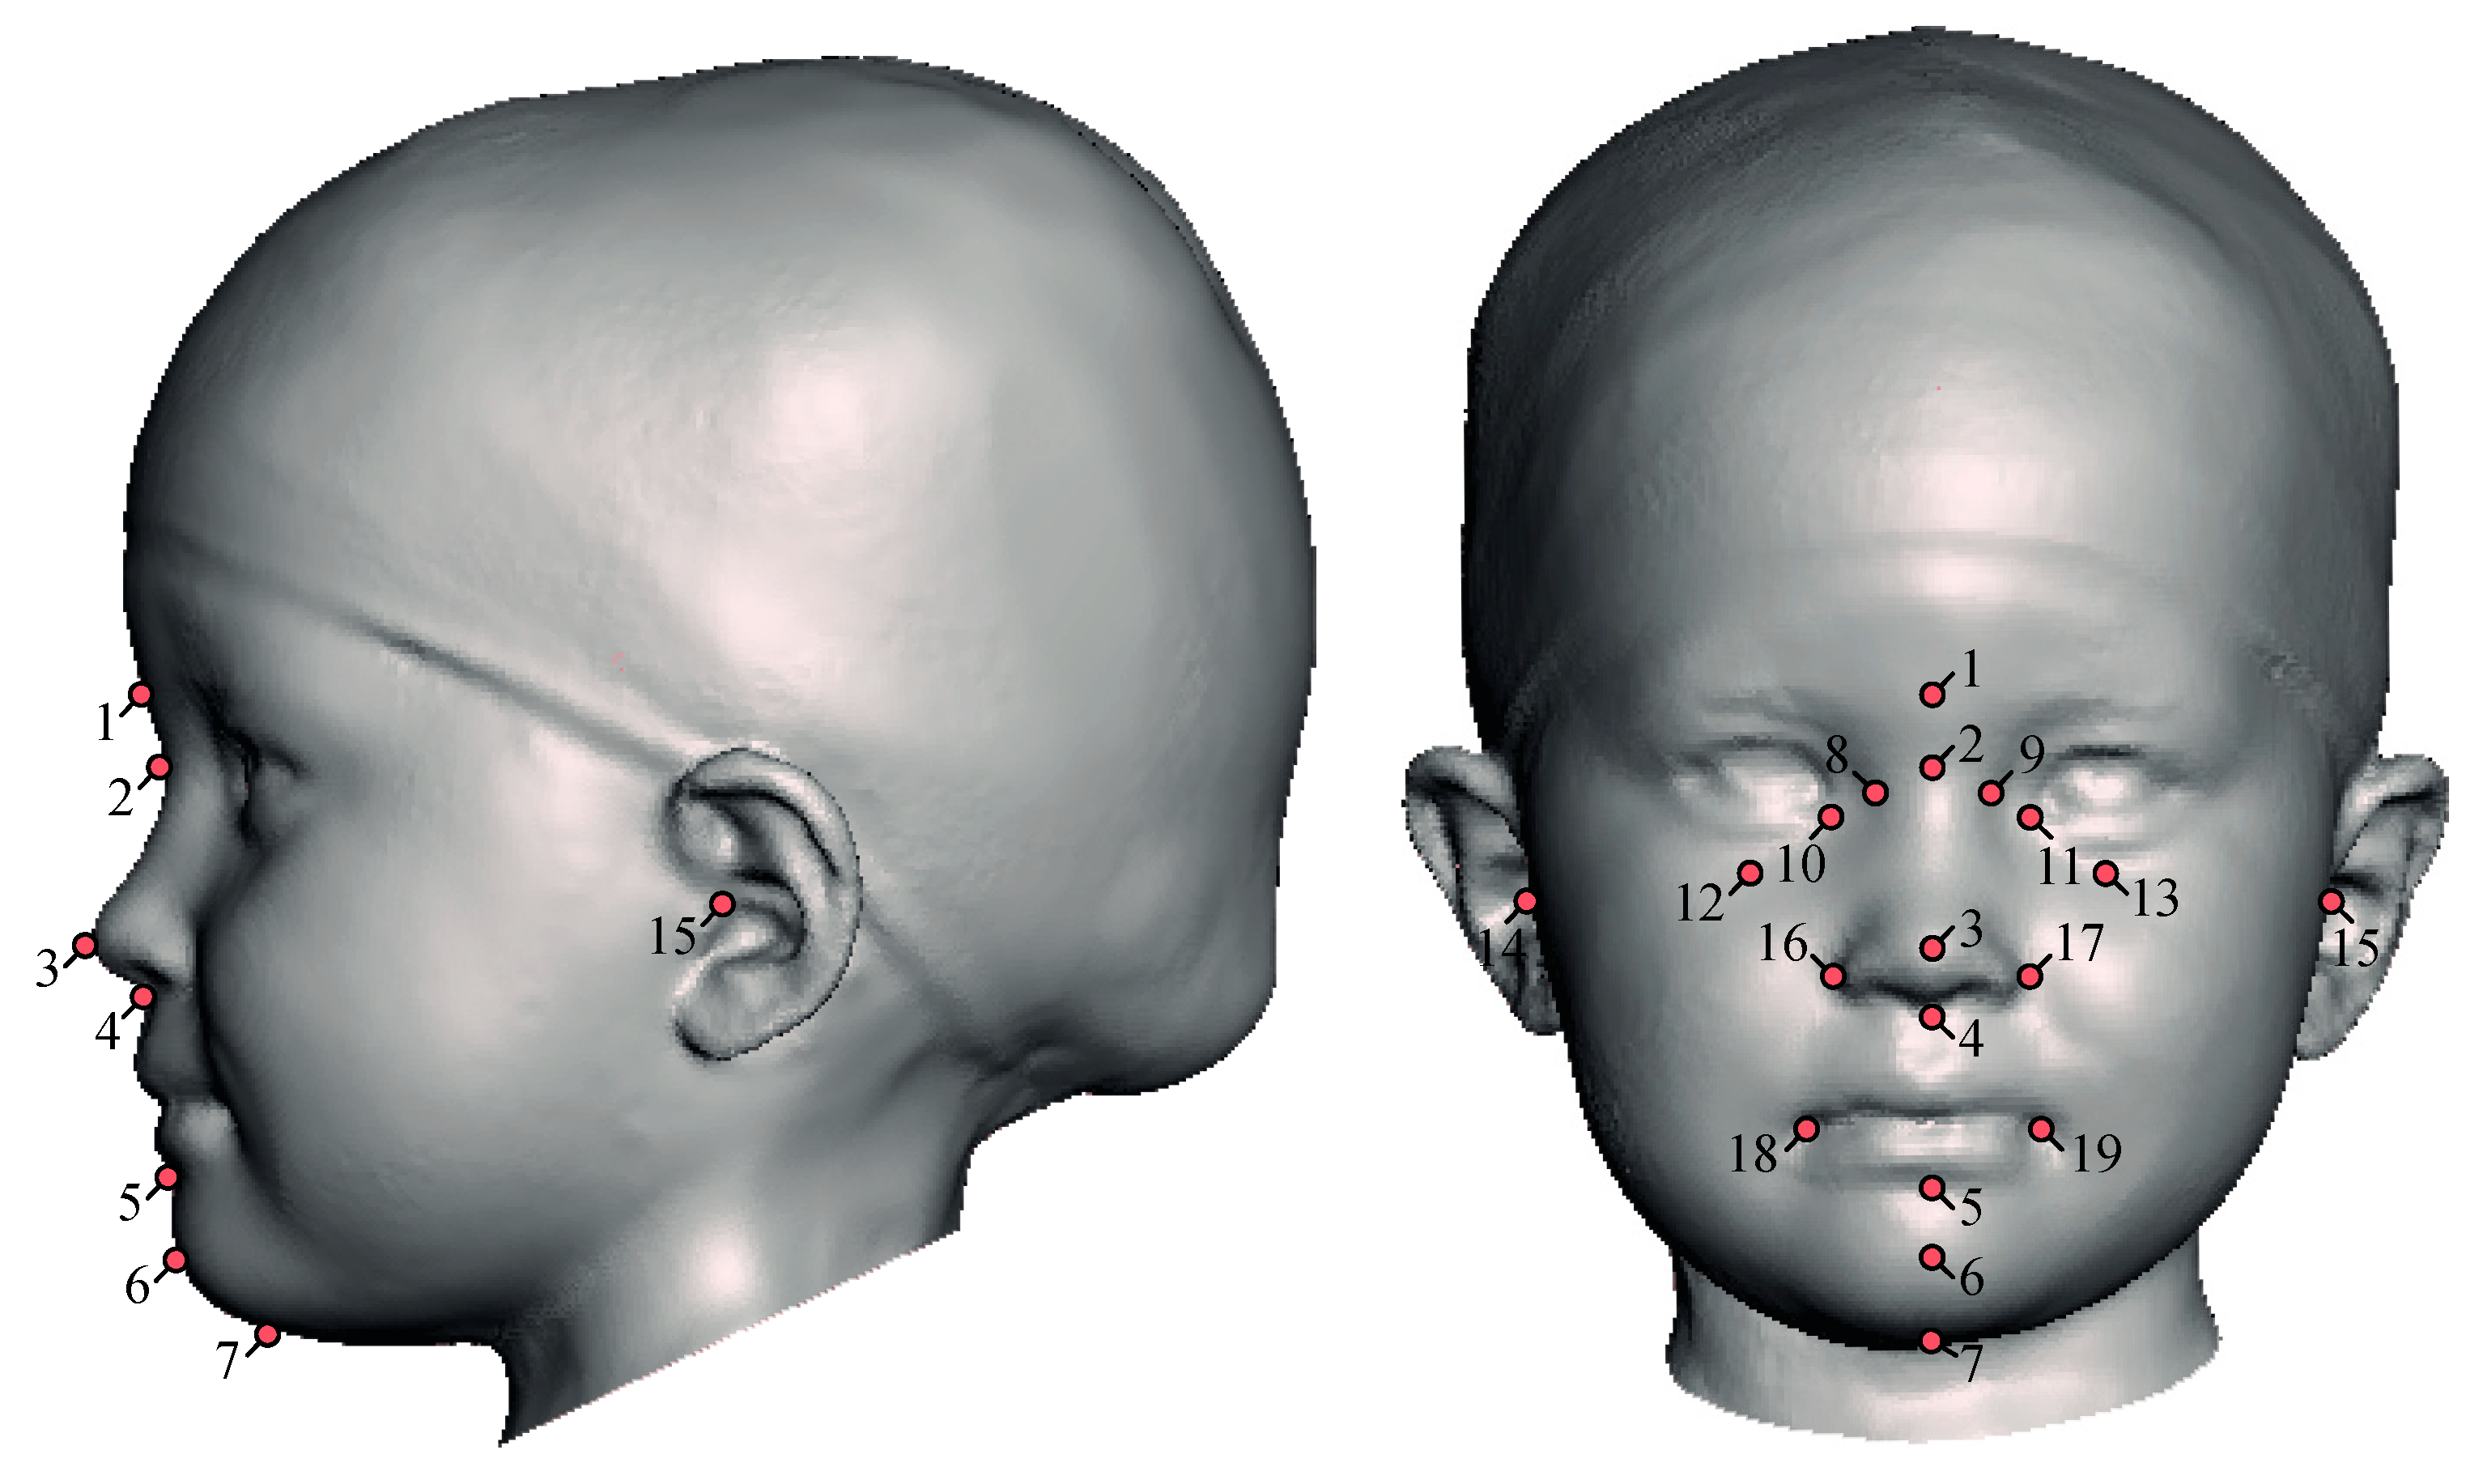
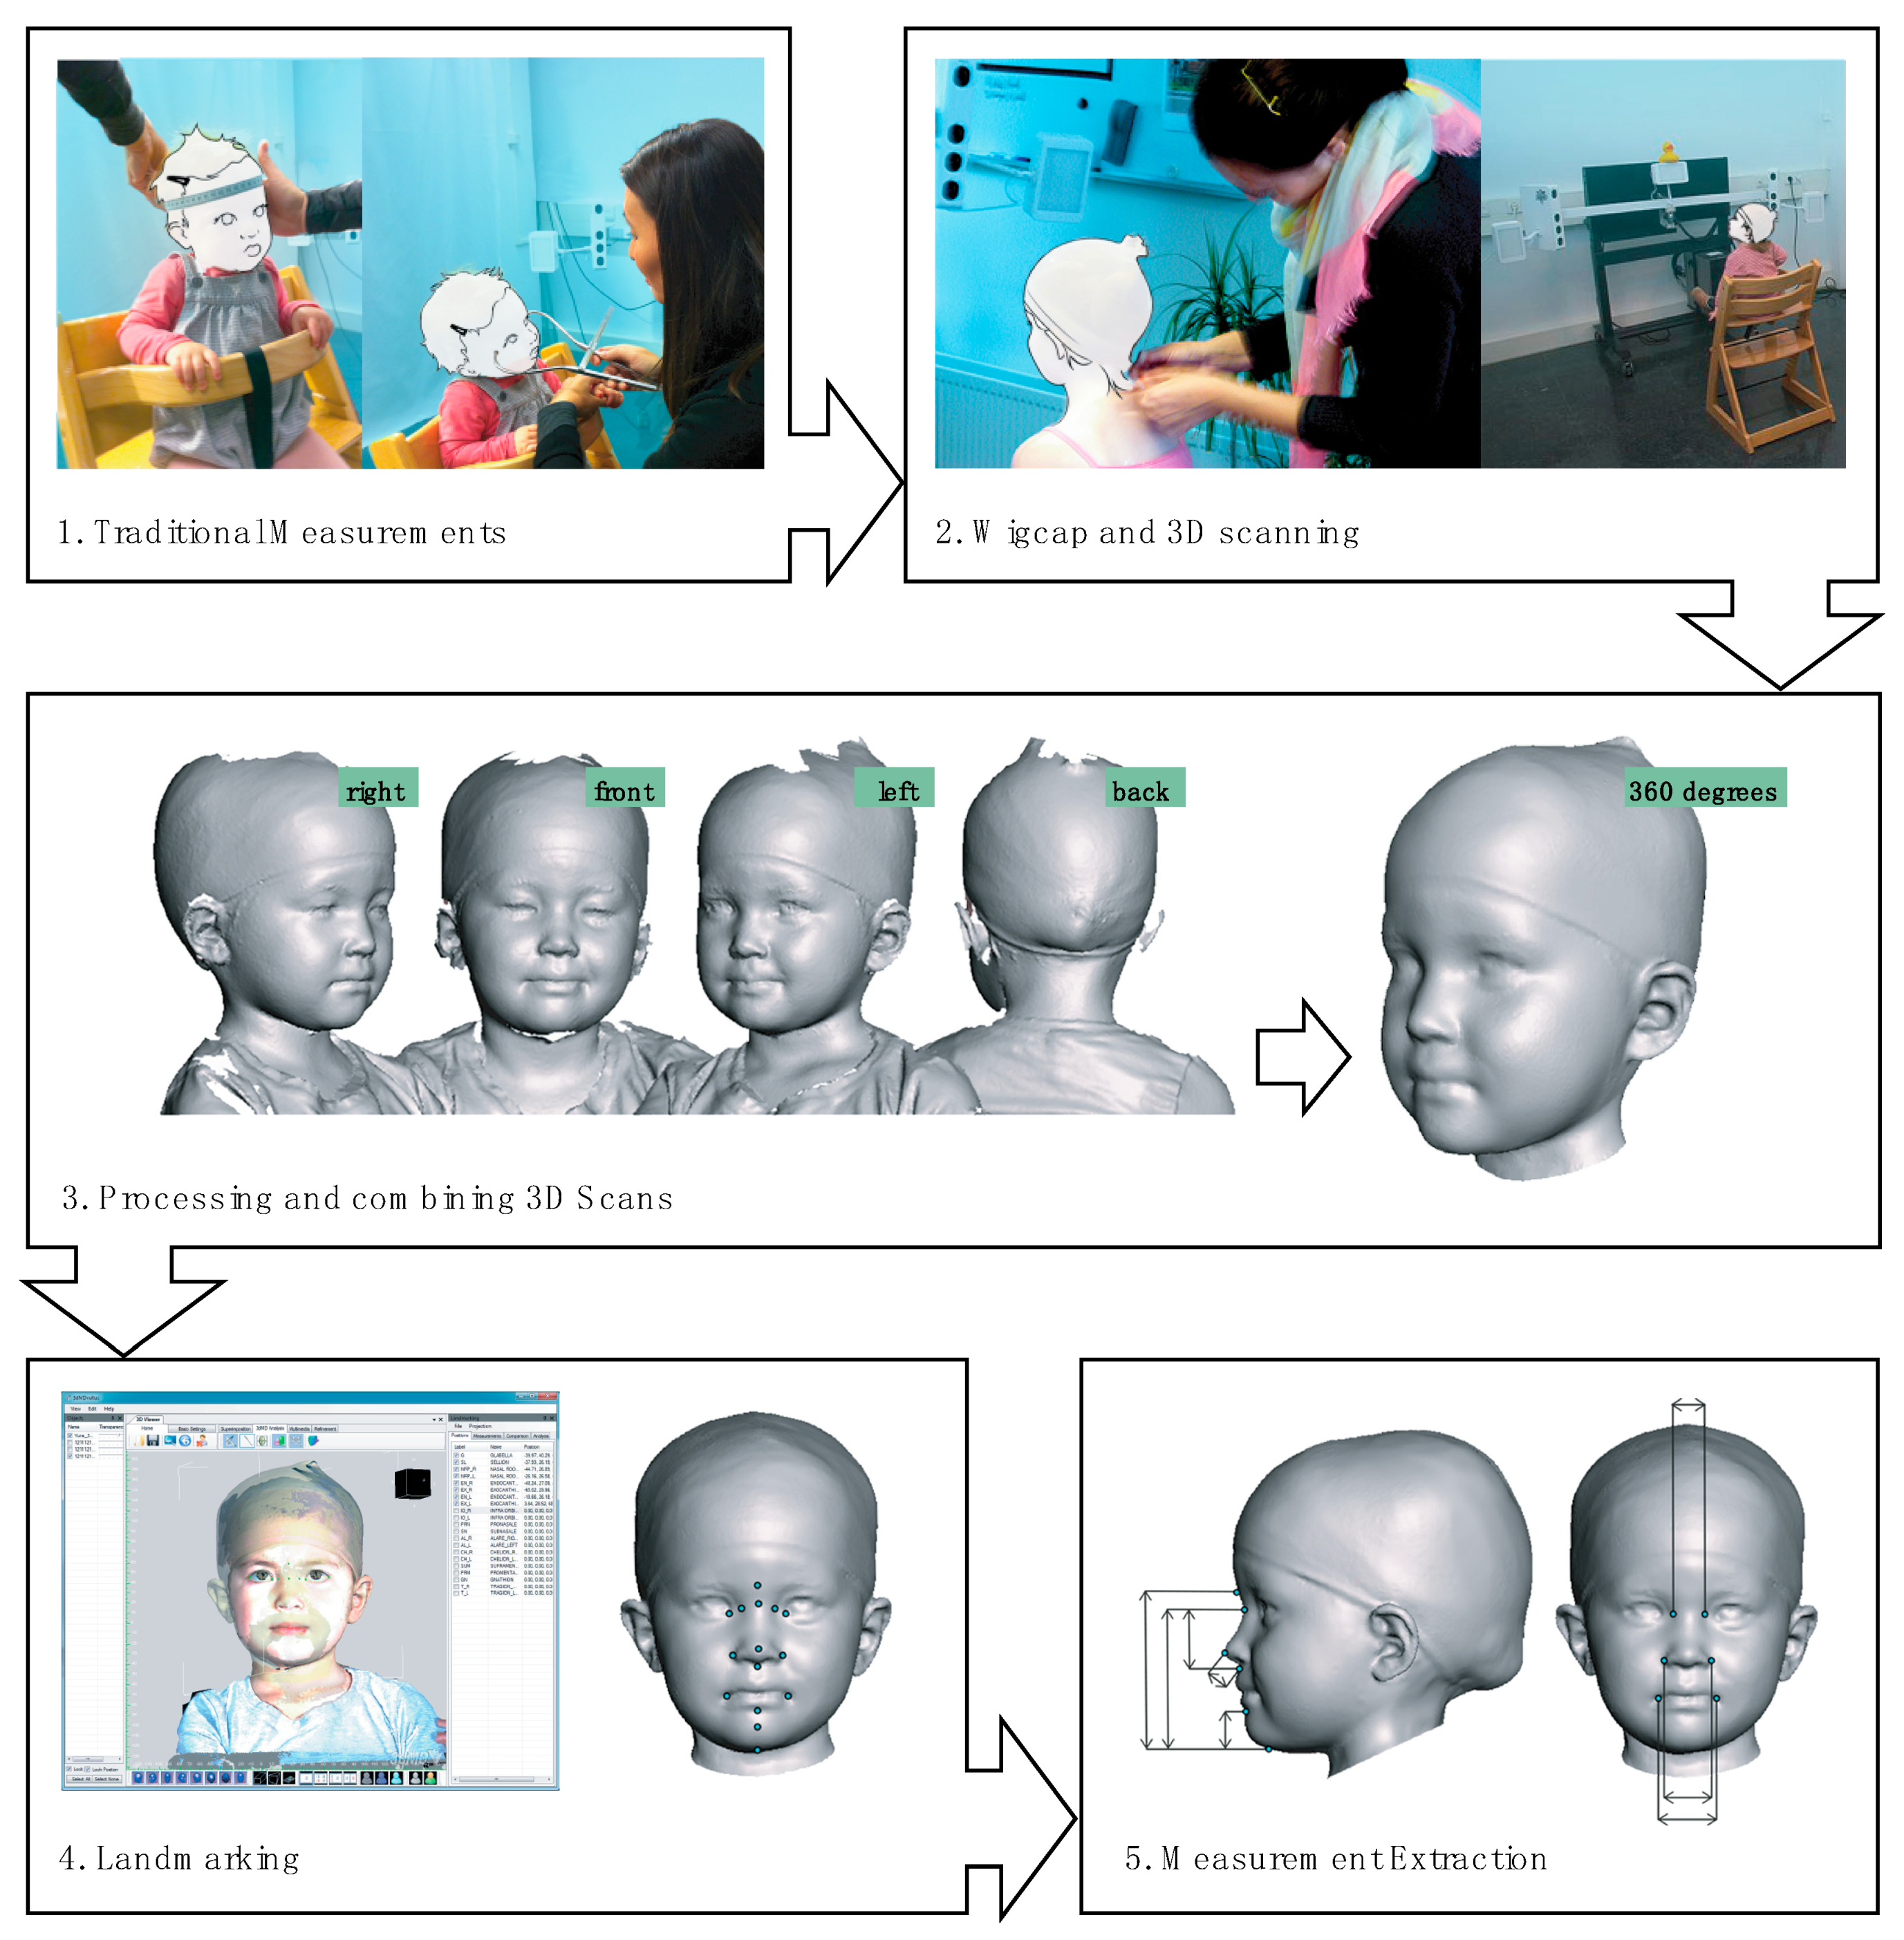
2.1. Participants and Data Collection

A survey was conducted in order to collect anthropometric data of children’s heads and faces [28,40]. A total of 302 Dutch children (128 females, 174 males) aged 6 months to 7 years were recruited through health centres, primary schools and the university. Of the total population, 17.8% (n = 54) children were considered to be of non-native Dutch origin. This was defined as when the country of origin of either one or both of the child’s parents was not the Netherlands. The anthropometric survey was approved by the Human Research Ethics Committee of the Delft University of Technology. Informed consent was obtained from all participants involved in the study. Age categorisation was done according to ISO 15535 [41], which describes the general requirements for establishing anthropometric databases. Age groups were divided as follows: individual age for age group 1 is 0.50 to 1.49 years; for age group 2, it is 1.50 to 2.49; and, for age group 3, it is 2.50 to 3.49, etc.
In the survey, both traditional anthropometric measurements as well as 3D image derived measurements were collected as described in Goto et al. [28] through a five-step procedure. First, the following traditional anthropometric head and face dimensions were recorded; head circumference, head length, head height, head width, and face width, as well as more general measurements such as stature and weight. Second, four 3D images captured from different directions per participant were collected using the 3dMD Face system (3dMD Ltd., London, UK). All children were scanned with a neutral face expression. These images were then combined into a 360 degree 3D image of the head. using Artec Studio 9 software (Artec Group, Luxembourg) and the remaining holes in the image were repaired in Geomagic Studio 2013 software (3D Systems, Rock Hill, SC, USA). After that, a total of nineteen landmarks were marked on each 3D face with 3dMD Vultus 2.1 software (3dMD Ltd., London, UK) as shown in Figure 1. The landmarks that were included in the survey could be identified on the 3D image without palpation. The definitions of these landmark locations can be found in [28]. Finally, eight facial dimensions were measured and extracted after the 3D images were aligned according to the Frankfort horizontal plane (Martin and Knussmann, 1988) using MATLABTM software (The MathWorks, Inc., Natick, MA, USA). An overview of the full procedure is illustrated in Figure 2. Table 1 shows the summarized information of the data including mean and standard deviations for each dimension per age group, males and females combined.

2.2. Data Analysis Procedure

2.2.1. Comparison between Genders

First, an independent t-test was performed to investigate similarities between gender for each dimension per age group. As opposed to anthropometric data of adults, male and female data of children can sometimes be combined depending on the application [20]. When considering a product that needs to fit a certain age range of children, the variability of relevant dimensions has to be taken into account in the design. Because the variability of dimensions of children’s heads and faces due to age is greater than the variability due to gender, it is often valid to combine the data of the different genders [20]. A total of 21 dimensions served as input for the t-test. A multiple comparisons correction was applied by employing the Benjamini–Hochberg procedure [42] with a false discovery rate (FDR) set at 0.05. MATLABTM was used for statistical analysis.

2.2.2. Measurement Based Analysis of Face Variation

The PCA was performed to find important factors that explain the variation of the children’s faces (MATLABTM). The input variables for the PCA in this study were chosen based on a review of previous studies and through discussion in a panel consisting of four anthropometry experts and ergonomists. The input variables for the PCA were considered relevant to mask design and the selection was based on the method proposed in two previous studies by Zhuang et al. [31] and Amirav et al. [25]. Zhuang et al. [31] identified 10 dimensions that were considered related to respirator fit in a study focussing on respirators for the adult civilian workforce namely, minimum frontal breadth, face width, bigonial breadth, face length, inter-pupillary distance, head breadth, nose protrusion, nose breadth, nasal root breadth and subnasale-sellion length. Amirav et al. [25] considered two facial dimensions relevant in the development of aerosol masks for children, namely, the width of the mouth and sellion-pogonion length. To our knowledge, similar information about dimensions related to fit does not exist for ventilation masks for children. As a result, PCA was applied to the following 9 measurements that were chosen for this study; face length, sellion-pogonion length, nose bridge length, mouth width, nose tip protrusion, nasal root breadth, nose breadth, inter-pupillary distance and face width. The definition of each measurement can be found in Table 2. The principal component (PC) loadings were calculated (MATLABTM) to give insight into the influence of different dimensions on the variation.

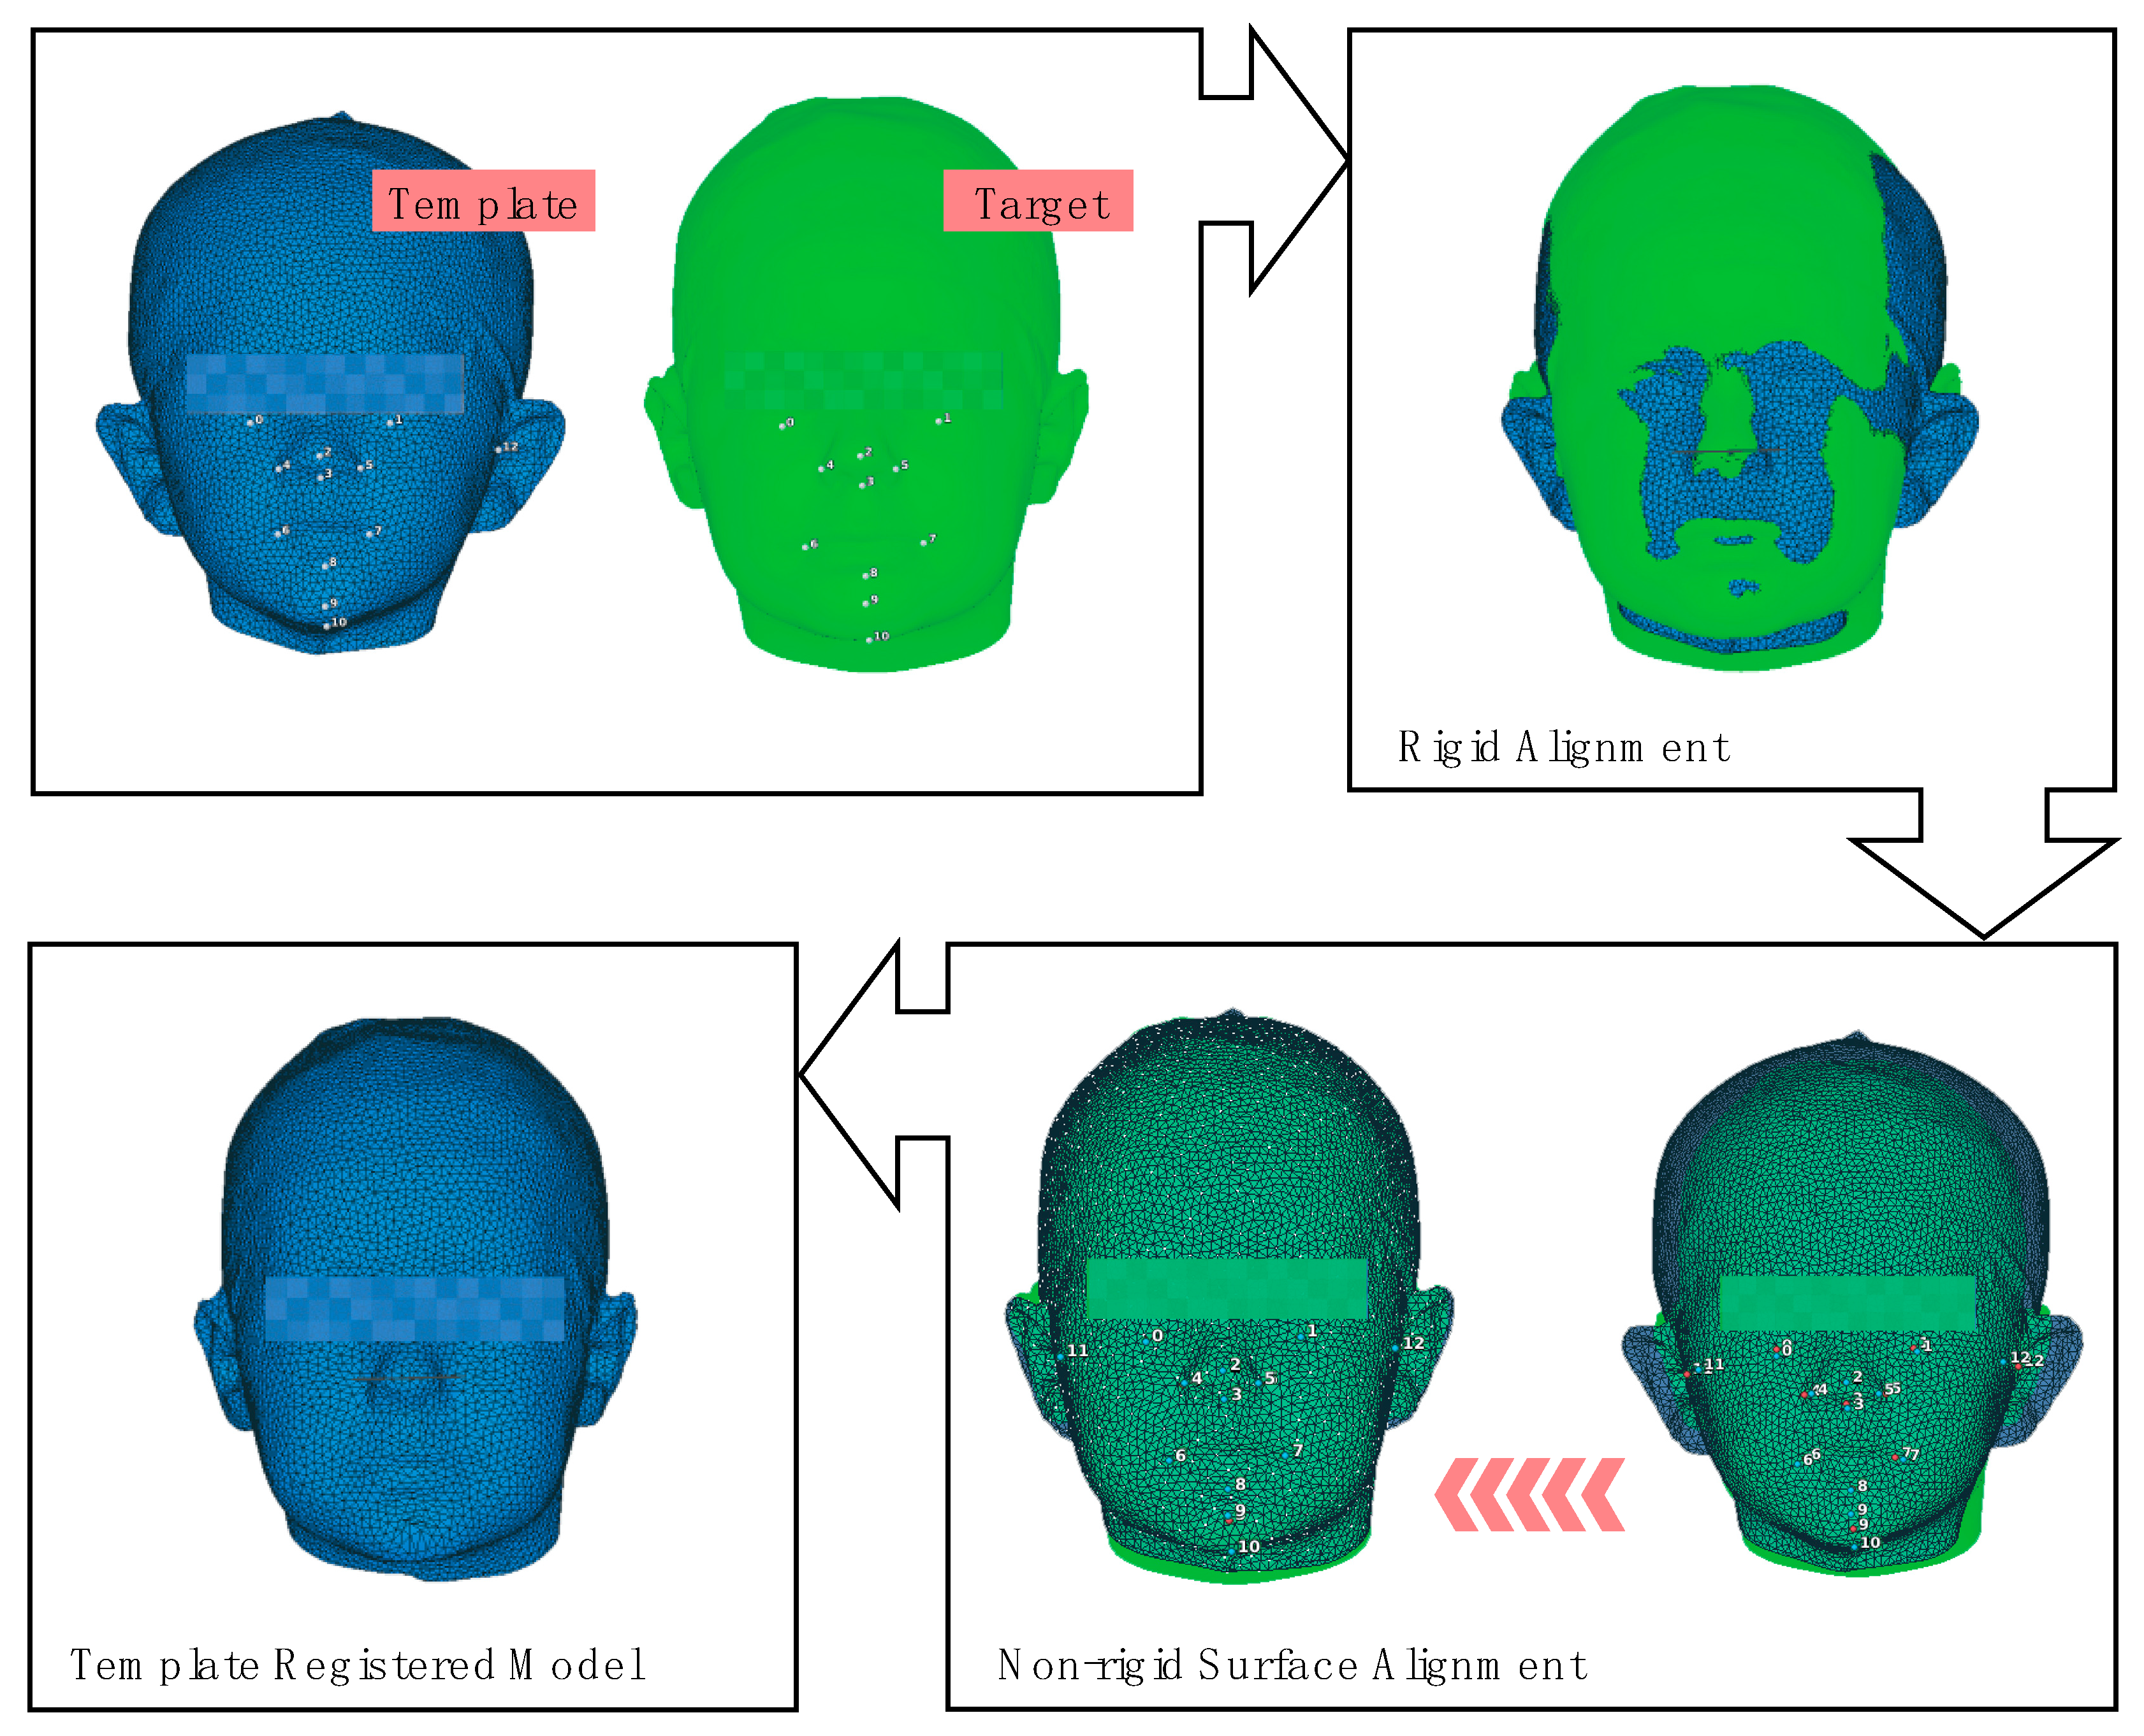
2.2.3. 3D Shape Based Analysis of Face Variation

In order to analyse the shape variation of the 3D face images, a morphological correspondence between each individual face image needs to be realized. Meshes of individual scans contain a varying amount of 3D data points that are distributed in different ways, which makes it impossible to compare them directly. By creating a correspondence, meshes are converted in such a way that the data points are approximately uniformly distributed over the shape, creating meshes that have the same number of data points and connectivity (triangles), with comparable landmark locations. This is referred to as homologous meshes. In this study, the so-called non-rigid template registration method [43] is used using Wrap 3.4 software (Russian3dscanner, Moscow). First, a high-quality individual scan was selected to serve as the template mesh. This scan was then processed to be topologically equivalent to a disc (no surface handles and a single boundary at the neck) and with a uniform distribution of vertices. The obtained template was then used to create these homologous meshes by deforming the template mesh towards each individual face scan (target scan) as is illustrated in Figure 3. The annotated landmarks were used to steer the registration by forcing an exact match. Finally, the homologous meshes were spatially aligned (limited to translation and rotation) via partial Generalized Procrustes Analysis [44].
A PCA was then conducted on the 3D coordinates of the homological meshes in order to analyse and visualize the 3D shape variation of the children’s faces. The principal component analysis was conducted on the x-, y-, and z-values of each vertex of the 3D mesh data using a custom script in Python. The average head mesh was processed in ParaView to extract the relevant facial area through clipping with two interactively positioned planes. The resulting facial region of interest of the average shape was then warped to each individual face through the homology, effectively resulting in corresponding regions of interest for all subjects in the database, forming the input for the facial PCA analysis. Face shape modes that represent the shape variation are visualized along the first 7 Principal Components (PC’s).

3. Results

3.1. Gender Comparison

The differences in dimensions between gender for each age group are shown in Table 3. Overall, the mean head and face measurements for the male participants were larger than the female participants (120 out of 133 comparisons (90%) throughout all the age categories). However, only some incidental significant differences could be observed (7/133). They were scattered throughout different age groups and related to different dimensions. Therefore, for the remainder of this study, we work with a combined dataset in terms of gender.

3.2. Face Variation

A PCA was conducted with the following dimensions; face length, sellion-pogonion length, nose bridge length, mouth width, nose tip protrusion, nasal root breadth, nose breadth, inter-pupillary distance and face width. The plot in Figure 4 shows the cumulative variance explained of each component. The threshold of the cumulative variance was set at 90% with each individual PC explaining at least 5% of the variance, resulting in the five PC’s that are presented in Table 4. The first five PC’s account for 90.39% of the total variation of the sample. The PC loadings of the first principal component (PC1) are all positive and relatively high. This means that each dimension contributes considerably to PC1 and thus captures the overall size and shape of the face. PC1 explains 56.94% of the variation. The PC loadings of the length related dimensions are all negative for the second principal component. This means that 12.22% of the variation is more width related, varying from broader shorter faces with less protruded noses (high PC 2 loading) to longer narrow faces with more protruded noses (low PC 2 loading). The general loadings of PC 2 to 5 are relatively low, which indicates that the differences in face shape are smaller.
The first and second principal components’ scores are calculated with the eigenvalues for each component for each participant as follows:
PC1 = 0.62 × (face width) + 0.91 × (face length) + 0.85 × (sellion-pogonion length) + 0.82 × (inter-pupillary distance) + 0.64 × (nasal root width) + 0.77 × (nasal bridge length) + 0.75 × (nasal tip protrusion) + 0.73 × (nose width) + 0.65 × (width of mouth).
PC2 = 0.31 × (face width) + −0.32 × (face length) + −0.39 × (sellion-pogonion length) + 0.30 × (inter-pupillary distance) + 0.47 × (nasal root width) + −0.46 × (nasal bridge length) + −0.19 × (nasal tip protrusion) + 0.17 × (nose width) + 0.41× (width of mouth).

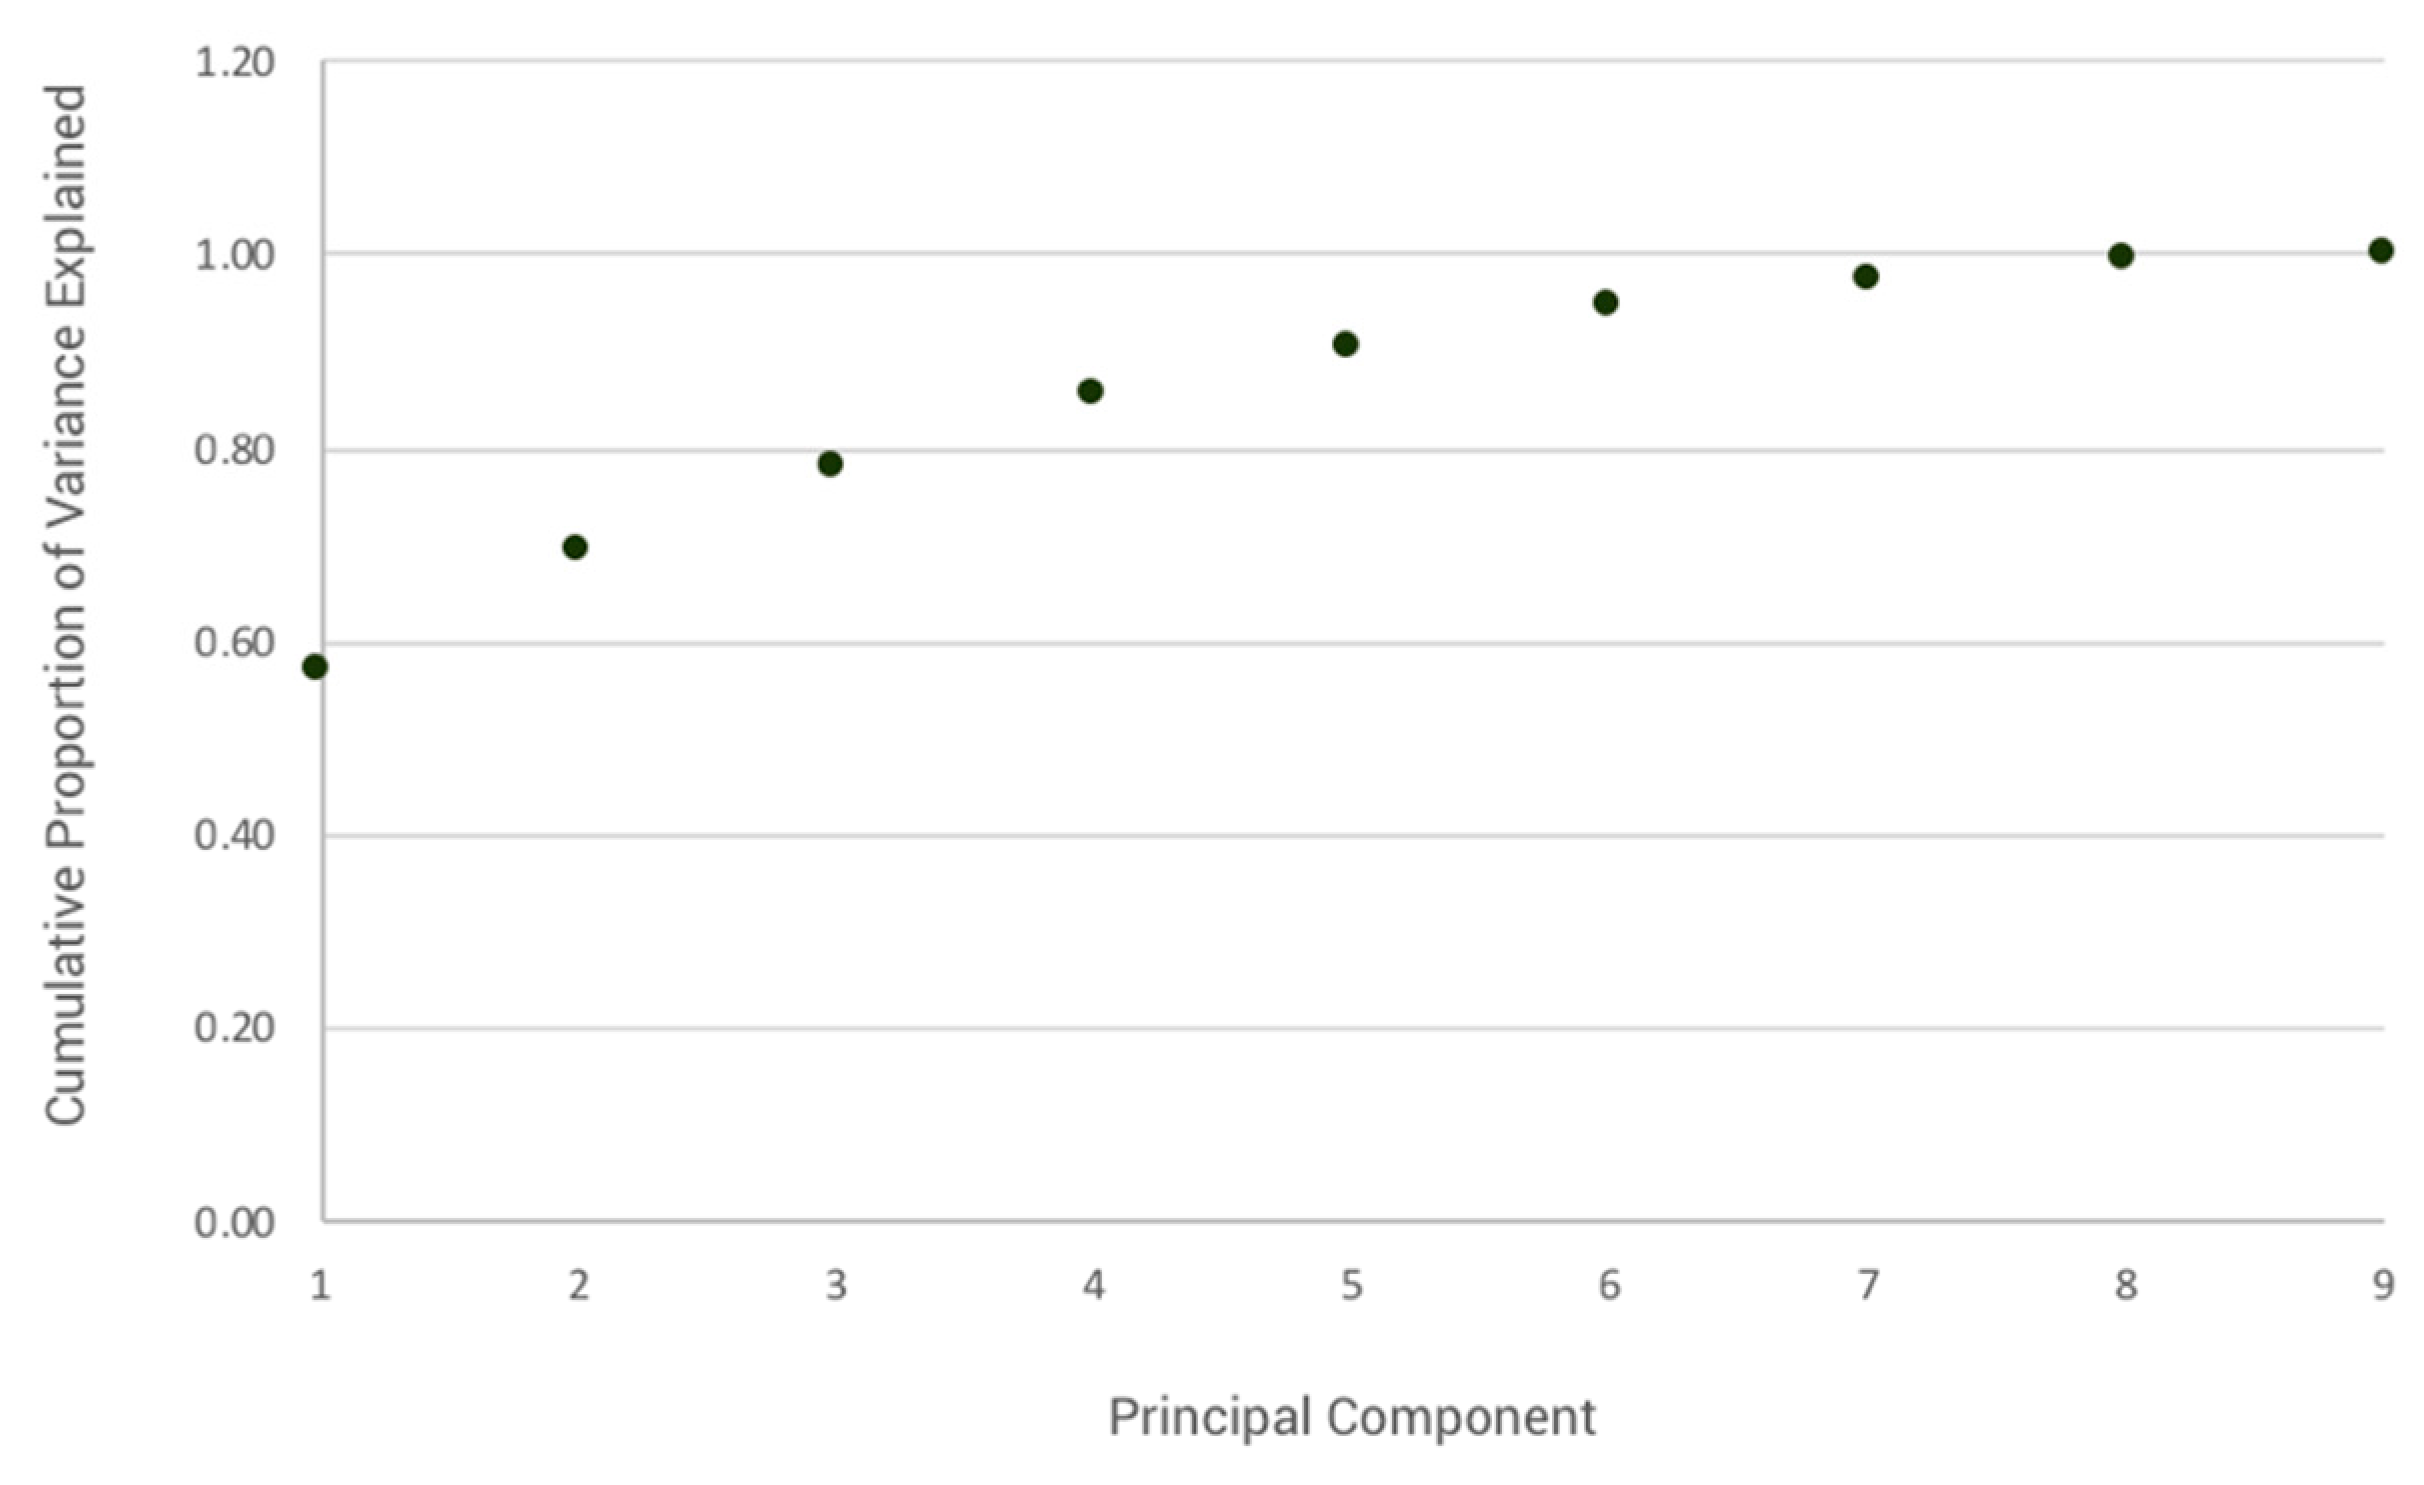
3.3. Face Shape Variation

A second PCA was conducted on the face area in order to investigate the shape variation of the children’s faces. The PCA was conducted on the vertices of the mesh of the face area. The first seven principal component scores were extracted, which explained at least 90% of the variation of the face shapes of the sample (see Figure 5 for the cumulative proportion of the explained variance). The PC based face shape modes are visualised in Figure 6, together with the colour map, projected on the mean, which visualises the magnitude of displacement for the shape mode per PC.
The first PC describes the variation of the overall size of the face, changing from small to large and accounts for 72% of the total variation. The second PC is related to the width of the face, varying from narrow to wide faces. The third PC is more related to the width of the forehead and the length and angle of the chin whilst the fourth PC shows the variation of the shape of the forehead related to the shape of the jaw. The fifth component shows the variation of the shape of the jaw and the depth of the face and, for the sixth PC, the variation represents the ratio between the lower face height and the head height and variance in nasal tip protrusion. Finally, the seventh PC shows the variation in face and jaw shape and the nose and lip protrusion. The second to seventh PC respectively account for 6%, 4%, 3%, 3%, 2%, and 1% of the variability. Figure 7 shows the scatter plot of the sample along the first and second PC’s including the different shape modes.

4. Discussion

3D anthropometric data of children’s faces are necessary in order to develop head and face gear with a proper fit. However, detailed (3D) anthropometric data of children’s heads and faces are still lacking, even though there is a clear demand from the industry [45]. The aim of this study was to map the variation of the size and shape of children’s faces, with a focus on the area relevant to mask design, by a multivariate and shape-based approach. An independent t-test was conducted in order to compare differences between gender, and the results showed that only 20 out of the 252 comparisons were considered significantly different, and these differences appeared to be distributed among the dimensions. When considering anthropometric data of children of a certain age range for applications in product design, genders can often be combined because of the greater variability of different dimensions compared to the variability due to gender [20]. Therefore, the PCA was conducted without differentiating between gender.
In addition, the children’s dataset was not classified in age groups for the PCA. When designing a product for children within a certain age range, it is often more appropriate to investigate the variability of relevant dimensions irrespective of age [24,46]. There is a large variation in size amongst children within the same age group, which results in an overlap between successive age groups for most of the body dimensions [28]. In addition, the mean values and standard deviations of these body dimensions increase with age, which indicates an increasing differentiation among age groups. The differences in body shape between children of the same age will become larger and larger [46]. Indeed, the scatterplot of the PC scores (Figure 8) shows that colours representing each age group are scattered throughout the graph, which illustrates the overlap between different age groups for multiple face dimensions.
A PCA was conducted on a selection of relevant dimensions for mask design, in an attempt to describe the morphological trend in the dataset to be used in the development of a ventilation mask. The result of the PCA describes the morphological distribution of the children’s faces over an age span of 0.5 to 7 years. The first principal component describes the variation in the overall size of the face. While the PC1 score increases, the overall size of the face also increases. The second component describes the width of the face. Children with a relatively high PC 2 score have short and broad faces, whereas children with a low PC 2 score have longer and narrower faces. The findings of this study are in agreement with the study of Seo et al. [26] who studied facial dimensions of Korean children for respirator design, where face length and face width were also found to influence the variation the strongest. Interestingly, Zhuang et al. [31] use a similar description for the size categories of adults based on a PCA as part of his study for the development of a new fit test panel for respirators—namely, small, medium, large, short-wide and long-narrow. This suggests that the overall characteristics that describe the face variation are similar for adults; however, there is one clear difference. The relatively high scores for PC 1 in this dataset (0.623–0.907) compared to the PC 1 scores for adults (0.194–0.426) indicate that the overall size of the face varies more in children. This can be due to age differences, resulting in a relatively larger difference between the smallest face and the largest face in the children’s dataset.
A shape based PCA offers an even more detailed way of investigating face shapes. By conducting a PCA on the 3D location of the vertices of each 3D face area, the face shape variation of the dataset could be revealed. In this study, the first seven PC’s were selected in order to investigate the shape variation. When determining the number of relevant principle components, a selection of components needs to be made that explain a cumulative percentage of the population. In this study, these seven PC’s explain 91% of the total variation and, for most applications, a threshold between 70% and 90% is considered sufficient [32,47]. The shape variation along each PC is visualized through the shape modes that were generated for the average, +3 and −3 standard deviations. Similar to the measurement based PCA, the first PC describes the variation in the overall size of the face and the second PC describes the variation in the width of the face that resembles the results of the shape based PCA conducted by Zhuang et al. [37] and Luximon et al. [5] for their study of face shape variations of U.S. civilian workers and Chinese adults, respectively. The shape variations in the remaining PC’s are more subtle and contribute less to the overall variation.
Apart from the shape modes that are previously presented in Figure 6 and Figure 7, and in order to illustrate the face variation of real participants, Figure 8 shows the measurement-based PC scatterplot with a preliminary selection of 3D face scans of eight participants. A selection was made of five faces that were distributed among the PC 1-axis, including a small (A), close to average (F) and a large (I) face. Secondly, for B and C, two additional faces were selected to illustrate the differences along the PC2 axis. Next, to illustrate the variation in shape and the possible implications for the design of a ventilation mask, contours were projected on each of these faces (Rhinoceros®). Each contour passes the sellion, pogonion and approximately 10 mm distance from the left and right cheillion landmarks. They were then aligned at the sellion landmark. These points were selected because they could represent the preliminary contour of the rim of the ventilation mask. This illustration shows that the contours indeed not only vary in size but also in shape (Figure 9). When analysing the contours from the front, we observe that, as the contour size increases, the shape varies but this does not necessarily scale proportionally. From the side, we observe that, as the contour increases in height, the depth of the contour also increases. This suggests that, when developing ventilation masks for children, one should take into account the facial characteristics as well as the size in order to achieve a good fit—for instance, by using a parametric design that is adjusted to different face shapes rather than simply scaling a product to different sizes.
Both the dimension and shape based PCA give insight into how the face shape of Dutch children of different age groups varies. Each method reveals this information concerning the variation in face shapes in a different way. The dimension based PCA gives insight into which product relevant dimension influences the variation of face shape and to which extent. This helps the designer to understand the relationship between the product relevant dimensions and the face shape variation of the children in the dataset. The shape based PCA helps the designer to understand shape variation in a more visual way and shows how the face-scapes vary. The shape modes that are generated based on the analysis can facilitate the design of face related products in a Computer Aided Design (CAD) environment. For a designer of head and face related products, both analysis methods can be useful and are complementary because they facilitate in organising and presenting the complex 3D data.
However, in order for the designer to be able to conduct a PCA and get the most out of the data, they need advanced knowledge of statistics, the ability to apply custom algorithms for data processing and to translate the results of these analysis to generate shape modes and specific 3D modelling skills to be able to visualize this data. These are not necessarily all in a designer’s repertoire. Nevertheless, the richness of 3D anthropometric data is an advantage when it comes to its versatility in applications, and it can therefore be applied in different phases of the product development process and for different purposes, from product design and sizing to the virtual evaluation of a product’s fit using actual face scans of individuals. This shows that, despite the usefulness of 3D anthropometric data for product design, designers are faced with a dilemma. Either they have to go through the complex process of processing, analyzing, translating and visualizing data alone or with experts in order to utilize the richness that 3D Data can provide, or they have to rely on available tools whose functionality may not always align with the designers’ objectives. Thus, there is a clear need to provide designers with an intuitive way to access and explore body shape variation related to their product design. One step has been made by presenting current data via the so-called Mannequin tool of the DINED platform, which is accessible through https://dined.io.tudelft.nl/en (accessed on 15 May 2021) [48]. This tool implements a regression model relating the 1D measurements to the 3D PCA scores and thus provides a means to generate and explore the variation of children’s 3D head shapes.

Author Contributions

Conceptualization, all coauthors; methodology, L.G., W.L. and T.H.; software, L.G., W.L. and T.H.; validation, L.G., W.L. and T.H.; formal analysis, L.G.; resources, all coauthors; writing—original draft preparation, L.G.; writing—review and editing, all coauthors; visualization, L.G. and T.H.; supervision, J.F.M.M. and R.H.M.G.; project administration, R.H.M.G.; funding acquisition, J.F.M.M. and R.H.M.G. All authors have read and agreed to the published version of the manuscript.

Funding

This research is funded by The Prinses Beatrix Spierfonds, The Netherlands (PZ.PS1101).

Institutional Review Board Statement

The study was conducted according to the guidelines of the Declaration of Helsinki, and approved by the Human Research Ethics Committee (HREC) of the Delft University of Technology.

Informed Consent Statement

Informed consent was obtained from all participants involved in the study.

Data Availability Statement

The data presented in this study are available on request from the corresponding author. The data are not publicly available due to privacy.

Conflicts of Interest

The authors declare no conflict of interest.

References

  1. Hsiao, H. Anthropometric Procedures for Protective Equipment Sizing and Design. Hum. Factors J. Hum. Factors Erg. Soc. 2013, 55, 6–35. [Google Scholar] [CrossRef] [Green Version]
  2. Lee, W.; Yang, X.; Jung, D.; Park, S.; Kim, H.; You, H. Ergonomic evaluation of pilot oxygen mask designs. Appl. Erg. 2018, 67, 133–141. [Google Scholar] [CrossRef] [PubMed] [Green Version]
  3. Ma, Z.; Drinnan, M.; Hyde, P.; Munguia, J. Mask interface for continuous positive airway pressure therapy: Selection and design considerations. Expert Rev. Med. Devices 2018, 15, 725–733. [Google Scholar] [CrossRef] [PubMed] [Green Version]
  4. Nicki, B.; Matt, W.; Heather, E. A Review of the Benefits, Challenges and the Future for Interfaces for Long Term Non-Invasive Ventilation in Children. Int. J. Respir. Pulm. Med. 2018, 5, 1–7. [Google Scholar] [CrossRef]
  5. Luximon, Y.; Ball, R.; Justice, L. The 3D Chinese head and face modeling. Comput. Des. 2012, 44, 40–47. [Google Scholar] [CrossRef]
  6. Lacko, D.; Huysmans, T.; Parizel, P.M.; De Bruyne, G.; Verwulgen, S.; Van Hulle, M.; Sijbers, J. Evaluation of an anthropometric shape model of the human scalp. Appl. Erg. 2015, 48, 70–85. [Google Scholar] [CrossRef]
  7. Zhuang, Z.; Benson, S.; Slice, D.; Viscusi, D.; Lynch, S. Shape analysis of 3D head scan data for U.S. respirator users. EURASIP J. Adv. Signal. Process. 2010, 2010, 248954. [Google Scholar] [CrossRef] [Green Version]
  8. Lee, W.; Lee, B.; Yang, X.; Jung, H.; Bok, I.; Kim, C.; Kwon, O.; You, H. A 3D anthropometric sizing analysis system based on North American CAESAR 3D scan data for design of head wearable products. Comput. Ind. Eng. 2018, 117, 121–130. [Google Scholar] [CrossRef]
  9. Bolkart, T.; Bose, P.; Shu, C.; Wuhrer, S. A general framework to generate sizing systems from 3D motion data applied to face mask design. In Proceedings of the 2014 2nd International Conference on 3D Vision, Tokyo, Japan, 8–11 December 2014; pp. 425–431. [Google Scholar] [CrossRef]
  10. Kouchi, M.; Mochimaru, M. Analysis of 3D face forms for proper sizing and CAD of spectacle frames. Ergonomics 2004, 47, 1499–1516. [Google Scholar] [CrossRef]
  11. Zhuang, Z.; Benson, S.; Viscusi, D. Digital 3-D headforms with facial features representative of the current US workforce. Ergonomics 2010, 53, 661–671. [Google Scholar] [CrossRef]
  12. Yu, Y.; Benson, S.; Cheng, W.; Hsiao, J.; Liu, Y.; Zhuang, Z.; Chen, W. Digital 3-D headforms representative of Chinese workers. Ann. Occup. Hyg. 2011, 56, 113–122. [Google Scholar] [CrossRef] [Green Version]
  13. Ellena, T.; Skals, S.; Subic, A.; Mustafa, H.; Pang, T.Y. 3D digital headform models of Australian cyclists. Appl. Erg. 2017, 59, 11–18. [Google Scholar] [CrossRef]
  14. Liu, H.; Li, Z.; Zheng, L. Rapid preliminary helmet shell design based on three-dimensional anthropometric head data. J. Eng. Des. 2008, 19, 45–54. [Google Scholar] [CrossRef]
  15. Lee, W.; Jeong, J.; Park, J.; Jeon, E.; Kim, H.; Jung, D.; Park, S.; You, H. Analysis of the facial measurements of Korean Air Force pilots for oxygen mask design. Ergonomics 2013, 56, 1451–1464. [Google Scholar] [CrossRef] [PubMed]
  16. Chu, C.-H.; Huang, S.-H.; Yang, C.-K.; Tseng, C.-Y. Design customization of respiratory mask based on 3D face anthropometric data. Int. J. Precis. Eng. Manuf. 2015, 16, 487–494. [Google Scholar] [CrossRef]
  17. Lacko, D.; Vleugels, J.; Fransen, E.; Huysmans, T.; De Bruyne, G.; Van Hulle, M.; Sijbers, J.; Verwulgen, S. Ergonomic design of an EEG headset using 3D anthropometry. Appl. Erg. 2017, 58, 128–136. [Google Scholar] [CrossRef]
  18. Ulijaszek, S.; Bogin, B. Patterns of Human Growth. Man 1989, 24, 529. [Google Scholar] [CrossRef]
  19. Child Anthropometry: A literature scan of national and international publications; The Canadian Institute of Child Health: Ottawa, CA, USA, 2007.
  20. Bradtmiller, B. Sizing head forms: Design and development. SAE Tech. Pap. Ser. 1996, 443–450. [Google Scholar] [CrossRef]
  21. Kim, H.; Seo, H.; Myong, J.-P.; Yoon, J.-S.; Song, Y.; Kim, C. Developing Yellow Dust and Fine Particulate Masks for Children. J. Korean Soc. Occup. Env. Hyg. 2016, 26, 350–366. [Google Scholar] [CrossRef] [Green Version]
  22. Young, J.W. Selected Facial Measurements of Children for Oxygen-Mask Design; AM 66-9; United States Office of Aviation Medicine: Washington, DC, USA, 1966; pp. 1–11. [Google Scholar]
  23. Amirav, I.; Masumbuko, C.K.; Hawkes, M.T.; Solomon, I.; Aldar, Y.; Margalit, G.; Zvirin, A.; Honen, Y.; Sivasivugha, E.S.; Kimmel, R. 3D analysis of child facial dimensions for design of medical devices in low-middle income countries (LMIC). PLoS ONE 2019, 14, e0216548. [Google Scholar] [CrossRef] [Green Version]
  24. Lueder, R.; Berg Rice, V.J. (Eds.) Ergonomics for Children—Designing Products and Places for Toddlers to Teens; Taylor & Francis Group: London, UK, 2008; ISBN 9780415304740. [Google Scholar]
  25. Amirav, I.; Luder, A.S.; Halamish, A.; Raviv, D.; Kimmel, R.; Waisman, D.; Newhouse, M.T. Design of aerosol face masks for children using computerized 3D face analysis. J. Aerosol Med. Pulm. Drug Deliv. 2014, 27, 272–278. [Google Scholar] [CrossRef]
  26. Seo, H.; Song, Y.; Kim, C.; Kim, H. Characteristics of Korean children’s facial anthropometry evaluated by three-dimensional imaging. J. Int. Soc. Respir. Prot. 2016, 33, 23–38. [Google Scholar]
  27. Lee, W.; Goto, L.; Molenbroek, J.F.M.; Goossens, R.H.M.; Wang, C.C.C. A shape-based sizing system for facial wearable product design. In Proceedings of the 5th International Digital Human Modeling Symposium; Wischniewski, S., Bonin, D., Alexander, T., Eds.; Federal Institute for Occupational Safety and Health: Berlin, Germany, 2017; pp. 150–158. [Google Scholar]
  28. Goto, L.; Lee, W.; Molenbroek, J.F.; Cabo, A.J.; Goossens, R.H. Traditional and 3D scan extracted measurements of the heads and faces of Dutch children. Int. J. Ind. Erg. 2019, 73, 73. [Google Scholar] [CrossRef] [Green Version]
  29. Luximon, A.; Zhang, Y.; Luximon, Y.; Xiao, M. Sizing and grading for wearable products. Comput. Des. 2012, 44, 77–84. [Google Scholar] [CrossRef]
  30. Molenbroek, J.F.; Goossens, R.H.; You, H.; Goto, L.; Jung, H.; Yang, X.; Lee, W. Application of massive 3D head and facial scan datasets in ergonomic head-product design. Int. J. Digit. Hum. 2016, 1, 344. [Google Scholar] [CrossRef]
  31. Zhuang, Z.; Bradtmiller, B.; Shaffer, R.E. New Respirator Fit Test Panels Representing the Current U.S. Civilian Work Force. J. Occup. Env. Hyg. 2007, 4, 647–659. [Google Scholar] [CrossRef] [PubMed]
  32. Lacko, D.; Huysmans, T.; Vleugels, J.; De Bruyne, G.; Van Hulle, M.M.; Sijbers, J.; Verwulgen, S. Product sizing with 3D anthropometry andk-medoids clustering. Comput. Des. 2017, 91, 60–74. [Google Scholar] [CrossRef]
  33. Xi, P.; Shu, C. Consistent parameterization and statistical analysis of human head scans. Vis. Comput. 2009, 25, 863–871. [Google Scholar] [CrossRef]
  34. Meunier, P.; Shu, C.; Xi, P. Revealing the internal structure of human variability for design purposes. In Proceedings of the 17th World Congress on Ergonomics, Beijing, China, 9 August 2009. [Google Scholar]
  35. Medialdea, L.; Bazaco, C.; Del Campo, M.D.D.; Sierra-Martínez, C.; González-José, R.; Vargas, A.; Marrodán, M.D. Describing the children’s body shape by means of Geometric Morphometric techniques. Am. J. Phys. Anthr. 2019, 168, 651–664. [Google Scholar] [CrossRef] [PubMed]
  36. Chen, W.; Zhuang, Z.; Benson, S.; Du, L.; Yu, D.; Landsittel, U.; Wang, L.; Viscusi, D.; Shaffer, R.E. New Respirator Fit Test Panels Representing the Current Chinese Civilian Workers. Ann. Occup. Hyg. 2009, 53, 297–305. [Google Scholar] [CrossRef] [Green Version]
  37. Zhuang, Z.; Shu, C.; Xi, P.; Bergman, M.; Joseph, M. Head-and-face shape variations of U.S. civilian workers. Appl. Erg. 2013, 44, 775–784. [Google Scholar] [CrossRef] [PubMed] [Green Version]
  38. Luximon, Y.; Ball, R.M.; Justice, L. The Chinese face: A 3D anthropometric analysis. In Proceedings of the 8th International Symposium on Tools and Methods of Competitive Engineering, Ancona, Italy, 12–16 April 2010; Volume 1, pp. 255–265. [Google Scholar]
  39. Luximon, Y.; Ball, R.M.; Chow, E.H. A design and evaluation tool using 3D head templates. Comput. Des. Appl. 2015, 13, 153–161. [Google Scholar] [CrossRef] [Green Version]
  40. Goto, L.; Molenbroek, J.F.; Goossens, R.H. 3D Anthropometric Data Set of the Head and Face of Children Aged 0.5–6 Years for Design Applications. In Proceedings of the Proceedings of the 4th International Conference on 3D Body Scanning Technologies, Long Beach, CA, USA, 19–20 November 2013; pp. 157–165. [Google Scholar]
  41. ISO 15535. General Requirements for Establishing Anthropometric Databases; ISO: Geneva, Switzerland, 2007. [Google Scholar]
  42. Benjamini, Y.; Hochberg, Y. Controlling the False Discovery Rate: A Practical and Powerful Approach to Multiple Testing. J. R. Stat. Soc. Ser. B 1995, 57, 289–300. [Google Scholar] [CrossRef]
  43. Dyke, R.M.; Zhou, F.; Lai, Y.-K.; Rosin, P.L.; Guo, D.; Li, K.; Marin, R.; Yang, J. SHREC’20: Non-rigid shape correspondence of physically-based deformations. In Proceedings of the Eurographics Workshop on 3D Object Retrieval; Schreck, T., Theoharis, T., Eds.; The Eurographics Association: Graz, Austria, 2020. [Google Scholar]
  44. Gower, J.C. Generalized procrustes analysis. Psychometrika 1975, 40, 33–51. [Google Scholar] [CrossRef]
  45. Solves, C.; Nácher, B.; Benages, L.; Marzo, R.; Soriano, C.; Alemany, S. Research on the Existence and Availability of Anthropometric Data of Children. Internal Report of Deutsches Institut für Normung; 2017; Unpublished. [Google Scholar]
  46. Steenbekkers, L.P.A. Child Development, Design Implications and Accident Prevention; Delft University Press: Delft, The Netherlands, 1993; ISBN 90-6275-895-9. [Google Scholar]
  47. Jolliffe, I.T.; Cadima, J. Principal component analysis: A review and recent developments. Philos. Trans. R. Soc. A Math. Phys. Eng. Sci. 2016, 374, 20150202. [Google Scholar] [CrossRef]
  48. Huysmans, T.; Goto, L.; Molenbroek, J.F.M.; Goossens, R.H.M. Dined mannequin: An open platform for 3D anthropometry. Tijdschr. Hum. Factors 2020, 45, 4–7. [Google Scholar]
Figure 1. The landmarks included in this study; 1. glabella, 2. sellion, 3. pronasale, 4. subnasale, 5. Sublabiale, 6. Pogonion, 7. menton, 8/9. nasal root point, (right/left), 10/11. endocanthion (right/left), 12/13. infraorbitale (right/left), 14/15. tragion (right/left), 16/17. alare (right/left) and 18/19. cheilion (right/left) [28].
Applsci 11 06843 g001
Figure 2. Data collection and processing of the 3D scan images, an overview of the steps (print screen: 3dMD Vultus software).
Applsci 11 06843 g002
Figure 3. The template registration process.
Applsci 11 06843 g003
Figure 4. Plot showing the cumulative proportion of the variance explained for each PC. The first 5 PC’s account for 90.39% of the total variance.
Applsci 11 06843 g004
Figure 5. Plot showing the cumulative proportion of the variance explained. The first 7 PC’s explain 91% of the variance.
Applsci 11 06843 g005
Figure 6. Visualisation of the first seven principal components. Each principal component is shown as the mean, −3 (left) and +3 (right) standard deviations together with the colour map of the magnitude of displacement (projected on the mean) of the respective principal component.
Applsci 11 06843 g006
Figure 7. Scatterplot of shape based PCA including shape modes (−1.5 and +1.5 standard deviations).
Applsci 11 06843 g007
Figure 8. Scatterplot of the measurements based principal component scores including examples of different face shapes.
Applsci 11 06843 g008
Figure 9. A comparison between contours of a facemask of children with different face shapes and sizes (mm). Lettering refers to the face examples as shown in Figure 8. Front view (top) and side view (below) and an example of a 3D scan with the contour projection (face example F).
Applsci 11 06843 g009
Table 1. Mean and standard deviation for each dimension per age group where age group 1 consists of children aged 0.50 to 1.49 years, age group 2 consists of children aged 1.50 to 2.49, etc.
Age Group 1
(n = 33)
Age Group 2
(n = 28)
Age Group 3
(n = 29)
Age Group 4
(n = 32)
Age Group 5
(n = 67)
Age Group 6
(n = 65)
Age Group 7
(n = 49)
MeanSDMeanSDMeanSDMeanSDMeanSDMeanSDMeanSD
Stature *768.755.8875.365.1994.950.61068.653.61116.451.91195.953.31230.553.3
Weight *9.61.412.41.915.11.818.22.819.52.522.12.923.42.5
Head circumference *460.917.5484.012.7497.618.9509.416.9509.413.5511.315.7513.214.1
Head width *126.88.2135.07.5136.36.3140.25.4140.56.8143.56.5144.47.4
Head length *154.38.0167.17.0169.611.2175.07.3177.37.0177.17.3177.87.9
Head height *160.89.5173.110.6178.814.2186.710.5189.09.9192.010.6194.68.8
Face width *100.96.0103.26.9105.44.6108.65.3107.95.5109.76.3111.46.8
Face length90.64.896.55.3100.24.4104.35.7107.05.5109.75.6111.24.8
Sellion-menton length76.94.681.83.986.93.491.64.793.34.196.24.696.94.5
Lower face length48.83.651.32.954.12.857.04.057.43.558.53.758.73.4
Intercanthal width29.32.430.42.231.32.431.92.132.22.132.52.432.82.4
Nasal root breadth19.31.919.62.120.51.521.11.721.21.721.41.921.51.8
Nose length28.11.830.42.432.82.234.62.135.92.037.62.538.12.6
Nose bridge length18.91.820.62.222.41.723.62.224.32.025.72.225.92.8
Nasal tip protrusion11.50.912.01.313.01.613.81.214.51.115.01.415.31.1
Nose width25.71.526.51.927.82.227.81.928.21.528.71.629.11.5
Mouth width34.34.734.93.036.72.937.02.938.03.039.23.340.43.2
Chin height18.12.220.92.323.72.324.93.324.92.725.72.426.22.5
Sellion-sublabiale length58.84.560.93.463.33.066.73.668.33.570.53.970.73.8
Sellion-pogonion length67.24.969.93.773.74.276.43.878.53.980.44.380.74.2
Inter-pupillary distance50.42.852.52.553.42.754.92.855.32.356.02.957.13.0
* Dimensions measured by the traditional measurement method.
Table 2. Definitions of the nine selected measurements for the measurements based PCA.
MeasurementDefinition
Face lengthStraight-line distance between the sellion (s) and menton (me) landmarks
Sellion-pogonion lengthStraight-line distance between the sellion (s) and pogonion (pg) landmarks
Nose bridge lengthStraight-line distance between the sellion (s) to pronasale (prn) landmarks
Mouth widthStraight-line distance between the left and right chelion landmarks (ch-ch)
Nose tip protrusionStraight-line distance between the the subnasale (sn) and the pronasale (prn) landmarks
Nasal root breadthThe horizontal breadth of the nosals root spanning from the left nasal root point to the right (nrp-nrp)
Nose breadthStraight line distance between the left and right alare landmarks (al-al)
Inter-pupillary distanceThe straight-line distance between the centre of the left and the centre of the right pupil
Face widthHorizontal breadth between the left and right zygion landmarks (zy-zy)
Table 3. Independent t-test between boys and girls for each age group (mean difference in mm).
Age Group 1Age Group 2Age Group 3Age Group 4Age Group 5Age Group 6Age Group 7
Mean
Diff
pMean
Diff
pMean
Diff
pMean
Diff
pMean
Diff
pMean
Diff
pMean
Diff
p
Stature21.000.33−8.170.76−21.560.2752.850.01 *−5.950.6515.040.262.490.87
Weight0.700.18−0.060.940.360.601.960.090.310.621.040.14−0.360.62
Head circumference19.900.00 **2.540.6312.030.093.380.637.510.03 *7.000.077.420.06
Head width5.650.103.500.293.430.155.080.02 *4.500.01 **6.880.115.180.01 *
Head length1.510.69−1.260.670.150.975.670.053.070.082.350.203.400.13
Head height−4.130.392.630.58−1.570.779.880.02 *7.950.00 **4.780.077.040.00 **
Face width4.240.092.380.443.320.051.750.431.900.17−0.370.82−0.420.83
Face length1.320.453.510.101.210.473.520.132.820.02 *1.390.322.380.08
Sellion-menton length1.740.301.960.210.700.593.020.121.940.061.520.193.350.01 *
Lower face length1.020.431.360.240.500.643.030.061.830.03 *0.100.912.100.03 *
Intercanthal width1.890.02 *−0.090.920.970.291.410.100.430.410.020.980.460.50
Nasal root breadth1.700.01 *0.440.600.540.350.730.300.270.52−0.010.990.130.80
Nose length0.720.270.600.540.200.81−0.020.990.100.841.420.02 *1.250.10
Nose bridge length0.450.480.960.280.380.560.010.99−0.070.890.550.321.490.06
Nasal tip protrusion0.220.49−0.270.600.150.810.120.820.030.910.770.03 *−0.050.87
Nose width0.730.171.200.120.830.320.770.341.310.00 **0.780.060.590.18
Mouth width3.380.04 *0.450.721.000.361.720.152.590.00 **0.150.86−0.080.93
Chin height−0.690.390.010.99−0.670.442.120.121.210.070.090.880.210.77
Sellion-sublabiale length2.430.131.950.151.370.230.890.550.720.411.430.153.140.00 **
Sellion-pogonion length2.550.141.410.341.810.262.780.070.610.532.100.052.230.06
Inter-pupillary distance2.320.02 *0.650.520.560.581.930.090.690.23−0.010.990.690.43
* p < 0.05. ** significant with FDR correction set at 0.05.
Table 4. PC loadings resulting from the dimension based PCA.
Component Matrix
Face DimensionsPC1PC2PC3PC4PC5
Face width0.620.310.280.620.17
Face Length0.91−0.32−0.010.06−0.01
Sellion-pogonion length0.85−0.390.070.07−0.09
Inter-pupillary distance0.820.30−0.31−0.07−0.15
Nasal root width0.640.47−0.56−0.05−0.04
Nasal bridge length0.77−0.46−0.07−0.08−0.12
Nasal tip protrusion0.75−0.19−0.13−0.270.48
Nose width0.730.170.36−0.28−0.36
Width of mouth0.650.410.42−0.280.18
Variance explained (%)56.9412.229.007.075.16
Cumulative variance
explained (%)
56.9469.1678.1685.2390.39
Publisher’s Note: MDPI stays neutral with regard to jurisdictional claims in published maps and institutional affiliations.

