
Exploitation of a Particle Swarm Optimization Algorithm for Designing a Lightweight Parallel Hybrid Electric Vehicle

 ,
,  ,
, 

Abstract
:1. Introduction
2. HEV Modelling and Control
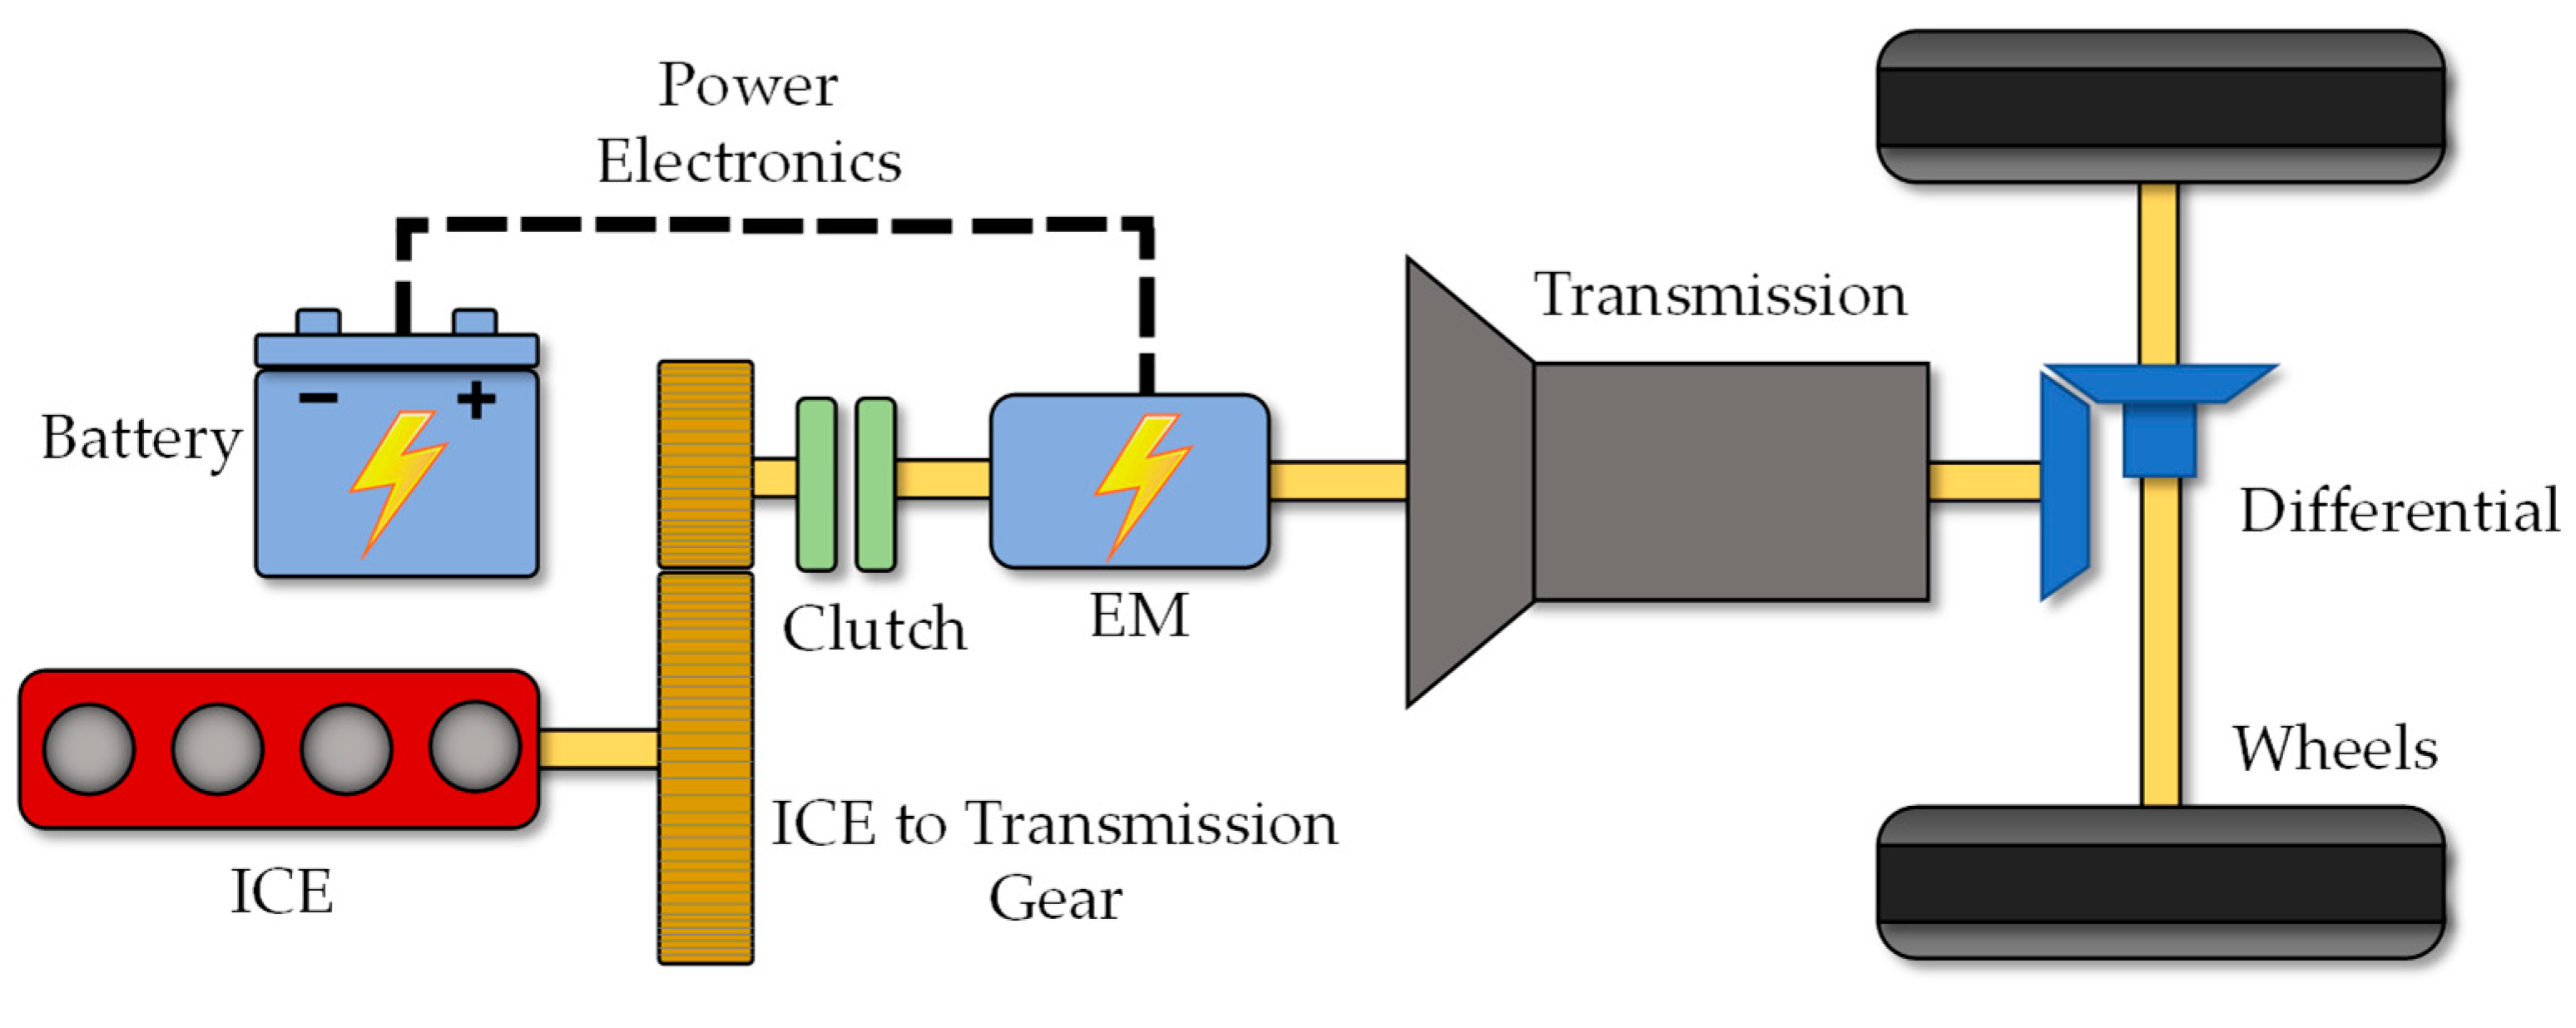
2.1. HEV Architecture and Model
2.2. HEV Control Level: DP
- It sweeps all the discretized control values;
- Then, it computes the state values for all the combinations of controls using the vehicle modeling equations given in the section above;
- Finally, it calculates a user-defined cost function that depends on the abovementioned values.
- The ICE, the EM, and the battery operate within the corresponding operating limits;
- The actual vehicle velocity matches the trajectory imposed by the drive cycle;
- Final and initial battery SOC values are similar in simulating charge-sustaining HEV operation.
3. HEV Powertrain Bi-Nested Design Methodology
3.1. HEV Design Level: PSO
3.2. Preliminary Tests
3.3. Production Cost
3.4. Operative Cost
- The average mass of a person (i.e., 80 kg) when simulating the urban cycle (solo driving to work);
- The average mass of four persons when simulating the remaining cycles, thus simulating a family trip.
4. Results
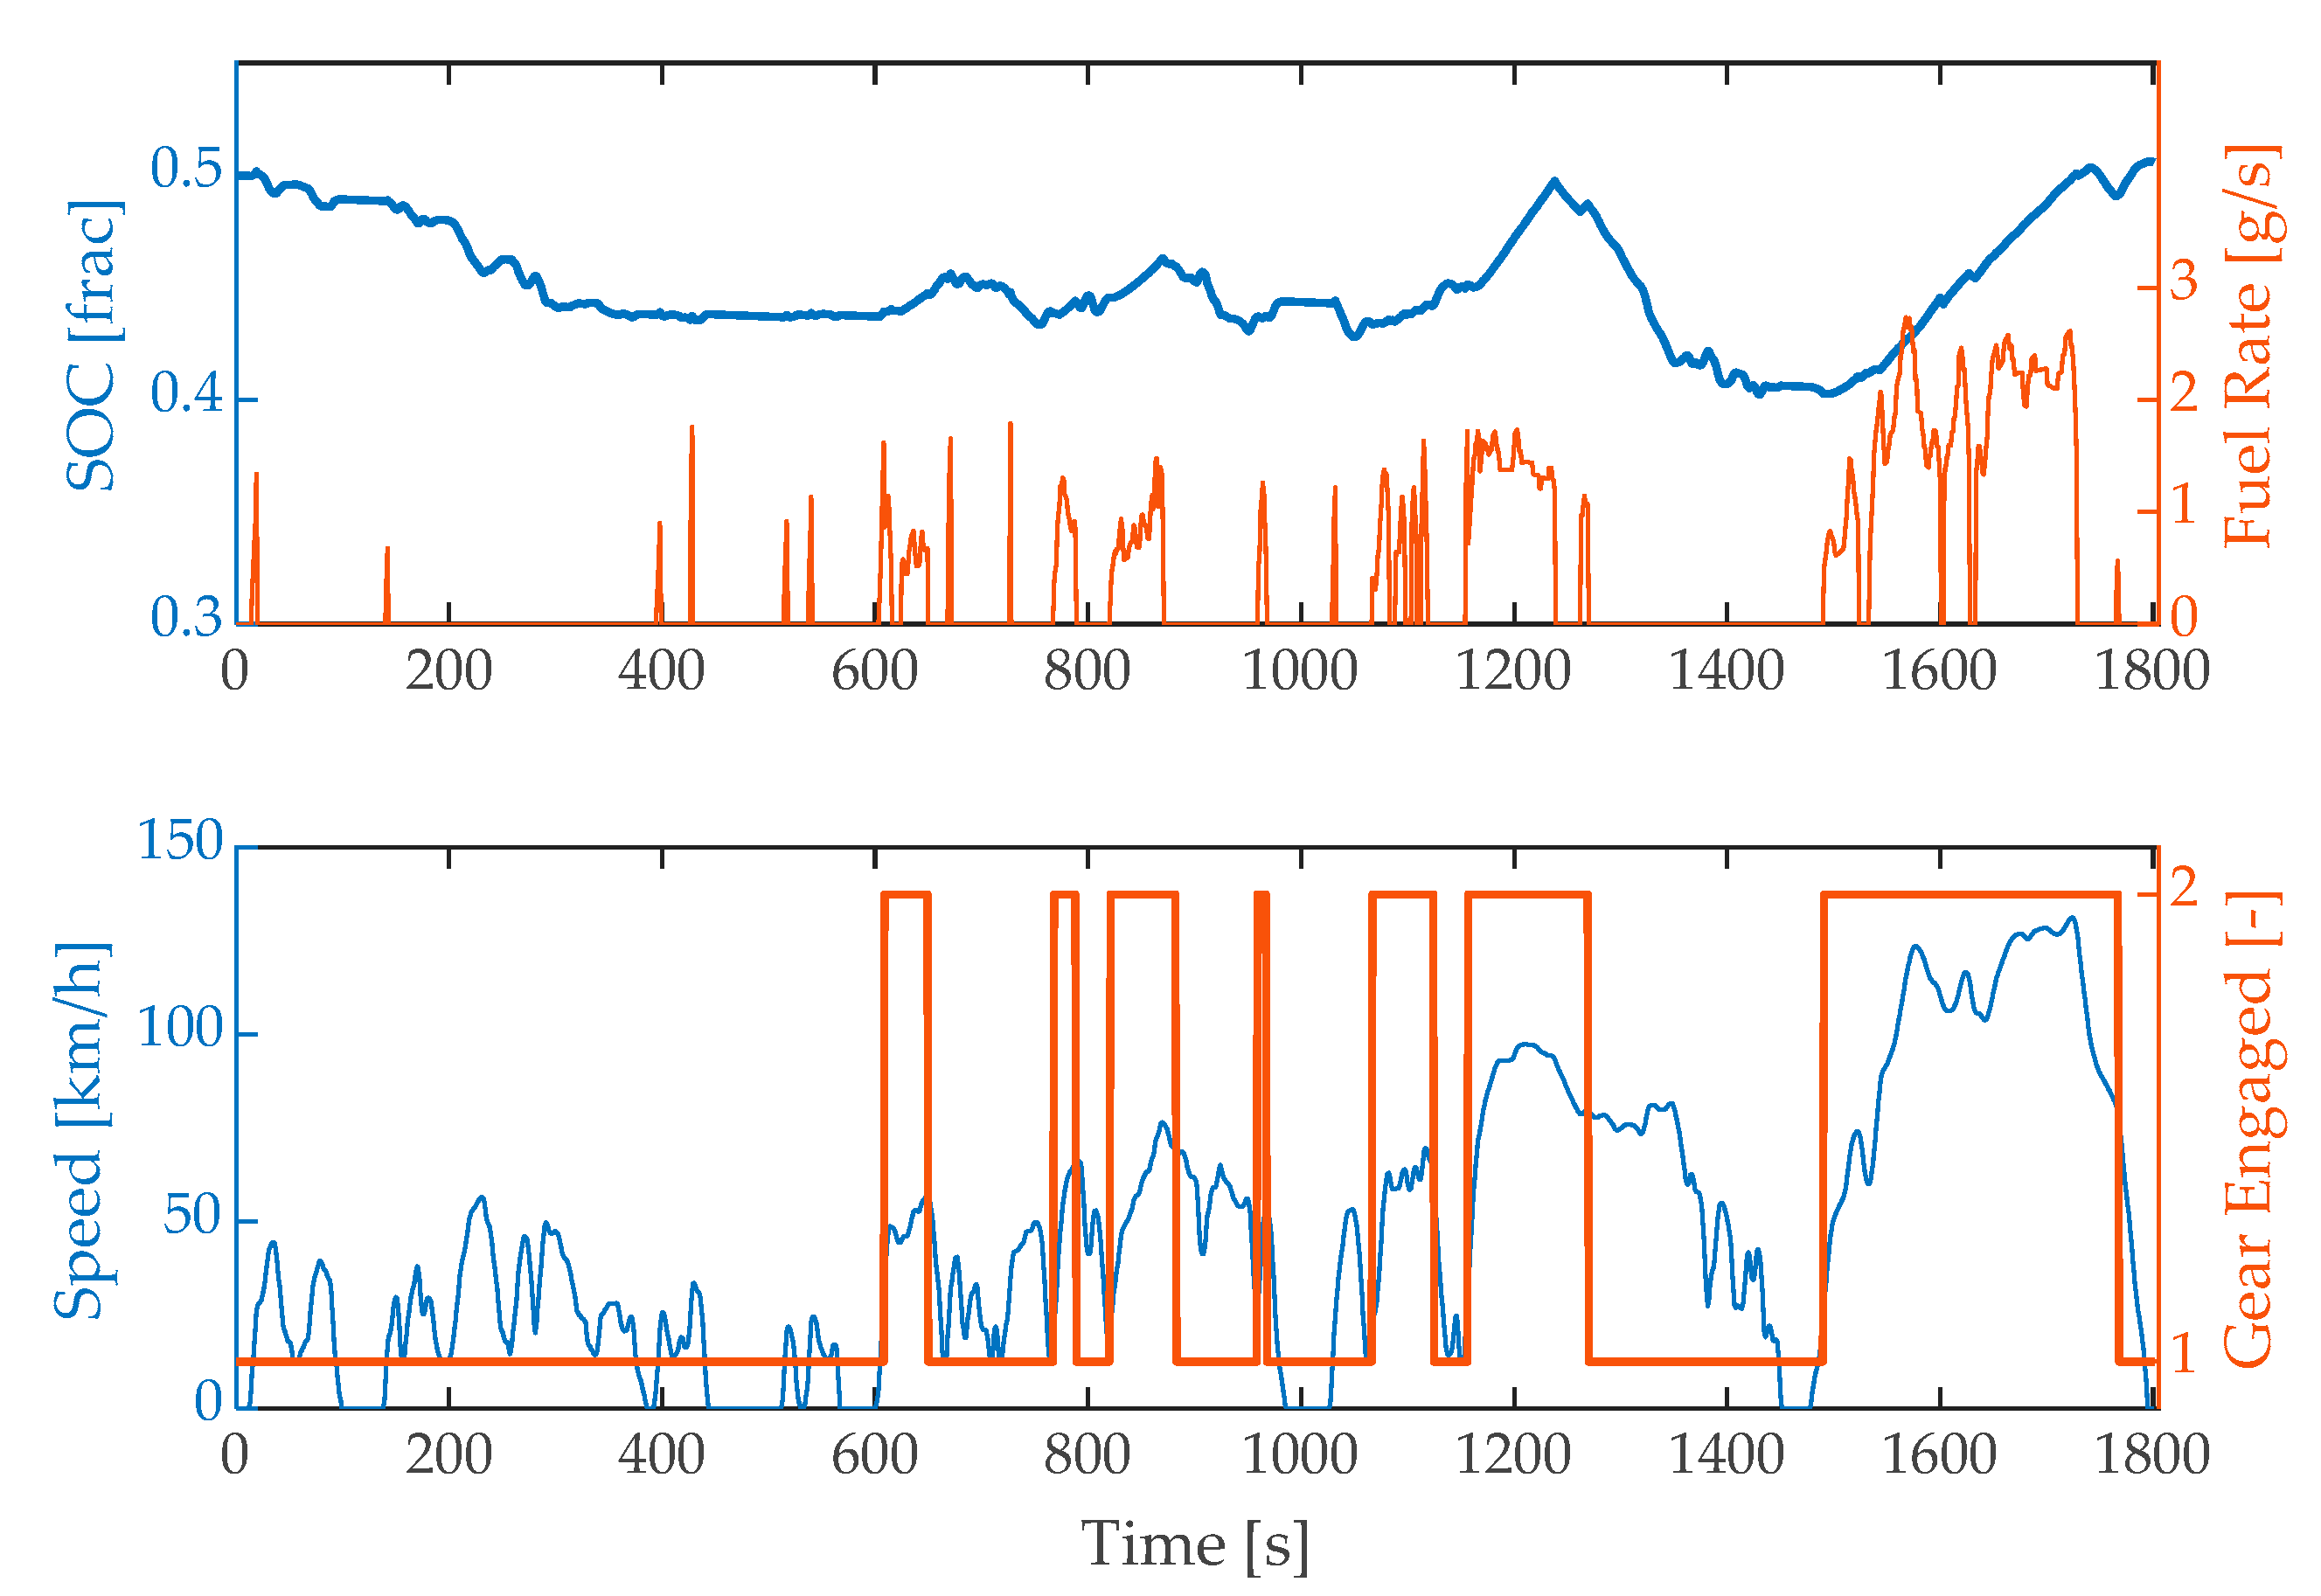
4.1. HEV Control Level Decisions: Example
4.2. PSO Results
5. Conclusions
Author Contributions
Funding
Conflicts of Interest
References
- Singh, K.V.; Bansal, H.O.; Singh, D. A comprehensive review on hybrid electric vehicles: Architectures and components. J. Mod. Transport. 2019, 27, 77–107. [Google Scholar] [CrossRef] [Green Version]
- Anselma, P.G.; Belingardi, G. Next Generation HEV Powertrain Design Tools: Roadmap and Challenges; SAE Technical Paper 2019-01-2602; SAE: Warrendale, PA, USA, 2019. [Google Scholar] [CrossRef]
- Roy, H.K.; McGordon, A.; Jennings, P.A. A Generalized Powertrain Design Optimization Methodology to Reduce Fuel Economy Variability in Hybrid Electric Vehicles. IEEE Trans. Veh. Technol. 2014, 63, 1055–1070. [Google Scholar] [CrossRef]
- Yoon, Y.; Kim, K.; Kim, S. Clutchless Geared Smart Transmission; SAE Technical Paper 2011-01-2031; SAE: Warrendale, PA, USA, 2011. [Google Scholar] [CrossRef]
- Kim, S.J.; Kim, K.; Kum, D. Feasibility Assessment and Design Optimization of a Clutchless Multimode Parallel Hybrid Electric Powertrain. IEEE/ASME Trans. Mechatron. 2016, 21, 774–786. [Google Scholar] [CrossRef]
- Wood, E.; Alexander, M.; Bradley, T.H. Investigation of battery end-of-life conditions for plug-in hybrid electric vehicles. J. Power Sources 2011, 196, 5147–5154. [Google Scholar] [CrossRef]
- Zhou, Q.; Zhang, W.; Cash, S.; Olatunbosun, O.; Xu, H.; Lu, G. Intelligent sizing of a series hybrid electric power-train system based on Chaos-enhanced accelerated particle swarm optimization. Appl. Energy 2017, 189, 588–601. [Google Scholar] [CrossRef]
- Gao, W.; Porandla, S.K. Design optimization of a parallel hybrid electric powertrain. In Proceedings of the 2005 IEEE Vehicle Power and Propulsion Conference, Chicago, IL, USA, 7 September 2005. [Google Scholar] [CrossRef]
- Spano, M.; Anselma, P.G.; Belingardi, G.; Misul, D.A.; Spessa, E. Assessing Lightweight Layouts for a Parallel Hybrid Electric Vehicle Driveline. In Proceedings of the 2020 AEIT International Conference of Electrical and Electronic Technologies for Automotive (AEIT AUTOMOTIVE), Turin, Italy, 18–20 November 2020; pp. 1–6. [Google Scholar] [CrossRef]
- Fathy, H.K.; Reyer, J.A.; Papalambros, P.Y.; Ulsoy, A.G. On the coupling between the plant and controller optimization problems. In Proceedings of the American Control Conference, Arlington, VA, USA, 25–27 June 2001; Volume 3, pp. 1864–1869. [Google Scholar]
- Liu, J.; Peng, H. Control optimization for a power-split hybrid vehicle. In Proceedings of the American Control Conference, Minneapolis, MN, USA, 14–16 June 2006. [Google Scholar]
- Lin, C.-C.; Peng, H.; Grizzle, J.W.; Kang, J.-M. Power management strategy for a parallel hybrid electric truck. IEEE Trans. Control Syst. Technol. 2003, 11, 839–849. [Google Scholar] [CrossRef] [Green Version]
- Anselma, P.G.; Belingardi, G.; Falai, A.; Maino, C.; Miretti, F.; Misul, D.; Spessa, E. Comparing Parallel Hybrid Electric Vehicle Powertrains for Real-world Driving. In Proceedings of the 2019 AEIT International Conference of Electrical and Electronic Technologies for Automotive (AEIT AUTOMOTIVE), Torino, Italy, 2–4 July 2019; pp. 1–6. [Google Scholar]
- Finesso, R.; Misul, D.; Spessa, E.; Venditti, M. Optimal Design of Power-Split HEVs Based on Total Cost of Ownership and CO2 Emission Minimization. Energies 2018, 11, 1705. [Google Scholar] [CrossRef] [Green Version]
- Bellman, R.E.; Lee, E. History and development of dynamic programming. Control Syst. Mag. 1984, 4, 24–28. [Google Scholar] [CrossRef]
- Sundstrom, O.; Guzzella, L. A generic dynamic programming Matlab function. In Proceedings of the 2009 IEEE Control Applications, (CCA) & Intelligent Control (ISIC), St. Petersburg, Russia, 8–10 July 2009; pp. 1625–1630. [Google Scholar] [CrossRef]
- Kennedy, J.; Eberhart, R. Particle swarm optimization. In Proceedings of the ICNN’95—International Conference on Neural Networks, Perth, WA, Australia, 27 November–1 December 1995; Volume 4, pp. 1942–1948. [Google Scholar] [CrossRef]
- Kalami Heris, M. Particle Swarm Optimization in MATLAB. Available online: https://yarpiz.com/50/ypea102-particle-swarm-optimization (accessed on 22 March 2021).
- Lechner, G.; Naunheimer, H. Automotive Transmissions, Fundamentals, Selection, Design and Applications; Springer: Berlin/Heidelberg, Germany, 2010; pp. 89–90. [Google Scholar]
- Anselma, P.G.; Biswas, A.; Bruck, L.; Bonab, S.A.; Lempert, A.; Roeleveld, J.; Madireddy, K.; Rane, O.; Wasacz, B.; Belingardi, G.; et al. Accelerated Sizing of a Power Split Electrified Powertrain. SAE Int. J. Adv. Curr. Prac. Mobil. 2020, 2, 2701–2711. [Google Scholar]
- European Central Bank. Euro Foreign Exchange Reference Rates, US Dollar. Available online: https://www.ecb.europa.eu/stats/policy_and_exchange_rates/euro_reference_exchange_rates/ (accessed on 27 May 2021).
- European Commission. Reducing CO2 Emissions from Passenger Cars—Before 2020. Available online: https://ec.europa.eu/clima/policies/transport/vehicles/ (accessed on 26 March 2021).
- Onori, S.; Serrao, L.; Rizzoni, G. Adaptive equivalent consumption minimization strategy for hybrid electric vehicles. In Proceedings of the Dynamic Systems and Control Conference, Cambridge, MA, USA, 12–15 September 2010; Volume 44175, pp. 499–505. [Google Scholar]
- Anselma, P.G.; Biswas, A.; Belingardi, G.; Emadi, A. Rapid assessment of the fuel economy capability of parallel and series-parallel hybrid electric vehicles. Appl. Energy 2020, 275, 115319. [Google Scholar] [CrossRef]


| Parameter | Value | Parameter | Value |
|---|---|---|---|
| Curb weight | 1162 kg | C | 0.41 N/(m/s)2 |
| 0.28 m | Battery Pack Energy | 2.1 kWh | |
| A | 104.49 N | 90 kW | |
| B | 2.43 N/(m/s) | 30 kW |
| Parameter | Lower Bound | Upper Bound |
|---|---|---|
| EM size multiplier coefficient, | 2 | 30 |
| ICE size multiplier coefficient, | 45 | 180 |
| Number of gears, | 1 | 6 |
| First gear ratio, | 2.5 | 5.0 |
| Last gear ratio, | 0.2 | 3.0 |
| ICE to transmission ratio, | 1.0 | 5.0 |
| Differential ratio, | 1.0 | 4.0 |
| Task # | Road Slope [%] | Task Explained |
|---|---|---|
| 1 | 30 | Perform a standing start |
| 2 | 0 | Maintain 150 km/h vehicle speed |
| 3 | 7 | Maintain 80 km/h vehicle speed |
| 4 | 0 | Charge-sustain the battery at 130 km/h |
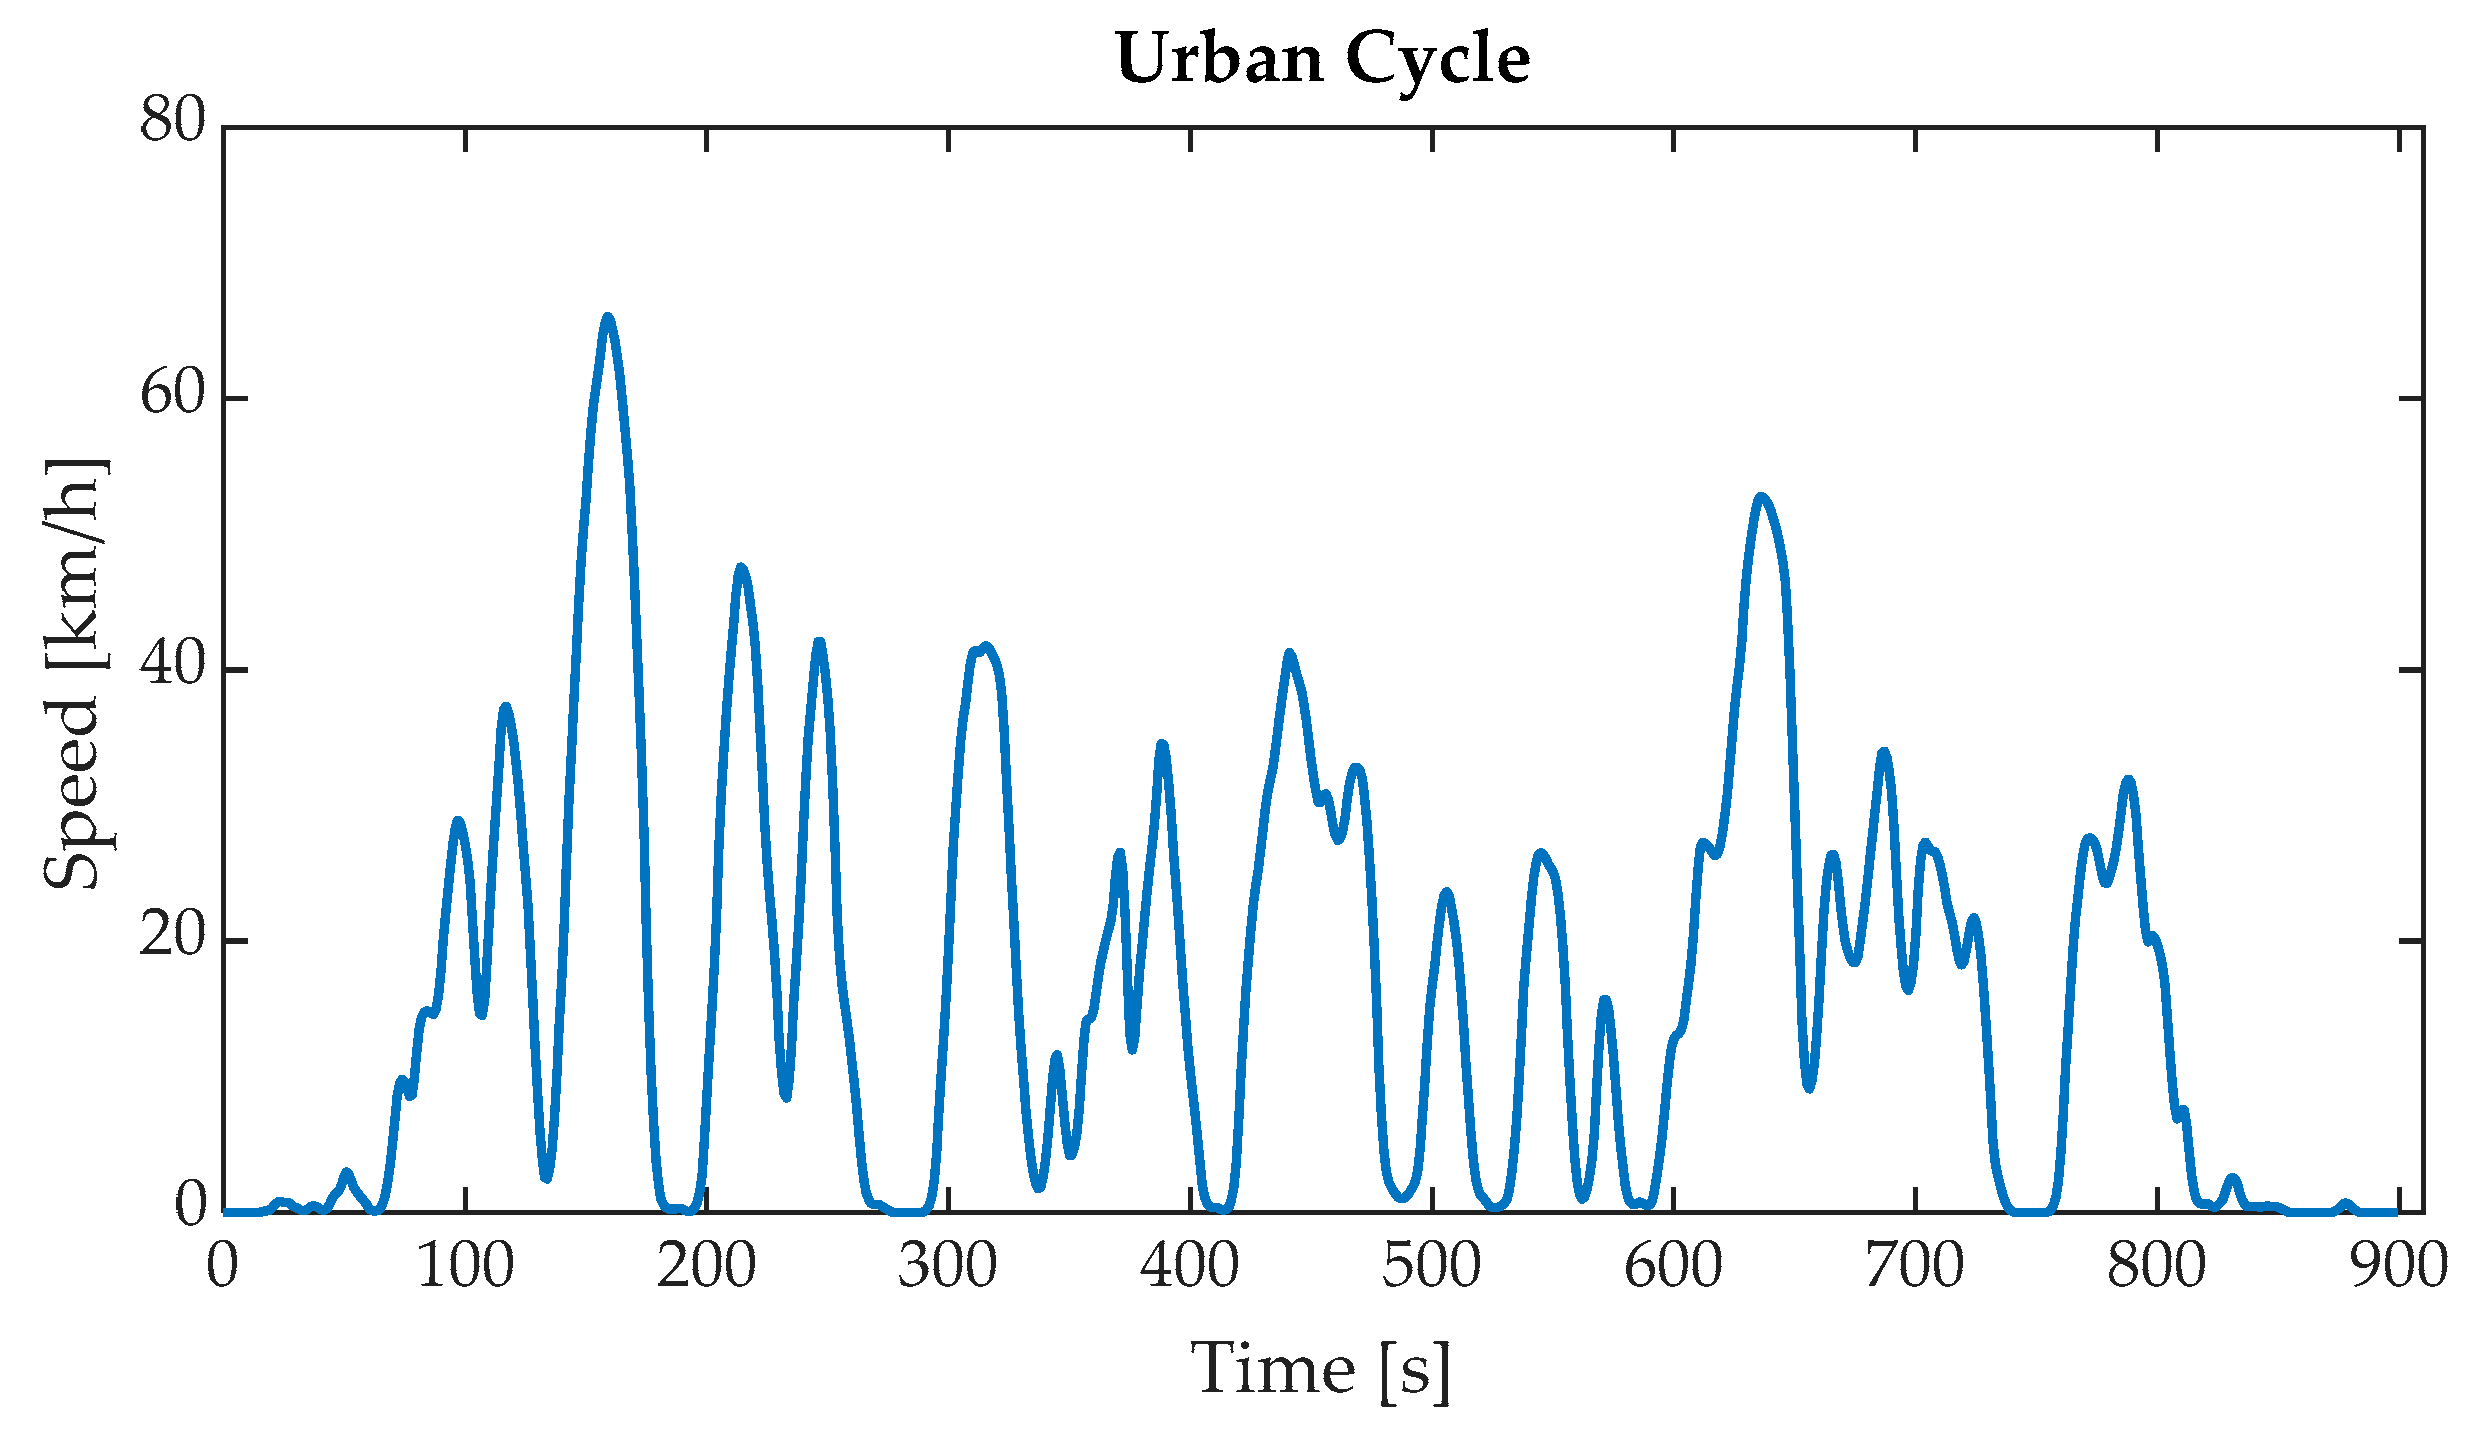
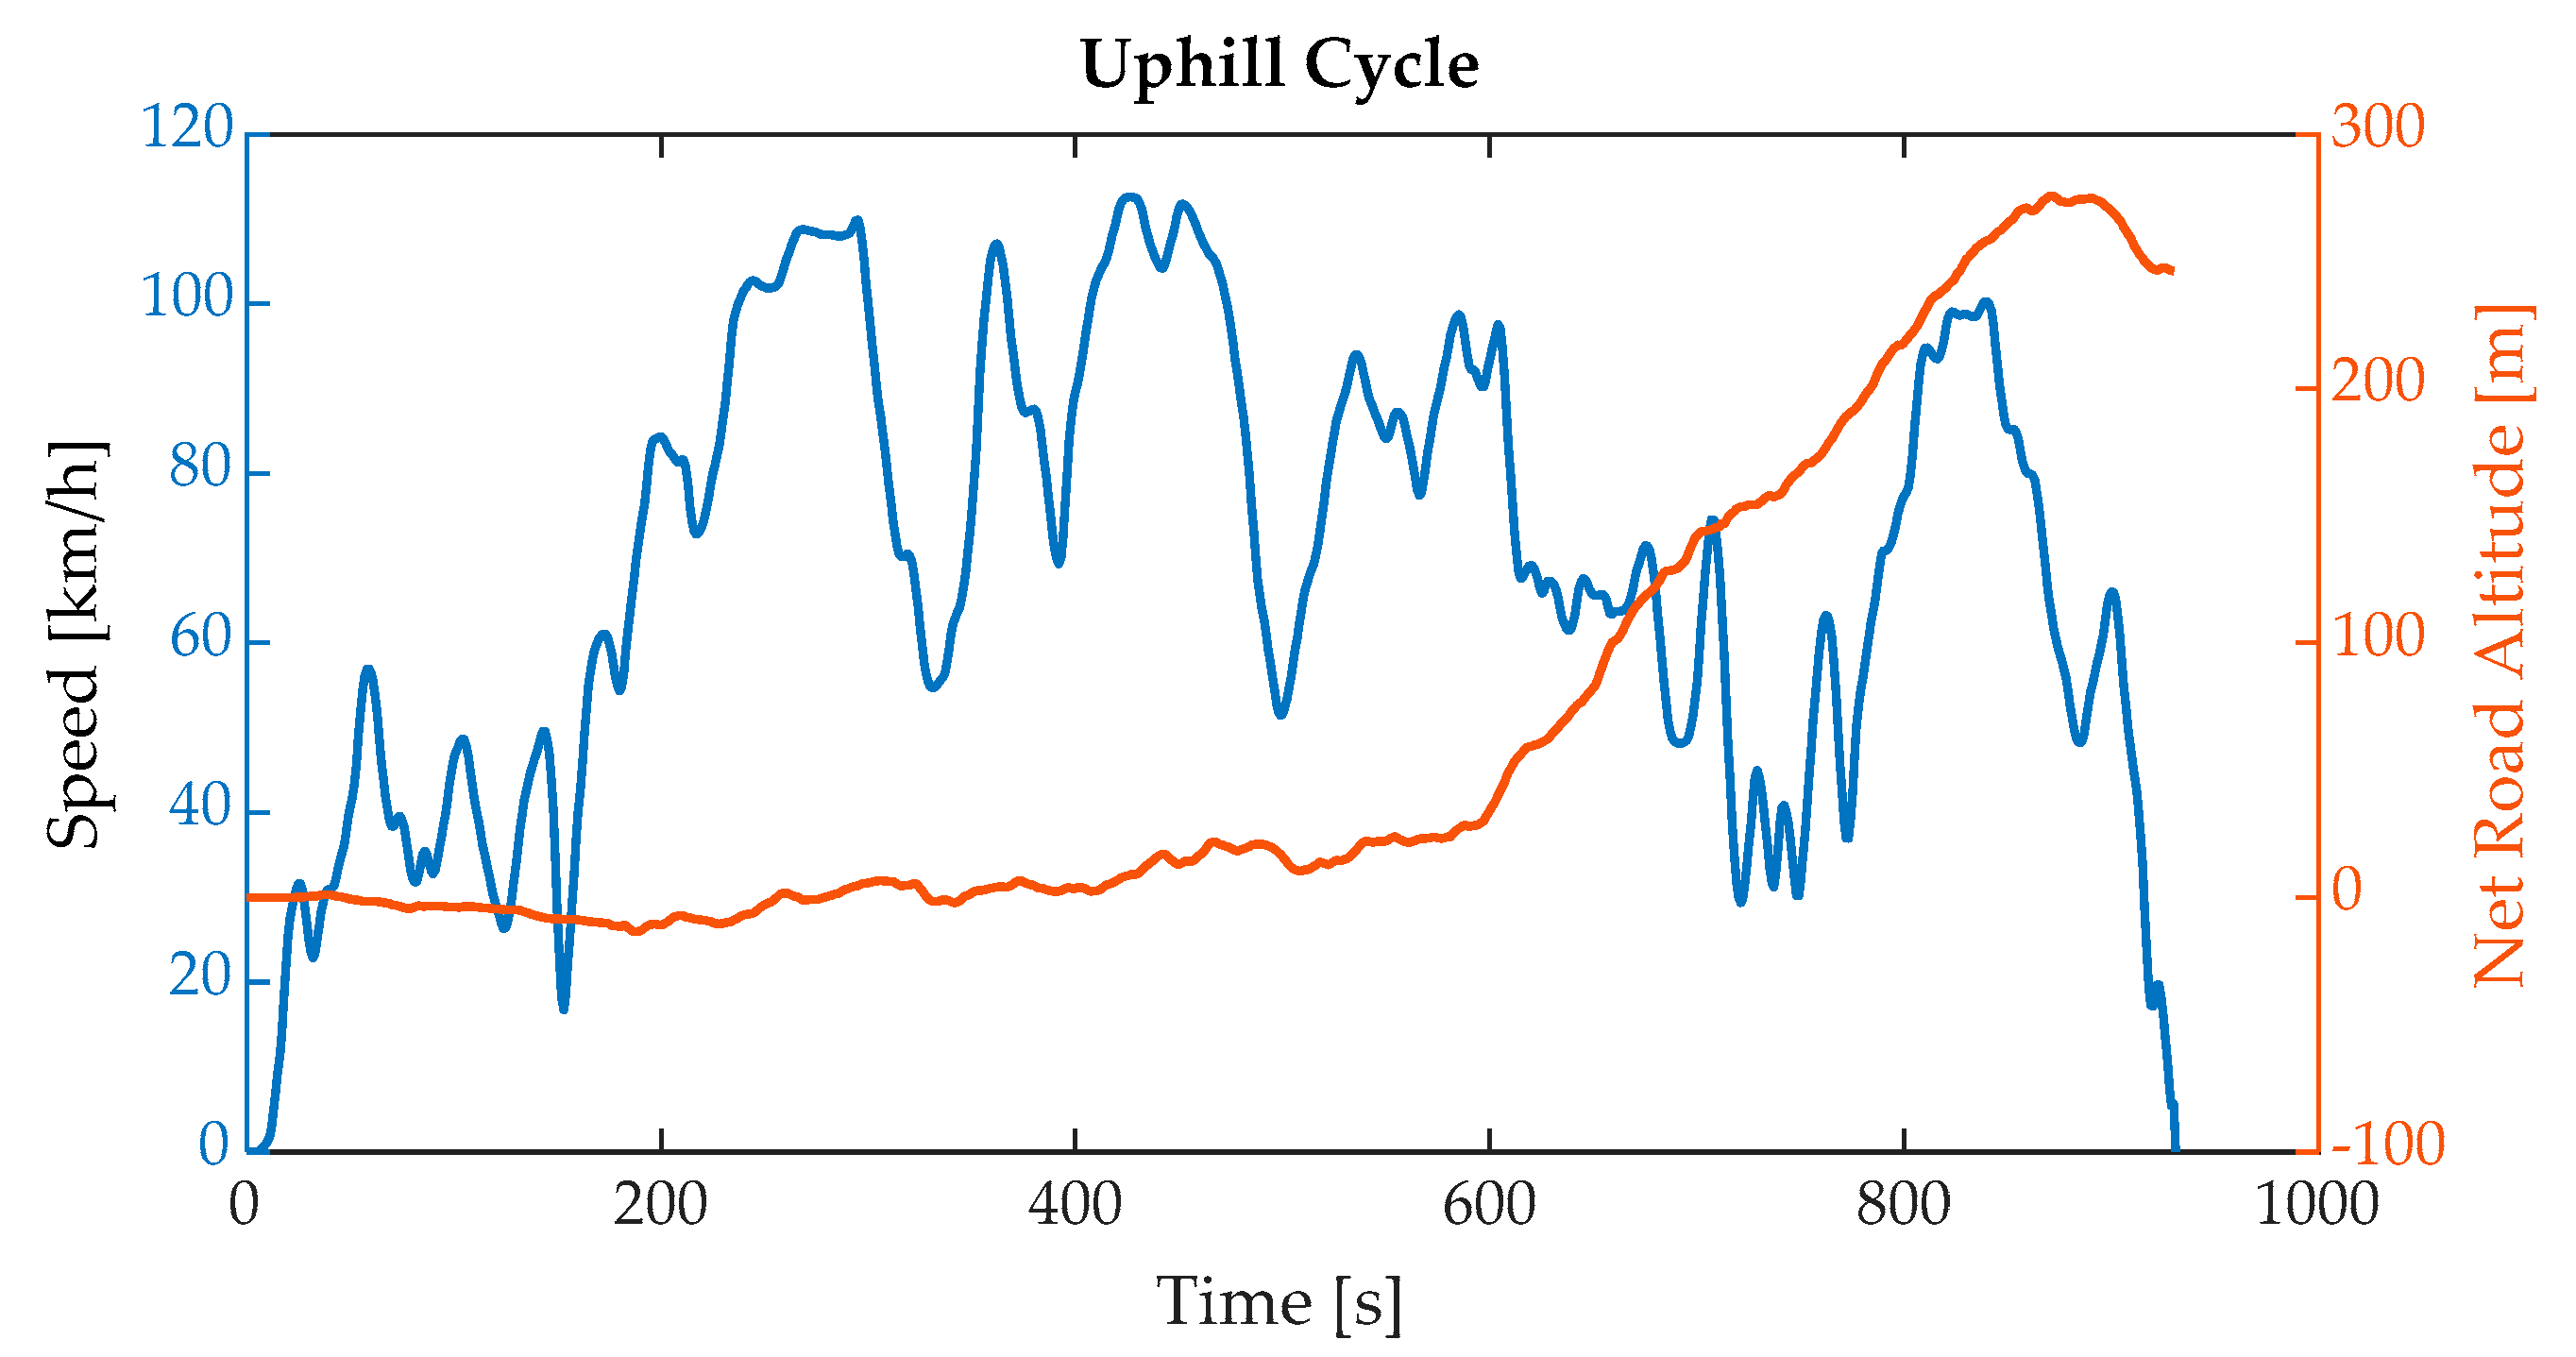
| Cycle | Duration | Length | Accel. Range | Max Speed | Altitude Variation |
|---|---|---|---|---|---|
| Urban | 900 s | 4.1 km | [−1.7, 1.4] m/s2 | 66 km/h | / |
| Uphill | 931 s | 17.8 km | [−1.7, 1.3] m/s2 | 113 km/h | 246 m |
| Highway | 1240 s | 22.9 km | [−1.0, 0.8] m/s2 | 131 km/h | / |
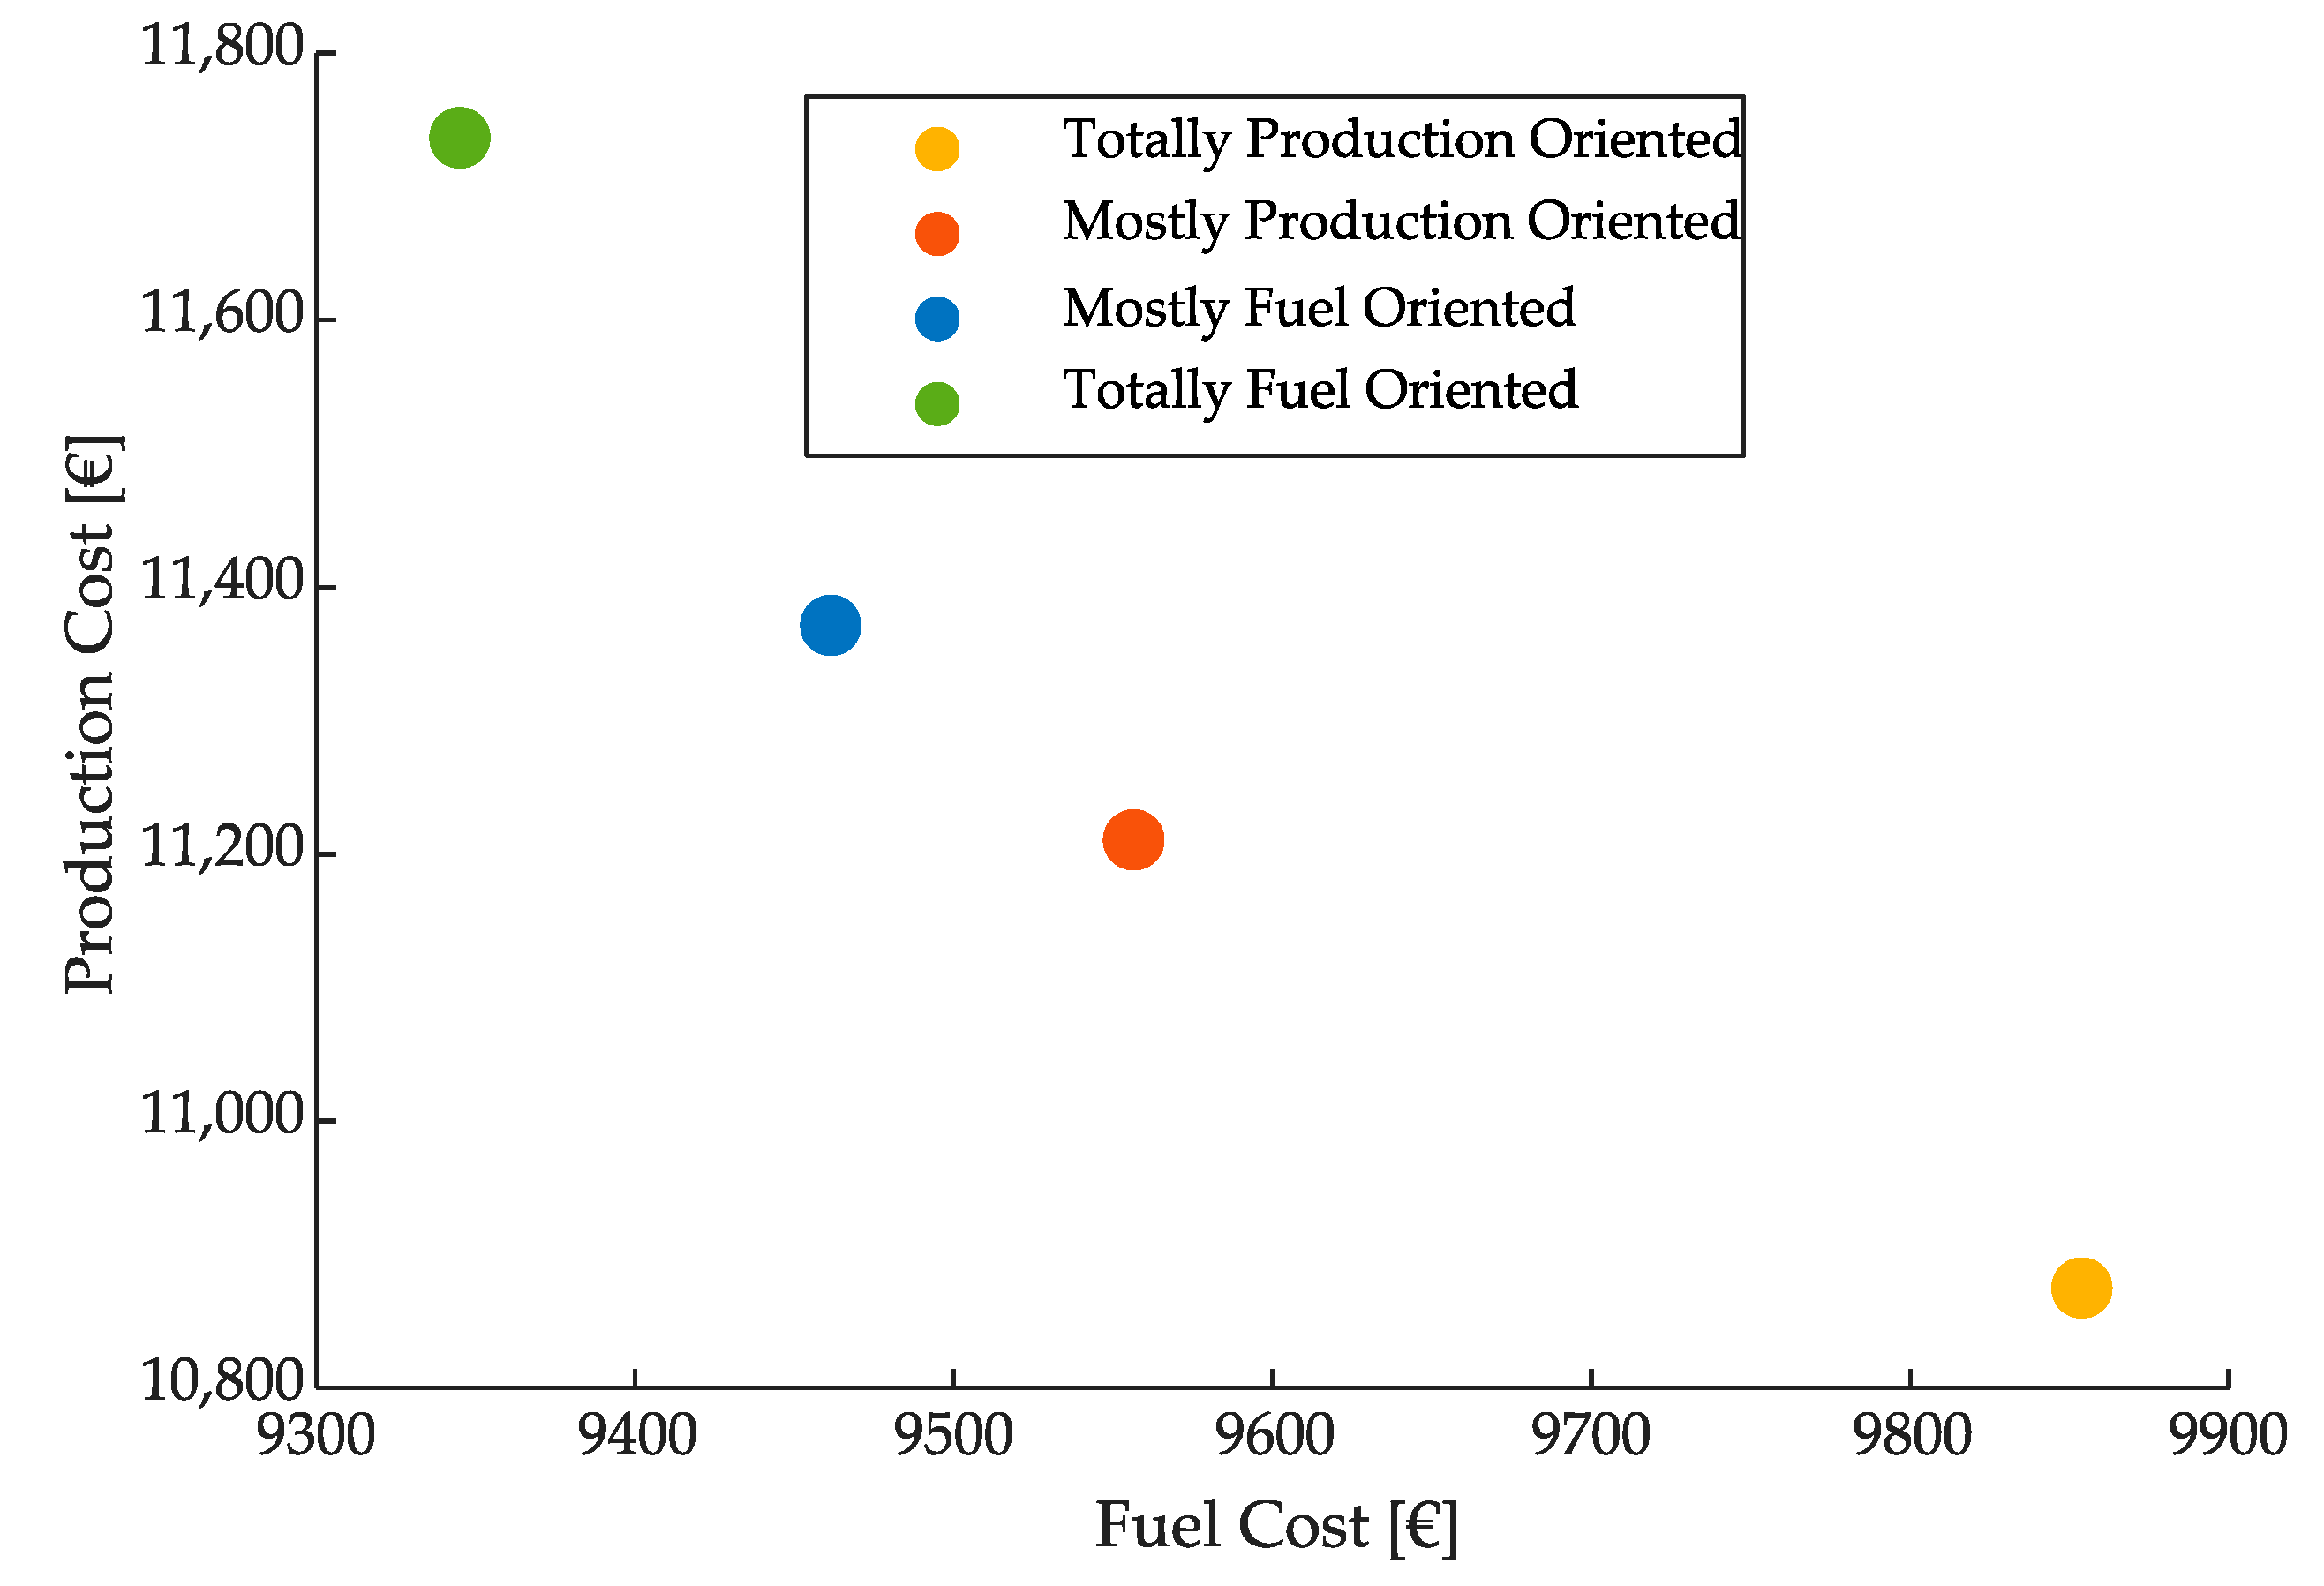
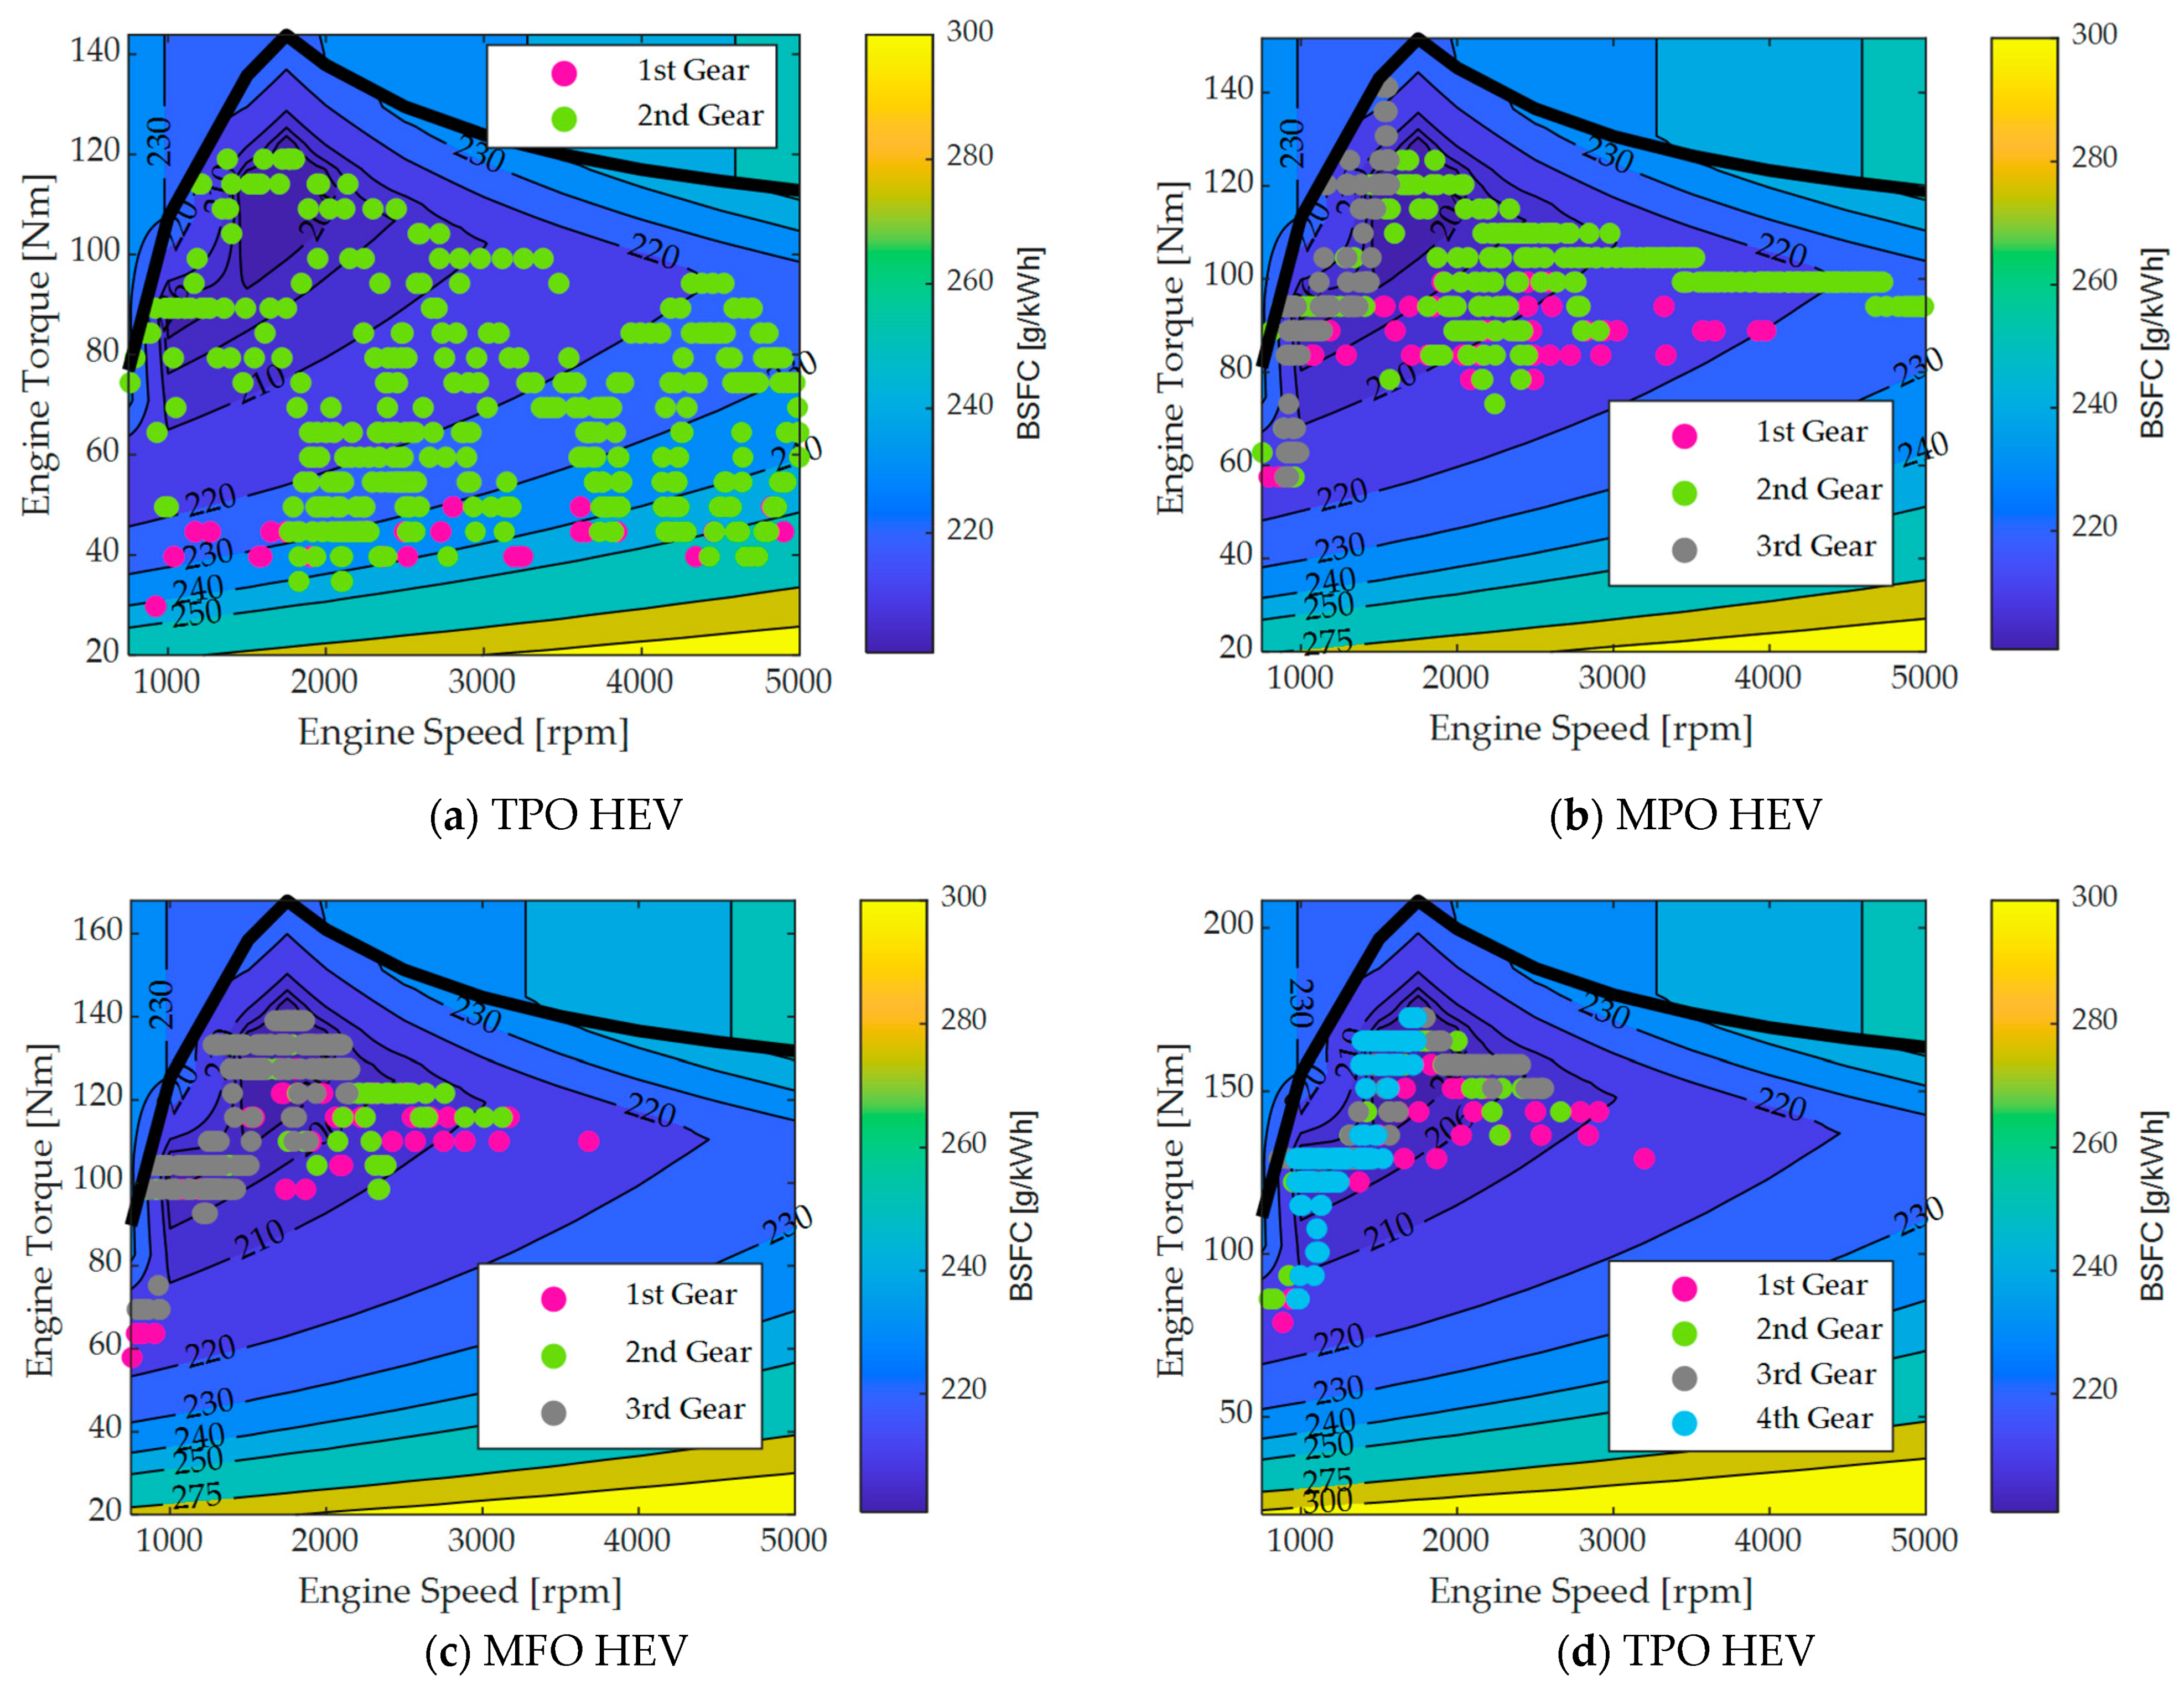
| Parameters | TPO | MPO | MFO | TFO |
|---|---|---|---|---|
| ICE size [kW] | 68 | 71 | 80 | 99 |
| EM size [kW] | 14 | 27 | 30 | 29 |
| Number of Gears | 2 | 3 | 3 | 4 |
| First Gear Ratio | 3.52 | 3.92 | 2.58 | 2.95 |
| Last Gear Ratio | 0.73 | 0.37 | 0.46 | 0.54 |
| Final Drive Ratio | 2.61 | 2.22 | 2.61 | 2.29 |
| ICE-Transm Ratio | 2.17 | 1.56 | 1.42 | 1.11 |
| Prod. Cost [€] | 10,875 | 11,210 | 11,371 | 11,736 |
| Fuel Cost. [€] | 9854 | 9556 | 9461 | 9345 |
| Avg. FE [L/100km] | 3.39 | 3.29 | 3.26 | 3.22 |
| CO2 penalty | / | / | / | / |
Publisher’s Note: MDPI stays neutral with regard to jurisdictional claims in published maps and institutional affiliations. |
© 2021 by the authors. Licensee MDPI, Basel, Switzerland. This article is an open access article distributed under the terms and conditions of the Creative Commons Attribution (CC BY) license (https://creativecommons.org/licenses/by/4.0/).
Share and Cite
Spano, M.; Anselma, P.G.; Misul, D.A.; Belingardi, G. Exploitation of a Particle Swarm Optimization Algorithm for Designing a Lightweight Parallel Hybrid Electric Vehicle. Appl. Sci. 2021, 11, 6833. https://doi.org/10.3390/app11156833
Spano M, Anselma PG, Misul DA, Belingardi G. Exploitation of a Particle Swarm Optimization Algorithm for Designing a Lightweight Parallel Hybrid Electric Vehicle. Applied Sciences. 2021; 11(15):6833. https://doi.org/10.3390/app11156833
Chicago/Turabian StyleSpano, Matteo, Pier Giuseppe Anselma, Daniela Anna Misul, and Giovanni Belingardi. 2021. "Exploitation of a Particle Swarm Optimization Algorithm for Designing a Lightweight Parallel Hybrid Electric Vehicle" Applied Sciences 11, no. 15: 6833. https://doi.org/10.3390/app11156833
APA StyleSpano, M., Anselma, P. G., Misul, D. A., & Belingardi, G. (2021). Exploitation of a Particle Swarm Optimization Algorithm for Designing a Lightweight Parallel Hybrid Electric Vehicle. Applied Sciences, 11(15), 6833. https://doi.org/10.3390/app11156833