Article

Antioxidant and Anti-Inflammatory Potential and Consumer Acceptance of Wafers Enriched with Freeze-Dried Raspberry Pomace

by
Urszula Szymanowska
*,
Monika Karaś
and
Justyna Bochnak-Niedźwiecka
Department of Biochemistry and Food Chemistry, University of Life Sciences, Skromna Str. 8, 20-704 Lublin, Poland
*
Author to whom correspondence should be addressed.
Appl. Sci. 2021, 11(15), 6807; https://doi.org/10.3390/app11156807
Submission received: 4 July 2021 / Revised: 19 July 2021 / Accepted: 21 July 2021 / Published: 24 July 2021
(This article belongs to the Section Food Science and Technology)

Abstract

:
In this study, the effect of the addition of freeze-dried raspberry pomace on the content of phenolic compounds and the antioxidant and anti-inflammatory activity of wafers was investigated. Particular attention was paid to the biological activity of the potentially bioavailable fraction of polyphenols extracted via gastro-intestinal digestion. In the basic recipe for the waffle dough, flour was replaced with freeze-dried raspberry pomace in the amount of 10%, 20%, 30%, 50%, and 75%. The content of total phenolic compounds, phenolic acids, flavonoids, and anthocyanins in ethanol and buffer extracts and after in vitro digestion increased with the increase in the addition of pomace. A similar relationship was noted for antioxidant properties: ability to neutralize ABTS—2,2′-Azino-bis(3-ethylbenzthiazoline-6-sulfonic acid) and DPPH—1,1-diphenyl-2-picrylhydrazyl radicals, iron II chelating ability, and reduction power. The extracts obtained after the simulated digestion showed the highest activities, which confirms that the polyphenols are a potentially bioavailable fraction. Extracts from the fortified wafers effectively inhibited the activity of enzymes involved in the generation of free radicals and induction of inflammation, i.e., xanthine oxidase (XO), lipoxygenase (LOX), and cyclooxygenase 2 (COX-2). The lowest IC50 values were determined for extracts after in vitro digestion. The sensory evaluation of the prepared wafers showed that the wafers fortified with 20% pomace achieved optimal scores. Enrichment of confectionery products with waste products from the fruit and vegetable industry can be a good way to increase the proportion of biologically active polyphenols in the diet and brings benefits to the environment.

Graphical Abstract

1. Introduction

Poland is the second largest producer of raspberries in Europe and the fifth in the world after the Russian Federation, Mexico, Serbia, and the United States according to data offered by the National Support Centre for Agriculture. Poland produces about 100,000 tons per year, of which almost half is exported, mainly in frozen form, to Western Europe [1]. Due to the low durability of fresh fruit, only a small proportion of raspberries are eaten fresh (8–13%) and for a limited time. Significant amounts of fruit are processed industrially (about 78%), e.g., in production of juices (18–27%), which generates pomace [2].
Industrial processing of fruit, especially for juices, generates huge amounts of waste. They pose a considerable environmental problem and generate high disposal costs. Most often, the waste is used in animal nutrition or as a fertilizer. On the other hand, pomace is an extremely rich source of compounds with documented biological activity. A very good way to use waste from fruit processing is to make bakery products, especially shortbread cookies, muffins, or wafers [3,4,5].
Raspberry pomace is a valuable source of nutrients and bioactive ingredients. It contains significant amounts of carbohydrates, proteins, fats, fiber, flavors, pectins, and vitamins [3]. About 77% of the dietary fiber content of fresh fruit remains in the pomace [6]. Similarly, phenolic compounds, including anthocyanins, but also ellagitannins (sanguiin H6 and lambertianin C), proanthocyanidins, and phenolic acids (mainly ellagic acid) remain in the pomace [7]. Up to 80% of raspberry pomace are seeds. Raspberry seeds are approximately 23% oil, a very rich source of polyunsaturated fatty acids (PUFAs), of which the main ingredients are essential fatty acids (linoleic and α-linolenic acid), as well as tocopherols. When eaten as a whole, they pass through the digestive tract undigested, hence the bioactive compounds present in them are not digestible. However, after drying and grinding, the bioavailability of bioactive compounds from raspberry pomace increases [8].
Raspberry by-products are not widely used in industry, but their potential is being increasingly recognized. Raspberry pomace is a good source of dietary fiber and can be used as a food additive. Due to its ability to inhibit the growth of Clostridium, Enterococcus, Escherichia, Mycobacterium, Salmonella, and Staphylococcus species by ellagitannins, raspberry pomace is a promising new source of phenolic antimicrobial compounds. Raspberry seed oil from raspberry by-products is very important for its potential application in food, pharmaceutical, and cosmetic products [3]. The research also proves that pomace as a source of biologically active compounds can be used in the prevention or treatment of civilization diseases, because of its positive effect on blood plasma enzymatic antioxidant status and lipid profiles of tested laboratory animals [7,8]
By-products from berries are very rich in polyphenols, especially anthocyanins (flavonoids) and possess high antioxidant capacity. Analysis of the Phenol-Explorer database indicates that fruit pomace remaining after juice production belongs to the 100 richest sources of polyphenols [9]. Due to their strong antioxidant properties, phenolic compounds have recently been considered preventive agents in many free radical-induced civilization diseases, such as cardiovascular diseases, cancers, type 2 diabetes, neurodegenerative diseases, or osteoporosis [10,11].
The effectiveness of polyphenolic compounds is largely related to their molecular weight, concentration, and, above all, the structure itself—the presence of hydroxyl groups involved in the reduction of free radicals. During this reaction, the polyphenolic compound donates one electron, transforming into an aroxyl radical, which is stabilized by the presence of an aromatic ring. Flavonoids most easily bind hydroxyl radicals, superoxide anion radicals, singlet oxygens, and lipid radicals. By reducing free radicals, polyphenols are simultaneously oxidized to stable products or unstable molecules transformed in further reactions [12,13].
The analysis of the literature shows that the addition of berry pomace to confectionery products is a good direction to enrich the diet with beneficial polyphenols [4,14,15,16].
Taking into account their low bioavailability [17,18], the supply of these compounds in the diet should be relatively high to obtain their effective concentration in the blood. Therefore, in this study, an attempt was made to prepare a functional product with high biological activity in in vitro tests and attractiveness to potential consumers. To this end, high and varied concentrations of pomace additive to baked wafers were used.
The aim of the study was to investigate the effect of the addition of freeze-dried raspberry pomace on the biological activity of wafers (content of polyphenolic compounds, antioxidant and potential anti-inflammatory properties). Particular attention was paid to assessment of the effectiveness of the fortification in terms of the potential bioavailability of phenolic compounds using a simulated gastro-intestinal digestion process. Additionally, the wafers were subjected to sensory analysis and their color was assessed.

2. Materials and Methods

2.1. Material

The raspberry fruit (Rubus idaeus L. var ‘Polana’) were purchased from a local farm in the Lublin region (Poland). Wafer cake ingredients (wheat flour, sugar, eggs, baking powder and butter) were purchased at a local market in Lublin (Poland).

2.2. Preparation of Raspberry Pomace

Raspberry fruit (1 kg) was squeezed (Eujuicers.com 8004 squeezer, Omega, Prague, Czech Republic). The juice volume was measured, and the pomace was weighed, then the juice and pomace were frozen. The pomace was freeze-dried (FreeZone, Freeze Dry Systems, Labconco, Kansas City, KS, USA) (temperature −46 °C at a pressure of 50 microbars, 48 h). Before baking, the pomace was ground in a coffee grinder (MK6000; Bosch, Stuttgart, Germany) and sieved through a 0.5 mm sieve.

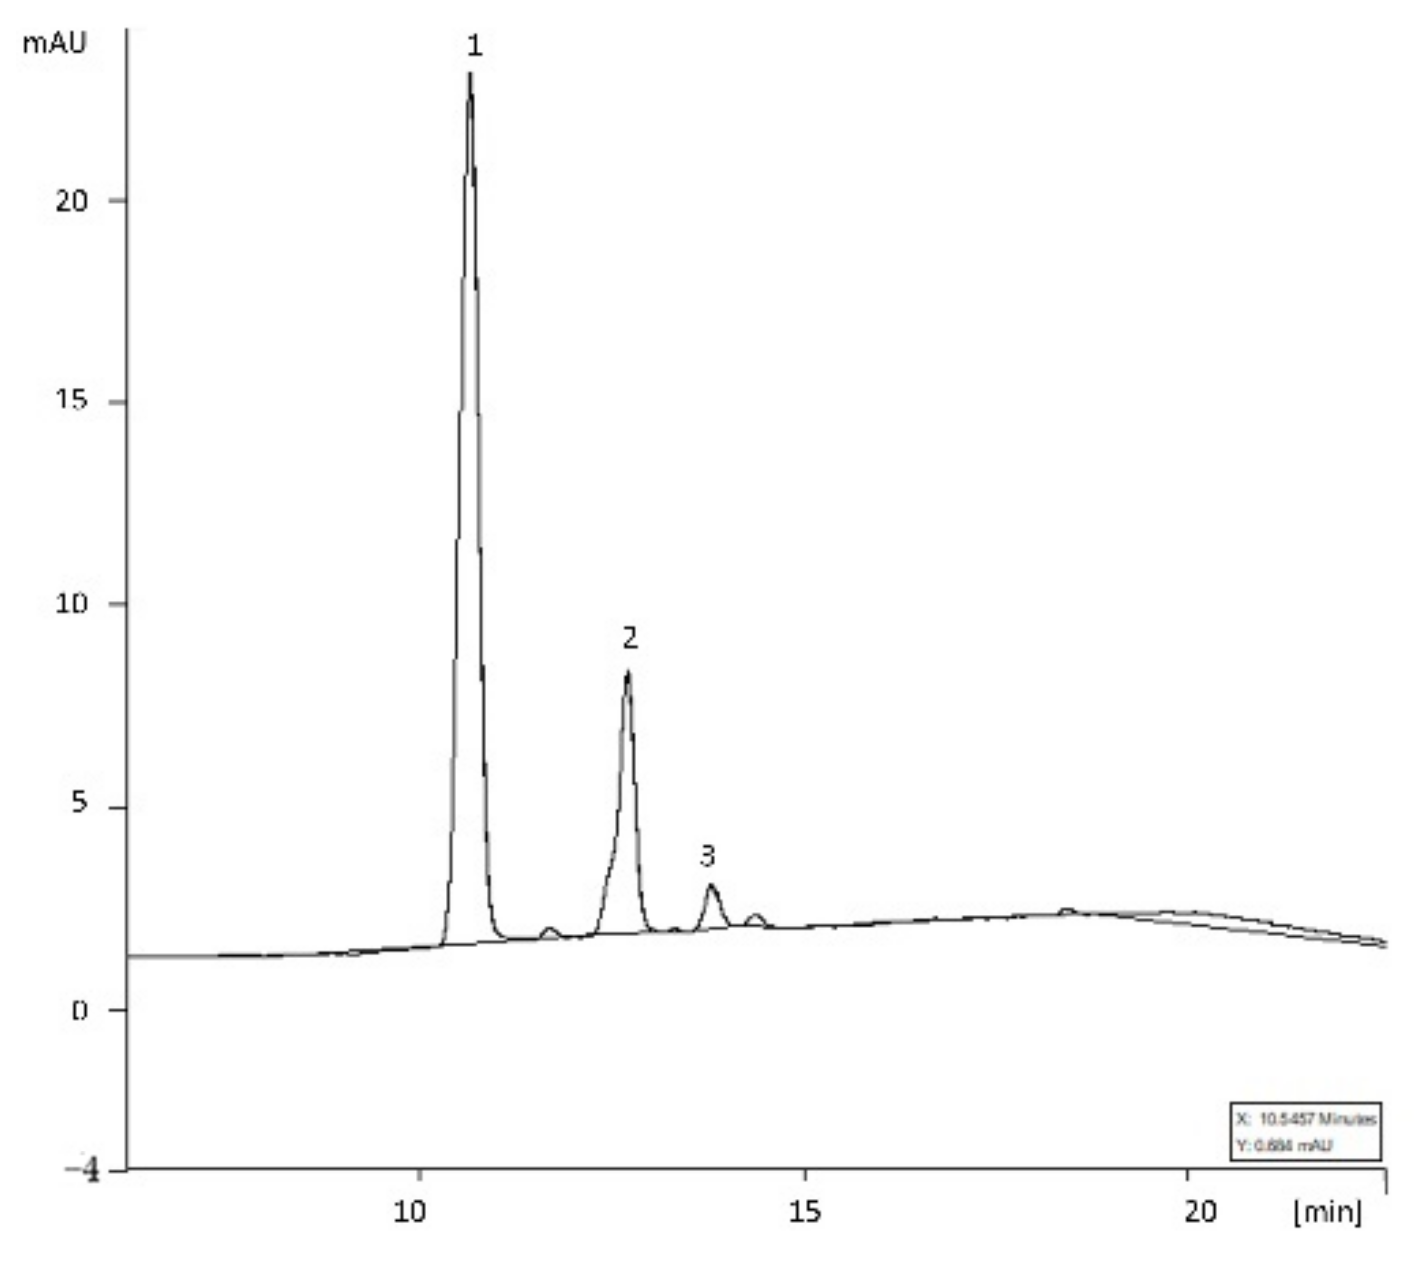
2.3. HPLC Analysis of Anthocyanins

The separation and identification of anthocyanins from raspberry pomace was carried out according to the procedure described earlier [19].

2.4. Preparation of Wafers Enriched with Freeze-Dried Raspberry Pomace

The basic ingredients: 130 g of sugar, 4 eggs, 1 tsp of baking powder, 175 g of butter (melted and cooled), and 250 mL of water were carefully measured and mixed in a dish with a hand domestic mixer (Braun, GmbH, Kronberg im Taunus, Germany). The mixture was divided into six parts and flour (50 g per one portion) was substituted with freeze-dried raspberry pomace at 0% (control) and 10%, 20%, 30%, 50%, and 75%. Dough portions were applied to the center of a Clatronic HA 3494 waffle maker (Kempen, Germany) and baked for approx. 1.5 min at 180 °C (Figure 1). After cooling, wafers were hermetically packed and used in further analysis.

2.5. Preparation of Extracts

2.5.1. Ethanolic Extracts (EtOH)

For preparation of ethanolic extracts, 2 g of each wafer variant was ground in a mortar and pestle and extracted with 15 mL of 50% acidified ethyl alcohol (0.1% HCl) three times with rotary shaking (Rotator Multi BIO RS-24) for 30 min at 4 °C and centrifuged (9000× g for 10 min). The supernatants were collected and made up with 50% ethyl alcohol (0.1% HCl) to a volume of 50 mL.

2.5.2. Buffer Extracts (PBS)

For preparation of buffer extracts, 2 g of each wafer variant was ground in a mortar and pestle and extracted with 15 mL of PBS buffer (phosphate buffered saline, pH 7.4) three times with rotary shaking (Rotator Multi BIO RS-24, Biosan, Riga, Latvia) for 30 min at 4 °C and centrifuged (9000× g for 10 min). The supernatants were collected and adjusted to 50 mL with PBS.

2.5.3. In Vitro Digestion (DIG)

All stages of in vitro digestion were performed in controlled conditions: temperature 37 °C in the absence of light using Incu-Shaker Mini (Benchmark Scientific, Sayreville, NJ, USA).
Simulated oral conditions: 15 mL of a simulated saliva solution (2.38 g Na2HPO4, 0.19 g KH2PO4 and 8 g NaCl in 1 dm3 H2O) were added to 2 g of the analyzed sample. Then, the α-amylase enzyme (5 mg/200 mL) was introduced and the mixture was homogenized (1 min) and shaken (5 min).
In vitro digestion simulating gastric conditions was carried out in controlled conditions: 37 °C, pH 2.5, absence of light. After hydrolysis with α-amylase, the resulting reaction mixture was adjusted to pH 2.5 (5 M HCl); then, 15 mL of gastric fluid (0.236 g pepsin in 200 mL 0.1 M HCl) were added to each of the samples. The hydrolysis process (shaking) was carried out for 60 min.
In vitro digestion simulating small intestine conditions (duodenum, jejunum, and ileum) was carried out in controlled conditions: 37 °C, pH 6, in the dark. The solution was adjusted to pH 6 (1 M NaOH), and 15 mL of intestinal fluid (1.05 g pancreatin, 3.75 g bile extract in 150 mL 0.1 M NaHCO3) was added to each sample. Hydrolysis was carried out for 2 h at 37 °C (shaking). At the end of the final stage, all samples were centrifuged (4 °C, 9000× g) and the supernatants were used for further analysis.
All types of extracts (EtOH, PBS, and DIG) were analyzed for their phenolic compound content, antioxidant activity, and potential anti-inflammatory activity by determining lipoxygenase, xanthine oxidase, and cyclooxygenase 2 inhibition.

2.6. Analysis of Phenolics

Determination of total phenolic compounds (TPC) was carried out with the Folin–Ciocalteau method as described by [20] and calculated as gallic acid equivalent in mg/100 g of dry weight (dw).
Total phenolic acids were determined with the use of Arnov reagent [21] and expressed as caffeic acid equivalent in µg/100 g dw.
The flavonoid content in the analyzed wafers was determined with the Lamaison & Carnart method [22]. The calibration curve was prepared with quercetin as a standard.
The anthocyanin concentration was determined with the pH differential method [23] and expressed as cyanidin-3-O-glucoside equivalent per 100 g of wafer. The presence of bile salts interferes with the assay used to quantify the total anthocyanin concentration in the digested samples (McDougall et al., 2005b); therefore, before anthocyanin content measurement, the DIG samples were passed through Supelco C-18 cartridges (Sigma-Aldrich, Poznań, Poland) according to the procedure described earlier [24].

2.7. Antioxidant Properties of Enriched Wafers

2.7.1. Antiradical Activity

Two colorimetric methods were used to determine the radical scavenging activity of the wafers—ABTS•+ [25] and DPPH [26]. The results were expressed as µM of Trolox per 100 g.

2.7.2. Chelating Ability and Reduction Power

The iron (II) chelating ability (CHP) and reduction power (RP) were determined with methods described by [27] and [28], respectively. Chelating power and RP were expressed in mg EDTA/100 g of wafer and as Trolox equivalent (µmol TE/100 g), respectively.

2.8. Potential Anti-Inflammatory Activity

The ability to inhibit lipooxygenase (LOX) and cyclooxygenase-2 (COX-2) activity was determined using spectrophotometric methods described previously [29]. The xanthine oxidase (XO) inhibitory activity of the analyzed samples was measured according to the procedure described by Zhang et al. [30] and adapted to the microplate reader using a Epoch2 BioTek Microplate Spectrophotometer (Winooski, VT, USA).

2.9. Color Measurement

The analysis was performed by instrumental color measurements with the CIELab method, using an EnviSense NH310 colorimeter (EnviSense, Lublin, Poland) with a measuring hole with a diameter of 8 mm. The colorimeter was calibrated on a white standard (L* = 95.82, a* = 0.44, b* = 2.5). CIE L*a*b* color parameters were recorded as L* (lightness), a* (redness), and b* (yellowness). The chroma (C = (a*2 + b*2)1/2) and hue angle (h° = arctan (b*/a*)) were also calculated [31]. The total color differences (ΔE) between non-supplemented wafers and samples with the raspberry pomace powder additive were calculated using the following formula:
Δ E = Δ L * 2 + Δ a * 2 + Δ b * 2
where ΔL*, Δa*, and Δb* are differences between the control and fortified wafers.

2.10. Sensory Analysis

Sensory analysis was conducted by 20 panelists selected randomly among workers and students at the University of Life Sciences in Lublin 2 h after baking. The wafer samples were compared between each other in terms of their shape, surface, color, consistency, aroma, and overall acceptance using a five-point scale according to the given quality features, where 1 means very bad and 5 means very good.

2.11. Statistical Analysis

All experiments and measurements were performed in triplicate and data were reported as mean ± standard deviation (n = 9). Mean values were further compared using Tukey’s test, and differences were considered to be statistically significant when p ≤ 0.05. In order to demonstrate the relationship between the content of phenolic compounds and the antioxidant capacity of wafers enriched with freeze-dried raspberry pomace, a Pearson correlation analysis was performed on MS Excel 2010.

3. Results

3.1. Anthocyanin Profile in Raspberry Pomace

Table 1 shows anthocyanins identified in the HPLC–DAD analysis. Figure 2 shows the HPLC chromatogram with the anthocyanin profile. Three anthocyanin compounds were identified: cyanidin-3-O-sophoroside, which accounted for about 67% of the total content of anthocyanins, cyanidin-3-O-glucoside, and cyanidin-3-O-rutinoside. Cyanidin-3-O-glucoside constituted 24% of the total content of anthocyanins in the freeze-dried raspberry pomace. As much as 2/3 of anthocyanins remain in the pomace; hence, they are a good source of natural dyes.

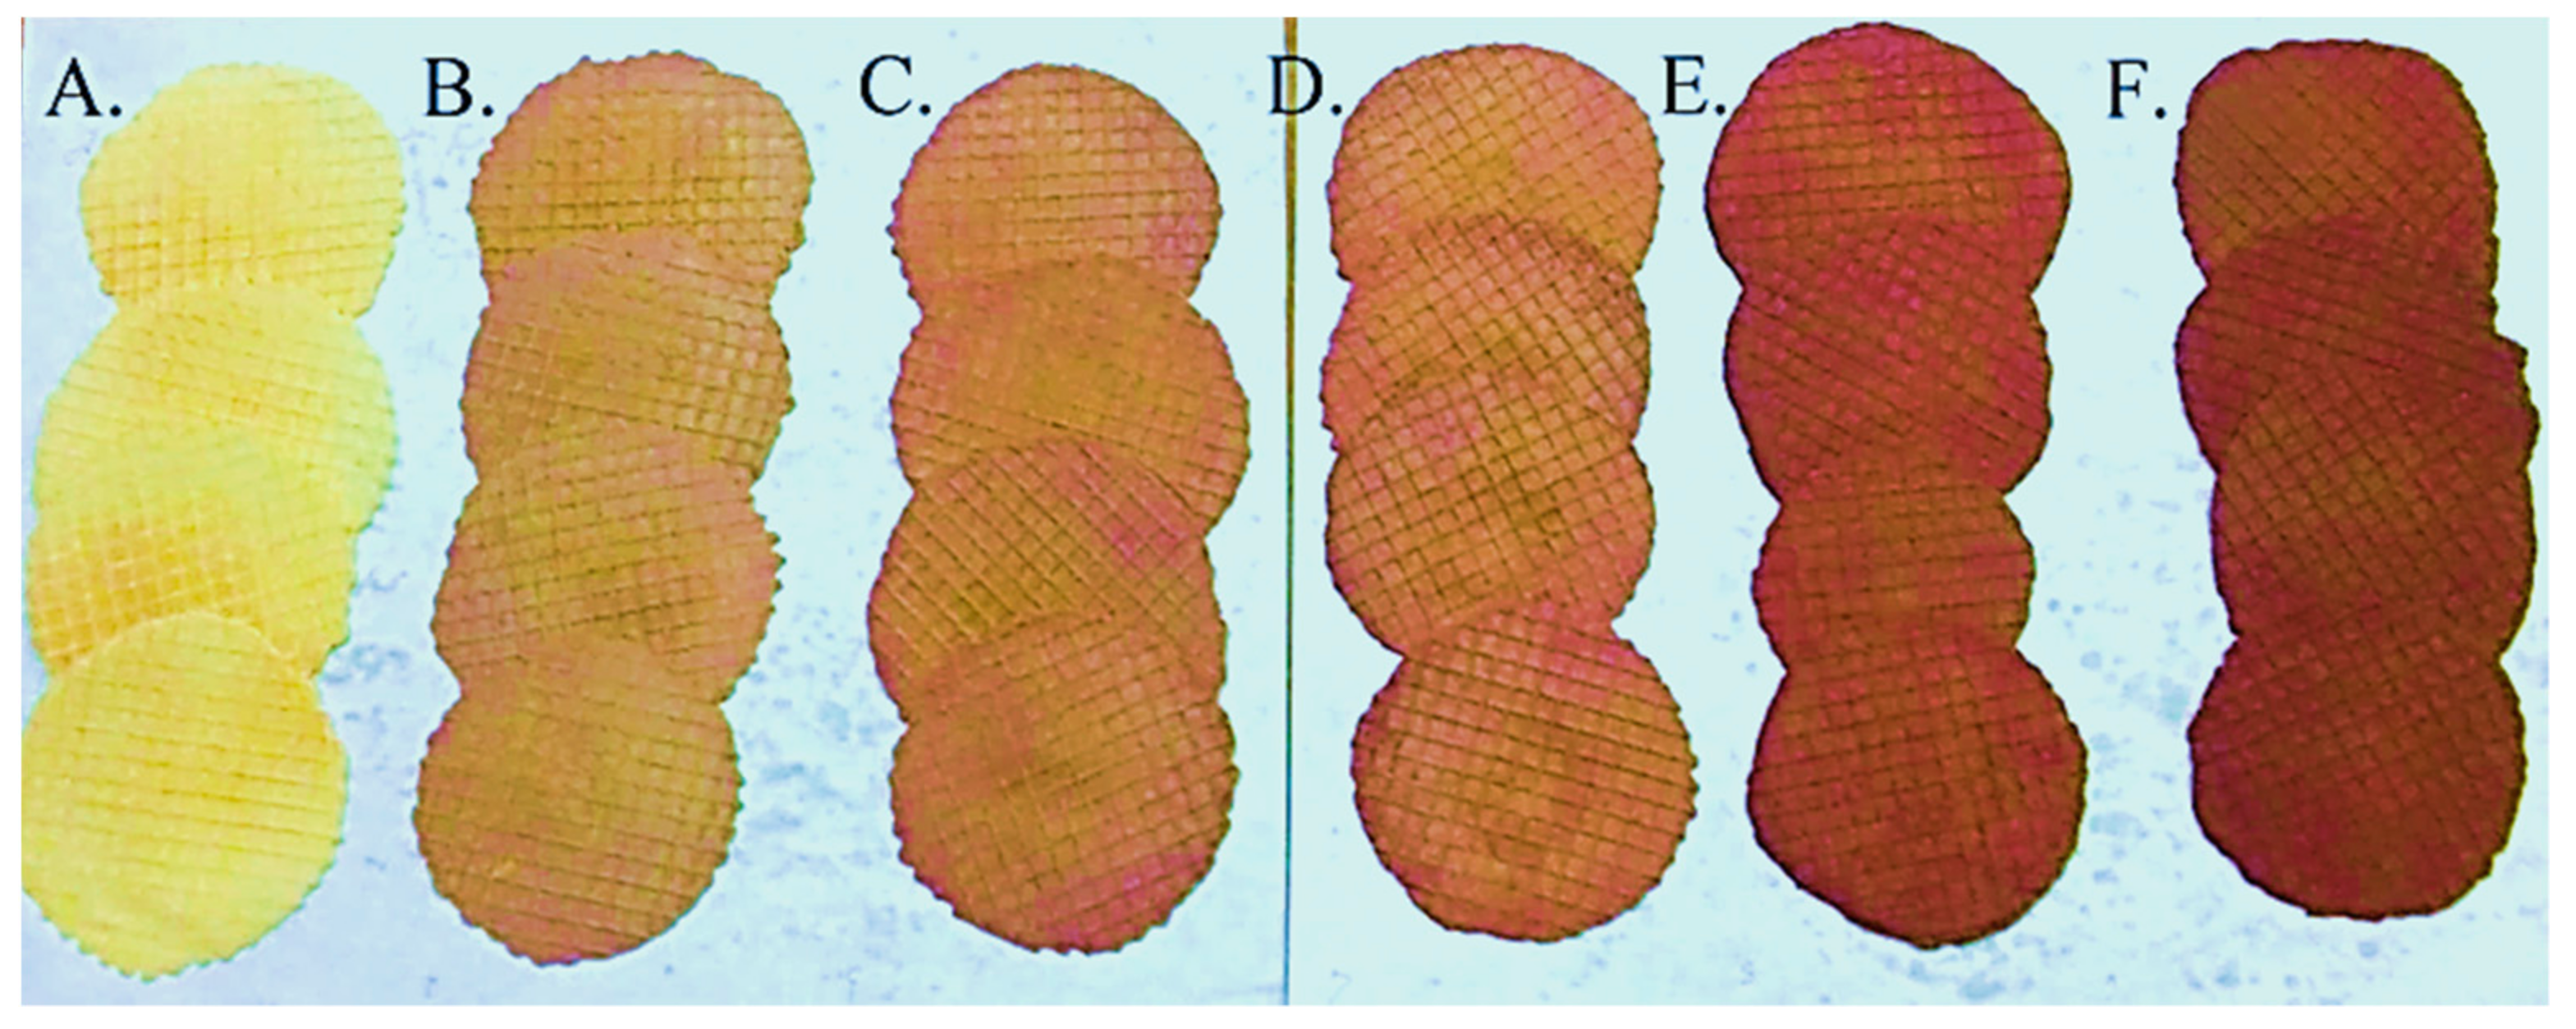
3.2. Sensory and Color Analysis of Fortified Wafers

In order to obtain a product with high antioxidant potential and attractiveness to modern consumers, the prepared wafers were subjected to organoleptic evaluation and their composition was analyzed in terms of the content of polyphenol compounds and antioxidant properties.
The mean sensory values of the control and fortified wafers are presented in Table 2. The sensory analysis is shown on a spider diagram. The analysis shows that two variants of wafers received average scores above 4.00, which indicates that they are the most attractive for the examined group of consumers. The highest average rating (4.31) was obtained by the C variant without the addition of raspberry pomace and the RP-20 variant. In terms of the individual qualitative features, the first of these variants obtained the highest scores of color, surface, smell, and taste, while the other one was characterized by a very good consistency, surface, and color. The RP-75 variant was the least suitable for consumers. It was characterized by an excessively sour taste and a soft rubbery texture due to the high content of pomace. The seeds contained in the pomace were palpable during consumption. Both raspberry fruit and pomace have a pungent taste due to the high content of tannins; hence, their excessive concentrations in the product may undermine its quality. Enrichment with this material requires selection of the optimal amount to obtain the desired health effects while maintaining the quality characteristics of the product. The analysis indicated that the 20% pomace option was the best solution meeting these criteria.
The color parameters are shown in Table 3. The L* parameter determining the brightness in the tested wafer variants was in the range of 35.02 ± 0.36–80.69 ± 3.46. The lowest value was determined in the wafer supplemented with 75% raspberry pomace, which means that it was the darkest, while the control sample—without the addition of raspberry pomace had the highest value. A higher value of the L* parameter (greater brightness) was found in the wafer variants without the addition of raspberry pomace (control) in comparison with the pomace-enriched wafer variants. The presence of pomace, including anthocyanin dyes, caused the darker product color. The chromatic color parameters in the studied variants had positive values both for a* (more red than green) and for b* (more yellow than blue) in all types of wafers, regardless of the pomace concentration. The highest values of parameter a* were measured for the variant with the highest content (75%) of pomace—the reddest, while the lowest values were noted for the control variant. Parameters b* are inversely proportional to the measured values a*—the highest value was obtained in the control variant (the most yellow), whereas the RP-50 and RP-75 variants were characterized by the lowest values. During the organoleptic analysis, the color differences were noticeable by the consumers, making them one of the criteria for sensory quality assessment and choosing the best product variant. ΔE ≥ 3 indicates that the color is perceivable by humans [31]. According to the ΔE evaluation of the fortified wafers, the differences were over 30, which means that the color differences between the control wafers and the pomace-enriched wafers were noticeable and statistically significant and increased with the increasing pomace addition. The smallest difference in the color was recorded between the RP-20 and RP-30 samples; they were statistically insignificant for all analyzed color parameters. The chroma value (C*) indicates the degree of color saturation and is proportional to the strength of the color. Chroma (C*), considered the quantitative attribute of colorfulness, is used to determine the degree of difference of the hue in comparison to the grey color with the same lightness. The higher the chroma values, the higher the color intensity of samples perceived by humans. The highest C* value was calculated for the control wafers. In the case of the pomace-enriched wafers, the C values increased with the amount of the additive, but the differences were not statistically significant. The average value of parameter C for the enriched wafers was 22.53. The hue angle (h*) decreased with the increasing pomace addition to wafers, which indicates a change in the shade of the color from yellowish to redder. All fortified variants differed significantly in the h angle from the control. The lowest value, i.e., the closest to red, was noted for the RP-50 variant.

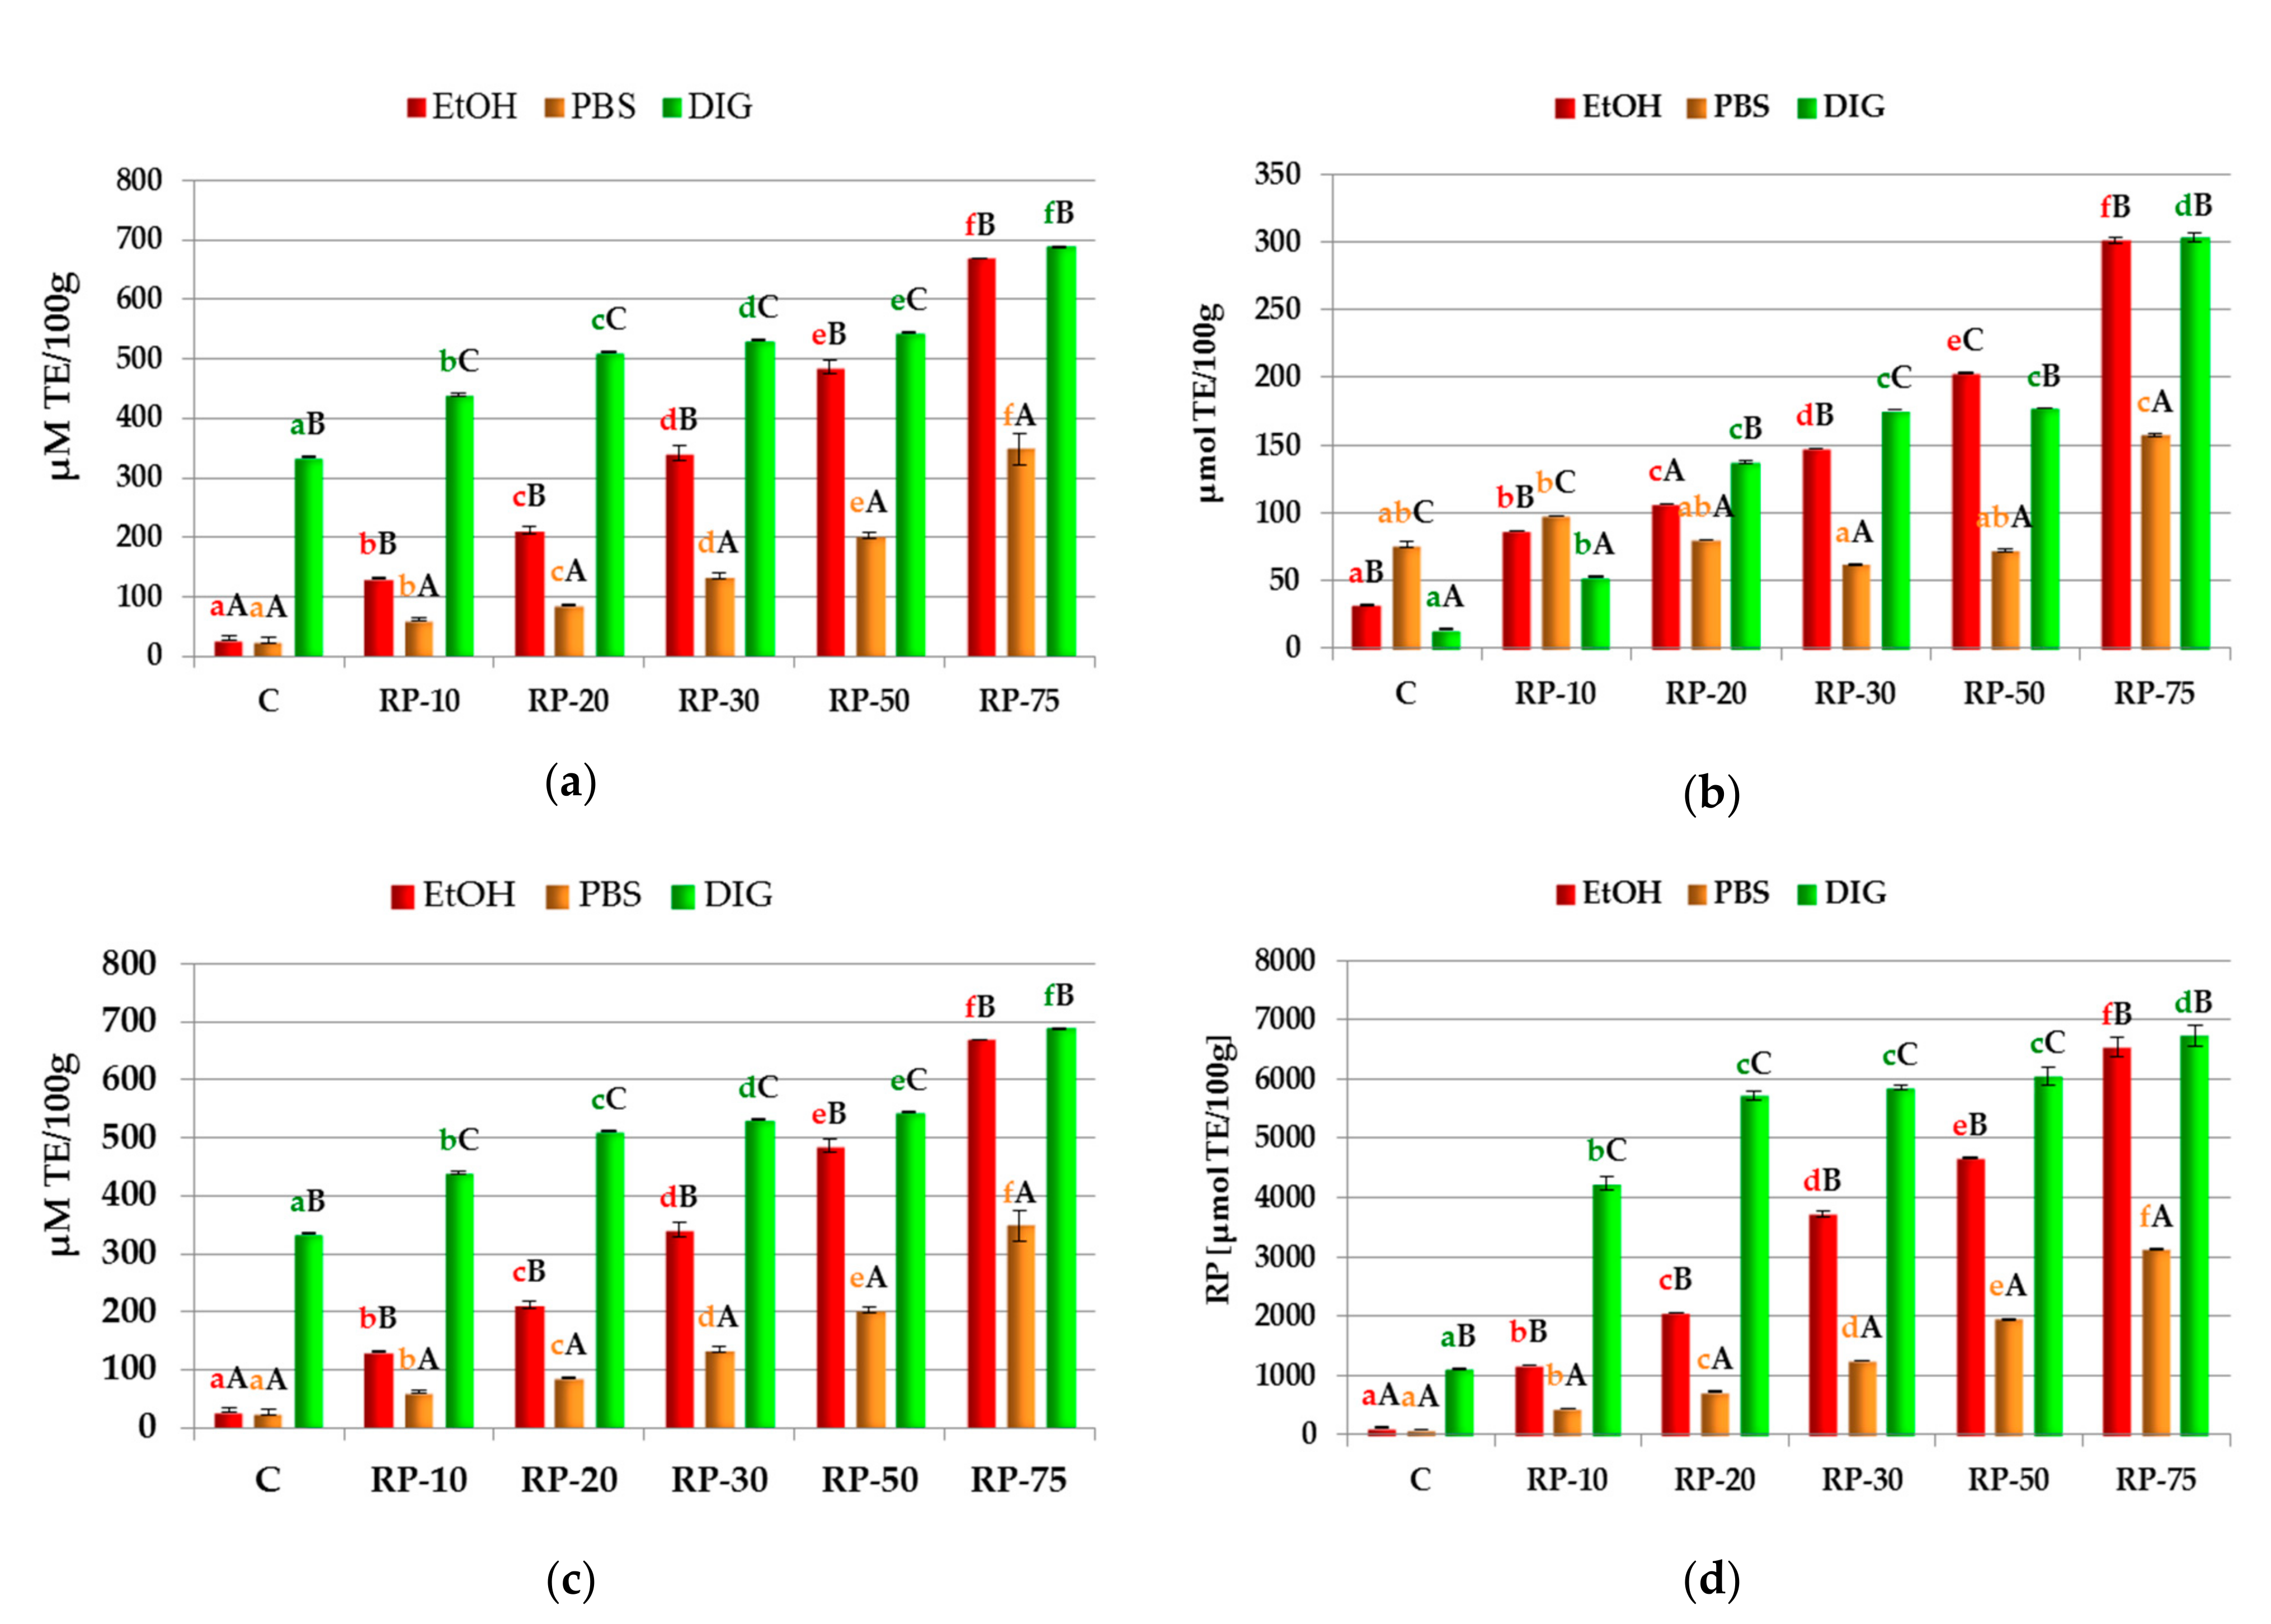
3.3. Phenolic Content

The total content of polyphenolic compounds in the tested wafer extracts expressed as gallic acid equivalent (GAE) varied considerably and depended on the concentration of raspberry pomace in the individual variants of enriched products (Table 4). In the ethanol extracts, the polyphenol content increased with the pomace concentration. The lowest concentration of these compounds was determined in the control variant—80.618 mg/100 g d.w., while the highest concentration was detected in the RP-75 variant—753 mg/100 g d.w. In the PBS extracts, the addition of raspberry pomace increased the total content of polyphenolic compounds. The lowest concentration was obtained in the non-fortified (control) wafer variant—64.83 mg/100 g d.w., and the highest values were determined in the RP-75 variant—251.83 mg/100 g d.w. All pomace-supplemented wafer variants subjected to simulated digestion were characterized by a higher concentration of polyphenols than in the control (C), which had the lowest value—389.79 mg/100 g d.w. The highest concentration of phenolic compounds was found in the RP-75 variant—802 mg/100 g d.w. The comparison of the total content of polyphenolic compounds between the three types of extracts (ethanol, PBS and after in vitro digestion) showed clear differences. In all samples exposed to the simulated digestion process, the concentration of polyphenols was correspondingly higher than in the ethanol and PBS extracts. The lowest values were determined in the PBS extracts.
The content of phenolic acids in the examined wafer extracts calculated as caffeic acid equivalent depended primarily on the type of extract and the concentration of raspberry pomace in the individual samples. In the ethanol extracts, only small amounts of phenolic acids were found in the control variant—14.41 µg/100 g d.w., while the highest concentration was detected in the RP-75 wafer—249.86 µg/100 g d.w. In the buffer extracts, the concentration of phenolic acids increased with the increase in the content of pomace in individual variants. As in the case of the ethanol extracts, the lowest value was noted in the control sample—10.81 µg/100 g d.w., whereas the highest content of these compounds was determined in the RP-75 product—198.2 µg/100 g d.w. The variants of extracts from the raspberry pomace-enriched wafers subjected to in vitro digestion were characterized by higher concentrations of phenolic acids than the control (C), which exhibited the lowest value—300.3 µg/100 g d.w. The highest concentration of these compounds was determined in the RP-75 variant—559.77 µg/100 g d.w. The comparison of the individual variants with the same concentration of pomace showed similar values in both ethanol and PBS extracts from the control wafers. The in vitro digestion process contributed to a two-fold increase in the phenolic acid content in the ethanol extracts of the other samples.
The total flavonoid content in the tested extracts varied over a wide range of values. The lowest concentration of flavonoids in the ethanol extracts, i.e., 42 mg/100 g d.w., was determined in the pomace non-supplemented variant (C), whereas the highest concentration was observed in the RP-75 sample 388 mg/100 g. The increase in the percentage of pomace was accompanied by an increase in the flavonoid concentration in the tested extracts. In the PBS extracts from the enriched wafers, the content of flavonoids was several times higher than in the control variant without the addition of pomace, the value of which was estimated at 36 mg/100 g d.w. The highest concentration of the determined compounds was found in the RP-75 sample—223 mg/100 g d.w. In the case of extracts obtained in the process of simulated in vitro digestion, the lowest amount of flavonoids was in variant C—241 mg/100 g d.w., while the largest amount was recorded in the RP-75 variant—692 mg/100 g d.w. The in vitro digestion process contributed to two-fold (compared to ethanol extracts) and three-fold (compared to PBS extracts) higher content of flavonoid compounds.
The anthocyanin content in ethanol extracts was several times higher than in the control variant. The lowest concentration, i.e., 7 mg/100 g d.w., was determined for the RP-10 sample. The highest concentration of these compounds was found in the RP-75 sample—63 mg/100 g d.w. In the case of the PBS extracts, trace amounts of anthocyanin dyes were found in the RP-10 sample—2 mg/100 g d.w. Raspberry pomace is rich in anthocyanins; hence, the content of these compounds in the buffer extracts obtained from the pomace-enriched wafers increased. The anthocyanin content in the ethanol samples was on average twice as high as in the case of the PBS extracts. In the case of the in vitro digested extracts, the anthocyanin content was almost as high as in EtOH extracts.

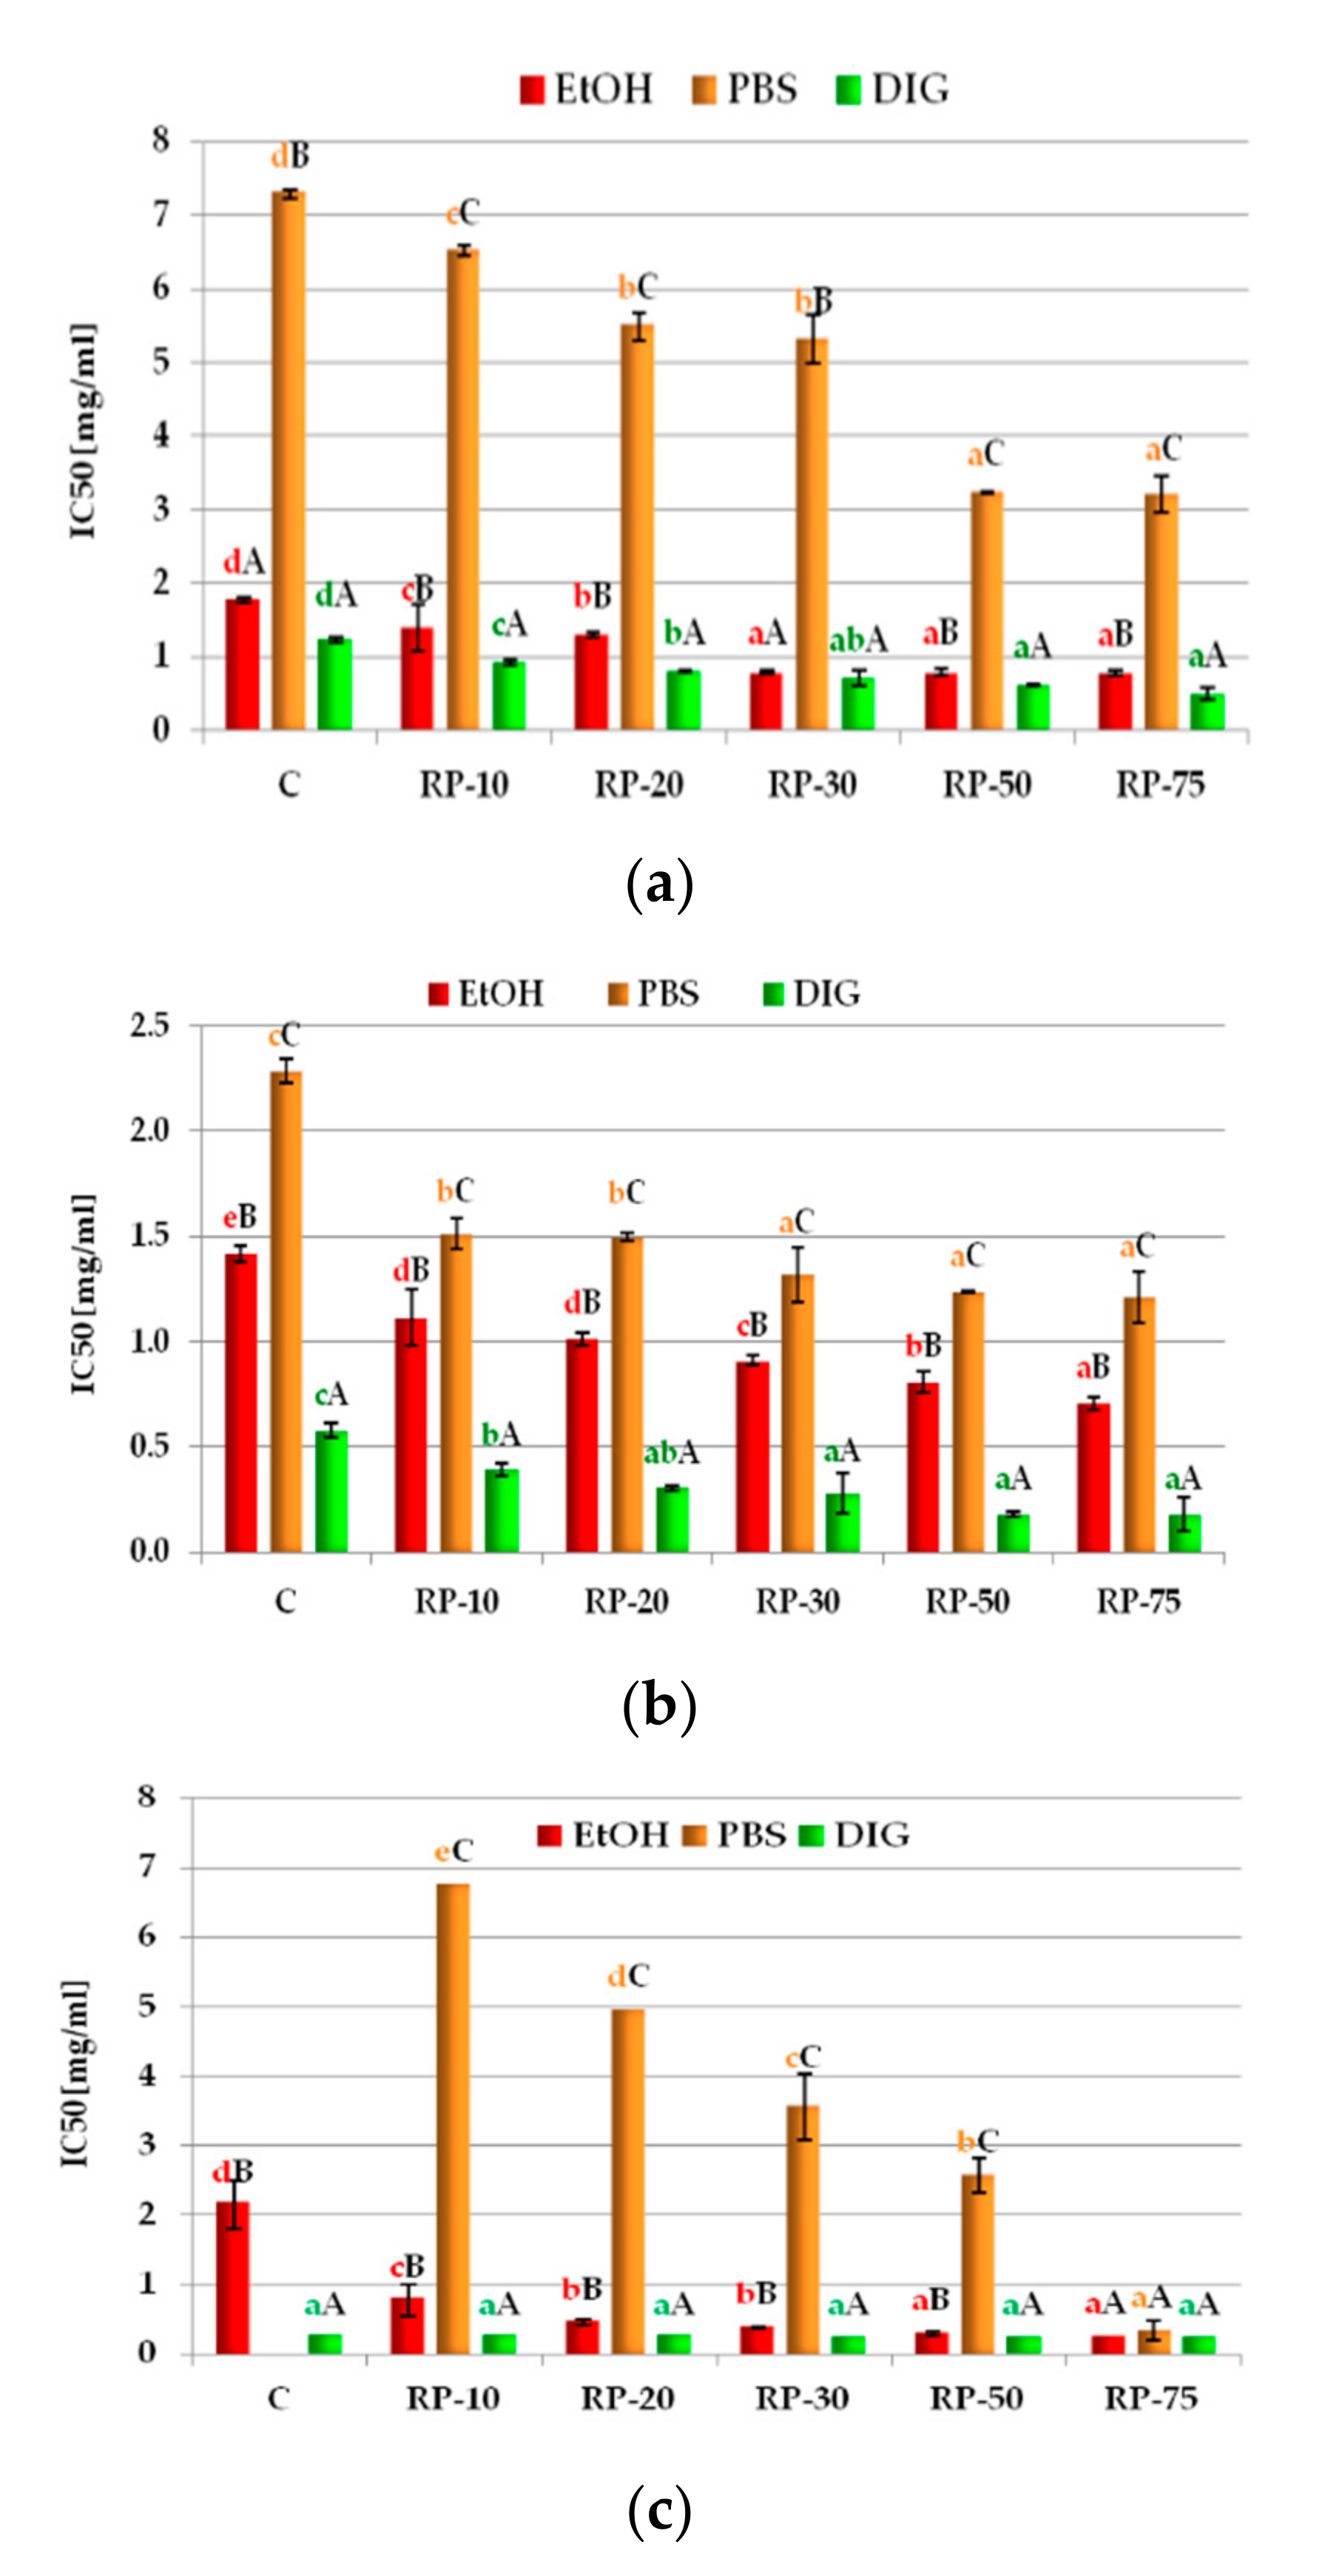
3.4. Antioxidant Activity of Raspberry Pomace-Enriched Wafers

The following relationship was observed in all samples obtained from wafers enriched with freeze-dried raspberry pomace: the ability of the ethanol extracts to neutralize the ABTS•+ radical increased with the increasing concentration of pomace (Figure 3a). All wafer variants showed a significant increase in the % inhibition of ABTS•+, compared to the control sample, for which this value was only 30.11 µmol TE/100 g dw. The highest antiradical activity was found in the RP-75 sample—669.77 µmol TE/100 g d.w. The PBS extracts showed a much smaller increase in ABTS•+ inhibition. The lowest value was obtained in the control variant—26.41 µmol TE/100 g d.w., while the highest antiradical activity was determined in the sample with the highest concentration of pomace (RP-75)—348.62 µmol TE/100 g d.w. All wafer variants obtained in the process of simulated digestion showed a significant increase in the % inhibition of ABTS•+, compared to the control sample (C), where the value was determined at the level of 334.36 µmol TE/100 g d.w. The highest anti-radical activity was observed in sample RP-75 (688.78 µmol TE/100 g d.w.), which was also the highest result among all tested samples. The comparison of the types of extracts showed the highest anti-radical activity against ABTS•+ of the wafer samples subjected to the in vitro digestion process. In the case of the sample containing the highest concentration of pomace (RP-75), the results were comparable to the values obtained for the ethanol extracts; however, the values were twice as high as in the case of the PBS extracts.
The ability to neutralize DPPH free radicals is shown in Figure 3b. In all wafer variants enriched with freeze-dried raspberry pomace, the ability of the ethanol extracts to neutralize the DPPH radical increased with the increasing concentration of pomace. The ethanol extract from the wafers with the highest addition of the lyophilizate neutralized the DPPH radical almost 10 times more effectively than the control extract. In turn, the relationship between the concentration of the additive and the antioxidant capacity in the case of the buffer extracts was not directly proportional. The highest capacity to neutralize the DPPH radical (157.44 µmol Trolox/100 g d.w.) was determined in the RP-75 sample. In the case of the other enriched variants, the values ranged from 61.89 to 97.95 µmol Trolox/100 g d.w. All fortified wafer samples subjected to the simulated in vitro digestion process showed much stronger anti-radical abilities compared to the control. The RP-75 sample was characterized by the highest anti-radical activity—303.05 µmol of Trolox/100 g of d.w. Comparable levels of anti-radical activity against DPPH were obtained for the ethanol extracts and the simulated in vitro digestion trials. The PBS extracts showed two times lower antioxidant activity.
The increase in the concentration of the added raspberry pomace increased the Fe2+ chelating capacity of the ethanol extracts (Figure 3c). All wafer variants enriched with freeze-dried raspberry pomace were characterized by an increased ability to chelate iron (II) ions compared to the non-supplemented control (C), where the value was 33.69 mgEDTA/100 g d.w. The highest chelating capacity was exhibited by RP-75—39.54 mgEDTA/100 g d.w. The iron chelating capacity of the buffer extracts from the wafers ranged from 36.23 mgEDTA/100 g d.w. (sample C) to 45.69 mgEDTA/100 g d.w. (RP-75) and was significantly lower for all fortified samples than that determined for the ethanol extracts. After simulated digestion, the chelating activity increased significantly in all samples, except RP-75, compared to the ethanol extracts.
All fortified wafer extracts showed significantly higher power reduction values than the control wafers. The lowest values were determined for the buffer extracts, and the highest results were obtained for the simulated digestion extracts. It should be noted, however, that the higher the addition of freeze-dried pomace to the wafers was, the smaller the difference in the value of the reduction power was noted between the EtOH and DIG samples (Figure 3d).

3.5. Potential Anti-Inflammatory Properties

Potential anti-inflammatory properties were expressed as the ability to inhibit three enzymes involved in the induction of inflammation in the organism, i.e., xanthine oxidase (XO), lipoxygenase (LOX), and cyclooxygenase 2 (COX-2). The results are presented in Figure 4.
Extracts prepared from wafers enriched with raspberry pomace caused a varied degree of inhibition of the activity of enzymes involved in the pathogenesis of inflammation. The strongest inhibitory activities, i.e., the lowest IC50 values, were recorded for extracts obtained after simulated digestion. It is worth noting, however, that the degree of inhibition of XO and LOX increased with the addition of pomace, while all IC50 values were similar in the case of COX-2 (mean IC50 = 0.23 mg/mL).
The ethanol extracts inhibited LOX and XO at a similar levels, which was relatively proportional to the concentration of the additive in the wafers, while a much larger difference was found between the control and enriched wafers in the case of COX-2 inhibition.
The highest IC50 values in relation to all enzymes were determined for the PBS extracts. The buffer extract from the control wafers did not inhibit the activity of cyclooxygenase-2, but the RP-75 variant showed the ability to inhibit this enzyme at a level similar to the EtOH and DIG extracts. In the case of COX-2, the inhibitory activity increased proportionally to the amount of additive. Inhibition of LOX and XO by the buffer extracts showed a similar trend, with an average of a three times lower degree of inhibition of xanthine oxidase than that of lipoxygenase.

3.6. Correlation Analysis

In the case of the ethanol extracts, very high positive correlations were found between the content of total polyphenols and the ability to neutralize the DPPH radical (r = 0.99), the ability to neutralize the ABTS•+ radical (r = 1.00), and the ability to chelate iron ions Fe2+ (r = 0.98) and reduce power (r = 0.99). Similar correlations were found between phenolic acids and flavonoids and all methods used for the determination of antioxidant capacity (r > 0.95) (Table 5).
Lower correlation coefficients between the ability to neutralize the DPPH radical and the content of phenolic compounds (r = 0.50), phenolic acids (r = 0.63), flavonoids (r = 0.72), and anthocyanins (r = 0.64) were obtained for the PBS extracts. A relatively high positive correlation was demonstrated between the concentration of phenolic acids and the Fe2+ chelating ability (r = 0.87) and between the content of flavonoids and chelating properties (r = 0.79). All correlation coefficients were very high in the analysis of the in vitro digested extracts (r > 0.92). The coefficients reached lower values only in the case of the relationship between the power reduction and the content of phenolic acids, flavonoids, and anthocyanins: r = 0.89, r = 0.84, and r = 0.75, respectively. In turn, the correlation between the content of phenolic compounds and potential anti-inflammatory properties varied. A negative correlation was found between the polyphenol content and the IC50 values determined for COX-2 inhibition by all types of extracts. Pearson’s correlation coefficients were lower than −0.72 for the ethanol extracts, while very high coefficients (−0.96 to −0.99) were found for the buffer extracts and those obtained after simulated digestion.
Regarding the potential anti-inflammatory properties, the inhibitory activity of the extracts against XO, LOX, and COX-2 was expressed as the IC50 value; hence, all correlation coefficients were negative. This means that the higher the content of the tested compounds, the lower the IC50 value, i.e., the stronger the inhibitory properties. A very high correlation was found between the content of all analyzed groups of phenolic compounds and the ability to inhibit LOX by the ethanol extracts (all r values > −0.9). Lower coefficients were recorded for XO (r from −0.82 to −0.88) and the lowest values were recorded for COX-2 (from −0.68 to −0.72). In the case of the PBS extracts, very high correlations were found between the content of all polyphenol groups and the ability to inhibit COX-2 and XO. However, with regard to the extracts obtained after in vitro digestion, the relationships between the concentration of polyphenols and the inhibitory properties were very high for all three tested enzymes.

4. Discussion

The research presented in this study was aimed at increasing the antioxidant potential of wafers by enrichment thereof with freeze-dried raspberry pomace. The aim of the work was to obtain a product with the highest possible antioxidant activity and consumer acceptance at the same time.
During the production of raspberry juice, almost 2/3 of anthocyanins remain in the pomace. Therefore, it is worth looking for a way to use the waste for the production of functional food. Raspberries contain mainly cyanidin derivatives, which was confirmed in our study and in the literature [3,32,33].
The content and qualitative composition of the anthocyanin fraction significantly affects the color of the final product. Color is one of the first features that potential consumers notice. In the present study, with the increase in the share of pomace in the wafer cake, the color became darker (a decrease in the L* parameter) and redder (an increase in the a* parameter). The main anthocyanin dye in raspberry pomace is cyanidin-3-O-sophoroside, which increases the redness in fortified wafers. Literature data confirm that the enrichment of confectionery with berry fruit pomace, which is rich in anthocyanins, may be an alternative to artificial dyes. The intensity of the color and its shade depend on the type and quantity of pomace and the type of prepared dough. Tarasevičienė et al. enriched cakes with redcurrant, raspberry, and strawberry pomace replacing flour in the amount of 10%, 15%, and 20%. They showed that (except for the control) the dough with 10% redcurrant pomace was the lightest and dough enriched with 20% strawberry pomace was the darkest. In turn, the analysis of the color of ready cookies showed the darkest color of cookies supplemented with 20% strawberry pomace, while those enriched with 15% raspberry pomace flour were more reddish [34]. Similarly, in studies conducted by Sarić et al., substitution of 30% of a gluten-free flour mixture with different proportions of raspberry and blueberry pomace led to an increase in darkness and redness and a decrease in yellowness of cookies [35].
Although many consumers are still hesitant to try new products, the sensory evaluation showed that the wafers with the medium addition of pomace were generally well rated. The higher amounts of pomace added changed the consistency of the wafers and their excessively sour taste was perceptible. Since wafers are not always an independent meal but are more often eaten with the addition of cream or ice cream, the sour taste does not have to be a disadvantage. Organoleptic evaluation of cookies supplemented with blackcurrant, elderberry, rowanberry, and wild rose pomace showed the highest level of acceptance for the rosehip pomace-enriched cookies and the lowest acceptance for the rowanberry pomace-supplemented product [15]. Nine-level sensory evaluation of cookies with the addition of raspberry, strawberry, and redcurrant pomace showed that cookies with 10% raspberry pomace were the most delicious for consumers. The highest average overall score was given to cookies with 20% addition of strawberry pomace. The least attractive were those with 15% redcurrant pomace [34].
The analysis of the total content of polyphenolic compounds revealed that the enrichment of the wafers with freeze-dried raspberry pomace significantly increased the content of these compounds in all tested extracts. Literature data clearly show a relationship between the concentration of pomace and the amount of polyphenols present in analyzed samples.
Şeker et al. (2014) prepared cakes with the addition of 5%, 10%, and 15% gilaburu fruit (Viburnum opulus) pomace. The total content of polyphenolic compounds in the cakes was 83.6, 124.3, and almost 180 mg/100 g d.w., respectively [36]. Our results indicate that raspberry pomace is richer in polyphenols and rather stable as an ingredient in bakery products. The comparison is even more justified as freeze-dried pomace was used in both studies. In turn, Šarić et al. used convection-dried raspberry and blueberry pomace to enrich gluten-free cookies. They also confirmed that, in comparison to control wafers, the TPC content and antioxidant activity of samples containing pomace were significantly improved. However, they noted that the blueberry pomace-enriched product contained up to six times more polyphenols than that fortified with raspberry pomace [35].
In the present study, besides ethanol extracts, buffer extracts were prepared and simulated in vitro digestion was performed. The idea was to determine the amount of polyphenols present in fortified wafers that can constitute potentially bioavailable fractions. Bioaccessibility is defined as the amount of compounds released from their matrix in the gastrointestinal tract available for the intestinal absorption [37,38]. In the gastrointestinal tract, phenolics are released from the food matrix by direct solubilization in the intestinal fluids and through the action of digestive enzymes. In other words, not only does the total content of phenolic compounds have to be taken into account, but also the interactions of matrix components that can significantly affect the amount of polyphenols that can be released from the product in the gastrointestinal tract. The results indicate that the concentration of polyphenols after simulated digestion of wafers with 10–30% pomace was between 4.8 and 2.4 times higher than in the ethanol extracts. With the higher addition, the differences were much smaller, which may indicate an antagonistic interaction between phenolic compounds and the other ingredients (especially fiber) of the wafer dough influencing the potential bioavailability of polyphenols. The lower proportional bioavailability of polyphenols from the RP-50 and RP-75 wafers (i.e., the smaller difference between the EtOH and DIG extracts) may be related to the higher content of dietary fiber that traps bioactive compounds and makes them less accessible to enzymes, hindering their release; therefore, most of them reach the colon intact. However, as reported earlier, this does not make this type of food less beneficial. It has been shown that these compounds can be used by intestinal microflora, demonstrating prebiotic properties and meeting the demand for pro-health antioxidants in the large intestine [17,39,40]. This can be a vital tip for potential producers and nutritionists. Perez et al. (2017) prepared cookies with substitution of 56% of wheat flour with dried blueberry pomace and concluded that the supplemented cookies had highly increased values of antioxidant capacity and polyphenol content, compared with control cookies. These results are in agreement with our studies. They also subjected the cakes to in vitro digestion and found that that 35% of the extractable and hydrolysable phenols are bioaccessible [41].
The process of simulated digestion contributes to the release of potentially bioavailable phenolic compounds from the food matrix showing the ability to inhibit the activity of the LOX and COX-2 enzymes involved in the metabolism of arachidonic acid, from which highly reactive pro-inflammatory compounds, i.e., prostaglandins and leukotrienes, can be generated. Such activity of phenolic compounds, especially those from the group of flavonoids, has been confirmed in the literature [42,43]. Polyphenols present in raspberry pomace are also effective inhibitors of XO, which catalyzes the conversion of hypoxanthine to xanthine and xanthine to uric acid, with concomitant production of hydrogen peroxide and superoxide anions as by-products, which may contribute to intensification of inflammation. The interaction of free radicals with cellular components may result in damage to cells and tissues, and this may contribute to aggravation of inflammation [44]. Numerous in vitro studies have confirmed that anthocyanins show different degrees of COX-2 inhibition depending on the amount of free OH [44,45,46].

5. Conclusions

Replacement of part of flour with freeze-dried raspberry pomace is one of the ways to increase the amount of polyphenolic compounds in the diet and enhance the antioxidant potential of confectionery products. The organoleptic evaluation showed that the RP-20 sample turned out to be the best variant of enriched wafers, while the RP-75 sample was the least accepted one with the worst quality parameters. The addition of raspberry pomace influenced the organoleptic properties of the wafers. The higher the concentration of the pomace in the product is, the more acidic it is and the more the raspberry flavor and aroma become perceptible to the consumer. The content of total phenolic compounds, phenolic acids, flavonoids, and anthocyanins increased with the increasing proportion of freeze-dried raspberry pomace in the wafer variants. There was a relationship between the increase in the concentration of the added pomace and the antioxidant capacity. In this case, the variant with the highest concentration of pomace showed the best antioxidant properties, while the control variant had the weakest antiradical activity. Comparing the types of extracts used, the highest levels of the parameters tested were determined in the extract obtained after the simulated in vitro digestion process. The fortification of the wafers also contributed to the enhancement of the anti-inflammatory potential of the final product. In vitro digestion releases XO, LOX, and COX-2 inhibitors, i.e., compounds with potential anti-inflammatory activity, from the food matrix. Raspberry fruit pomace showing high pro-health potential and proven antioxidant and anti-inflammatory properties can be a valuable raw material for enrichment of wafers and other products; nevertheless, these results require further research to be verified in vivo.

Author Contributions

Conceptualization, U.S.; methodology, U.S. and M.K.; formal analysis, U.S.; investigation, U.S., M.K. and J.B.-N.; writing—original draft preparation, U.S.; writing—review and editing, U.S. and M.K.; visualization, U.S., M.K. and J.B.-N.; supervision, U.S. All authors have read and agreed to the published version of the manuscript.

Funding

This research was funded by the University of Life Sciences in Lublin.

Informed Consent Statement

Informed consent was obtained from all subjects involved in the study.

Data Availability Statement

All relevant data are included in the article.

Conflicts of Interest

The authors declare no conflict of interest.

References

  1. ARR Fruit Market in Poland. Poland is a Significant Fruit Producer Worldwide and in the EU. 2014. Available online: https://www.kowr.gov.pl/uploads/rynek-owocow2014-en.pdf (accessed on 1 June 2021).
  2. IRO2018-Poland_OK_4c01e.pdf. IRO Raspberry. Available online: https://www.internationalraspberry.net/ (accessed on 6 June 2021).
  3. Brodowska, A.J. Raspberry pomace—composition, properties and application. Eur. J. Biol. Res. 2017, 7, 86–96. [Google Scholar] [CrossRef]
  4. Gómez, M.; Martinez, M.M. Fruit and vegetable by-products as novel ingredients to im prove the nutritional quality of baked goods. Crit. Rev. Food Sci. Nutr. 2018, 58, 2119–2135. [Google Scholar] [CrossRef] [PubMed]
  5. Sagar, N.A.; Pareek, S.; Sharma, S.; Yahia, E.M.; Lobo, M.G. Fruit and Vegetable Waste: Bioactive Compounds, Their Extraction, and Possible Utilization. Compr. Rev. Food Sci. Food Saf. 2018, 17, 512–531. [Google Scholar] [CrossRef] [PubMed] [Green Version]
  6. Krivokapić, S.; Vlaovićc, M.; Damjanović Vratnica, B.; Perović, A.; Perović, S. Biowaste as a Potential Source of Bioactive Compounds—A Case Study of Raspberry Fruit Pomace. Foods 2021, 10, 706. [Google Scholar] [CrossRef] [PubMed]
  7. Fotschki, B.; Juśkiewicz, J.; Jurgoński, A.; Kosmala, M.; Milala, J.; Zduńczyk, Z.; Markowski, J. Grinding levels of raspberry pomace affect intestinal microbial activity, lipid and glucose metabolism in Wistar rats. Food Res. Int. 2019, 120, 399–406. [Google Scholar] [CrossRef] [PubMed]
  8. Majewski, M.; Kucharczyk, E.; Kaliszan, R.; Markuszewski, M.; Fotschki, B.; Juśkiewicz, J.; Borkowska-Sztachańska, M.; Ognik, K. The Characterization of Ground Raspberry Seeds and the Physiological Response to Supplementation in Hypertensive and Normotensive Rats. Nutrients 2020, 12, 1630. [Google Scholar] [CrossRef] [PubMed]
  9. Pérez-Jiménez, J.; Neveu, V.; Vos, F.; Scalbert, A. Identification of the 100 richest dietary sources of polyphenols: An application of the Phenol-Explorer database. Eur. J. Clin. Nutr. 2010, 64, S112–S120. [Google Scholar] [CrossRef] [PubMed]
  10. Scalbert, A.; Manach, C.; Morand, C.; Rémésy, C.; Jiménez, L. Dietary polyphenols and the prevention of diseases. Crit. Rev. Food Sci. Nutr. 2005, 45, 287–306. [Google Scholar] [CrossRef] [PubMed]
  11. Anantharaju, P.G.; Gowda, P.C.; Vimalambike, M.G.; Madhunapantula, S.V. An overview on the role of dietary phenolics for the treatment of cancers. Nutr. J. 2016, 15, 1–16. [Google Scholar] [CrossRef] [PubMed] [Green Version]
  12. Fraga, C.G.; Galleano, M.; Verstraeten, S.V.; Oteiza, P.I. Basic biochemical mechanisms behind the health benefits of polyphenols. Mol. Asp. Med. 2010, 31, 435–445. [Google Scholar] [CrossRef] [PubMed]
  13. Masella, R.; Di Benedetto, R.; Varì, R.; Filesi, C.; Giovannini, C. Novel mechanisms of natural antioxidant compounds in biological systems: Involvement of glutathione and glutathione-related enzymes. J. Nutr. Biochem. 2005, 16, 577–586. [Google Scholar] [CrossRef]
  14. Viskelis, J.; Rubinskiene, M.; Bobinas, C.; Bobinaite, R. Enrichment of fruit leathers with berry press cake powder increase product functionality. In Proceedings of the FOODBALT 2017, Jelgava, Latvia, 27–28 April 2017; pp. 75–79. [Google Scholar] [CrossRef]
  15. Tańska, M.; Roszkowska, B.; Czaplicki, S.; Borowska, E.J.; Bojarska, J.; Dąbrowska, A. Effect of fruit pomace addition on shortbread cookies to improve their physical and nutritional values. Plant Foods Hum. Nutr. 2016, 71, 307–313. [Google Scholar] [CrossRef] [Green Version]
  16. Karakaya, S.; Simsek, S.; Eker, A.T.; Pineda-Vadillo, C.; Dupont, D.; Perez, B.; Viadel, B.; Sanz-Buenhombre, M.; Rodriguez, A.G.; Kertész, Z.; et al. Stability and bioaccessibility of anthocyanins in bakery products enriched with anthocyanins. Food Funct. 2016, 7, 3488–3496. [Google Scholar] [CrossRef] [PubMed]
  17. Karaś, M.; Jakubczyk, A.; Szymanowska, U.; Złotek, U.; Zielińska, E. Digestion and bioavailability of bioactive phytochemicals. Int. J. Food Sci. Technol. 2016, 52, 291–305. [Google Scholar] [CrossRef]
  18. Velderrain-Rodríguez, G.; Palafox-Carlos, H.; Wall-Medrano, A.; Ayala-Zavala, J.F.; Chen, C.-Y.O.; Robles-Sánchez, M.; Astiazaran-García, H.; Alvarez-Parrilla, E.; González-Aguilar, G.A. Phenolic compounds: Their journey after intake. Food Funct. 2014, 5, 189–197. [Google Scholar] [CrossRef]
  19. Szymanowska, U.; Baraniak, B.; Bogucka-Kocka, A. Antioxidant, Anti-Inflammatory, and Postulated Cytotoxic Activity of Phenolic and Anthocyanin-Rich Fractions from Polana Raspberry (Rubus idaeus L.) Fruit and Juice—In Vitro Study. Molecules 2018, 23, 1812. [Google Scholar] [CrossRef] [PubMed] [Green Version]
  20. Singleton, V.L.; Rossi, J.A. Colorimetry of Total Phenolics with Phosphomolybdic-Phosphotungstic Acid Reagents. Am. J. Enol. Vitic. 1965, 16, 144–158. [Google Scholar]
  21. Szaufer-Hajdrych, M.; Goślińska, O. The quantitative determination of phenolic acids and antimicrobial activity of Symphoricarpos albus (L.) Blake. Acta Pol. Pharm.-Drug Res. 2004, 61, 69–74. [Google Scholar]
  22. Lamaison, J.L.; Carnart, A. Teneurs en principaux flavonoides des fleurs et des feuilles de crataegus monogyna jacq. Et de crataegus laevigata (poiret) dc. En fonction de la periode de vegetation. Plantes Med. Phyther. 1991, 25, 12–16. [Google Scholar]
  23. Giusti, M.M.; Wrolstad, R.E. Characterization and Measurement of Anthocyanins by UV-Visible Spectroscopy. Curr. Protoc. Food Anal. Chem. 2001, 1, F1.2.1–F1.2.13. [Google Scholar] [CrossRef]
  24. Szymanowska, U.; Baraniak, B. Antioxidant and Potentially Anti-Inflammatory Activity of Anthocyanin Fractions from Pomace Obtained from Enzymatically Treated Raspberries. Antioxidants 2019, 8, 299. [Google Scholar] [CrossRef] [Green Version]
  25. Re, R.; Pellegrini, N.; Proteggente, A.; Pannala, A.; Yang, M.; Rice-Evans, C. Antioxidant activity applying an improved ABTS radical cation decolorization assay. Free Radic. Biol. Med. 1999, 26, 1231–1237. [Google Scholar] [CrossRef]
  26. Brand-Williams, W.; Cuvelier, M.E.; Berset, C. Use of a free radical method to evaluate antioxidant activity. LWT-Food Sci. Technol. 1995, 28, 25–30. [Google Scholar] [CrossRef]
  27. Guo, J.-T.; Lee, H.-L.; Chiang, S.-H.; Lin, F.-I.; Chang, C.-Y. Antioxidant Properties of the Extracts from Different Parts of Broccoli in Taiwan. J. Food Drug Anal. 2001, 9, 96–101. [Google Scholar] [CrossRef]
  28. Oyaizu, M. Studies on products of browning reaction. Antioxidative activities of products of browning reaction prepared from glucosamine. Jpn. J. Nutr. Diet. 1986, 44, 307–315. [Google Scholar] [CrossRef] [Green Version]
  29. Szymanowska, U.; Karaś, M.; Złotek, U.; Jakubczyk, A. Effect of Fortification with Raspberry Juice on the Antioxidant and Potentially Anti-Inflammatory Activity of Wafers Subjected to In Vitro Digestion. Foods 2021, 10, 791. [Google Scholar] [CrossRef] [PubMed]
  30. Zhang, Z.-C.; Wang, H.-B.; Zhou, Q.; Hu, B.; Wen, J.-H.; Zhang, J.-L. Screening of effective xanthine oxidase inhibitors in dietary anthocyanins from purple sweet potato (Ipomoea batatas L. Cultivar Eshu No.8) and deciphering of the underlying mechanisms in vitro. J. Funct. Foods 2017, 36, 102–111. [Google Scholar] [CrossRef]
  31. Pathare, P.B.; Opara, L.U.; Al-Said, F. Colour measurement and analysis in fresh and processed food: A review. Food Bioprocess Technol. 2014, 6, 36–60. [Google Scholar] [CrossRef]
  32. Bobinaite, R.; Viškelis, P.; Venskutonis, P.R. Chemical Composition of Raspberry (Rubus spp.) Cultivars. In Nutritional Composition of Fruit Cultivars; Academic Press: Cambridge, MA, USA, 2016; pp. 713–731. ISBN 9780124081178. [Google Scholar]
  33. Bradish, C.M.; Perkins-Veazie, P.; Fernandez, G.E.; Xie, G.; Jia, W. Comparison of Flavonoid Composition of Red Raspberries (Rubus idaeus L.) Grown in the Southern United States. J. Agric. Food Chem. 2011, 60, 5779–5786. [Google Scholar] [CrossRef]
  34. Tarasevičienė, Ž.; Čechovičienė, I.; Jukniūtė, K.; Šlepetienė, A.; Paulauskienė, A. Qualitative properties of cookies enriched with berries pomace. Food Sci. Technol. 2020, 41, 474–481. [Google Scholar] [CrossRef]
  35. Scaronarić, B.; Mišan, A.; Mandić, A.; Nedeljković, N.; Pojić, M.; Pestorić, M.; Đilas, S. Valorisation of raspberry and blueberry pomace through the formulation of value-added gluten-free cookies. J. Food Sci. Technol. 2016, 53, 1140–1150. [Google Scholar] [CrossRef] [Green Version]
  36. Seker, I.T.; Ertop, M.H.; Hayta, M. Physicochemical and bioactive properties of cakes incorporated with gilaburu fruit (Viburnum opulus) pomace. Qual. Assur. Saf. Crop. Foods 2016, 8, 261–266. [Google Scholar] [CrossRef]
  37. Fernández-García, E.; Carvajal-Lérida, I.; Pérez-Gálvez, A. In vitro bioaccessibility assessment as a prediction tool of nutritional efficiency. Nutr. Res. 2009, 29, 751–760. [Google Scholar] [CrossRef] [PubMed]
  38. Hess, J.L. Vitamin E, α-tocopherol. In Antioxidants in Higher Plants; CRC Press: Boca Raton, FL, USA, 2017; pp. 111–134. ISBN 9781351369152. [Google Scholar]
  39. Palafox-Carlos, H.; Ayala-Zavala, J.F.; González-Aguilar, G.A. The Role of Dietary Fiber in the Bioaccessibility and Bioavaila-bility of Fruit and Vegetable Antioxidants. J. Food Sci. 2011, 76, R6–R15. [Google Scholar] [CrossRef] [Green Version]
  40. Pérez-Jiménez, J.; Díaz-Rubio, M.E.; Calixto, F.D.S. Non-extractable polyphenols, a major dietary antioxidant: Occurrence, metabolic fate and health effects. Nutr. Res. Rev. 2013, 26, 118–129. [Google Scholar] [CrossRef] [Green Version]
  41. Perez, C.; Tagliani, C.; Arcia, P.; Cozzano, S.; Curutchet, A. Blueberry by-product used as an ingredient in the development of functional cookies. Food Sci. Technol. Int. 2017, 24, 301–308. [Google Scholar] [CrossRef] [PubMed]
  42. Rathee, P.; Chaudhary, H.; Rathee, S.; Rathee, D.; Kumar, V.; Kohli, K. Mechanism of Action of Flavonoids as Anti-inflammatory Agents: A Review. Inflamm. Allergy-Drug Targets 2009, 8, 229–235. [Google Scholar] [CrossRef]
  43. González-Gallego, J.; García-Mediavilla, M.V.; Sánchez-Campos, S.; Tuñón, M.J. Anti-inflammatory, Immunomodulatory, and Prebiotic Properties of Dietary Flavonoids. In Polyphenols: Prevention and Treatment of Human Disease; Elsevier BV: Amsterdam, The Netherlands, 2018; pp. 327–345. [Google Scholar]
  44. Nile, S.; Khobragade, C.N. In Vitro Anti-inflammatory and Xanthine Oxidase Inhibitory Activity of Tephrosia purpurea Shoot Extract. Nat. Prod. Commun. 2011, 6, 1437–1440. [Google Scholar] [CrossRef] [Green Version]
  45. Seeram, N.P. Cyclooxygenase inhibitory and antioxidant cyanidin glycosides in cherries and berries. Phytomedicine 2001, 8, 362–369. [Google Scholar] [CrossRef]
  46. Miguel, M.G. Anthocyanins: Antioxidant and/or anti-inflammatory activities. J. Appl. Pharm. Sci. 2011, 1, 7–15. [Google Scholar]
Figure 1. Prepared wafers: (A) control, (B) RP-10—wafers with 10% raspberry pomace, (C) RP-20—wafers with 20% raspberry pomace, (D) RP-30—wafers with 30% raspberry pomace, (E) RP-50—wafers with 50% raspberry pomace, (F) RP-75—wafers with 75% raspberry pomace.
Applsci 11 06807 g001
Figure 2. HPLC chromatograms of raspberry pomace extract recorded at 525 nm. Peaks: 1—cyanidin-3-O-sophoroside; 2—cyanidin-3-O-glucoside; 3—cyanidin-3-O-rutinoside.
Applsci 11 06807 g002
Figure 3. Antioxidant properties of wafers fortified with freeze-dried raspberry pomace: (a) ability to neutralize ABTS•+ radicals, (b) ability to neutralize DPPH radicals, (c) ability to chelate iron ions (CHP), (d) reduction power (RP). C—wafers without raspberry pomace (control), RP-10–RP-75—wafers with 10% to 75% raspberry pomace addition, respectively. All values are mean ± standard deviation for triplicate experiments. Means with different small letters show significant differences between samples with different % of supplementation (red—EtOH, orange—PBS, green—DIG) at p ≤ 0.05. Values denoted by the different capital letters are statistically different within the same sample but between the different types of the extract (p < 0.05).
Applsci 11 06807 g003
Figure 4. Xanthine oxidase -XO (a), lipoxygenase—LOX (b), and cyclooxygenase-2—COX-2 (c) inhibitory activity of EtOH, PBS, and DIG extracts from control and fortified wafers. C—wafers without raspberry pomace (control), RP-10–RP-75—wafers with 10% to 75% raspberry pomace addition, respectively. All values are mean ± standard deviation for triplicate experiments. Means with different small letters show significant differences between samples with different % of supplementation (red—EtOH, orange—PBS, green—DIG) at p ≤ 0.05. Values denoted by different capital letters are statistically different within the same sample but between the different types of extract (p < 0.05).
Applsci 11 06807 g004
Table 1. Quantitative anthocyanin profile (mg/100 g d.w.) in freeze-dried raspberry pomace.
CompoundContent [mg/100 g d.w.]
cyanidin-3-O-sophoroside105.44 ± 6.15
cyanidin-3-O-glucoside 35.64 ± 2.08
cyanidin-3-O-rutinoside7.43 ± 0.43
Sum [mg/100 g d.w.] *148.5 ± 8.66
* Expressed as cyanidin-3-O-glucoside equivalent. All values are mean ± standard deviation for triplicate experiments.
Table 2. Sensory values of the control and fortified wafers.
QualityWafer Variants
CRP-10RP-20RP-30RP-50RP-75 Applsci 11 06807 i001
Shape4.06 ± 0.20 a4.17 ± 0.19 ab4.11 ± 0.06 ab4 ± 0.15 c4.56 ± 0.23 a4.06 ± 0.10 a
Color4.72 ± 0.07 d3.11 ± 0.16 a3.67 ± 0.08 b3.64 ± 0.13 b4.17 ± 0.11 c4.39 ± 0.09 c
Surface4.44 ± 0.02 d4.22 ± 0.06 b4.39 ± 0.05 cd4.28 ± 0.01 bc4.22 ± 0.07 b4.06 ± 0.05 a
Consistency4.17 ± 0.18 c4.17 ± 0.06 c4.56 ± 0.04 d3.44 ± 0.17 b2.78 ± 0.14 a2.89 ± 0.06 a
Aroma4.17 ± 0.04 d3.89 ± 0.02 cd3.83 ± 0.20 bc3.56 ± 0.12 ab3.67 ± 0.09 abc3.5 ± 0.04 a
Taste4.28 ± 0.05 c4.06 ± 0.05 bc4.00 ± 0.13 bc3.61 ± 0.09 a3.78 ± 0.17 ab3.56 ± 0.09 a
Overall acceptance4.31 ± 0.06 b3.94 ± 0.20 ab4.09 ± 0.22 ab3.75 ± 0.13 a3.86 ± 0.09 a3.74 ± 0.15 a
C—wafers without raspberry pomace (control), RP-10–RP-75—wafers with 10% to 75% raspberry pomace addition, respectively. All values are mean ± standard deviation. Values in the rows designated by different letters are significantly different (p ≤ 0.05).
Table 3. Assessment of wafer color parameters.
SampleColor Characteristic
L*a*b*C*ΔE
C80.69 ± 3.46 c5.5 ± 0.06 a31.11 ± 1.16 b31.59 ± 1.13 b1.39 ± 0.008 c-
RP-1057.14 ± 0.38 b13.08 ± 1.05 b14.11 ± 3.00 a19.24 ± 2.9 a0.82 ± 0.066 b30.05 ± 3.18 a
RP-2051.55 ± 0.54 b17.68 ± 0.94 c12.4 ± 2.05 a21.59 ± 0.40 a0.61 ± 0.102 ab36.71 ± 3.07 a
RP-3052.09 ± 1.36 b18.52 ± 0.12 c13.52 ± 2.10 a22.93 ± 1.33 a0.63 ± 0.071 ab36.11 ± 0.10 a
RP-5039.33 ± 0.03 a21.87 ± 0.53 d10.17 ± 0.03 a24.12 ± 0.47 a0.43 ± 0.010 a49.21 ± 2.23 b
RP-7535.02 ± 0.36 a21.68 ± 0.87 d11.76 ± 0.67 a24.66 ± 1.08 a0.49 ± 0.007 a52.22 ± 2.92 b
L*—for the lightness from black (0) to white 0.03 (100), a*—from green (−) to red (+), and b*—from blue (−) to yellow (+), C*—chroma, —hue angle, ΔE—total color differences. C—wafers without raspberry pomace (control), RP-10–RP-75—wafers with 10% to 75% raspberry pomace addition, respectively. All values are mean ± standard deviation for triplicate experiments. * Means in the rows marked with the same letters do not differ significantly in terms of p ≤ 0.05.
Table 4. Comparison of the phenolic compound content in different extracts from control and fortified wafers.
Phenolic Compound ContentSample
CRP-10RP-20RP-30RP-50RP-75
EtOH
TPC [mg/100 g d.w.]80.62 ± 8.23 aA183.68 ± 10.58 bA245.18 ± 1.18 cA392.29 ± 16.46 dA588.43 ± 32.91 eA752.99 ± 0.00 fA
TPA [µg/100 g d.w.]14.41 ± 3.40 aA50.45 ± 3.40 bA85.29 ± 5.10 cA121.32 ± 1.70 dA159.76 ± 5.10 eA249.86 ± 3.40 fA
TFd [mg/100 g d.w.]42.10 ± 2.29 aA84.20 ± 2.29 bA123.06 ± 6.87 cA187.82 ± 11.45 dA334.36 ± 3.43 eA387.79 ± 19.46 fA
TAc [mg/100 g d.w.]Nd6.99 ± 1.03 aB15.66 ± 2.07 bB22.65 ± 1.33 cC37.89 ± 3.10 dB62.73 ± 2.80 eB
PBS
TPC 64.83 ± 18.81 aA103.89 ± 3.53 bB122.17 ± 10.58 bB172.87 ± 4.70 cB216.92 ± 8.23 dB251.83 ± 3.53 eB
TPA 10.81 ± 5.10 aA37.24 ± 1.70 bB58.86 ± 8.49 bB93.70 ± 13.59 cB133.34 ± 15.29 dB198.20 ± 22.08 eB
TFd 36.43 ± 5.72 aA48.58 ± 0.00 abB80.96 ± 22.90 abcB101.20 ± 40.07 bcB125.49 ± 5.72 dB222.64 ± 51.52 eB
TAc Nd3.13 ± 0.89 aA5.11 ± 1.03 bA11.2 ± 0.59 cA17.95 ± 0.30 dA28.60 ± 1.48 eA
DIG
TPC 389.79 ± 19.98 aB561.84 ± 2.35 bC596.74 ± 2.35 cC646.61 ± 14.10 dC690.66 ± 3.53 eC802.03 ± 19.9 fC
TPA 300.31 ± 16.99 aB338.75 ± 6.80 bC421.63 ± 5.10 cC464.88 ± 5.10 dC90.10 ± 20.39 eC559.77 ± 6.80 fC
TFd 240.85 ± 20.04 aB350.15 ± 25.76 bC392.65 ± 22.90 bcC441.22 ± 5.72 cC522.18 ± 11.45 dC692.20 ± 57.25 eC
TAc Nd6.54 ± 0.60 aB13.91 ± 3.38 bB17.95 ± 0.65 cB37.92 ± 1.67 dB57.40 ± 2.92 eB
C—wafers without raspberry pomace (control), RP-10–RP-75—wafers with 10% to 75% raspberry pomace addition, respectively; TPC—total phenolic content, TPA—total phenolic acid content, TFd—total flavonoid content, TAc—total anthocyanin content, EtOH—ethanolic extract from wafers, PBS—buffer extract, DIG—samples after in vitro digestion. All values are mean ± standard deviation for triplicate experiments. Values denoted by the different small letters are statistically different within the rows (p < 0.05). Values denoted by the different capital letters are statistically different within the same sample but between the different types of the extract (p < 0.05).
Table 5. Pearson correlation coefficient between values of polyphenol content and antioxidant or anti-inflammatory activity of different extracts from wafers fortified with freeze-dried raspberry pomace.
EtOH
TPCTPATFdTAc
DPPH0.991.000.971.00
ABTS1.000.990.990.99
CHP0.980.990.960.97
RP0.990.990.970.98
XO −0.88−0.86−0.87−0.82
LOX−0.93−0.93−0.91−0.90
COX-2−0.72−0.73−0.70−0.68
PBS
TPCTPATFdTAc
DPPH0.500.630.720.64
ABTS0.960.990.990.99
CHP0.920.870.790.83
RP0.971.000.991.00
XO−0.97−0.95−0.88−0.93
LOX−0.83−0.77−0.69−0.72
COX-2−0.97−0.98−0.96−0.98
DIG
TPCTPATFdTAc
DPPH0.920.950.950.92
ABTS0.980.970.980.92
CHP0.970.970.960.95
RP0.940.890.840.75
XO−0.99−0.96−0.94−0.89
LOX−0.96−0.93−0.89−0.85
COX-2−0.97−0.96−0.99−0.98
C—wafers without raspberry pomace (control), RP-10–RP-75—wafers with 10% to 75% raspberry pomace addition, respectively.
Publisher’s Note: MDPI stays neutral with regard to jurisdictional claims in published maps and institutional affiliations.

