
Fabrication of Magnesium-Aluminum Composites under High-Pressure Torsion: Atomistic Simulation


 and
and 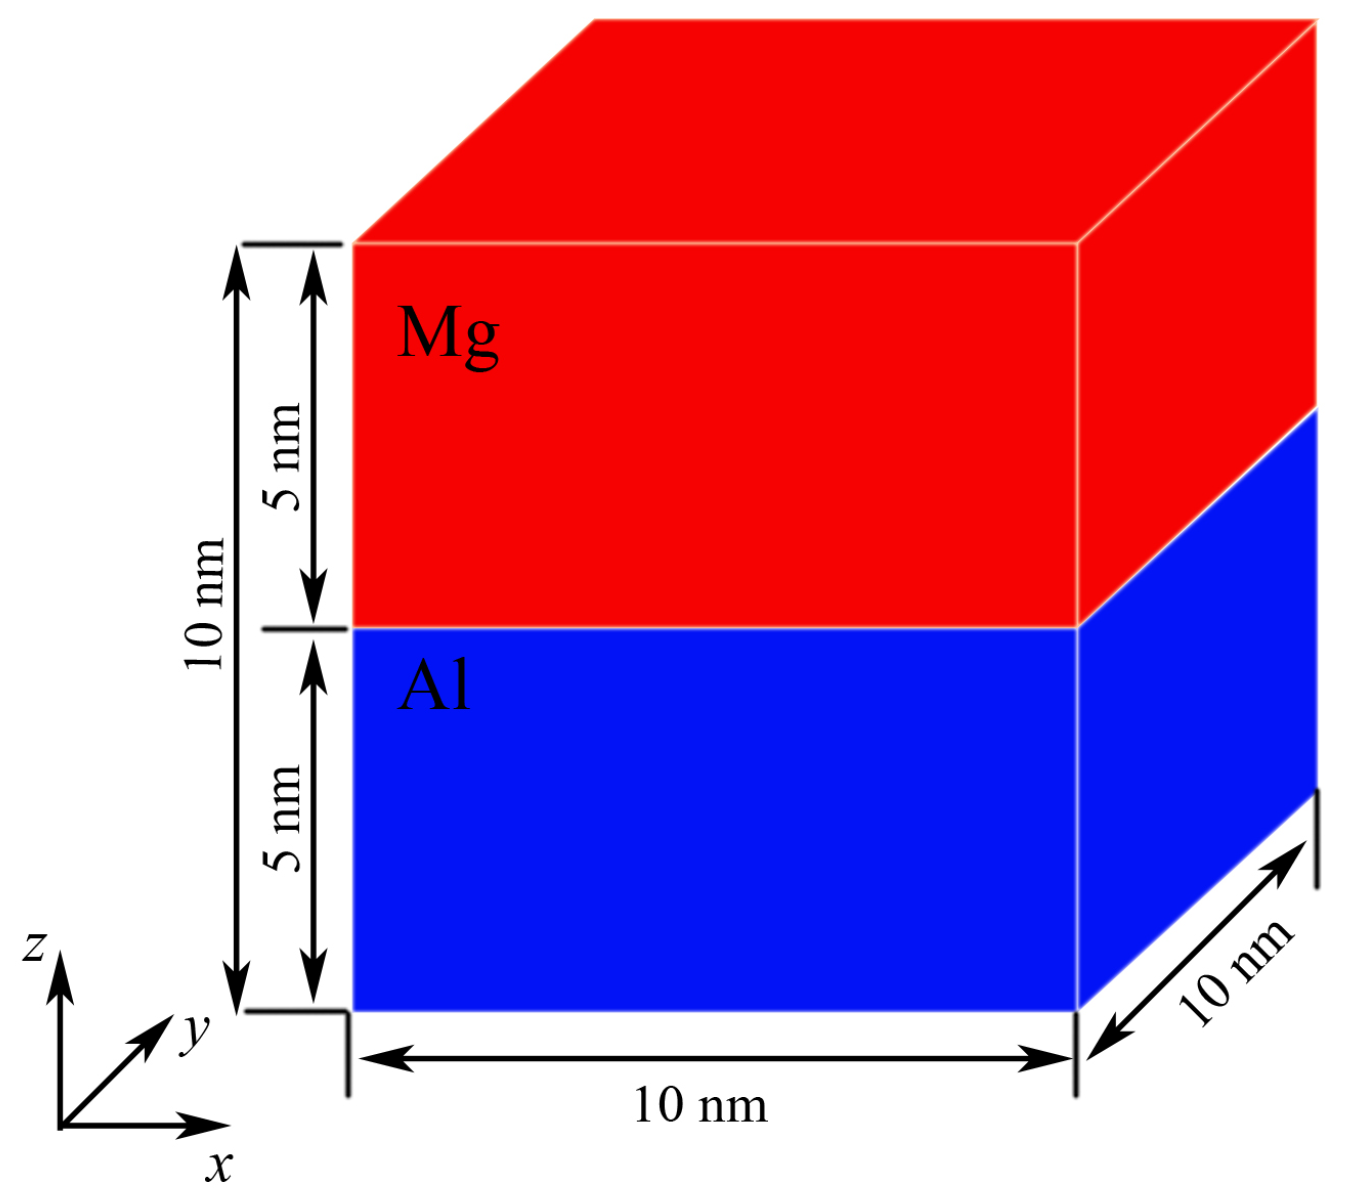
Abstract
:1. Introduction
2. Computational Methods
3. Results
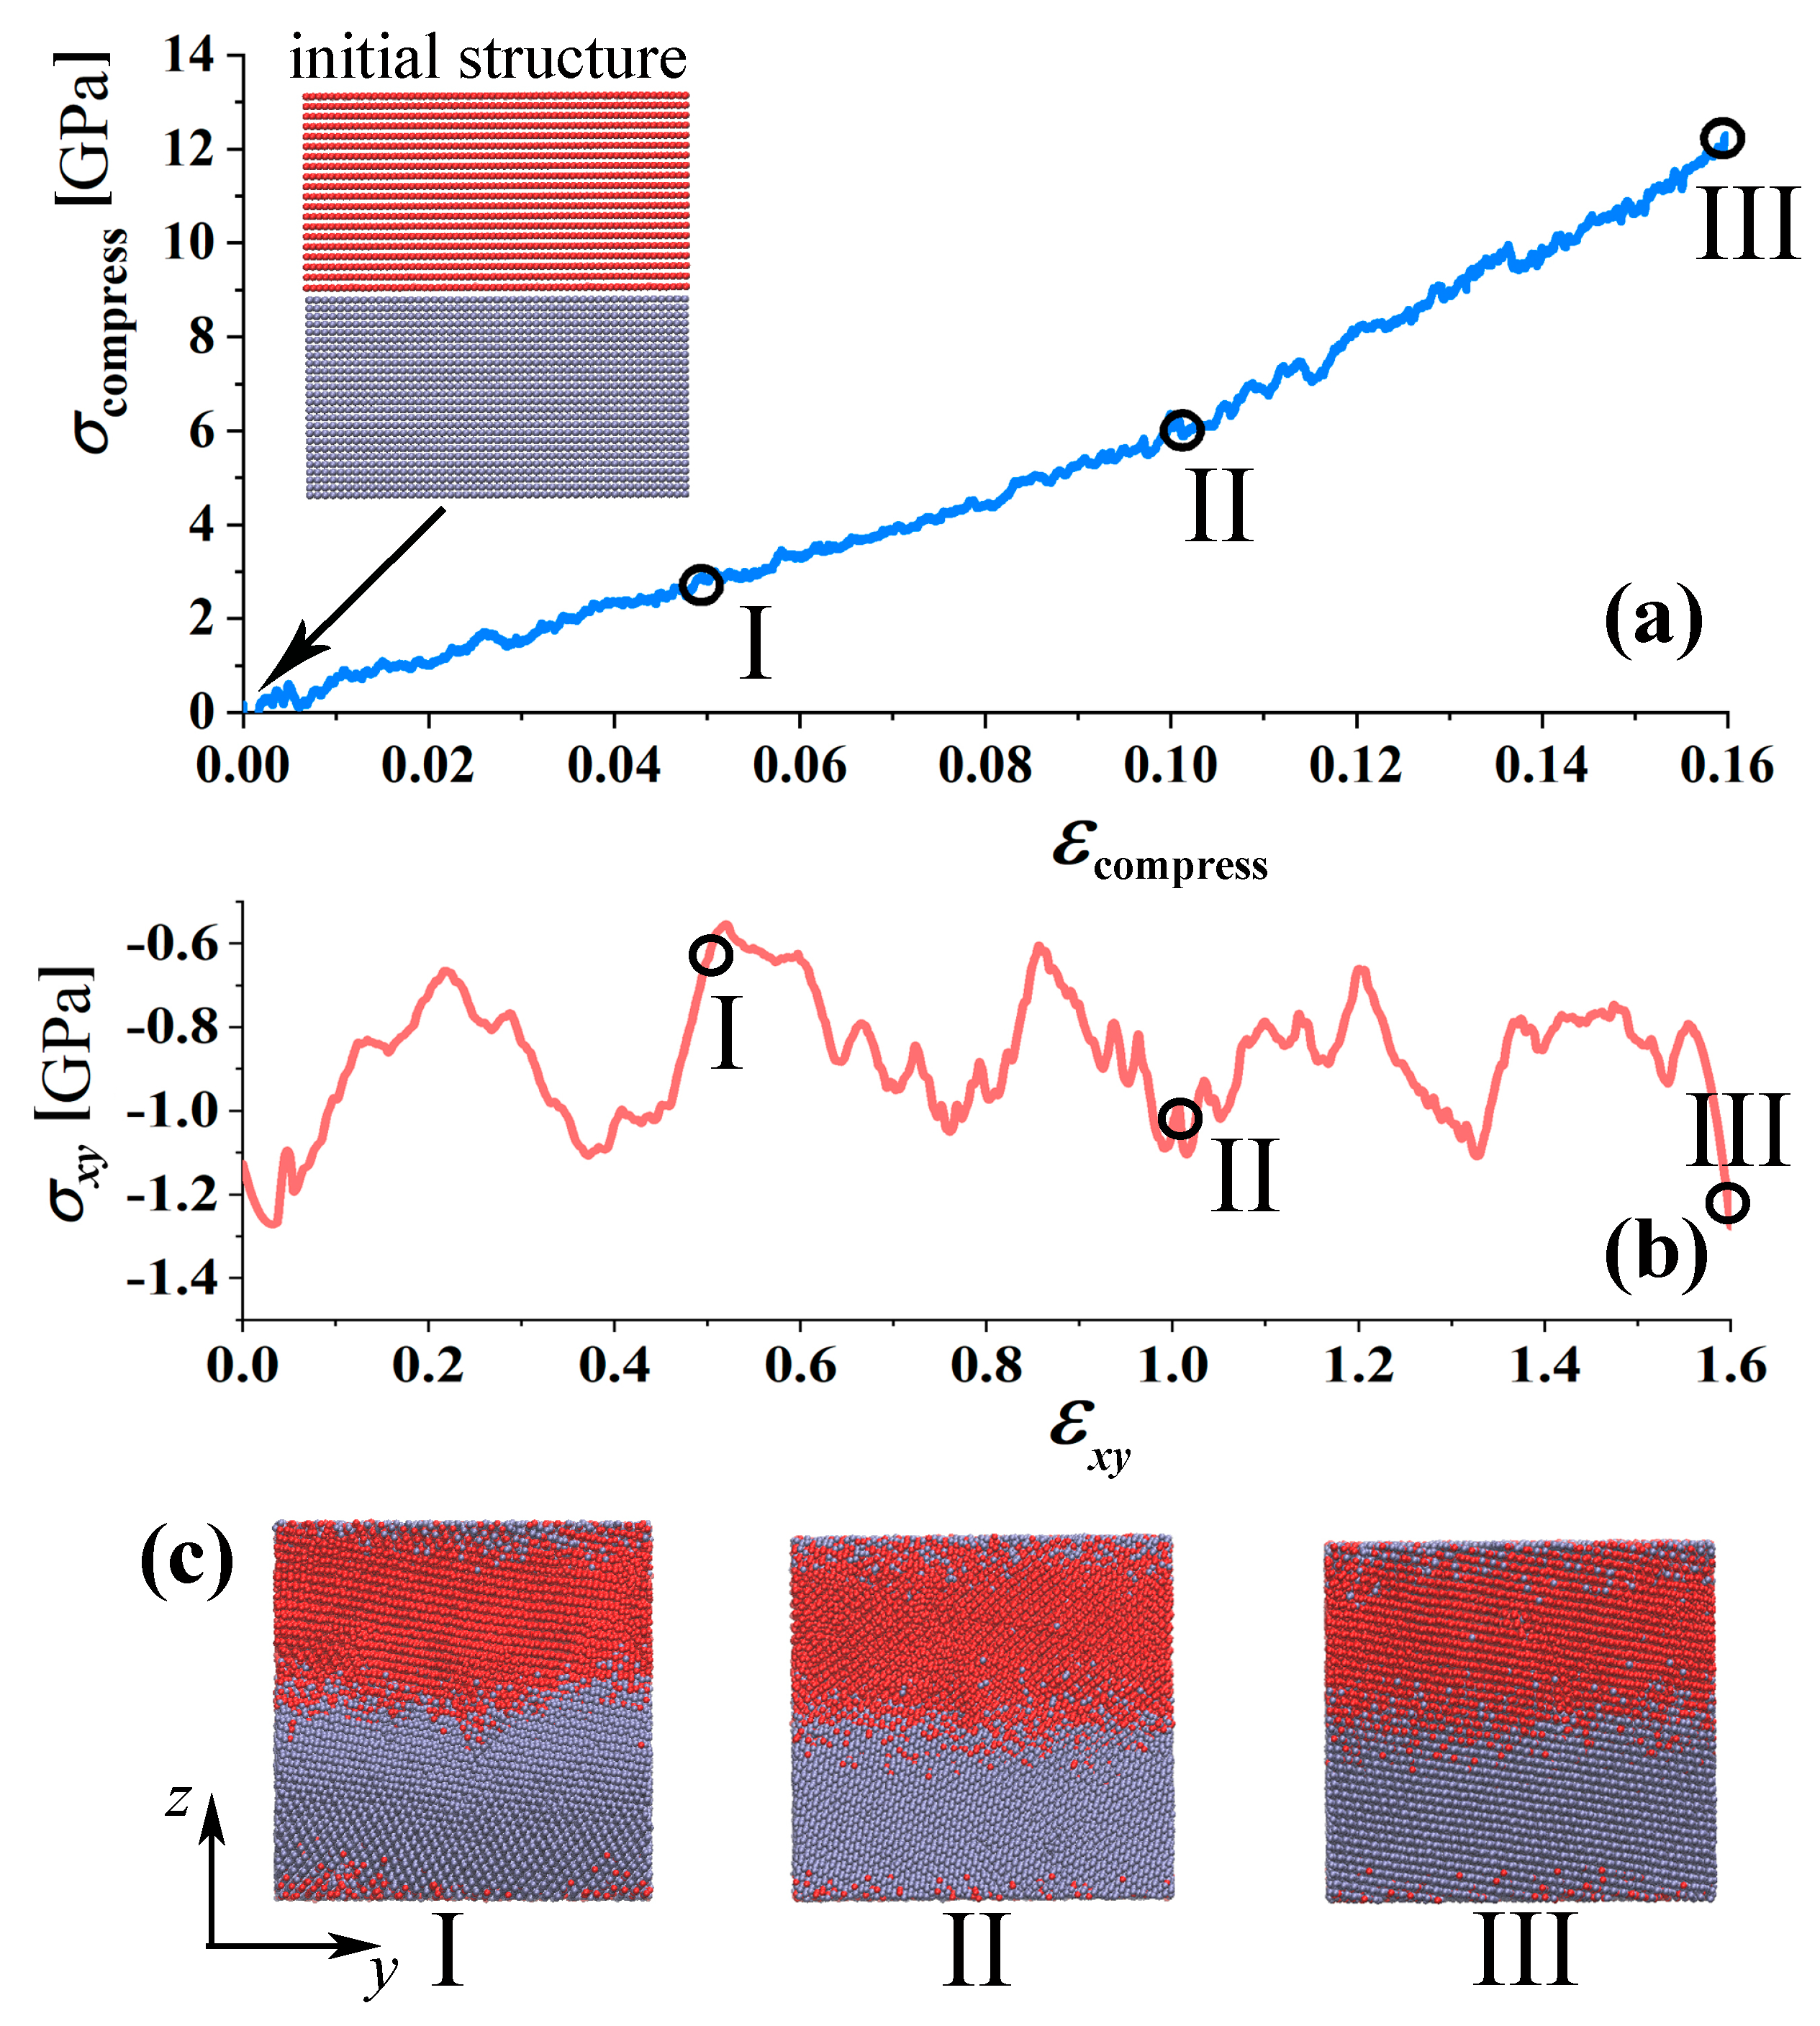
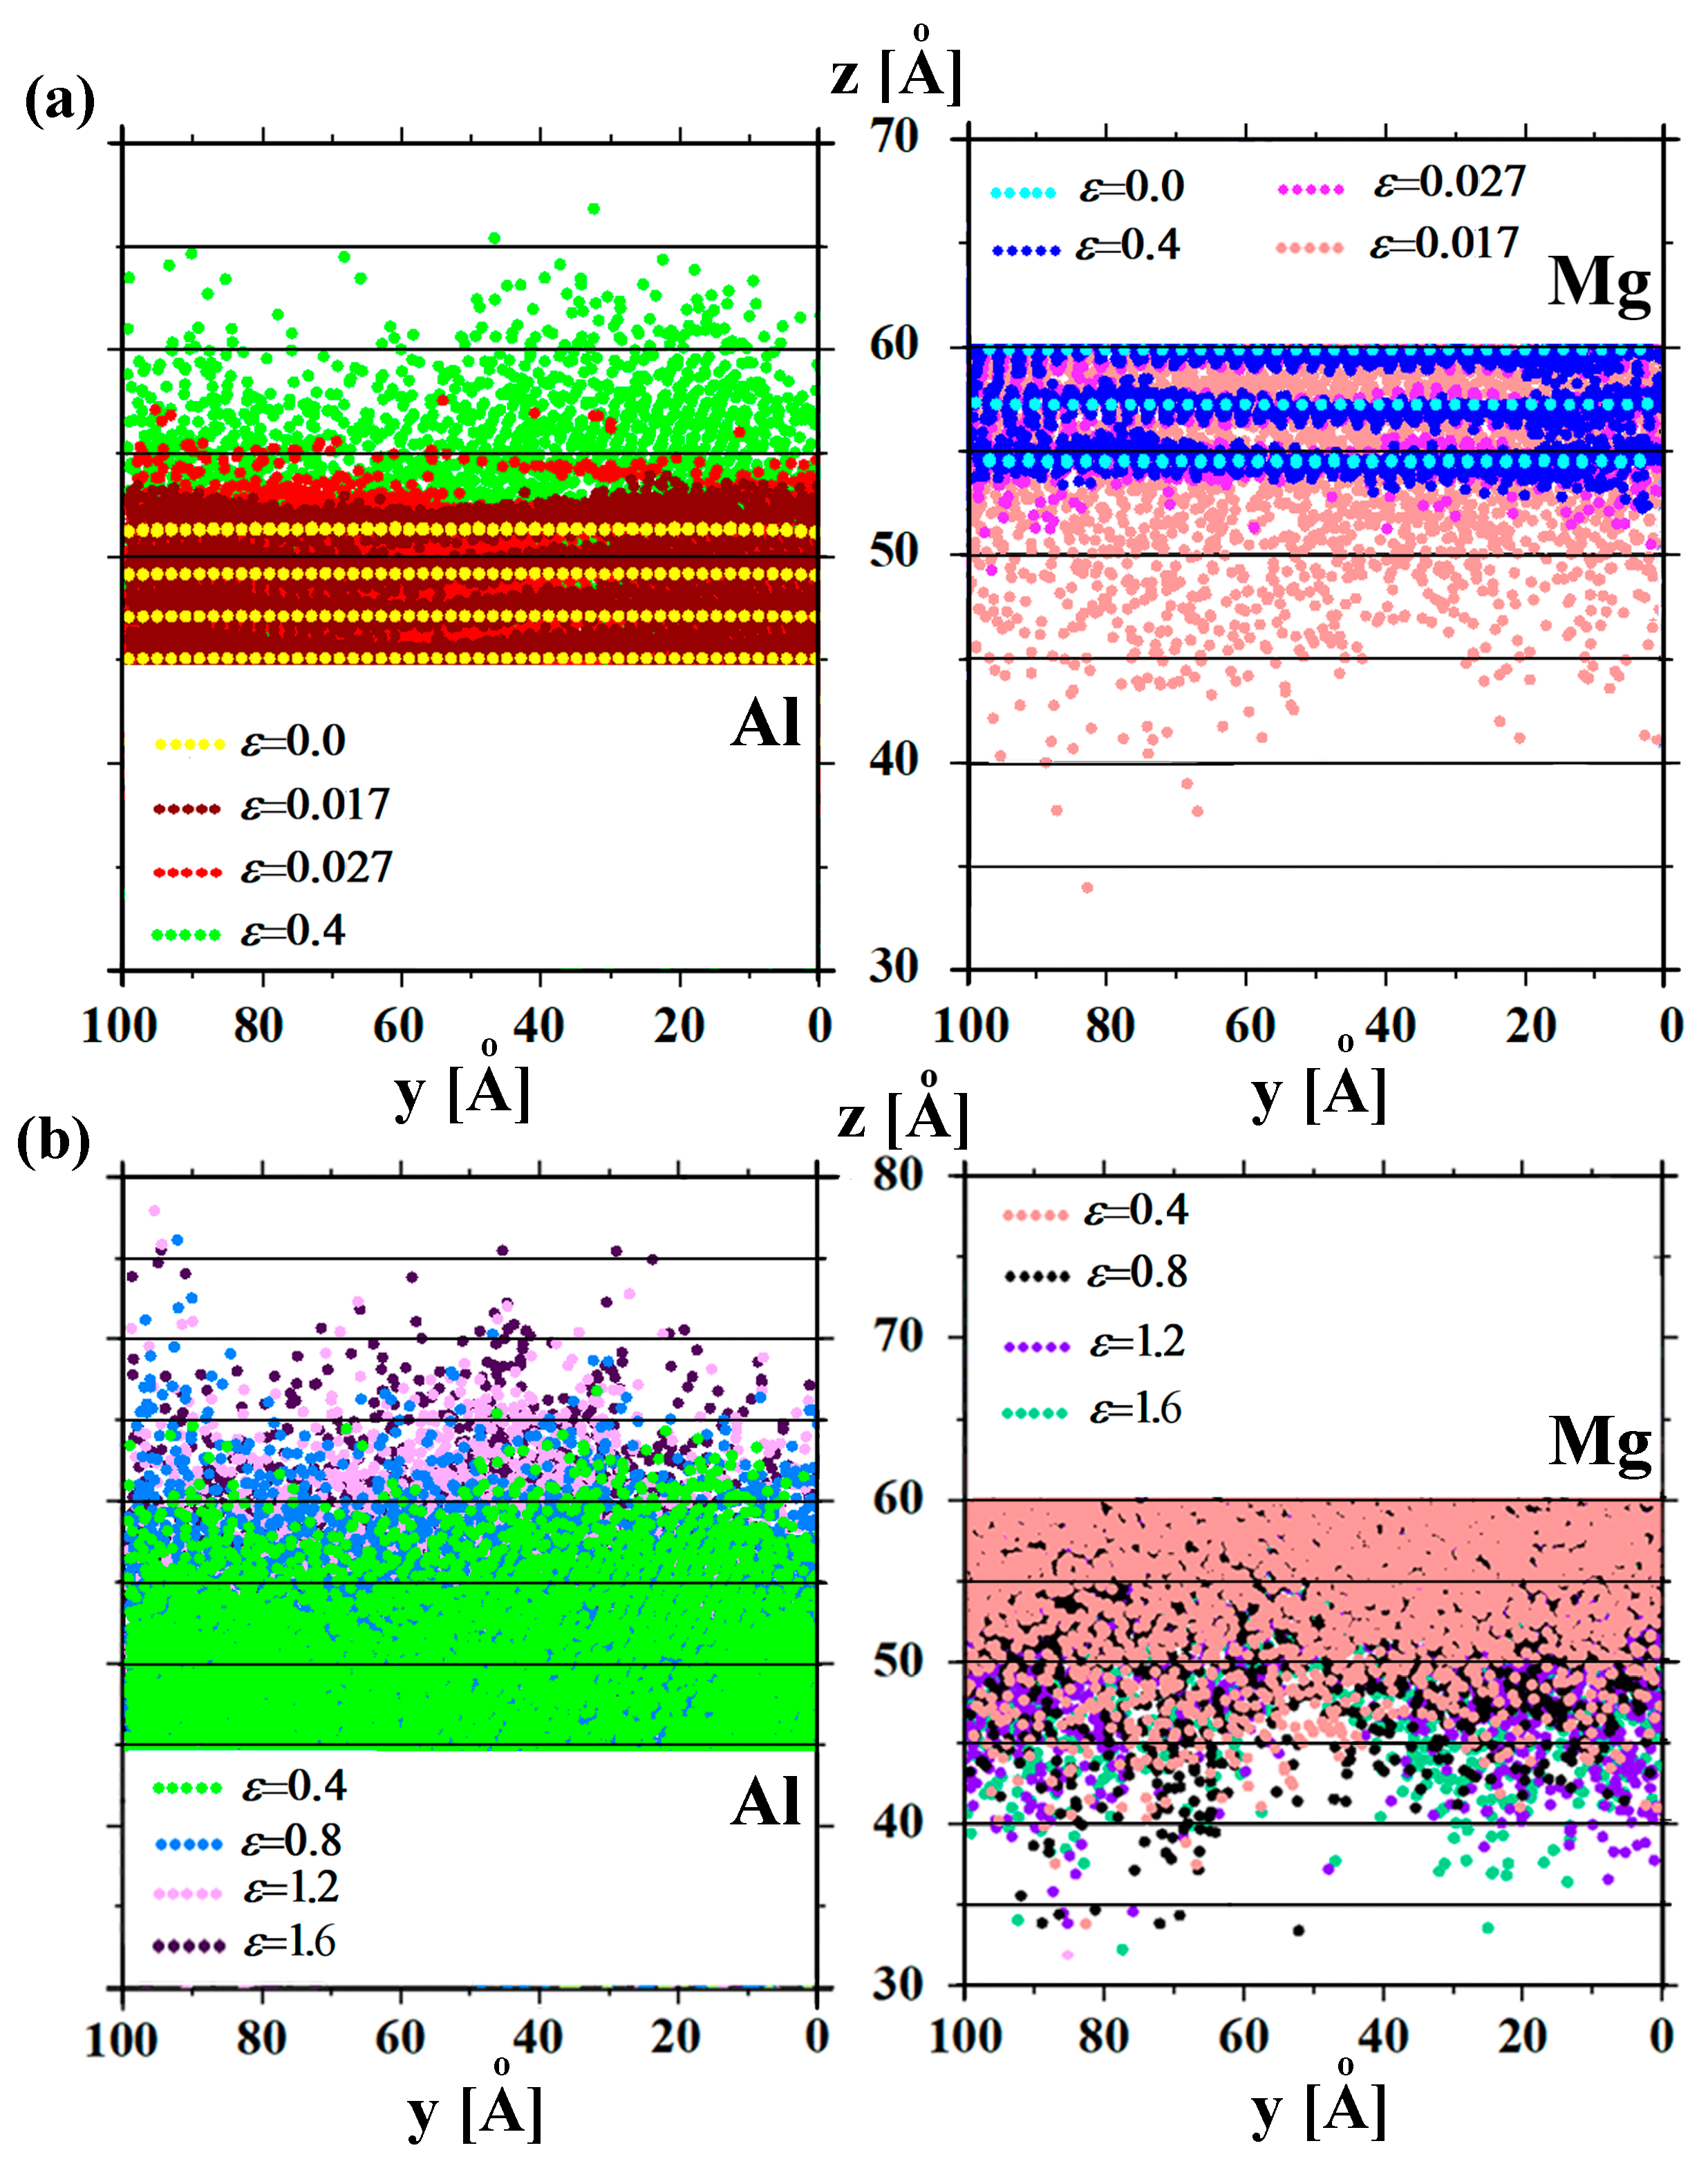
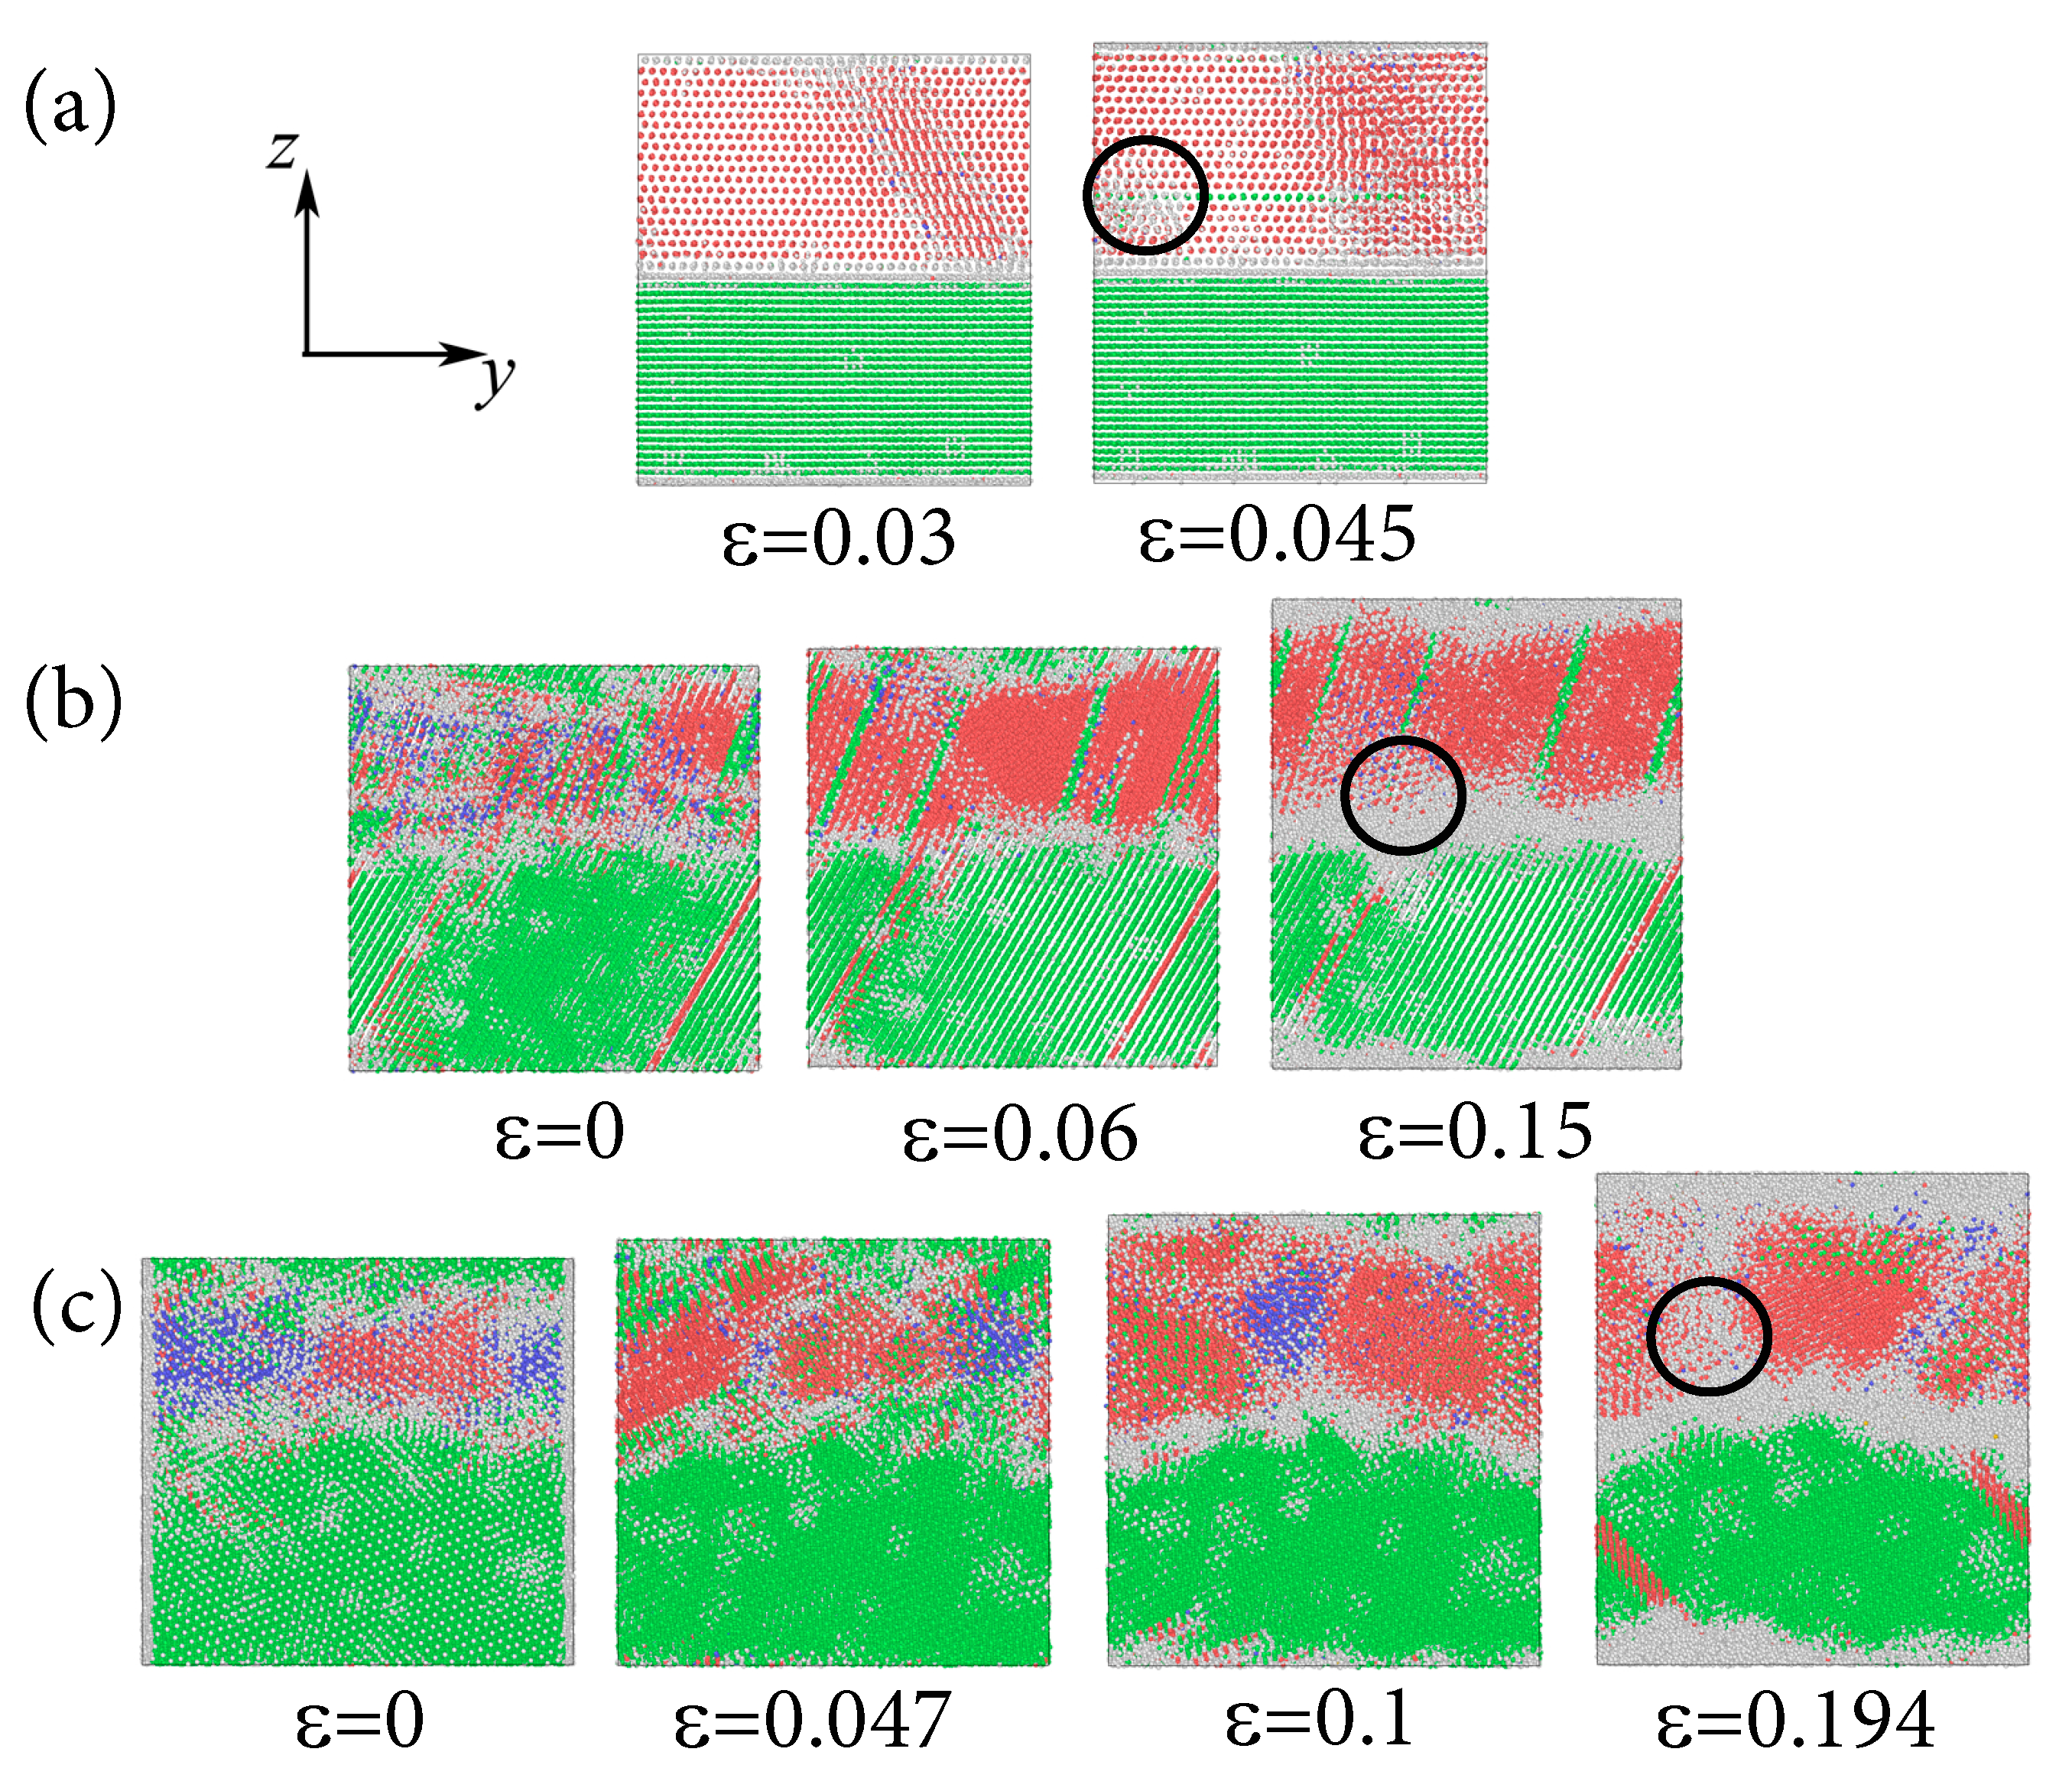
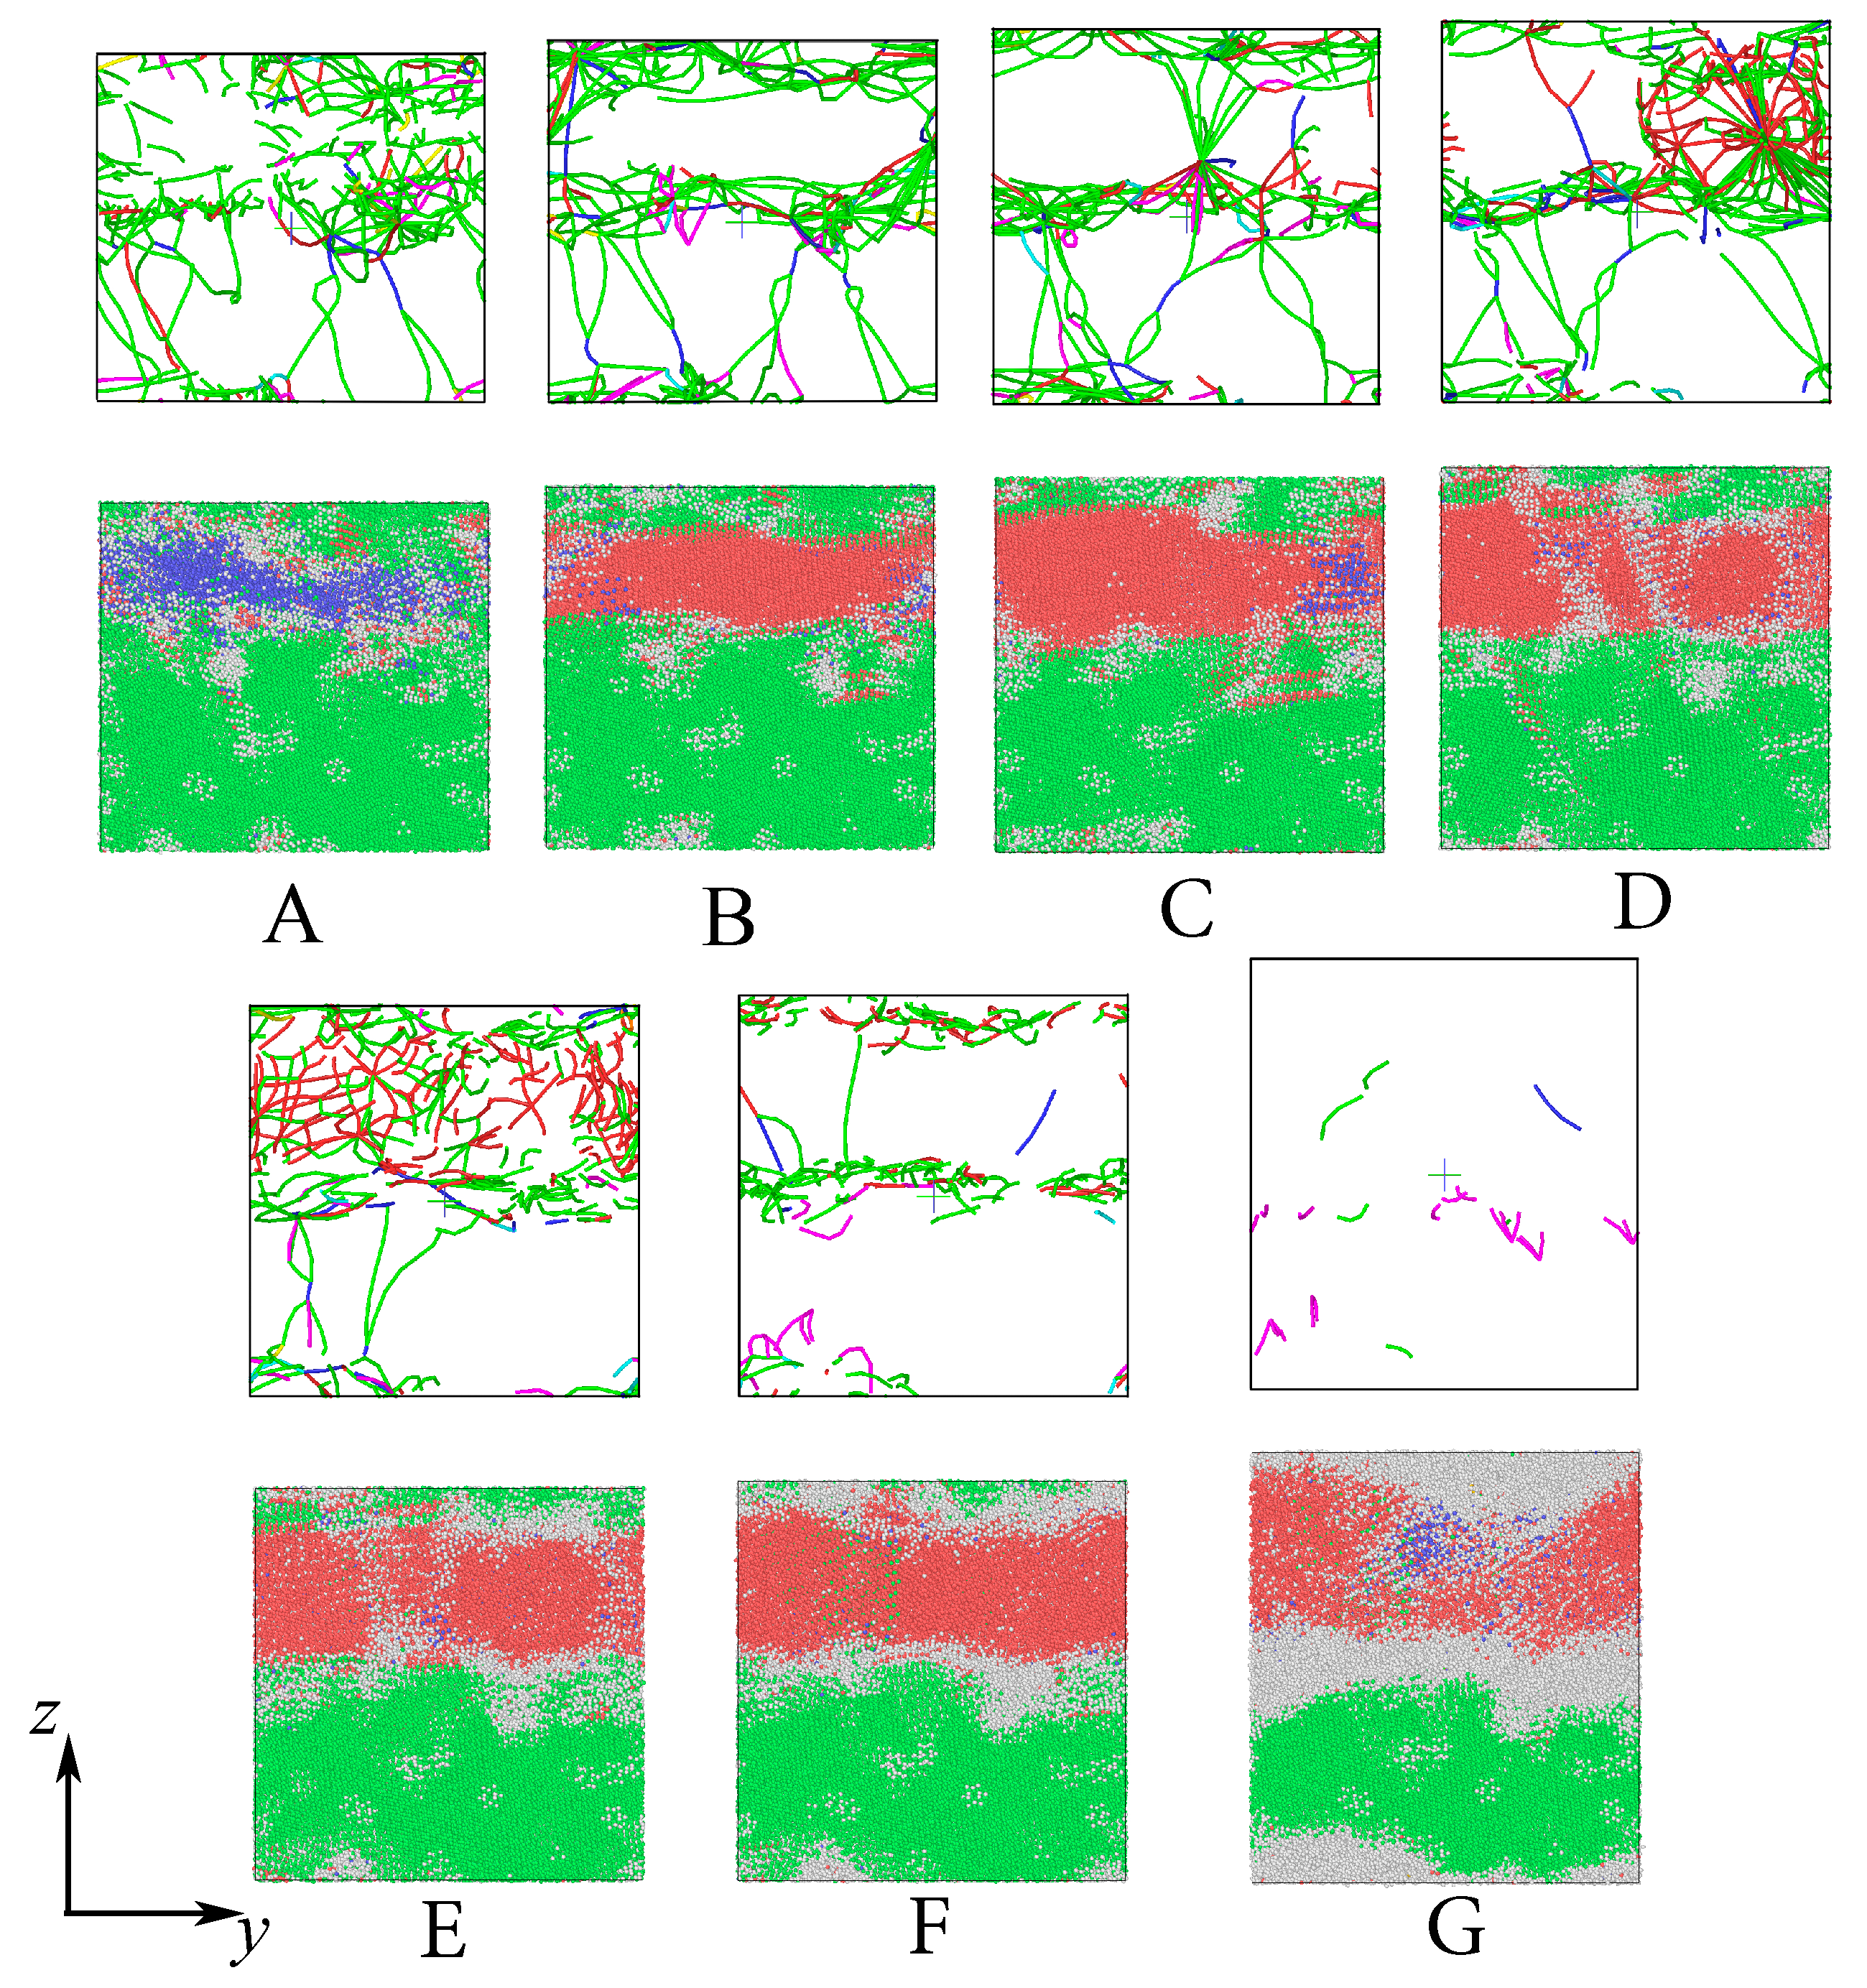
3.1. Composite Fabrication
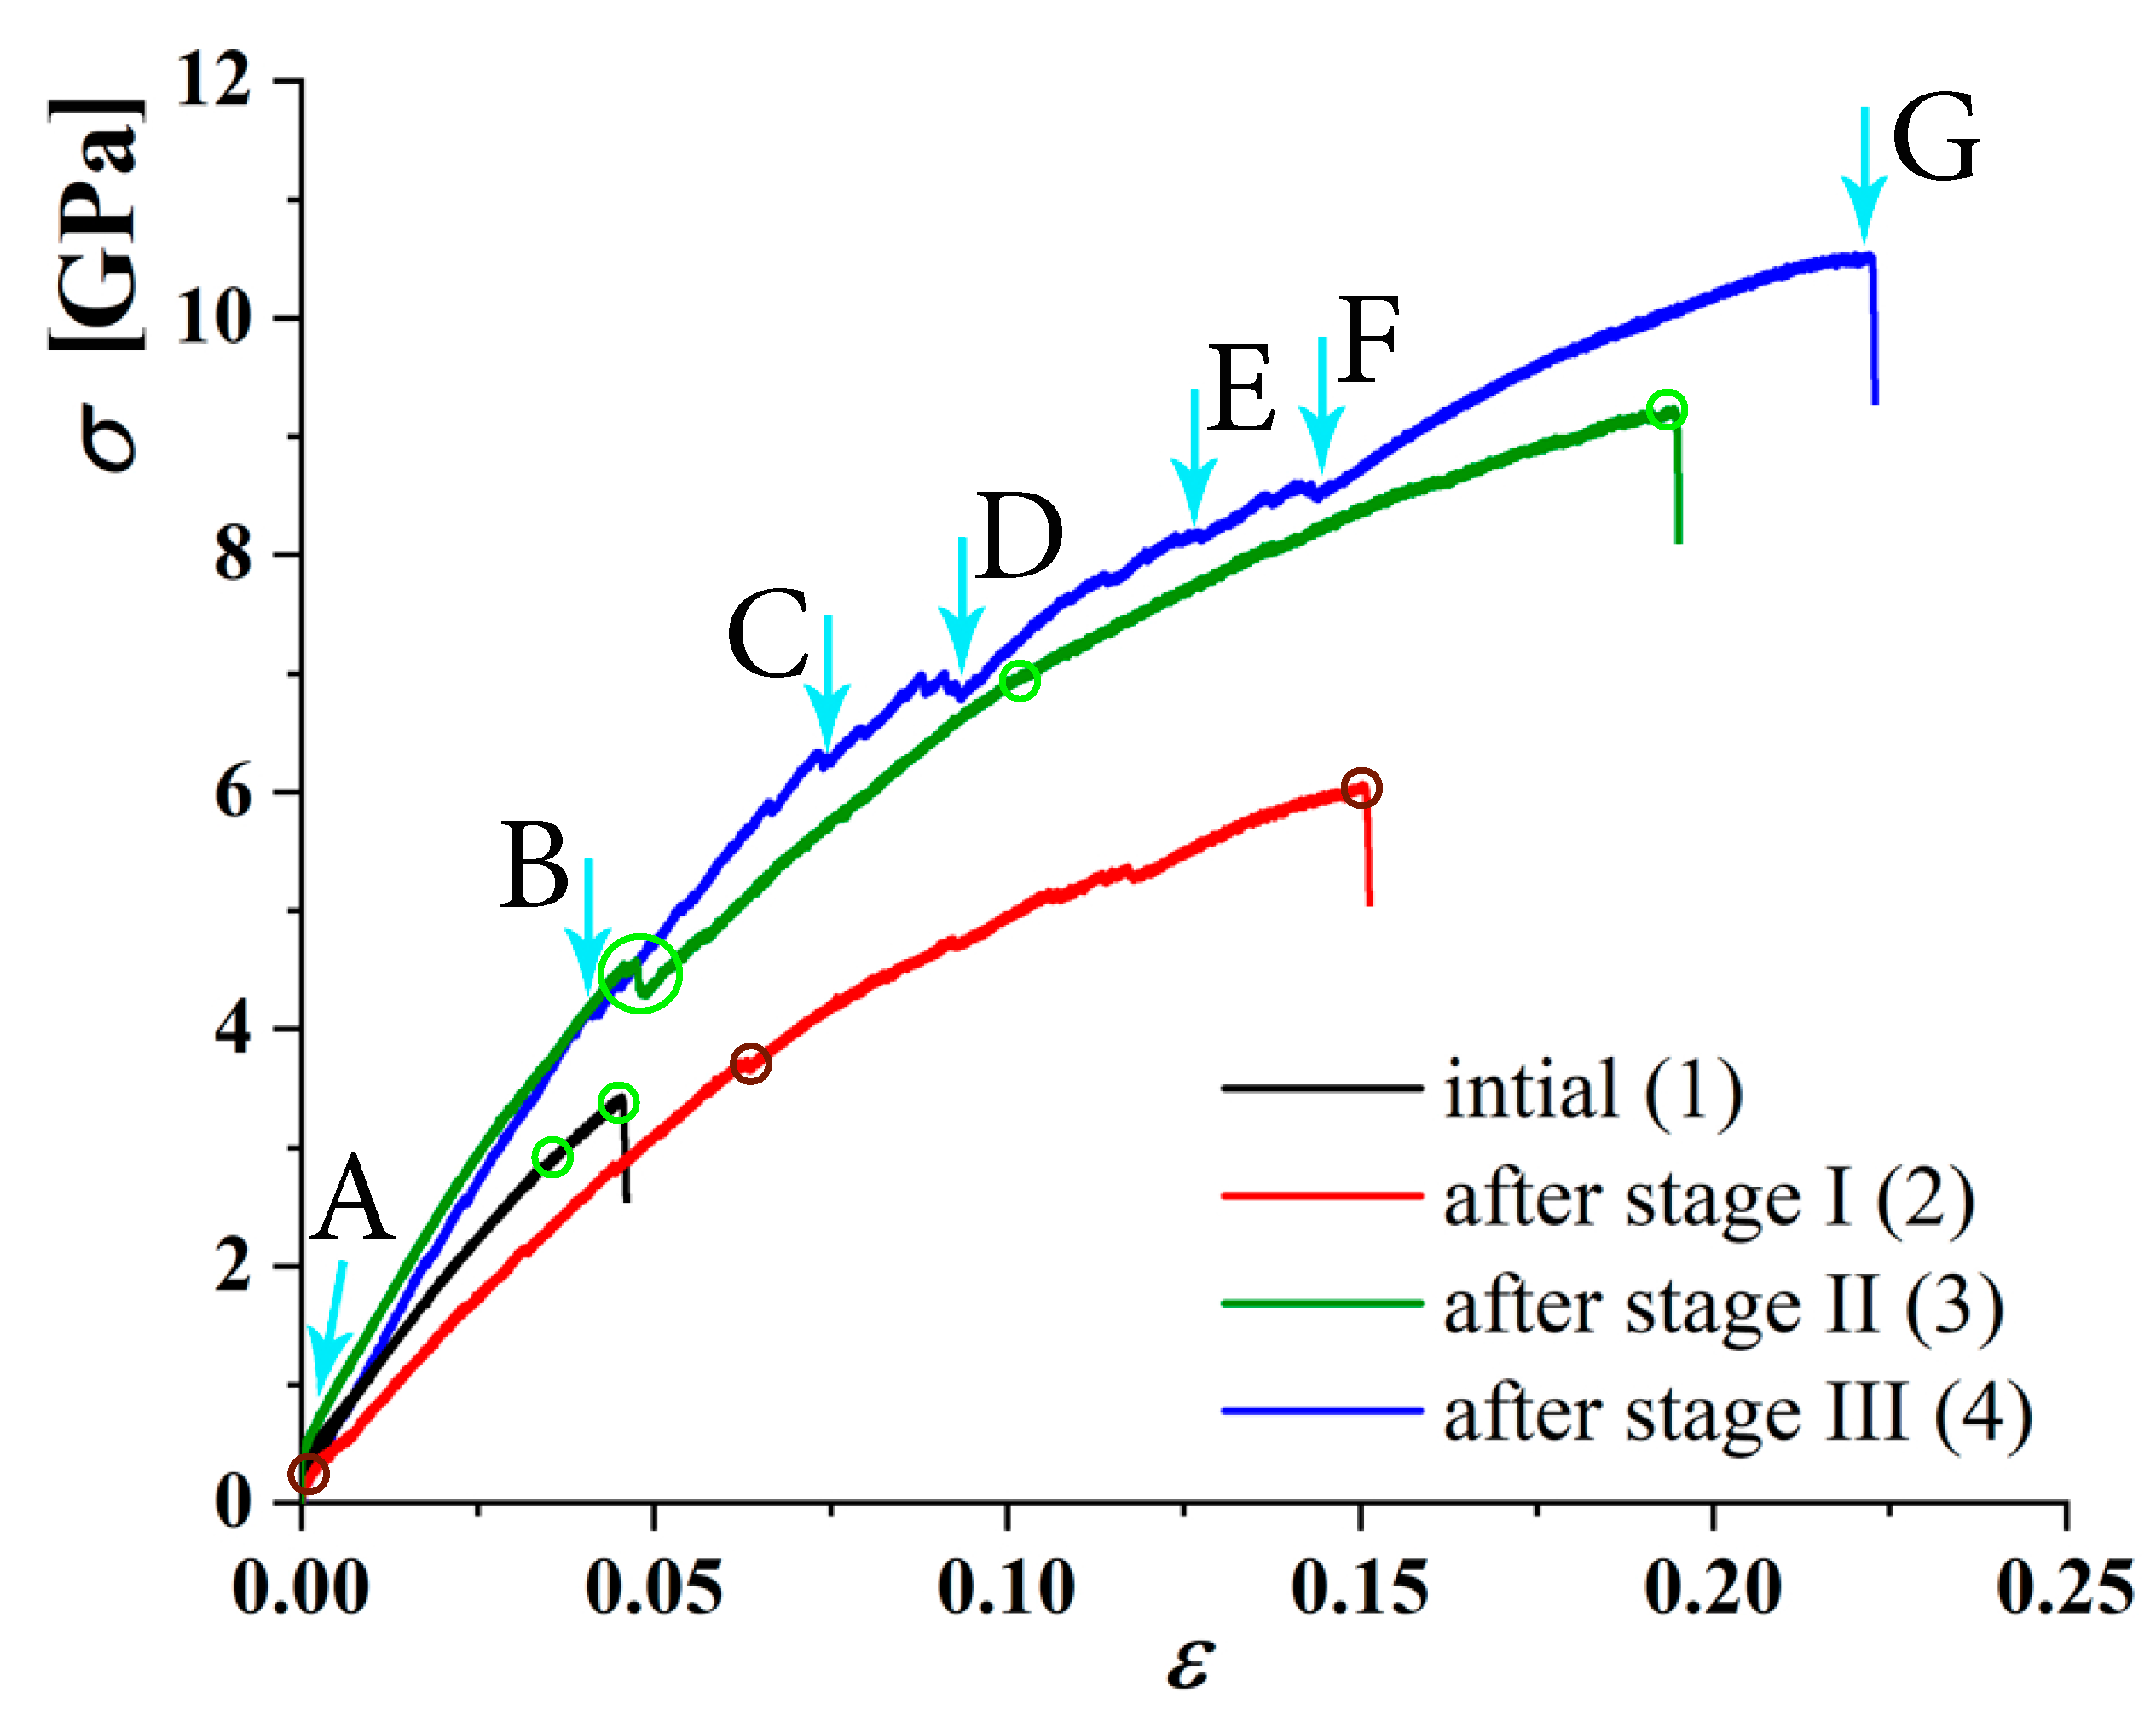
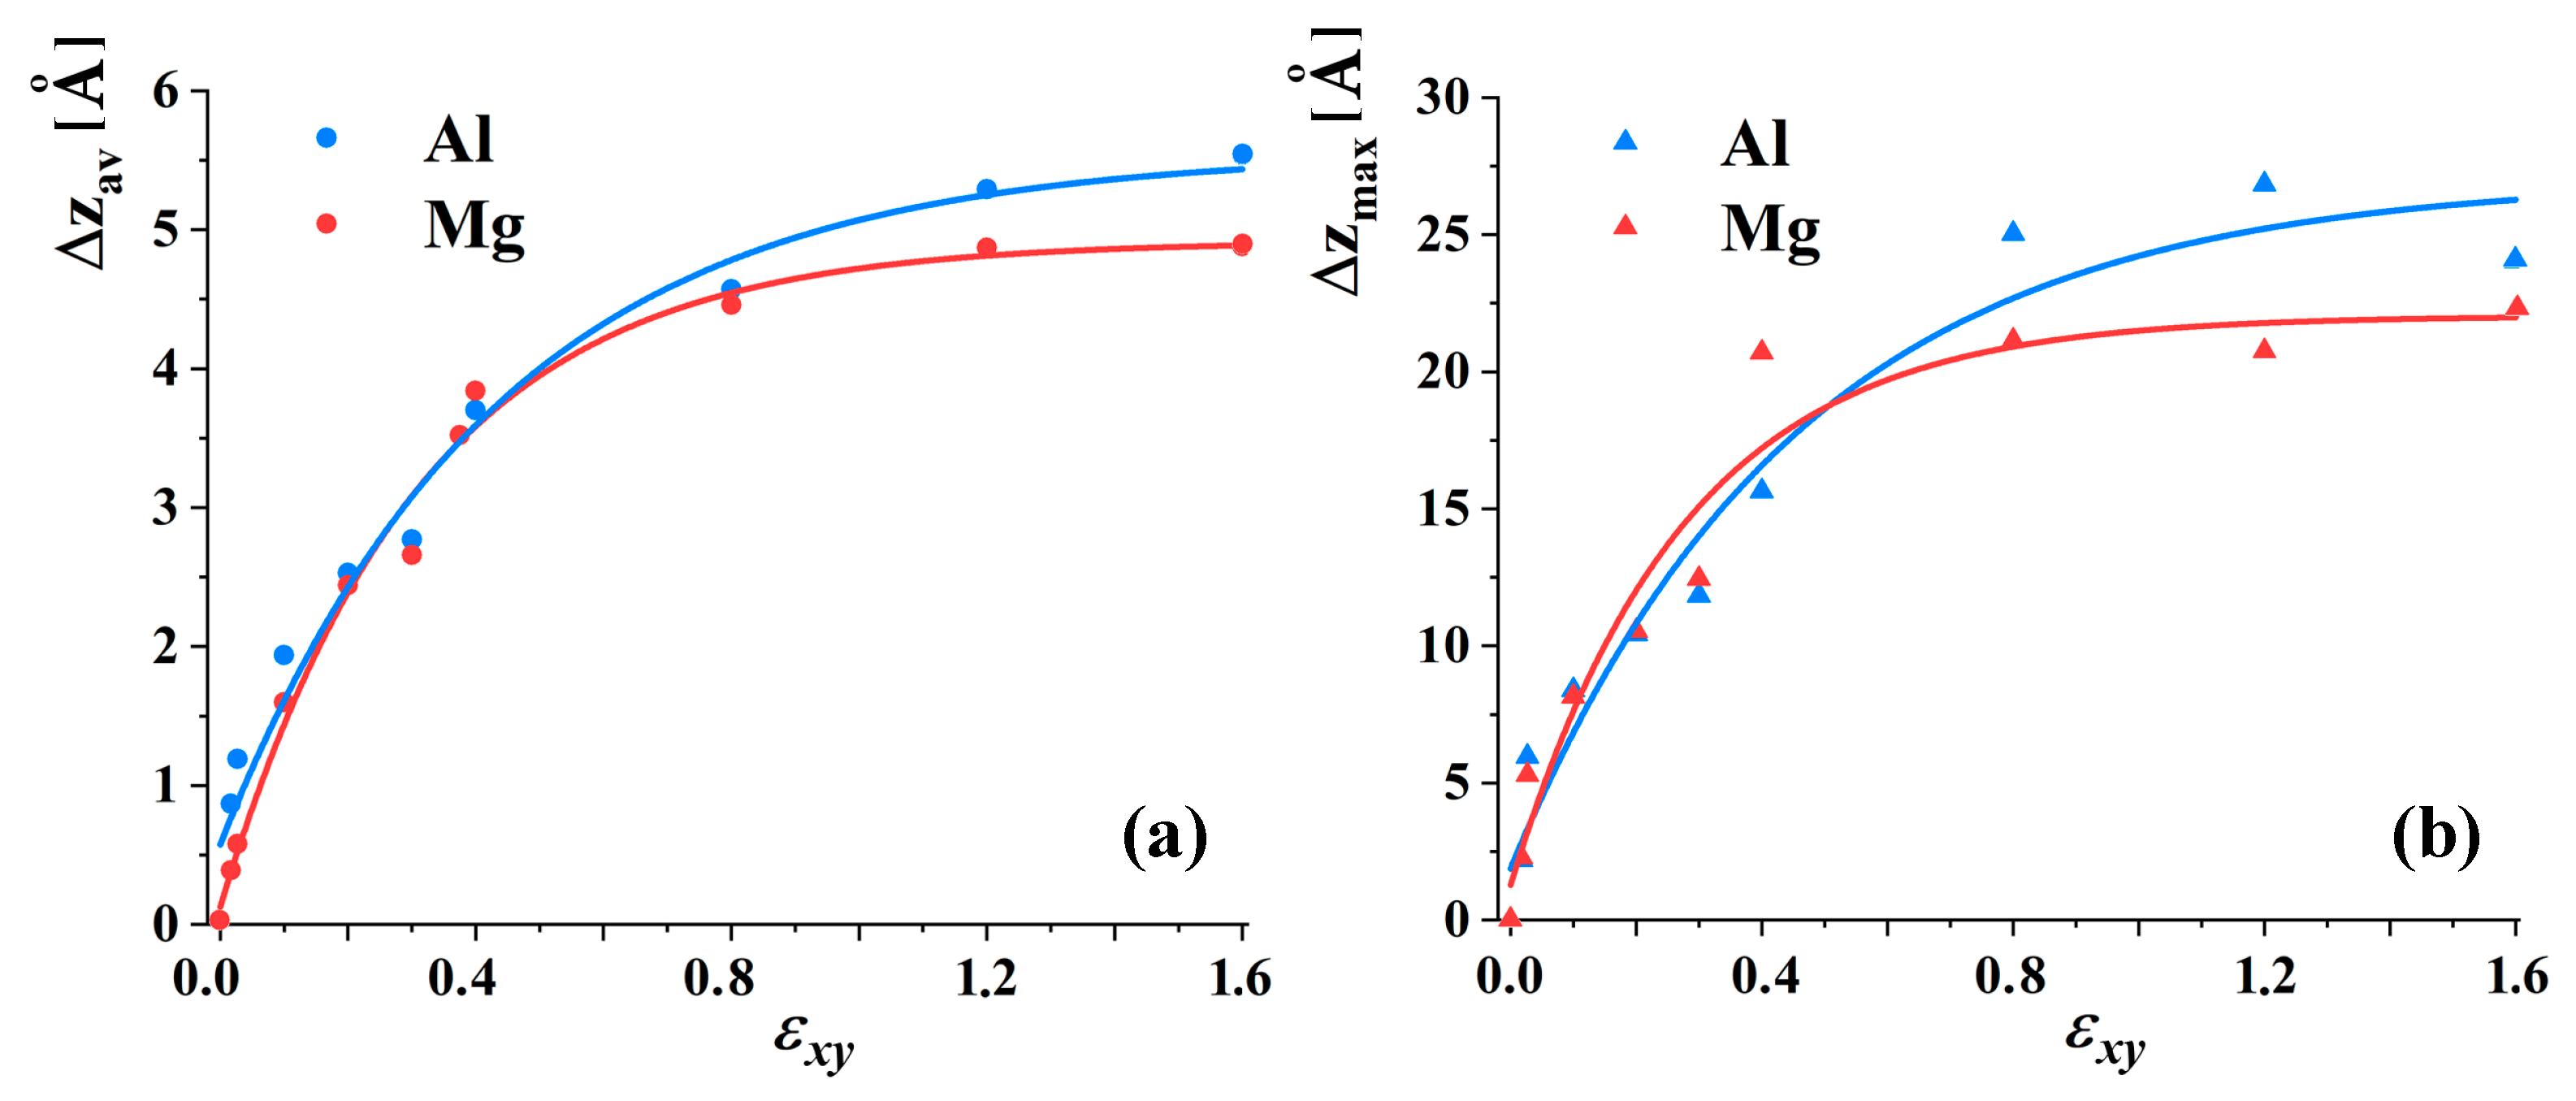
3.2. Al–Mg under Tension
4. Conclusions
Author Contributions
Funding
Acknowledgments
Conflicts of Interest
References
- Agnew, S.; Nie, J. Preface to the viewpoint set on: The current state of magnesium alloy science and technology. Scr. Mater. 2010, 63, 671–673. [Google Scholar] [CrossRef]
- Suh, B.C.; Shim, M.S.; Shin, K.; Kim, N.J. Current issues in magnesium sheet alloys: Where do we go from here? Scr. Mater. 2014, 84-85, 1–6. [Google Scholar] [CrossRef]
- Mordike, B.; Ebert, T. Magnesium. Mater. Sci. Eng. A 2001, 302, 37–45. [Google Scholar] [CrossRef]
- Bamberger, M.; Dehm, G. Trends in the Development of New Mg Alloys. Annu. Rev. Mater. Res. 2008, 38, 505–533. [Google Scholar] [CrossRef]
- Zhang, Z.; Couture, A.; Luo, A. An investigation of the properties of Mg-Zn-Al alloys. Scr. Mater. 1998, 39, 45–53. [Google Scholar] [CrossRef]
- Yakubtsov, I.; Diak, B.; Sager, C.; Bhattacharya, B.; MacDonald, W.; Niewczas, M. Effects of heat treatment on microstructure and tensile deformation of Mg AZ80 alloy at room temperature. Mater. Sci. Eng. A 2008, 496, 247–255. [Google Scholar] [CrossRef]
- Bazarnik, P.; Bartkowska, A.; Romelczyk-Baishya, B.; Adamczyk-Cieślak, B.; Dai, J.; Huang, Y.; Lewandowska, M.; Langdon, T.G. Superior strength of tri-layered Al–Cu–Al nano-composites processed by high-pressure torsion. J. Alloys Compd. 2020, 846, 156380. [Google Scholar] [CrossRef]
- Kocich, R.; Kunčická, L. Development of structure and properties in bimetallic Al/Cu sandwich composite during cumulative severe plastic deformation. J. Sandw. Struct. Mater. 2021, 109963622199388. [Google Scholar] [CrossRef]
- Korznikova, G.; Nazarov, K.; Khisamov, R.; Sergeev, S.; Shayachmetov, R.; Khalikova, G.; Baimova, J.; Glezer, A.; Mulyukov, R. Intermetallic growth kinetics and microstructure evolution in Al-Cu-Al metal-matrix composite processed by high pressure torsion. Mater. Lett. 2019, 253, 412–415. [Google Scholar] [CrossRef]
- Mulyukov, R.R.; Korznikova, G.F.; Nazarov, K.S.; Khisamov, R.K.; Sergeev, S.N.; Shayachmetov, R.U.; Khalikova, G.R.; Korznikova, E.A. Annealing-induced phase transformations and hardness evolution in Al–Cu–Al composites obtained by high-pressure torsion. Acta Mech. 2021. [Google Scholar] [CrossRef]
- Oh-ishi, K.; Edalati, K.; Kim, H.S.; Hono, K.; Horita, Z. High-pressure torsion for enhanced atomic diffusion and promoting solid-state reactions in the aluminum–copper system. Acta Mater. 2013, 61, 3482–3489. [Google Scholar] [CrossRef]
- Khisamov, R.K.; Korznikova, G.F.; Khalikova, G.R.; Sergeev, S.N.; Nazarov, K.S.; Shayachmetov, R.U.; Mulyukov, R.R. Fabrication of an in situ Al-Nb Metal Matrix Composite by Constrained Shear Strain and Its Emission Efficiency in a Glow Discharge. Tech. Phys. Lett. 2020, 46, 1200–1202. [Google Scholar] [CrossRef]
- Danilenko, V.; Sergeev, S.; Baimova, J.; Korznikova, G.; Nazarov, K.; Khisamov, R.K.; Glezer, A.; Mulyukov, R. An approach for fabrication of Al-Cu composite by high pressure torsion. Mater. Lett. 2019, 236, 51–55. [Google Scholar] [CrossRef]
- Castro, M.; Pereira, P.H.; Figueiredo, R.; Langdon, T. Developing magnesium-based composites through high-pressure torsion. Lett. Mater. 2019, 9, 541–545. [Google Scholar] [CrossRef] [Green Version]
- Castro, M.; Wolf, W.; Isaac, A.; Kawasaki, M.; Figueiredo, R. Consolidation of magnesium and magnesium-quasicrystal composites through high-pressure torsion. Lett. Mater. 2019, 9, 546–550. [Google Scholar] [CrossRef] [Green Version]
- Kawasaki, M.; Ahn, B.; Lee, H.; Zhilyaev, A.P.; Langdon, T.G. Using high-pressure torsion to process an aluminum–magnesium nanocomposite through diffusion bonding. J. Mater. Res. 2015, 31, 88–99. [Google Scholar] [CrossRef] [Green Version]
- Korznikova, G.; Korznikova, E.; Nazarov, K.; Shayakhmetov, R.; Khisamov, R.; Khalikova, G.; Mulyukov, R. Structure and Mechanical Behavior of Al–Nb Hybrids Obtained by High-Pressure-Torsion-Induced Diffusion Bonding and Subsequent Annealing. Adv. Eng. Mater. 2020, 23, 2000757. [Google Scholar] [CrossRef]
- Bartkowska, A.; Bazarnik, P.; Huang, Y.; Lewandowska, M.; Langdon, T.G. Using high-pressure torsion to fabricate an Al–Ti hybrid system with exceptional mechanical properties. Mater. Sci. Eng. A 2021, 799, 140114. [Google Scholar] [CrossRef]
- Goddard, W.A., III; Brenner, D.; Lyshevski, S.E.; Iafrate, G.J. Handbook of Nanoscience, Engineering, and Technology; CRC Press: Boca Raton, FL, USA, 2002; Chapter 22; pp. 22-1–22-41. [Google Scholar]
- Divinski, S.V.; Reglitz, G.; Rösner, H.; Estrin, Y.; Wilde, G. Ultra-fast diffusion channels in pure Ni severely deformed by equal-channel angular pressing. Acta Mater. 2011, 59, 1974–1985. [Google Scholar] [CrossRef]
- Murray, J.L. The Al-Mg (Aluminum-Magnesium) system. J. Phase Equilib. 1982, 3. [Google Scholar] [CrossRef]
- Poletaev, G.M.; Zorya, I.V.; Starostenkov, M.D. Role of point defects in self-diffusion along low-angle twist boundaries in fcc metals: A molecular dynamics study. J. Micromech. Mol. Phys. 2018, 03, 1850001. [Google Scholar] [CrossRef]
- Ghaffari, M.A.; Zhang, Y.; Xiao, S. Molecular dynamics modeling and simulation of lubricant between sliding solids. J. Micromech. Mol. Phys. 2017, 2, 1750009. [Google Scholar] [CrossRef]
- Zorya, I.; Poletaev, G.; Rakitin, R.; Ilyina, M.; Starostenkov, M. Interaction of impurity atoms of light elements with self-interstitials in fcc metals. Lett. Mater. 2019, 9, 207–211. [Google Scholar] [CrossRef]
- Zakharov, P.V.; Poletaev, G.; Starostenkov, M.; Cherednichenko, A. Simulation of the shock waves propagation through the interface of bipartite bimetallic Ni-Al particles. Lett. Mater. 2017, 7, 296–302. [Google Scholar] [CrossRef] [Green Version]
- Babicheva, R.I.; Dmitriev, S.V.; Bai, L.; Zhang, Y.; Kok, S.W.; Kang, G.; Zhou, K. Effect of grain boundary segregation on the deformation mechanisms and mechanical properties of nanocrystalline binary aluminum alloys. Comput. Mater. Sci. 2016, 117, 445–454. [Google Scholar] [CrossRef]
- Koju, R.; Mishin, Y. Atomistic study of grain-boundary segregation and grain-boundary diffusion in Al-Mg alloys. Acta Mater. 2020, 201, 596–603. [Google Scholar] [CrossRef]
- Kazemi, A.; Yang, S. Effects of magnesium dopants on grain boundary migration in aluminum-magnesium alloys. Comput. Mater. Sci. 2021, 188, 110130. [Google Scholar] [CrossRef]
- Pogorelko, V.V.; Mayer, A.E. Influence of titanium and magnesium nanoinclusions on the strength of aluminum at high-rate tension: Molecular dynamics simulations. Mater. Sci. Eng. A 2016, 662, 227–240. [Google Scholar] [CrossRef]
- Zhang, J.; Dou, Y.; Wan, X.; Chen, J. The strengthening effects of basal stacking faults on {10–12} twin in magnesium: A molecular dynamics study. Comput. Condens. Matter 2020, 23, e00466. [Google Scholar] [CrossRef]
- Polyakova, P.V.; Baimova, J.A. Molecular dynamics simulation of diffusion in Mg-Al system under pressure. IOP Conf. Ser. Mater. Sci. Eng. 2021, 1008, 012052. [Google Scholar] [CrossRef]
- Liu, X.Y.; Adams, J. Grain-boundary segregation in Al–10%Mg alloys at hot working temperatures. Acta Mater. 1998, 46, 3467–3476. [Google Scholar] [CrossRef]
- Polyakova, P.V.; Nazarov, K.S.; Khisamov, R.K.; Baimova, J.A. Molecular dynamics simulation of structural transformations in Cu-Al system under pressure. J. Phys. Conf. Ser. 2020, 1435, 012065. [Google Scholar] [CrossRef]
- Available online: https://docs.lammps.org/Manual.html (accessed on 6 July 2021).
- Zhilyaev, A.P.; McNelley, T.R.; Langdon, T.G. Evolution of microstructure and microtexture in fcc metals during high-pressure torsion. J. Mater. Sci. 2006, 42, 1517–1528. [Google Scholar] [CrossRef]
- Kuznetsov, R.I.; Bykov, V.I.; Chernyshov, P.; Pilyugin, V.; Yefremov, N.; Posheye, V. IFM UNTS AN USSR; Preprint 4/85; USSR: Sverdlovsk, Russia, 1985. (In Russian) [Google Scholar]
- Eichinger, A. Handbuch der Werkstoffprüfung; Springer: Berlin, Germany, 1955. [Google Scholar]
- Jonas, J.J.; Ghosh, C.; Toth, L.S. The equivalent strain in high pressure torsion. Mater. Sci. Eng. A 2014, 607, 530–535. [Google Scholar] [CrossRef]
- Available online: https://www.ks.uiuc.edu/ (accessed on 5 July 2021).
- Available online: https://www.ovito.org (accessed on 6 July 2021).
- Li, B.; Ma, E. Zonal dislocations mediating 10-11<10-1-2> twinning in magnesium. Acta Mater. 2009, 57, 1734–1743. [Google Scholar] [CrossRef]
- Serra, A.; Pond, R.; Bacon, D. Computer simulation of the structure and mobility of twinning disclocations in H.C.P. Metals. Acta Metall. Mater. 1991, 39, 1469–1480. [Google Scholar] [CrossRef]


Publisher’s Note: MDPI stays neutral with regard to jurisdictional claims in published maps and institutional affiliations. |
© 2021 by the authors. Licensee MDPI, Basel, Switzerland. This article is an open access article distributed under the terms and conditions of the Creative Commons Attribution (CC BY) license (https://creativecommons.org/licenses/by/4.0/).
Share and Cite
Polyakova, P.V.; Pukhacheva, J.A.; Shcherbinin, S.A.; Baimova, J.A.; Mulyukov, R.R. Fabrication of Magnesium-Aluminum Composites under High-Pressure Torsion: Atomistic Simulation. Appl. Sci. 2021, 11, 6801. https://doi.org/10.3390/app11156801
Polyakova PV, Pukhacheva JA, Shcherbinin SA, Baimova JA, Mulyukov RR. Fabrication of Magnesium-Aluminum Composites under High-Pressure Torsion: Atomistic Simulation. Applied Sciences. 2021; 11(15):6801. https://doi.org/10.3390/app11156801
Chicago/Turabian StylePolyakova, Polina Viktorovna, Julia Alexandrovna Pukhacheva, Stepan Aleksandrovich Shcherbinin, Julia Aidarovna Baimova, and Radik Rafikovich Mulyukov. 2021. "Fabrication of Magnesium-Aluminum Composites under High-Pressure Torsion: Atomistic Simulation" Applied Sciences 11, no. 15: 6801. https://doi.org/10.3390/app11156801
APA StylePolyakova, P. V., Pukhacheva, J. A., Shcherbinin, S. A., Baimova, J. A., & Mulyukov, R. R. (2021). Fabrication of Magnesium-Aluminum Composites under High-Pressure Torsion: Atomistic Simulation. Applied Sciences, 11(15), 6801. https://doi.org/10.3390/app11156801