Article

Effects of Visual Active Deceleration Devices on Controlling Vehicle Speeds in a Long Downhill Tunnel of an Expressway

1
School of Civil Engineering and Architecture, Wuhan Institute of Technology, Wuhan 430074, China
2
State Key Laboratory of Silicate Materials for Architectures, Wuhan University of Technology, Wuhan 430070, China
3
Hebei Communications Investment Group Zhangshi Expressway Baoding Section Co. Ltd., Shijiazhuang 071000, China
4
Hebei Reach Traffic Engineering Consulting Co. Ltd., Shijiazhuang 050021, China
*
Author to whom correspondence should be addressed.
Appl. Sci. 2021, 11(15), 6753; https://doi.org/10.3390/app11156753
Submission received: 1 July 2021 / Revised: 16 July 2021 / Accepted: 20 July 2021 / Published: 22 July 2021

Abstract

:
Because the inside of a road tunnel is a closed strip, the driving environment changes suddenly at the tunnel entrance and exit, which is why accidents occur more frequently in tunnels than elsewhere. Based on visual psychology, reverse-perspective-illusion deceleration lines (RPIDLs) and visual-intervention deceleration devices (VIDDs) were designed to control vehicle speeds near the entrance and in the middle of a tunnel, respectively. Then, to assess the speed-controlling performance of the RPIDLs and VIDDs for vehicles in a long downhill tunnel, laser velocimeters were used to measure the vehicle speeds at different observation points in the tunnel before and after implementing the RPIDLs and VIDDs. The results show that the RPIDLs and VIDDs decreased the average vehicle speed and controlled its dispersion effectively. The 60 m RPIDLs improved the traffic safety in the tunnel without lessening the passing ability therein. The slash-line VIDD had no obvious effect on the maximum vehicle speeds in the middle of the tunnel. Both the 90° fold-line VIDD and the four-yellow–four-white VIDD decreased the maximum vehicle speeds significantly. The 60 m RPIDLs and the 90° fold-line VIDD gave the best deceleration effect on vehicles near the entrance and in the middle of the tunnel, respectively, and controlled the average speed and its dispersion effectively.

1. Background

To increase the service levels and optimize the linear designs of expressways, the proportions of tunnels therein are increasing in China. In mountainous areas in particular, road tunnels are far more prevalent than they are in flat areas [1]. At the end of 2018, there were 17,738 road tunnels in China, with a combined length of 17,236 km; of those tunnels, more than 70% were either long or extra-long ones. Because the inside of a road tunnel is a closed strip [2,3,4], the driving environment changes suddenly at the tunnel entrance and exit (e.g., the “black hole” and “white hole” phenomena [5,6]). This causes some drivers to be nervous and afraid, thereby increasing greatly the possibility of driving errors [7,8]. Bassan [9] investigated traffic accidents in Norway in 2008–2011 and found that a collision in a tunnel is twice as likely to cause fatalities than one is elsewhere. Cornelia [10] also indicated that the rate of dying in a traffic accident in a tunnel is almost twice that elsewhere, and regardless of whether the traffic flow is two-way or one-way, the probability of a traffic accident at the tunnel entrance is higher than that elsewhere in the tunnel. As a bottleneck in an expressway, when an accident happens in a tunnel, it can easily lead to secondary accidents [11]. Therefore, it is very important to make tunnel traffic safer.
To reduce the rates of traffic accidents in tunnels, it is necessary to study the mechanisms for such accidents and find the key factors affecting the safety levels at the entrances and exits of expressway tunnels. Most of the relevant studies show that the tunnel traffic safety has close relationship with the road conditions, traffic conditions, traffic management level, and weather conditions, and these conditions interact with each other at the same time. Walus [12] and Polasik [13] studied the impact of road friction and roughness on the traffic safety in winter, which had a significant impact on the vehicle performance, acceleration, braking, steering, and motion stability. Another important factor affecting traffic safety is the vehicle speed. From the previous research work [14,15], the traffic accidents become more prevalent with increasing vehicle speed, but the relationship between vehicle speed and the probability traffic accidents is not a simple linear one. When the speed limit is higher, vehicles tend to travel faster, thereby increasing the rate and severity of accidents significantly. The accident risk of vehicles increases rapidly with increasing speed [10]. Bowie [16] investigated how vehicle speed difference (the difference in speed between the fastest vehicle and the slowest one) affects traffic accidents, and the results indicated that the rate of traffic accidents increases exponentially with increasing speed difference. However, even when all vehicles have the same speed, there is still one accident happening in every 10 million kilometers, indicating that only controlling the speed difference is insufficient to prevent all traffic accidents [17]. Additionally, the lower speed limit is not necessarily better: a speed limit that is too low leads to reduced driver compliance and inefficient road traffic. Therefore, for safer traffic in a long downhill tunnel, the vehicle speeds should be controlled in a reasonable range so that they are neither too high nor too low and have a relatively small difference.
Speed management is an important aspect to improve the level of tunnel traffic safety. Most of the research focuses on setting up the traffic engineering facilities (such as the signs and line marking, lighting facilities, etc.) to increase the stimulus to drivers, so as to reduce fatigue and take the initiative to reduce speed. Patten [18] conducted a fatigue test for drivers in the bypass tunnel (FFS) in Stockholm, Sweden, with and without decorative lights on the ceiling of the tunnel. The results indicated that the installation of decorative lights in the tunnel section reduced the fatigue of drivers and, thus, improved traffic safety. Huang [19] studied the influence of lights at tunnel entrance and exit on traffic safety, and suggested that the layout design of lights at the tunnel entrance and exit should be taken into consideration. He [20] and Ran [21] investigated the movement of the eyes of drivers and found that the driver’s tension would be increased when the brightness changed sharply or unevenly, which would easily cause operational errors and decrease the traffic safety. Kircher [22] focused on the effect of brightness on drivers’ attention, and indicated that a brighter wall is more important for safety and comfort than high level of lighting, as long as the illumination is sufficiently bright. In addition, driving and staring behaviors were significantly affected by driver status, and distracted drivers are less likely to drive safely. The landscape of the tunnel will also affect the driver’s concentration and reduce fatigue. Kim [23] carried out a driving simulator based virtual reality driving experiment. In the 11.055 km long tunnel, drivers’ reactions and brain waves were examined to correspond to two scenarios, with and without landscape images respectively. The results show that after the landscape image was installed, the driving speed and distance away from the lane centerline were affected, and both the sleepy-related brain waves and fatigue of drivers were reduced.
In addition, the active safety measures based on optical illusion were studied by many scholars. Shi [24] and Wan [25] used the 3ds Max software to simulate the deceleration effect of tunnel optical illusion markers, the results show that, with the combination application of high-frequency visual information and low-frequency visual information, the vehicle speed can be reduced, resulting in the improvement of the traffic safety. At the same time, Zheng [26] proposed a rhythm-based marking system, and the results show that the rhythmic marking in the tunnel can effectively improve driver’s speed judgment accuracy and reduce driver’s reaction time, and the effect of multi-color marking is better than that of single-color marking. Xing [27] used questionnaires to test common delineators and a new type of flashing light separately, the questionnaire results show that these two facilities can significantly improve the tunnel traffic safety. From the previous research of our team [28], it can be found that, after the installation of a horizontal marker with reverse perspective information, the time distance of the vehicle following the vehicle is increased. What is more, the greater the dispersion of inverse linear perspective information, the greater the growth range of headway.
Therefore, the visual interference to drivers can reduce the speed and improve the tunnel traffic safety [29,30]. However, most of the current studies were carried out with simulation tests in a computer or just in the Lab, which is somewhat different from the actual traffic environment. In this research, firstly, under the common road and traffic conditions, two visual active deceleration devices were set up in a real tunnel (Yunmengshan Ⅰ tunnel in China), namely (i) reverse-perspective-illusion deceleration lines (RPIDLs) and (ii) a visual-intervention deceleration device (VIDD), were used together to control vehicle speeds and reduce their dispersion. RPIDLs were used at the entrance of a long downhill tunnel, and the VIDD was used in its middle. Each device was designed with different parameter settings, such as its total length (30, 60, or 120 m), angle (15°, 40°, or 55°; 60°, 90°, or 120°), color (white or yellow), and shape (straight or broken line). Then, laser velocimeters (LVs) were used to measure the vehicle speeds in the tunnel both with and without RPIDLs and a VIDD. In addition, the deceleration effects of RPIDLS and VIDD were studied to select the best deceleration device, which can provide a basis for guiding the design of the deceleration devices.

2. Materials and Experimental Methods

2.1. Tunnel

The Yunmeng Mountain Ⅰ Tunnel (Shijiazhuang direction, Baoding, China) is a long tunnel with a length of 1738 m. There are three vehicle lanes in this tunnel, namely the overtaking lane, carriageway, and emergency lane, and the surface of the road was constructed with asphalt concrete. The tunnel’s annual traffic volume is 8.4 million, with trucks accounting for a high proportion of 47%. The speed limit of the section is 70 km/h, but the phenomenon of overspeed and arbitrary lane change is serious. In the front and back of the tunnel, there are also Zijingguan Ⅳ tunnel (Baoding, China), Zijingguan Ⅴ tunnel (Baoding, China), Yunmengshan II tunnel (Baoding, China), and Yunmengshan Ⅲ tunnel (Baoding, China). These 5 tunnels form a tunnel group with a length of 8 km, accompanied by long downhill and plane curve sections, and the road environmental condition changes are complicated, leading to frequent traffic accidents here. The number of equivalent accidents is the highest in the 1 km section before the entrance of Yunmeng Mountain Ⅰ Tunnel (Shijiazhuang direction), accounting for 11.29% of the equivalent accidents in Baoding section of Zhangshi Expressway (Baoding, China). In addition, the section of Yunmeng Mountain Ⅰ Tunnel (Shijiazhuang direction) contains −2.51% long longitudinal slope and plane curve, which is the largest longitudinal slope in the tunnel group section. Therefore, the traffic safety of this tunnel needs to be improved urgently.

2.2. Visual Active Deceleration Devices

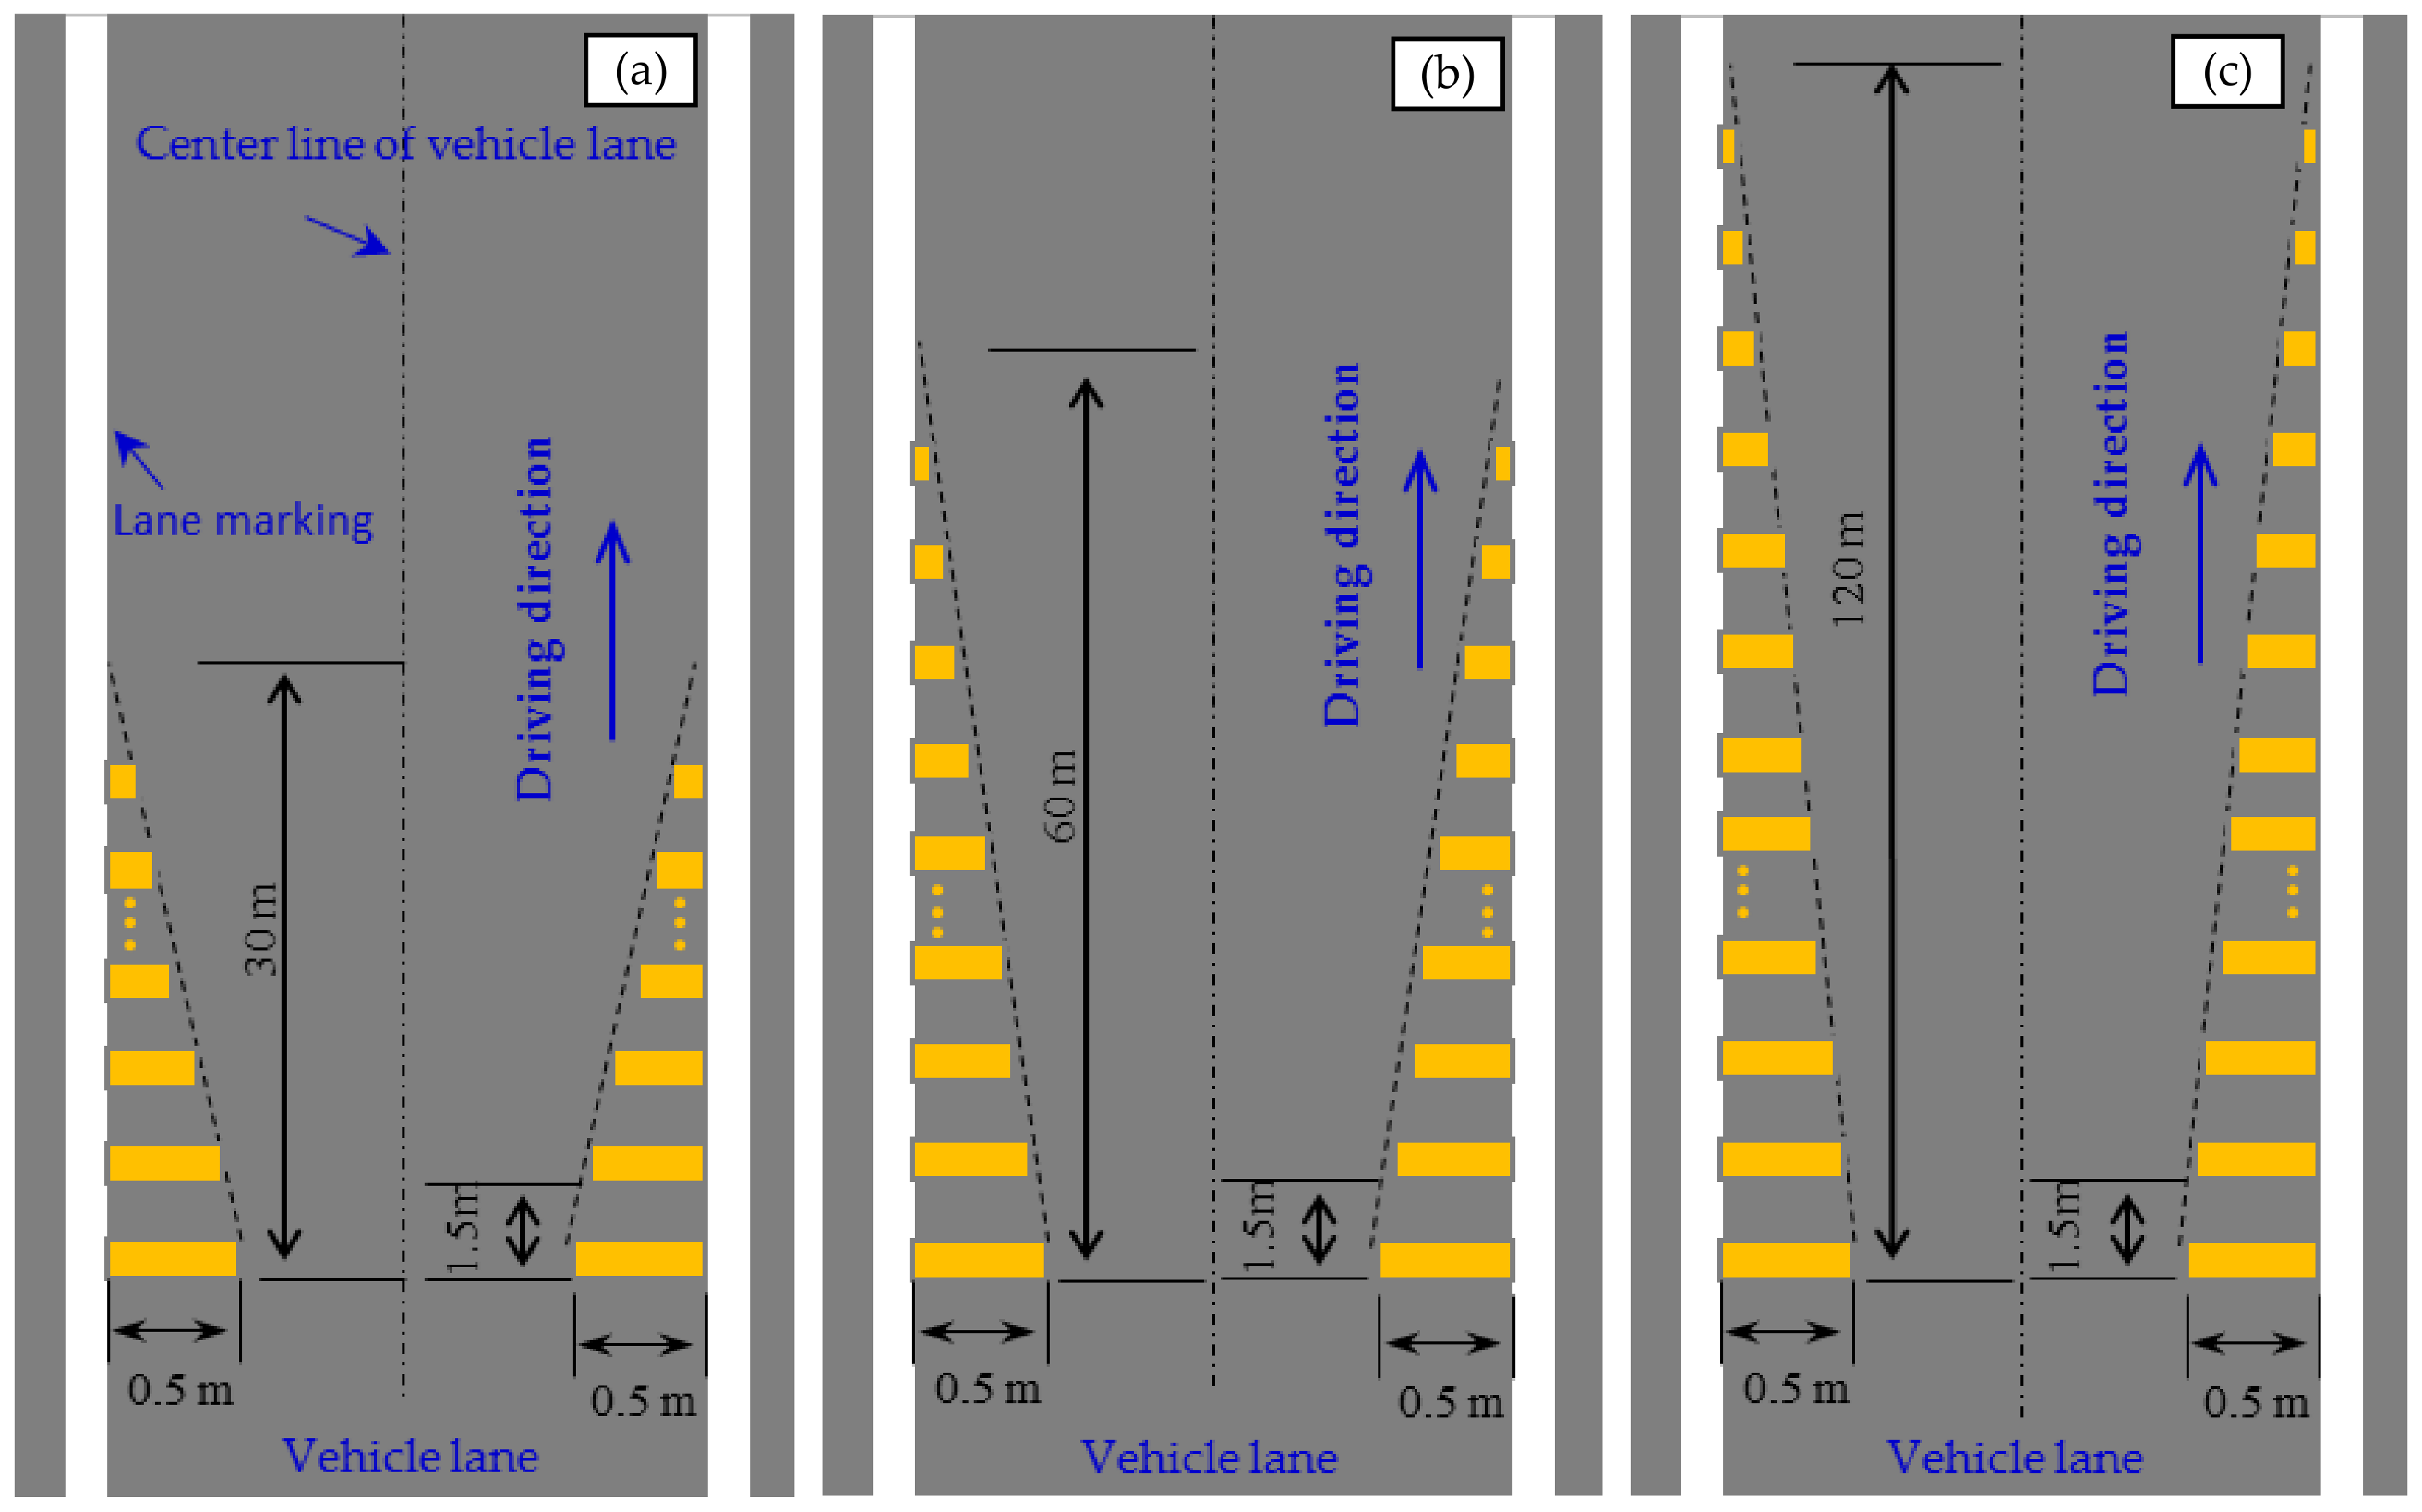
2.2.1. RPIDLs near Tunnel Entrance

Being horizontal lines, whose lengths change linearly in the driving direction, RPIDLs (Wuhan Gongdaminxing Traffic Engineering Consulting Co., Ltd, Wuhan, China) are positioned on either side of the vehicle lane. The line length begins as 50 cm at the proximal end and transitions to zero at the far end, and the longitudinal spacing of adjacent lines is 1.5 m. With a group length of 30, 60, or 120 m, the RPIDLs are shown schematically in Figure 1. Because of (i) how they change the available width of the vehicle lane and (ii) the visual extension of people formed in the distance, RPIDLs can cause drivers to underestimate the real distance and may optimize their driving behavior.

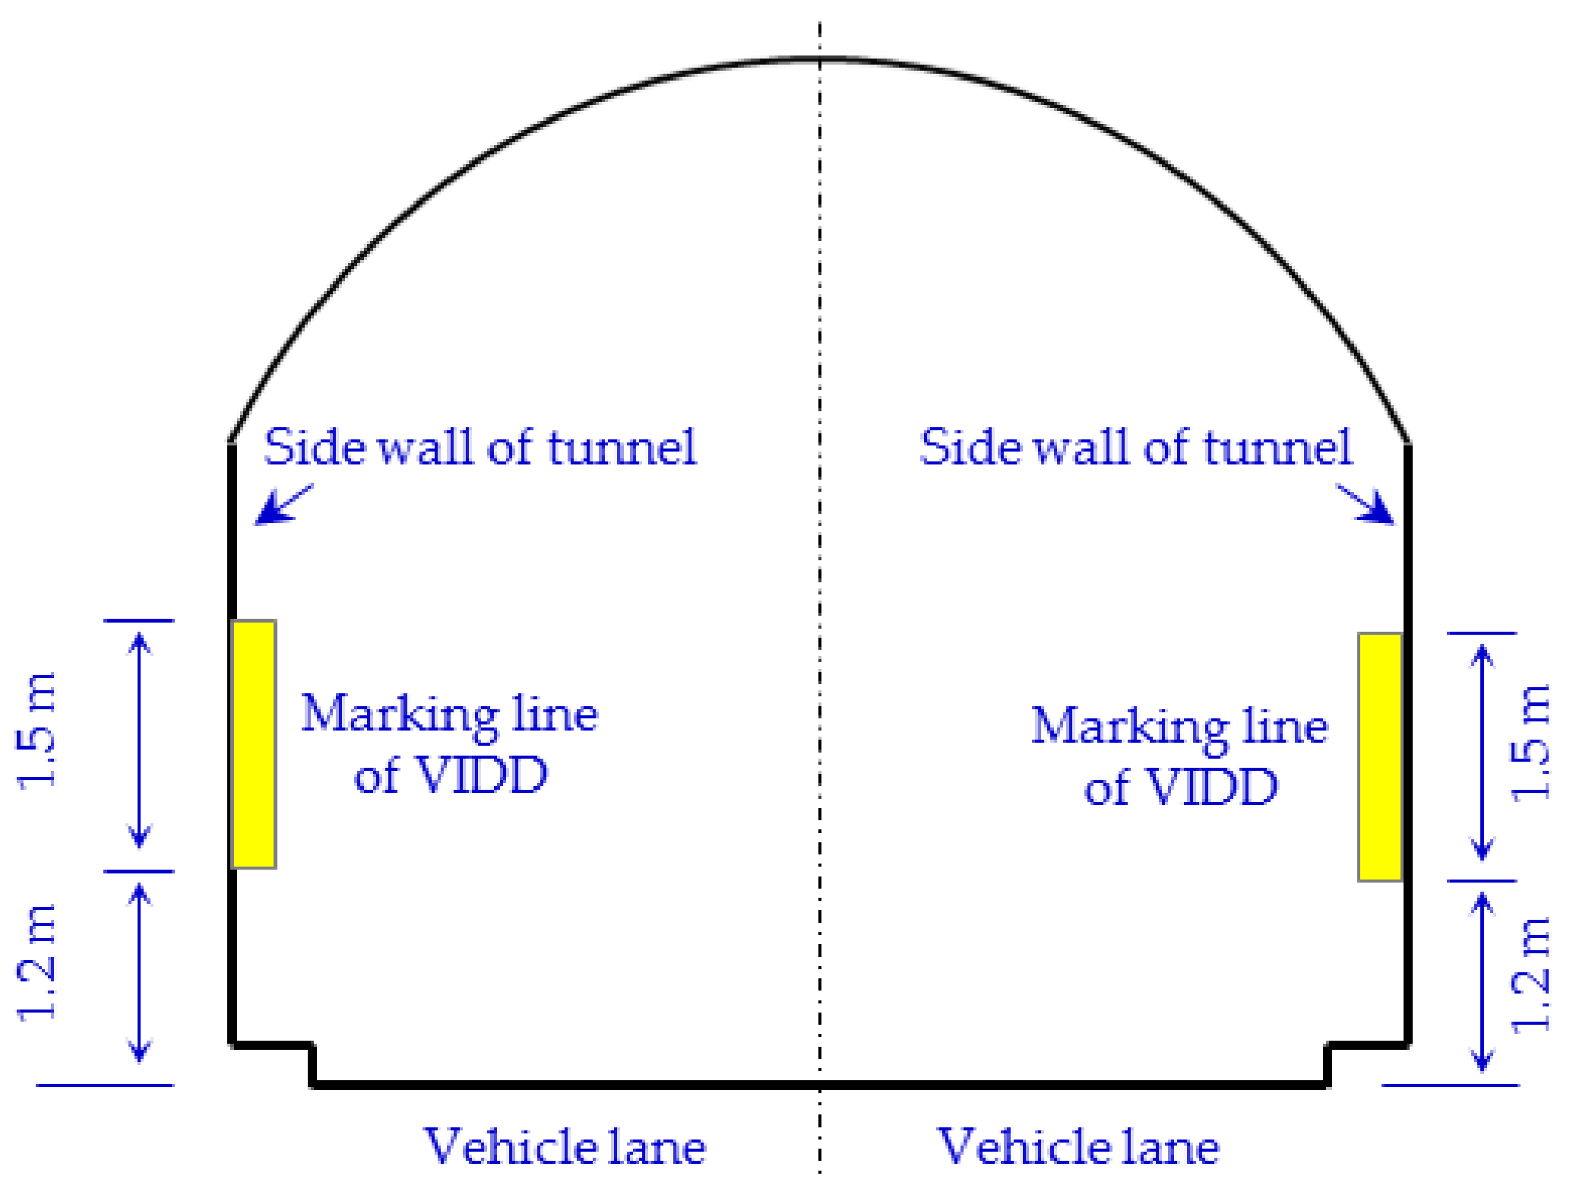
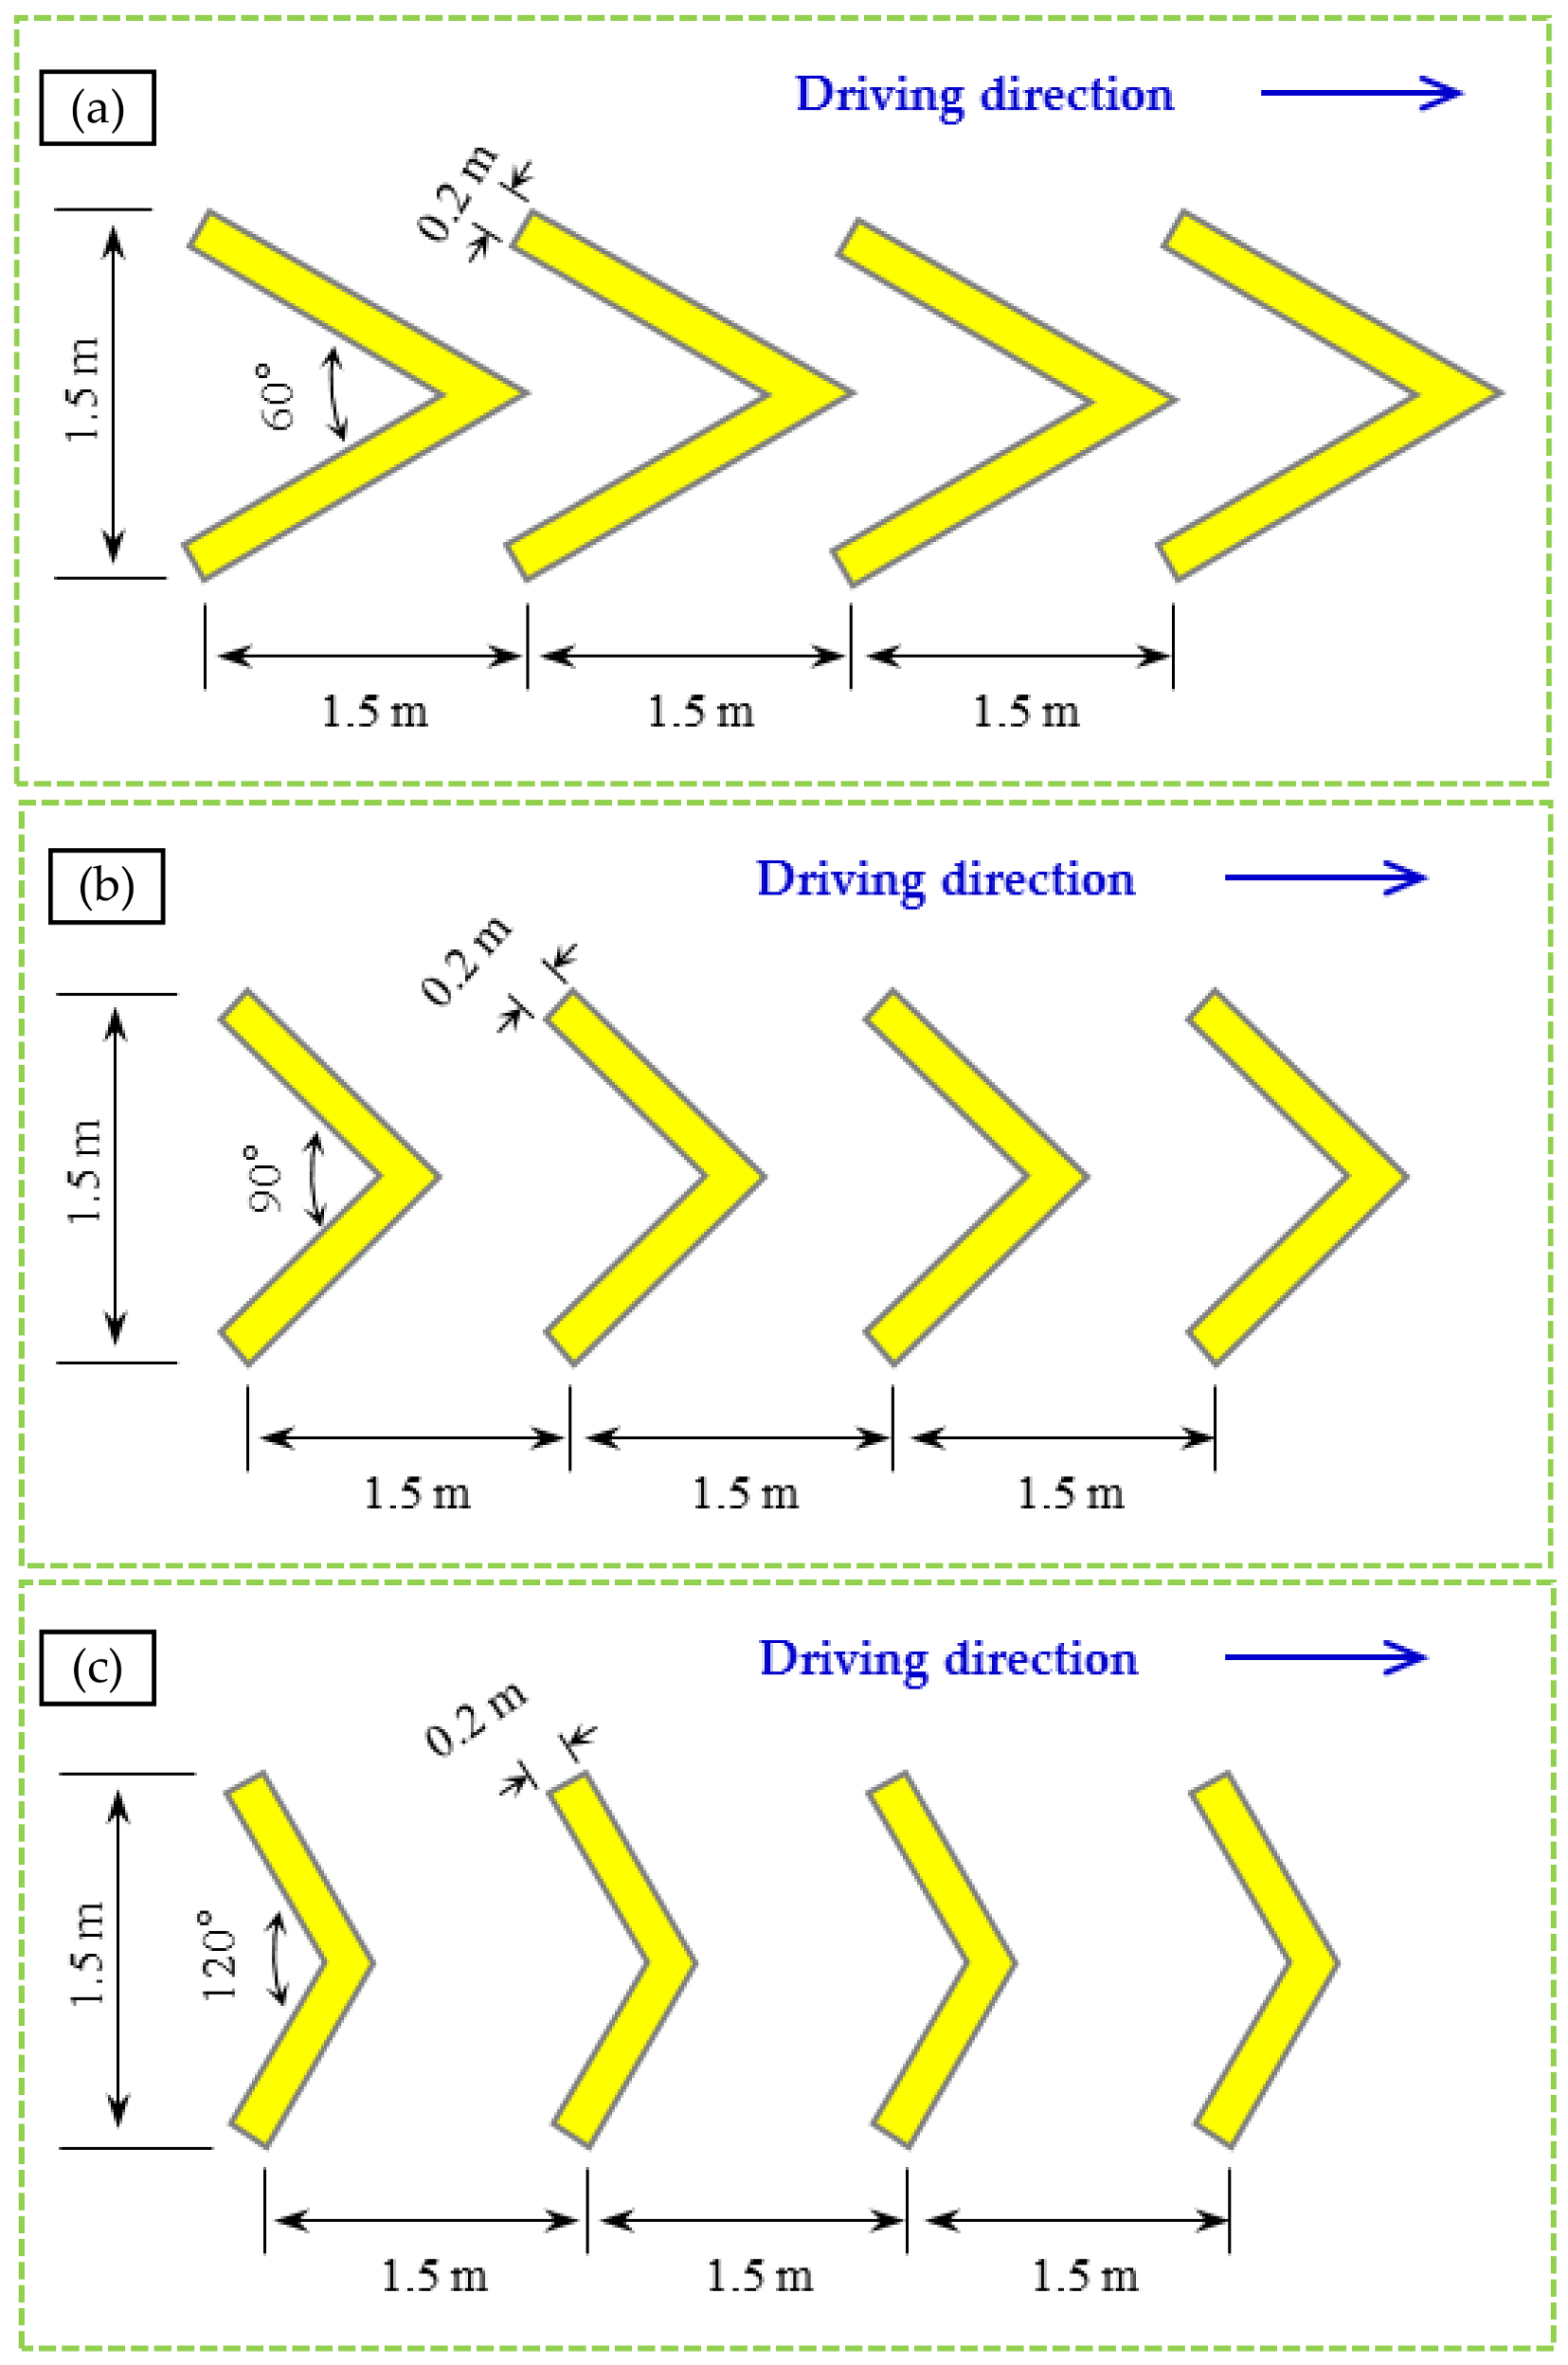
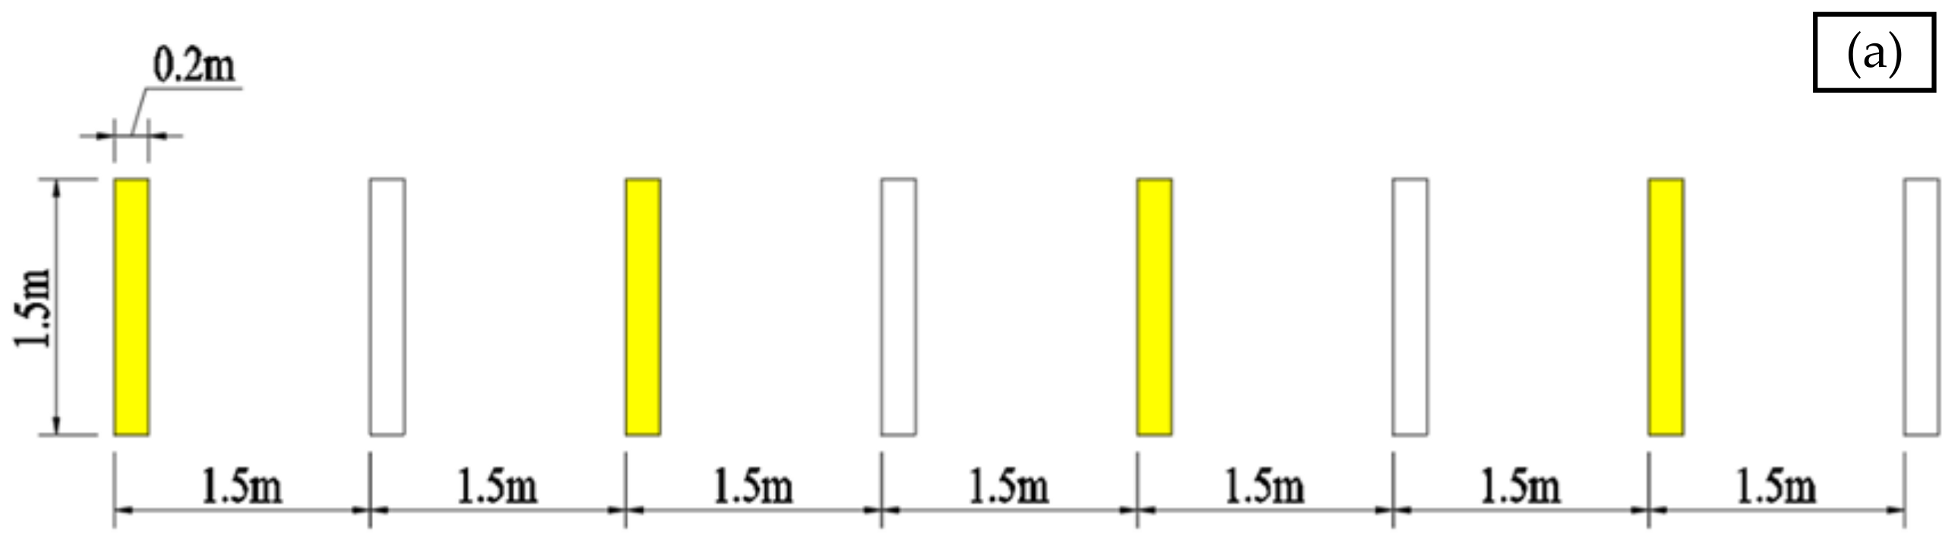
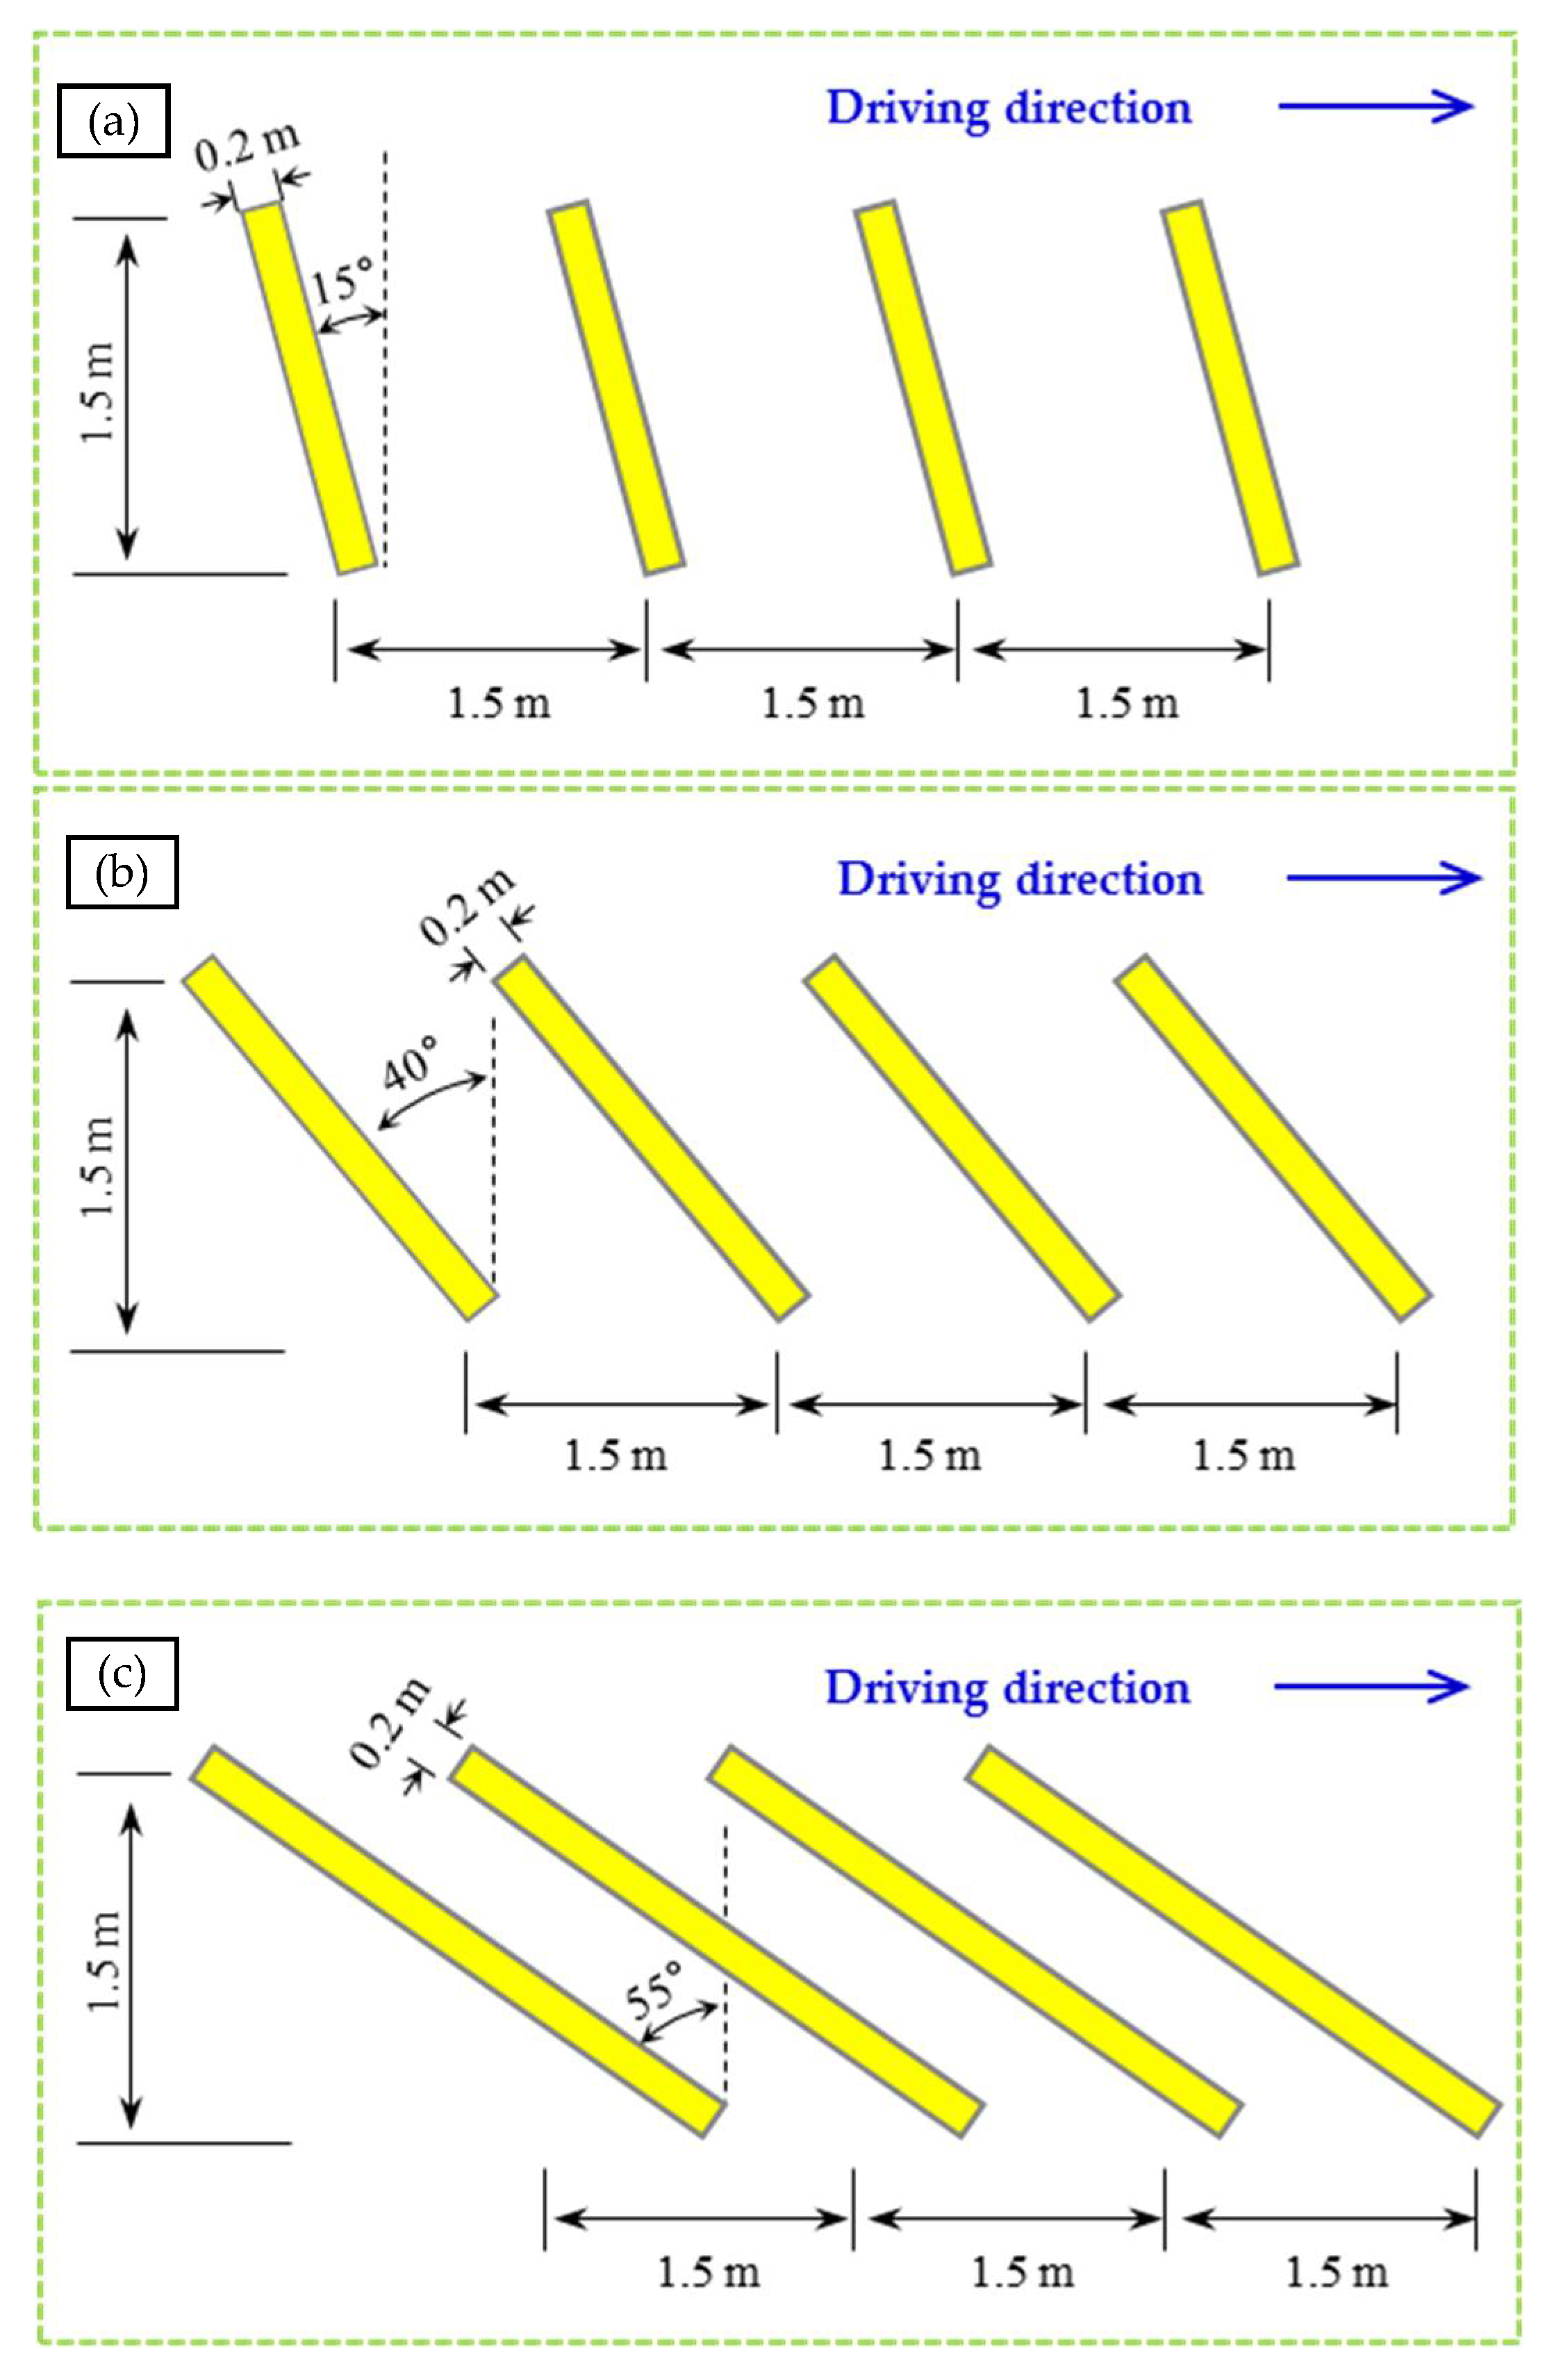
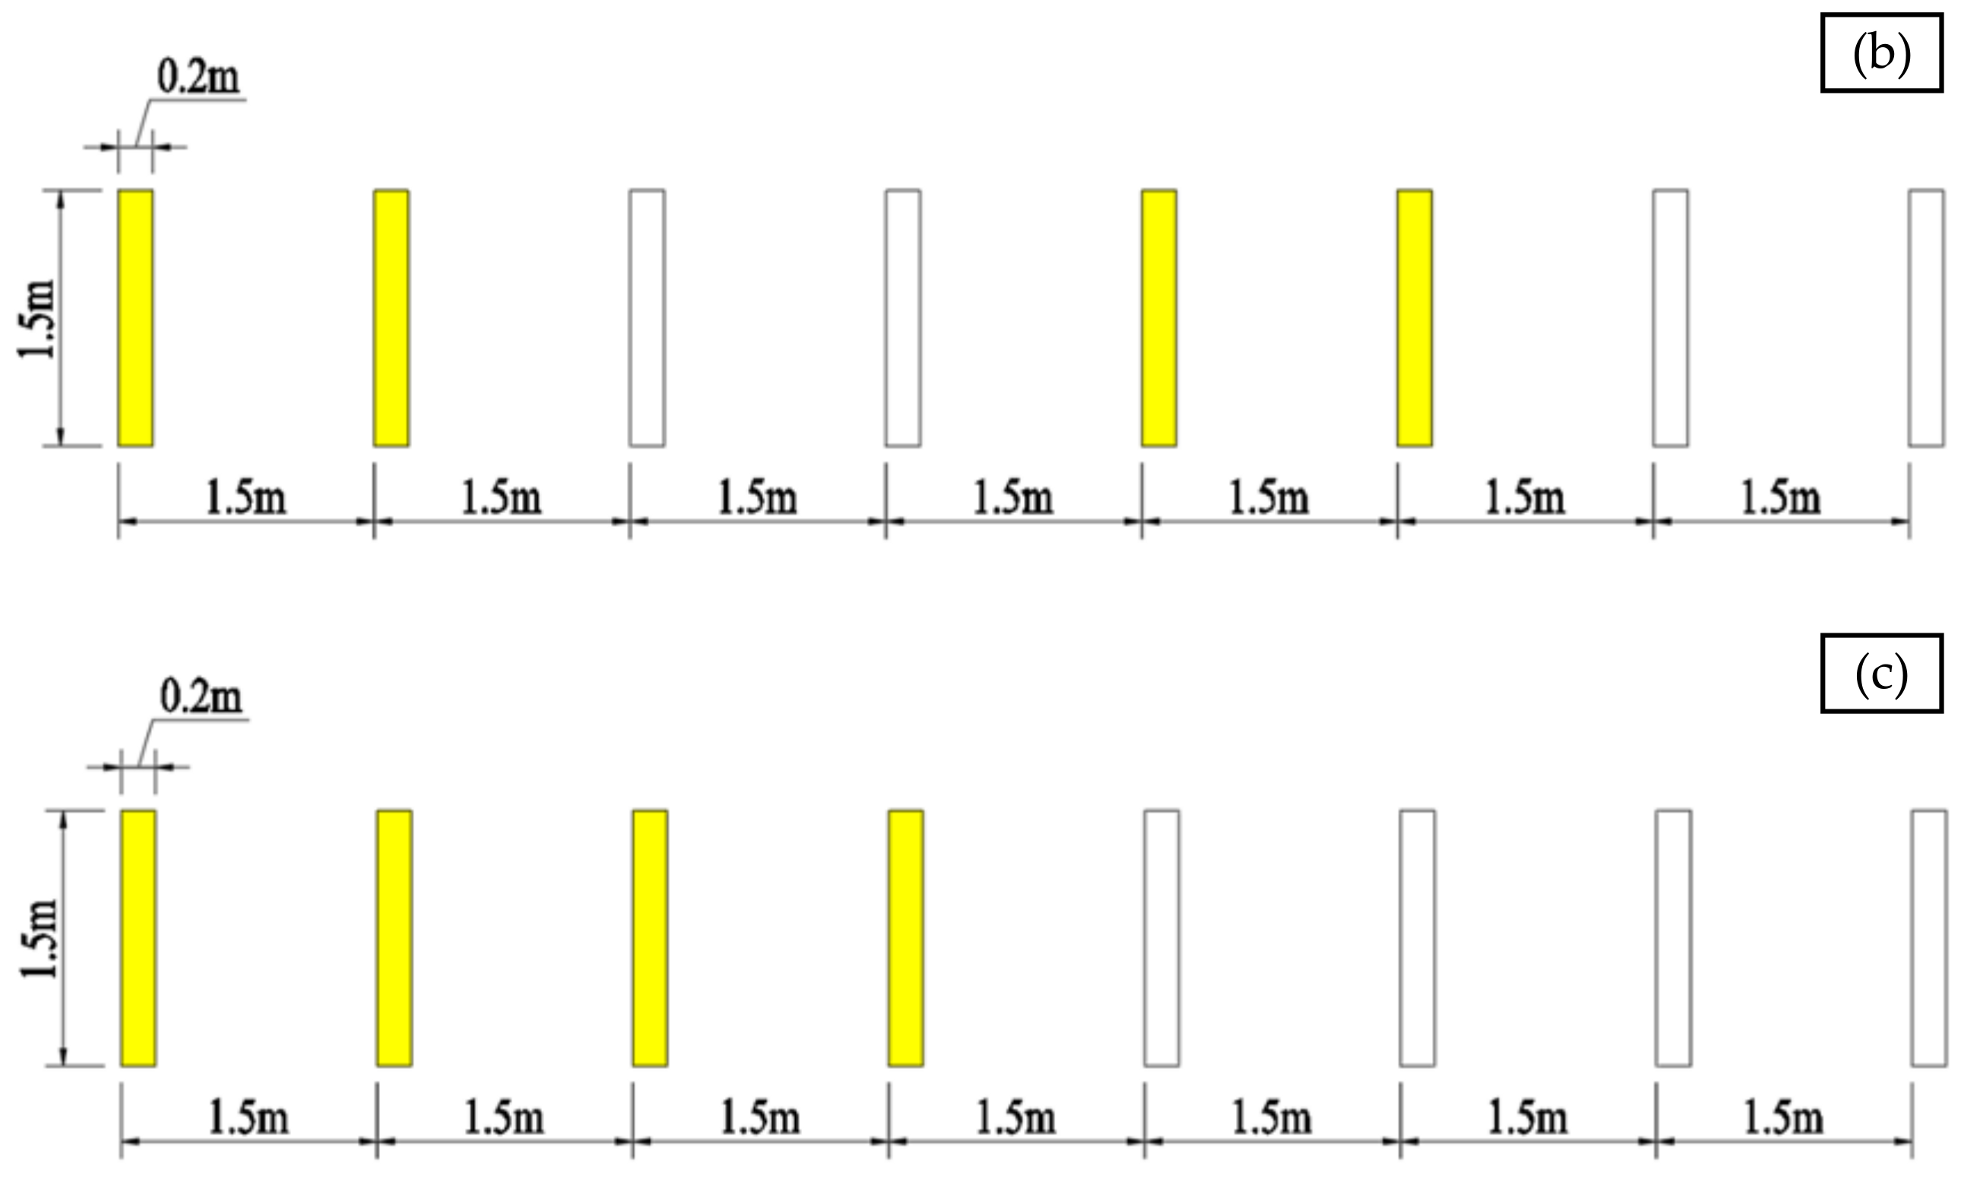
2.2.2. VIDD on Side Wall in Middle of Tunnel

Accidents that happen in the middle of a long tunnel are due mainly to the lack of light therein. Moreover, the visual environment of the traffic lane and wall of the tunnel is very monotonous, which can make drivers impatient, depressed, and more likely to accelerate. Therefore, as shown schematically in Figure 2, the present study also involved using a VIDD (Wuhan Gongdaminxing Traffic Engineering Consulting Co., Ltd, Wuhan, China) on the wall of the middle section of the Yunmengshan Tunnel (in the Shijiazhuang direction). According to the Chinese technical standards for highway engineering (JTG B01-2014), the vision height is 1.2 m for drivers of small and medium-sized automobiles and 1.9–2.5 m for drivers of large trucks. To ensure that drivers with different vision heights could see the VIDD on the side wall of the tunnel properly, and for ease of removal and replacement after each experiment, we used yellow and white reflective strips for the VIDD instead of painted marking lines. Each reflective strip was 20-cm wide, had a spacing of 1.5 m from its adjacent strips, began 1.2 m above the road surface, and occupied a vertical height of 1.5 m.
To investigate how the VIDD parameter settings (e.g., color, shape, angle) affect the control of vehicle speed, we designed three types of VIDD, namely (i) slash line, (ii) fold line, and (iii) alternating color. For the slash-line VIDD, the tilt angle is 15°, 40°, or 55°. For the fold-line VIDD, the fold angle is 60°, 90°, or 120°. For the alternating-color VIDD, the pattern is one yellow then one white (1Y1W), two yellows then two whites (2Y2W), or four yellows then four whites (4Y4W). The different types of VIDD are shown schematically in Figure 3, Figure 4 and Figure 5.

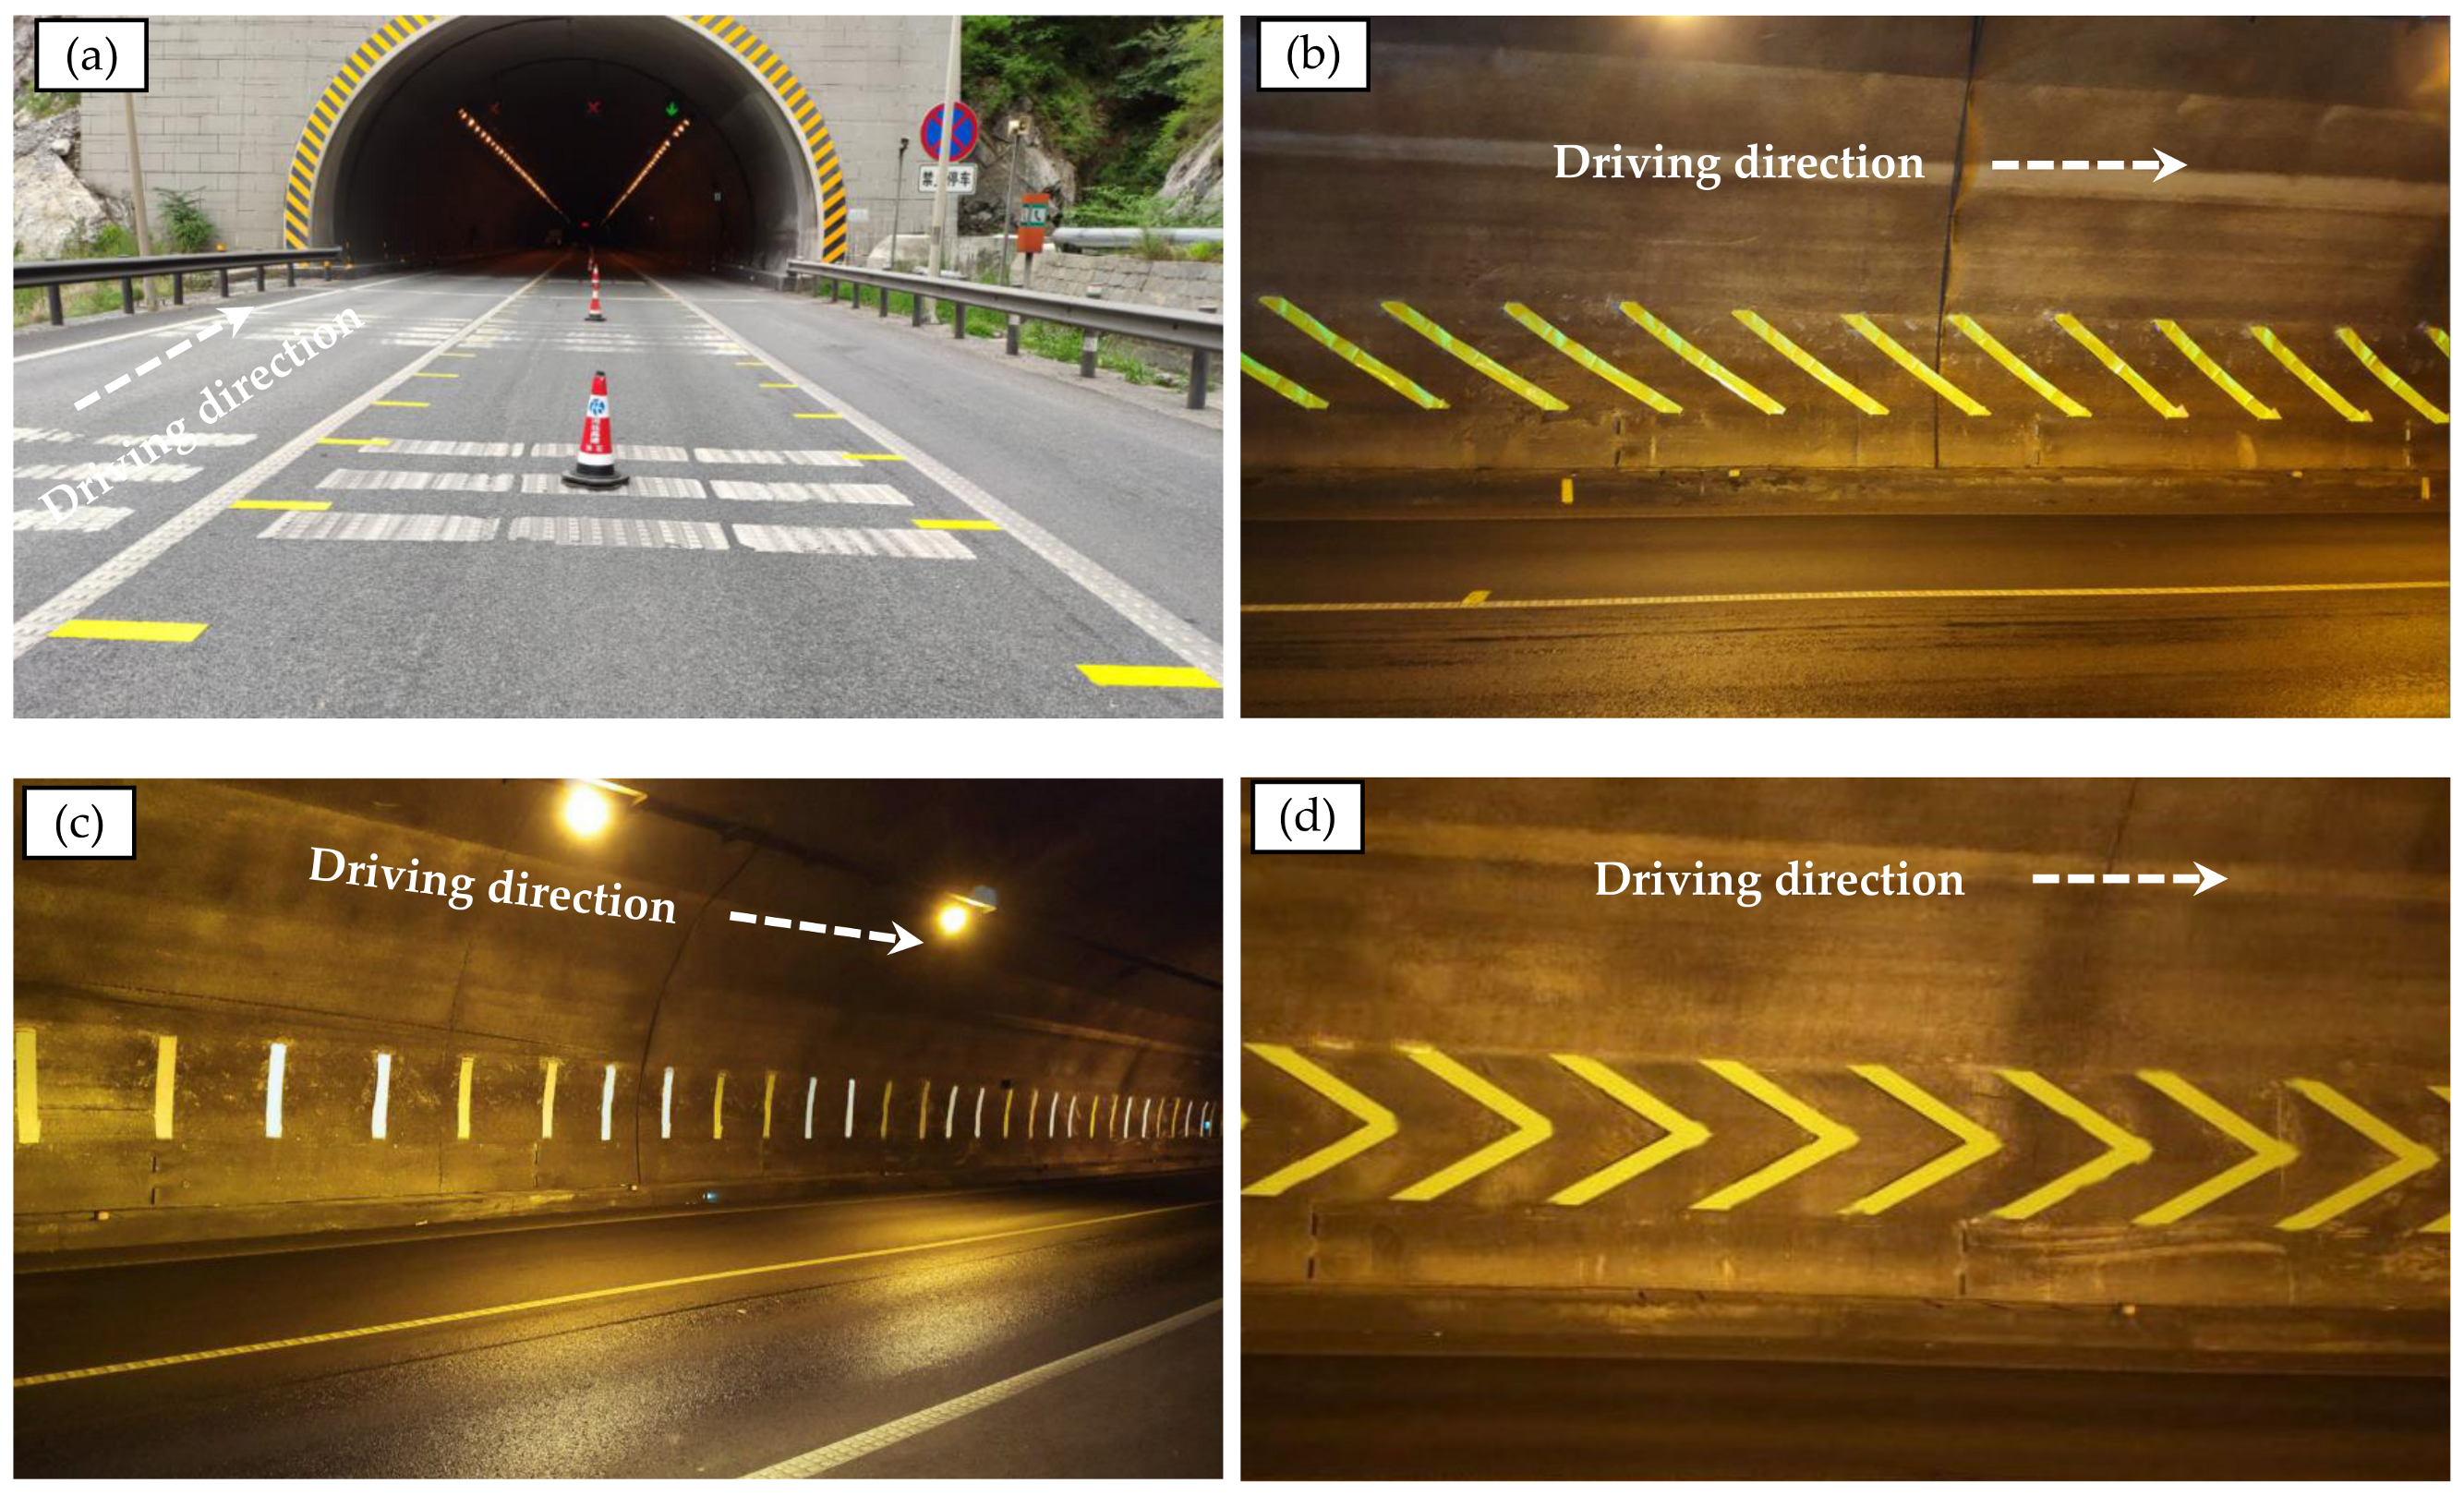
2.3. Photographs of Actual RPIDLs and VIDDs

As examples, photographs of actual RPIDLs and VIDDs are shown in Figure 6. These are the 60 m RPIDLs (Figure 6a), the 55° slash-line VIDD (Figure 6b), the 2Y2W VIDD (Figure 6c), and the 60° fold-line VIDD (Figure 6d).

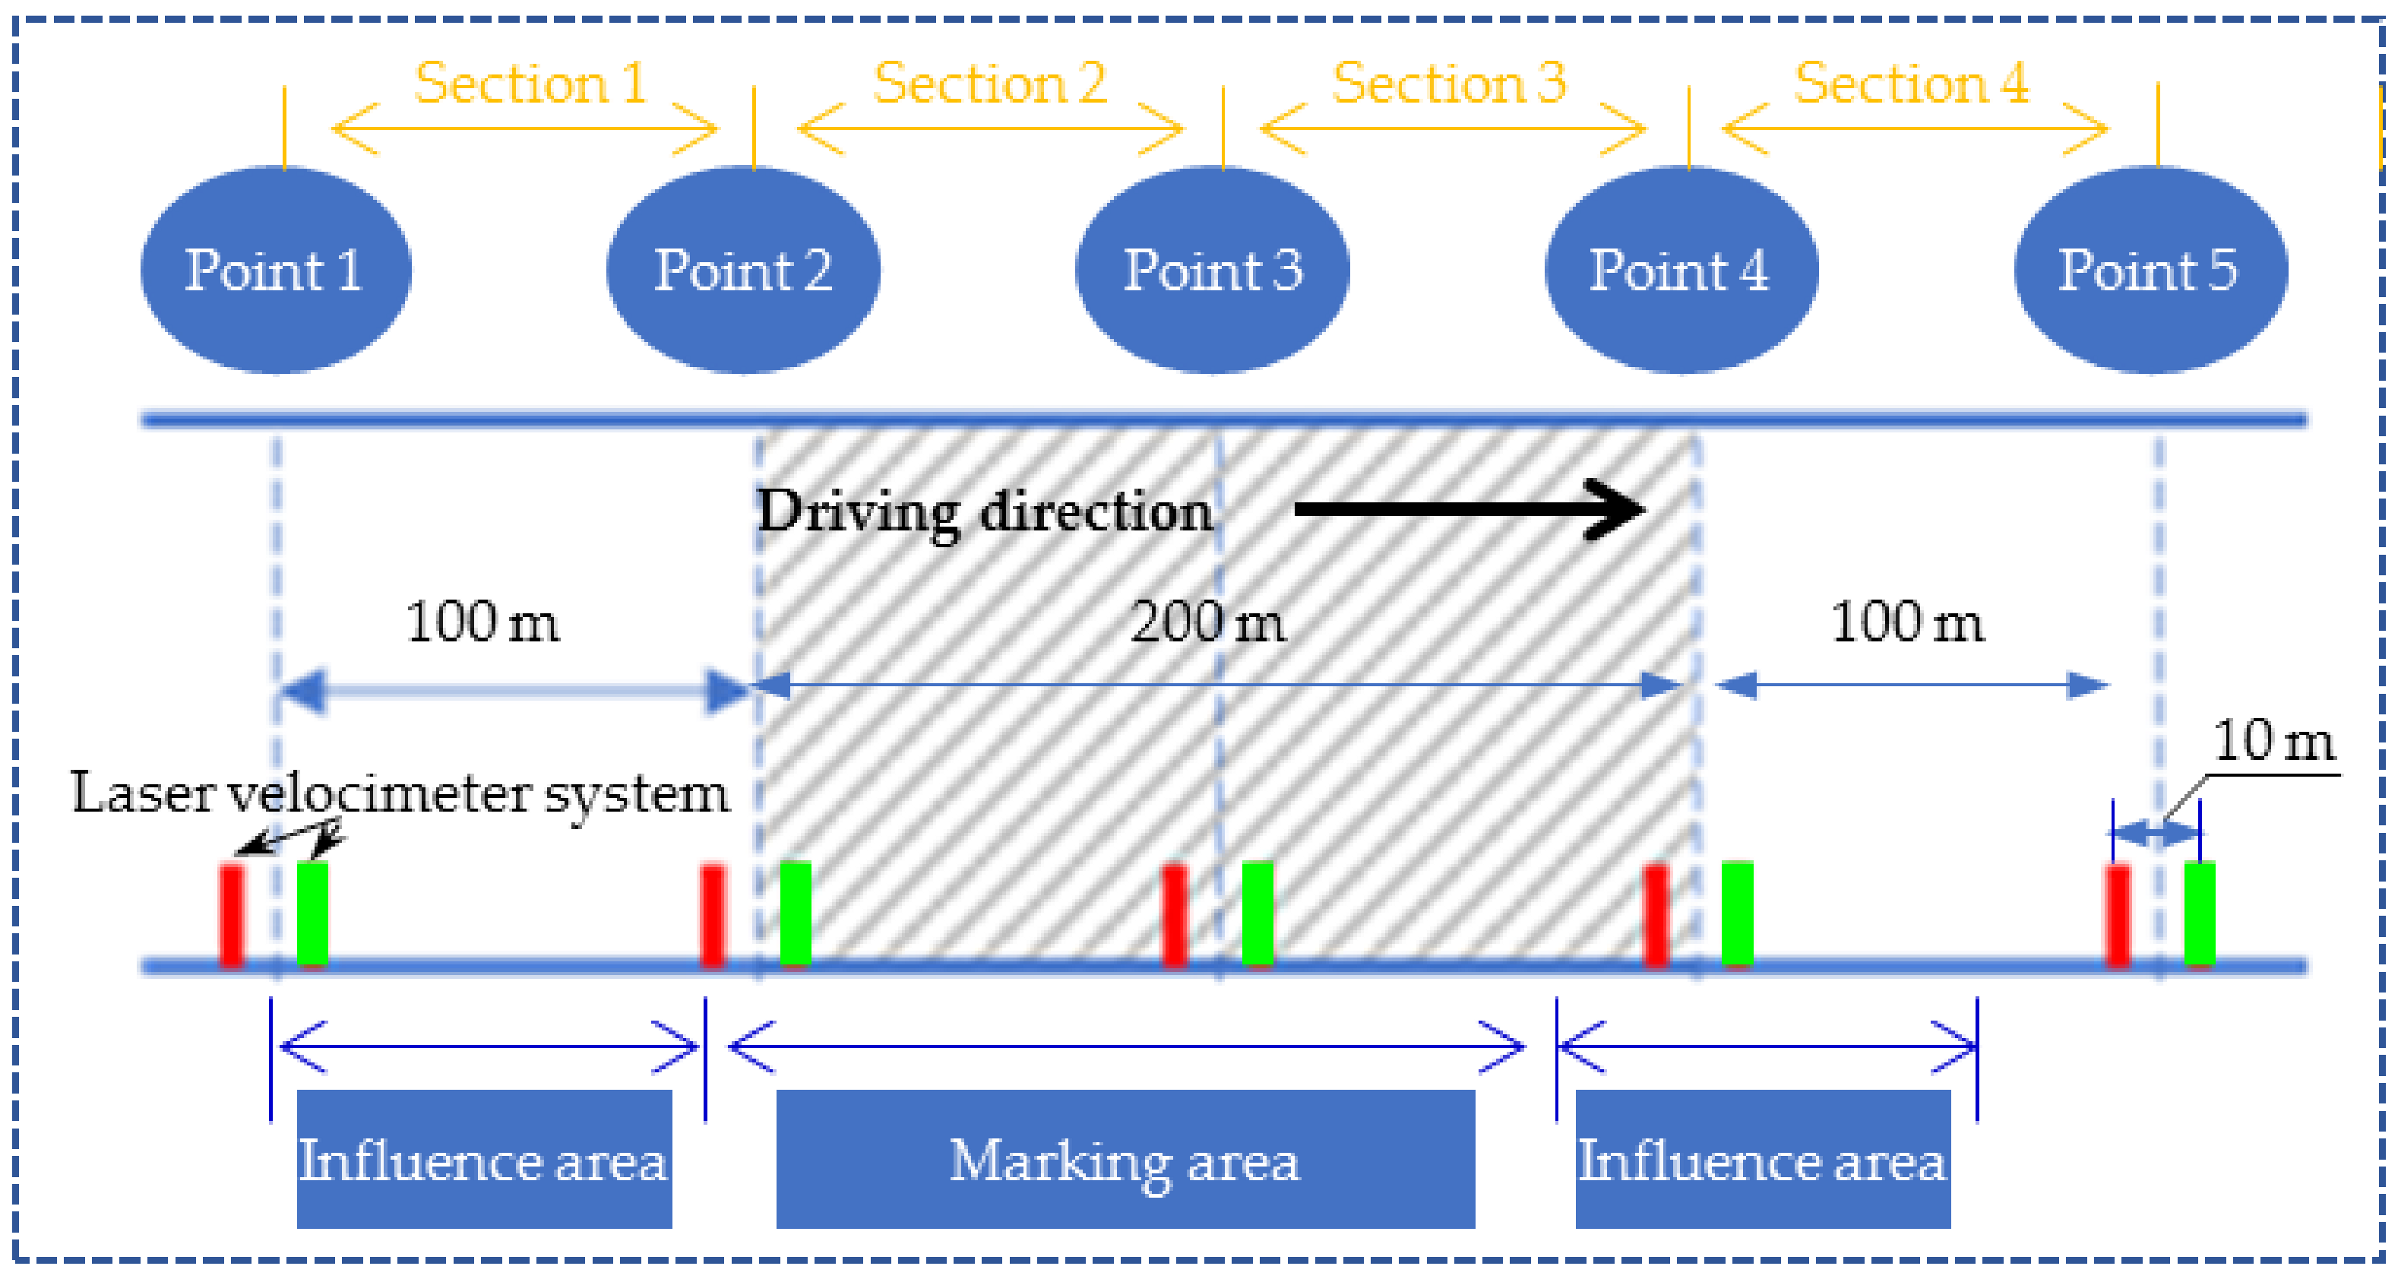
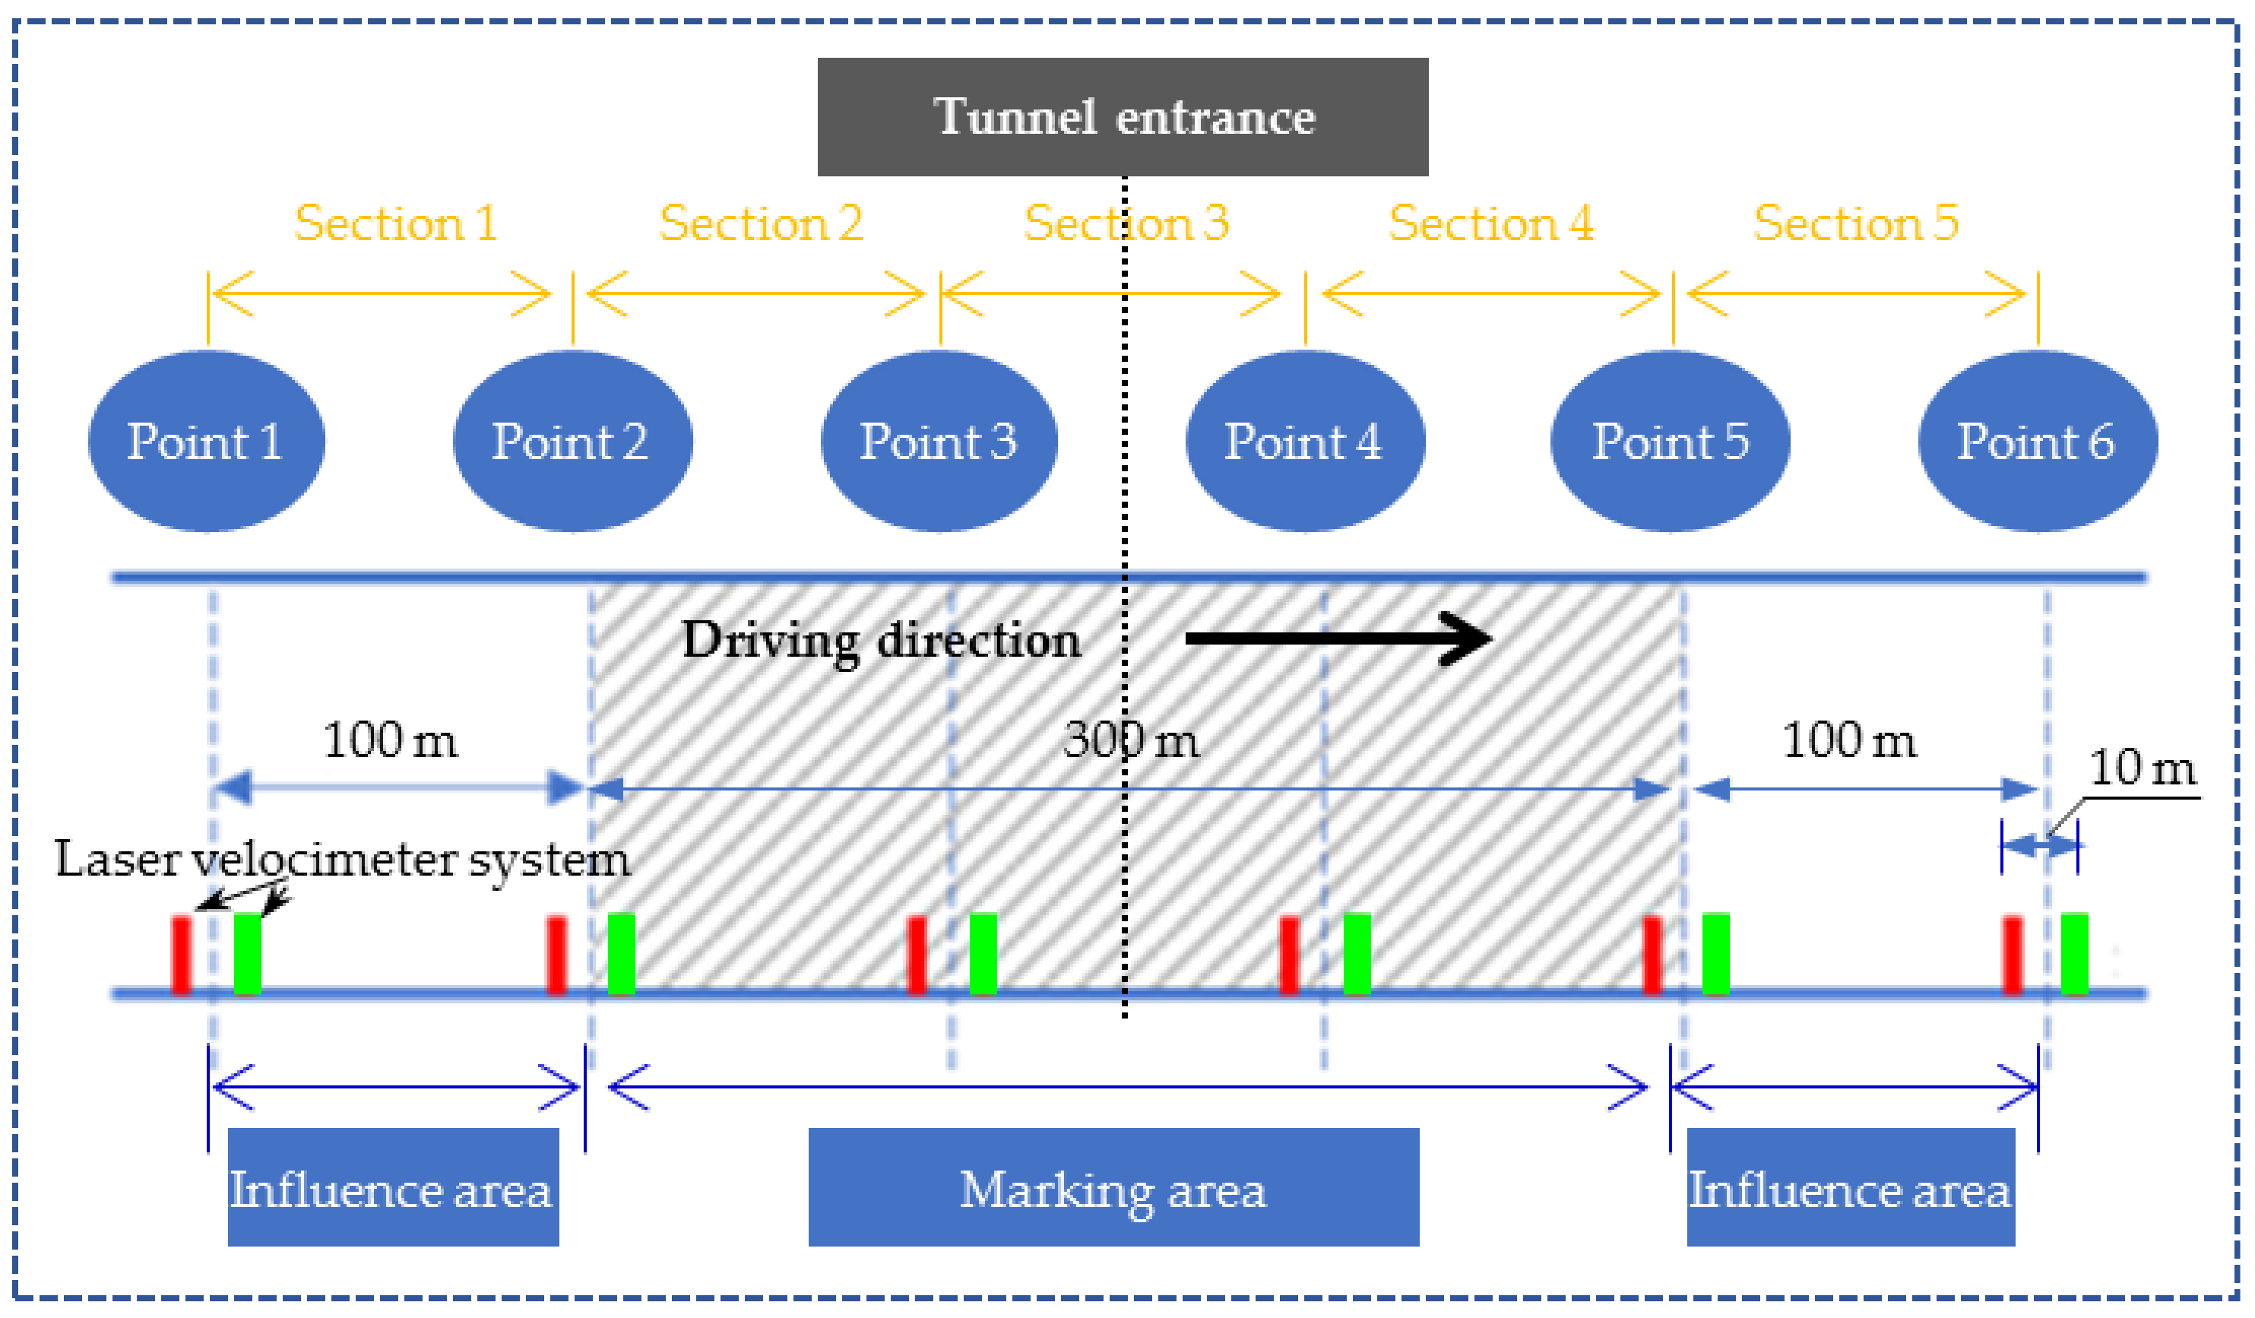
2.4. Methods for Measuring Vehicle Speeds

2.4.1. Measuring Vehicle Speeds Controlled by RPIDLs

The RPIDLs were set in a 500 m length (250 m before the entrance and 250 m after it) at the entrance of Yunmengshan Tunnel (in the Shijiazhuang direction). In detail, the 500 m length comprised a 100 m influence area, a 300 m marking-line area, and another 100 m influence area and was divided by six observation points at 100 m intervals, as shown in Figure 7. An LV (AxleLight RLU/3) and a digital camera were located 5 m before and after each observation point to measure the vehicle speeds near the tunnel entrance; the LVs could detect and record the speed, type, and pass time of each vehicle. Based on laser scanning technology, the present type of LV is suitable for collecting traffic-flow data in sections with large traffic volume, and it can detect three or four lanes simultaneously. The range of detectable speeds was 3–200 km/h, and the measurement accuracy exceeded 95.0%. At each observation point, more than 1500 vehicles were detected.

2.4.2. Measuring Vehicle Speeds Controlled by VIDD

The VIDD was set on a 400 m length of side wall in the middle of Yunmengshan Tunnel (in the Shijiazhuang direction), comprising a 100 m influence range, a 200 m marking-line range, and another 100 m influence range. In the 400 m-long experimental section, five observation points were set at 100 m intervals, which divided the experimental section into four sections, as shown in Figure 8. Within a horizontal extent of 200 m, different types of VIDD were placed on the side wall of the tunnel. An LV and a digital camera were placed 5 m before and after each observation point to measure the vehicle speeds in the middle of the tunnel. For each type of VIDD, more than 1500 vehicles were detected.

3. Results and Discussion

According to the existing research results, yellow has excellent visibility and reflectivity [31], so the yellow signals were used as the main color of the deceleration devices applied in this research. To verify the visibility and reflectivity of these yellow signals, before the test, our team drove cars to pass through the testing sections repeatedly. The results show that the drivers can clearly see the deceleration markers within the line of sight; therefore, the visibility and reflectivity meet the test requirements.

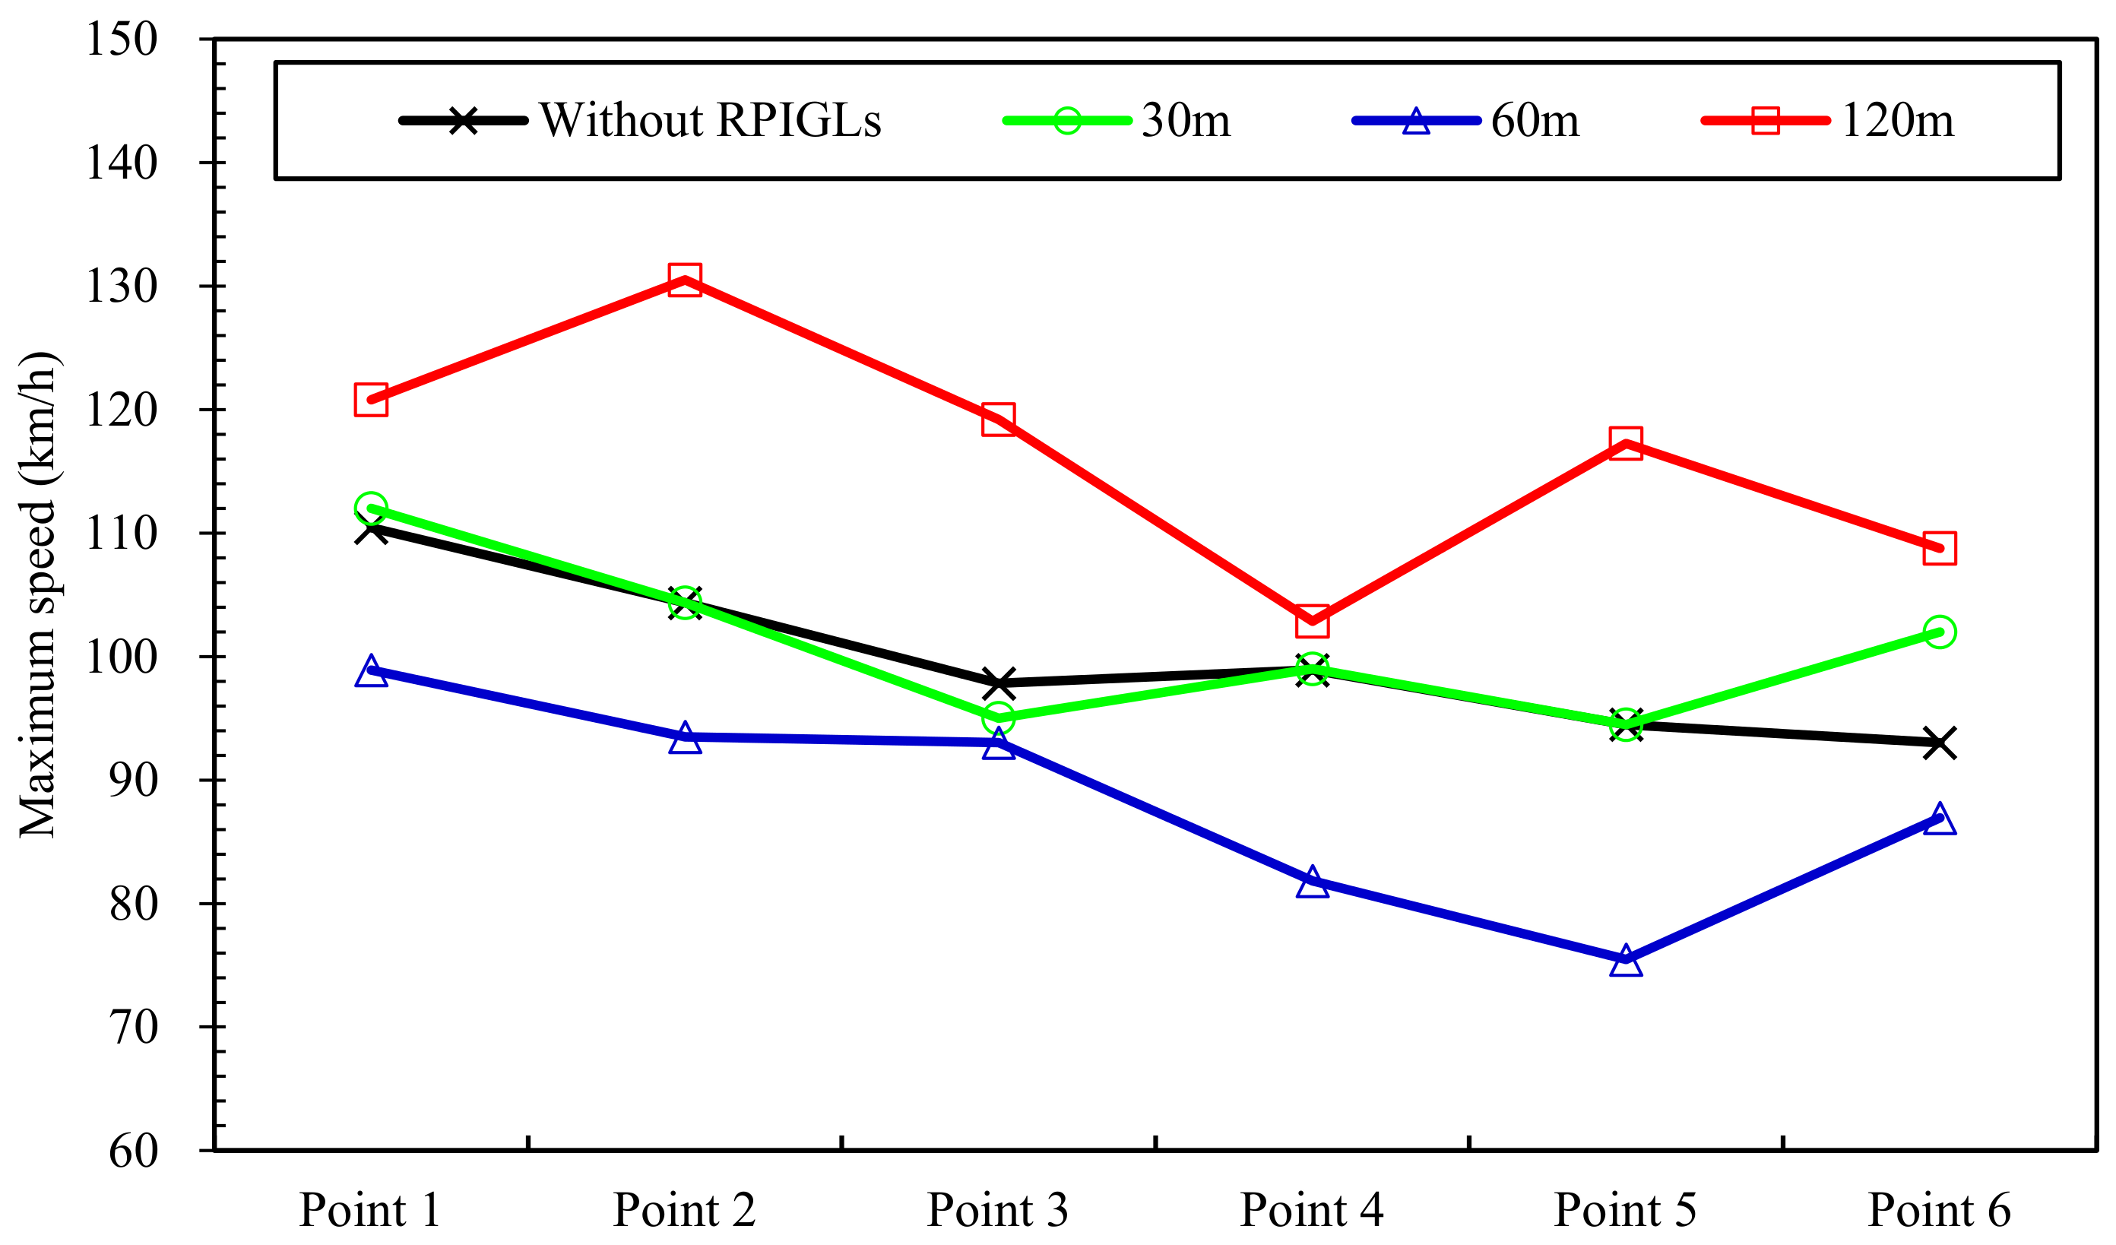
3.1. Effects of RPIDLs on Vehicle Speeds at Entrance of Long Downhill Tunnel

3.1.1. Effect on Vehicle Speeds at Different Observation Points

The maximum and minimum speeds of vehicles controlled by RPIDLs with different group lengths are shown in Figure 9 and Figure 10, respectively. Traffic accidents are correlated positively with maximum speed, so decreasing the latter is a good way to reduce the former. From Figure 9, the vehicles controlled by the 120 m RPIDLs had the highest maximum speed at all six observation points. The 30 m RPIDLs had no obvious effect on the maximum speed: that of vehicles controlled by those RPIDLs was almost the same as that of vehicles without RPIDLs. The 60 m RPIDLs gave the lowest maximum speed, meaning that they are the best for controlling the maximum vehicle speed and improving traffic safety in the tunnel.
However, the vehicle speeds should also not be too low: speeds that are too low test the patience of drivers and reduce traffic efficiency in the tunnel. From Figure 10, the minimum speeds of vehicles controlled by the 30 m, 60 m and 120 m RPIDLs were generally higher than that of vehicles without RPIDLs, indicating that with RPIDLs, drivers adapt to the tunnel environment more quickly and regain their driving confidence. Comparison shows that the 60 m RPIDLs gave the highest minimum speed at points 2, 3, 4, and 6 and so generally offer the best speed control.
The differences between the maximum and minimum vehicle speeds are given in Table 1, and the vehicle speeds at different observation points are shown in Figure 11. From Table 1, the difference between the maximum and minimum speeds of vehicles controlled by the 60 m RPIDLs is the lowest among the three different RPIDL group lengths; it is 20.2, 13.4, and 33.3 km/h lower than those of the vehicles without RPIDLs and controlled by the 30 m and 120 m RPIDLs, respectively. Meanwhile, the standard deviation with the 60 m RPIDLs is also lower than those with the 30 m and 120 m RPIDLs; the results show that the vehicles controlled by the 60 m RPIDLs have the lowest speed dispersion. From Figure 11, the average vehicle speed without RPIDLs decreases from observation point 1 to point 3 and then increases from point 3 to point 6. The reason for this is that when vehicles approach the tunnel, their drivers tend to decelerate in response to the changed driving environment; however, after adapting to the driving environment, the drivers tend to accelerate back to the original speed. There is no obvious difference in driving behavior between vehicles controlled by the 30 m RPIDLs and those without RPIDLs. The 60 m RPIDLs delayed the acceleration time, with vehicles accelerating only after passing point 5; this indicates that the 60 m RPIDLs can affect a driver’s visual response and actively control the vehicle speed. With the 120 m RPIDLs, the driving behavior exhibits no obvious pattern: the speed fluctuates obviously, and the difference between the maximum and minimum speeds is the highest.

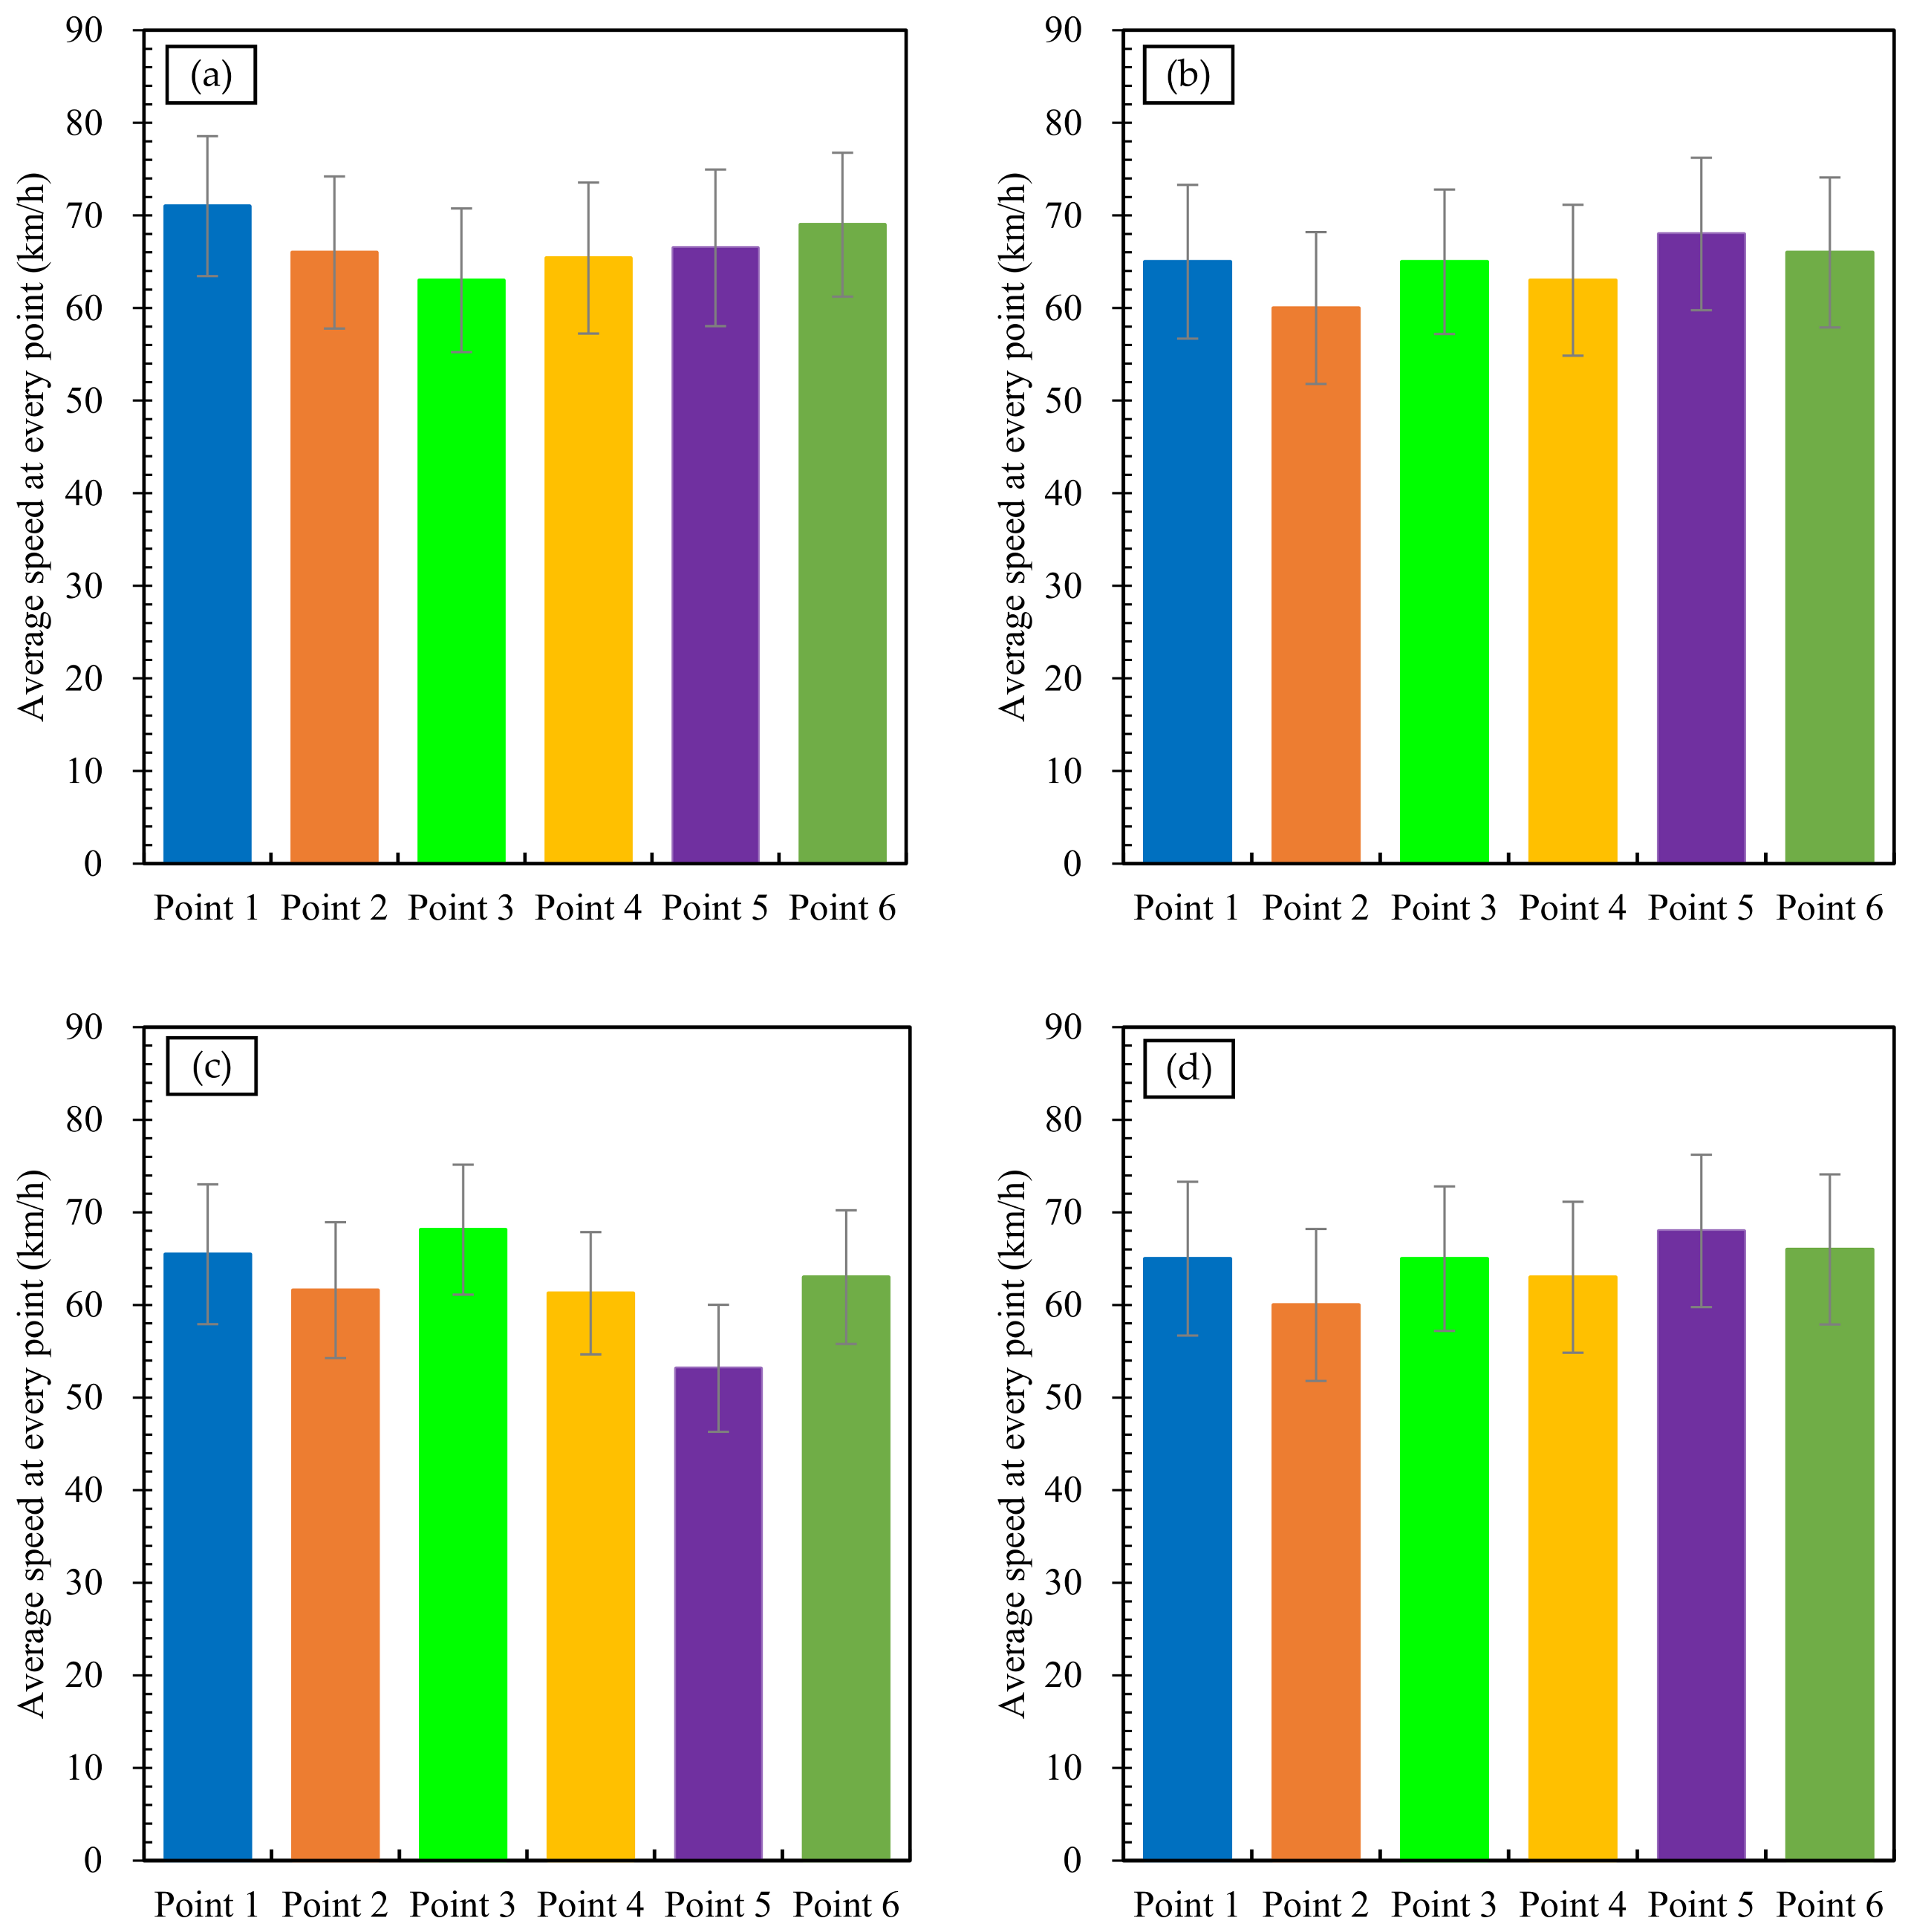
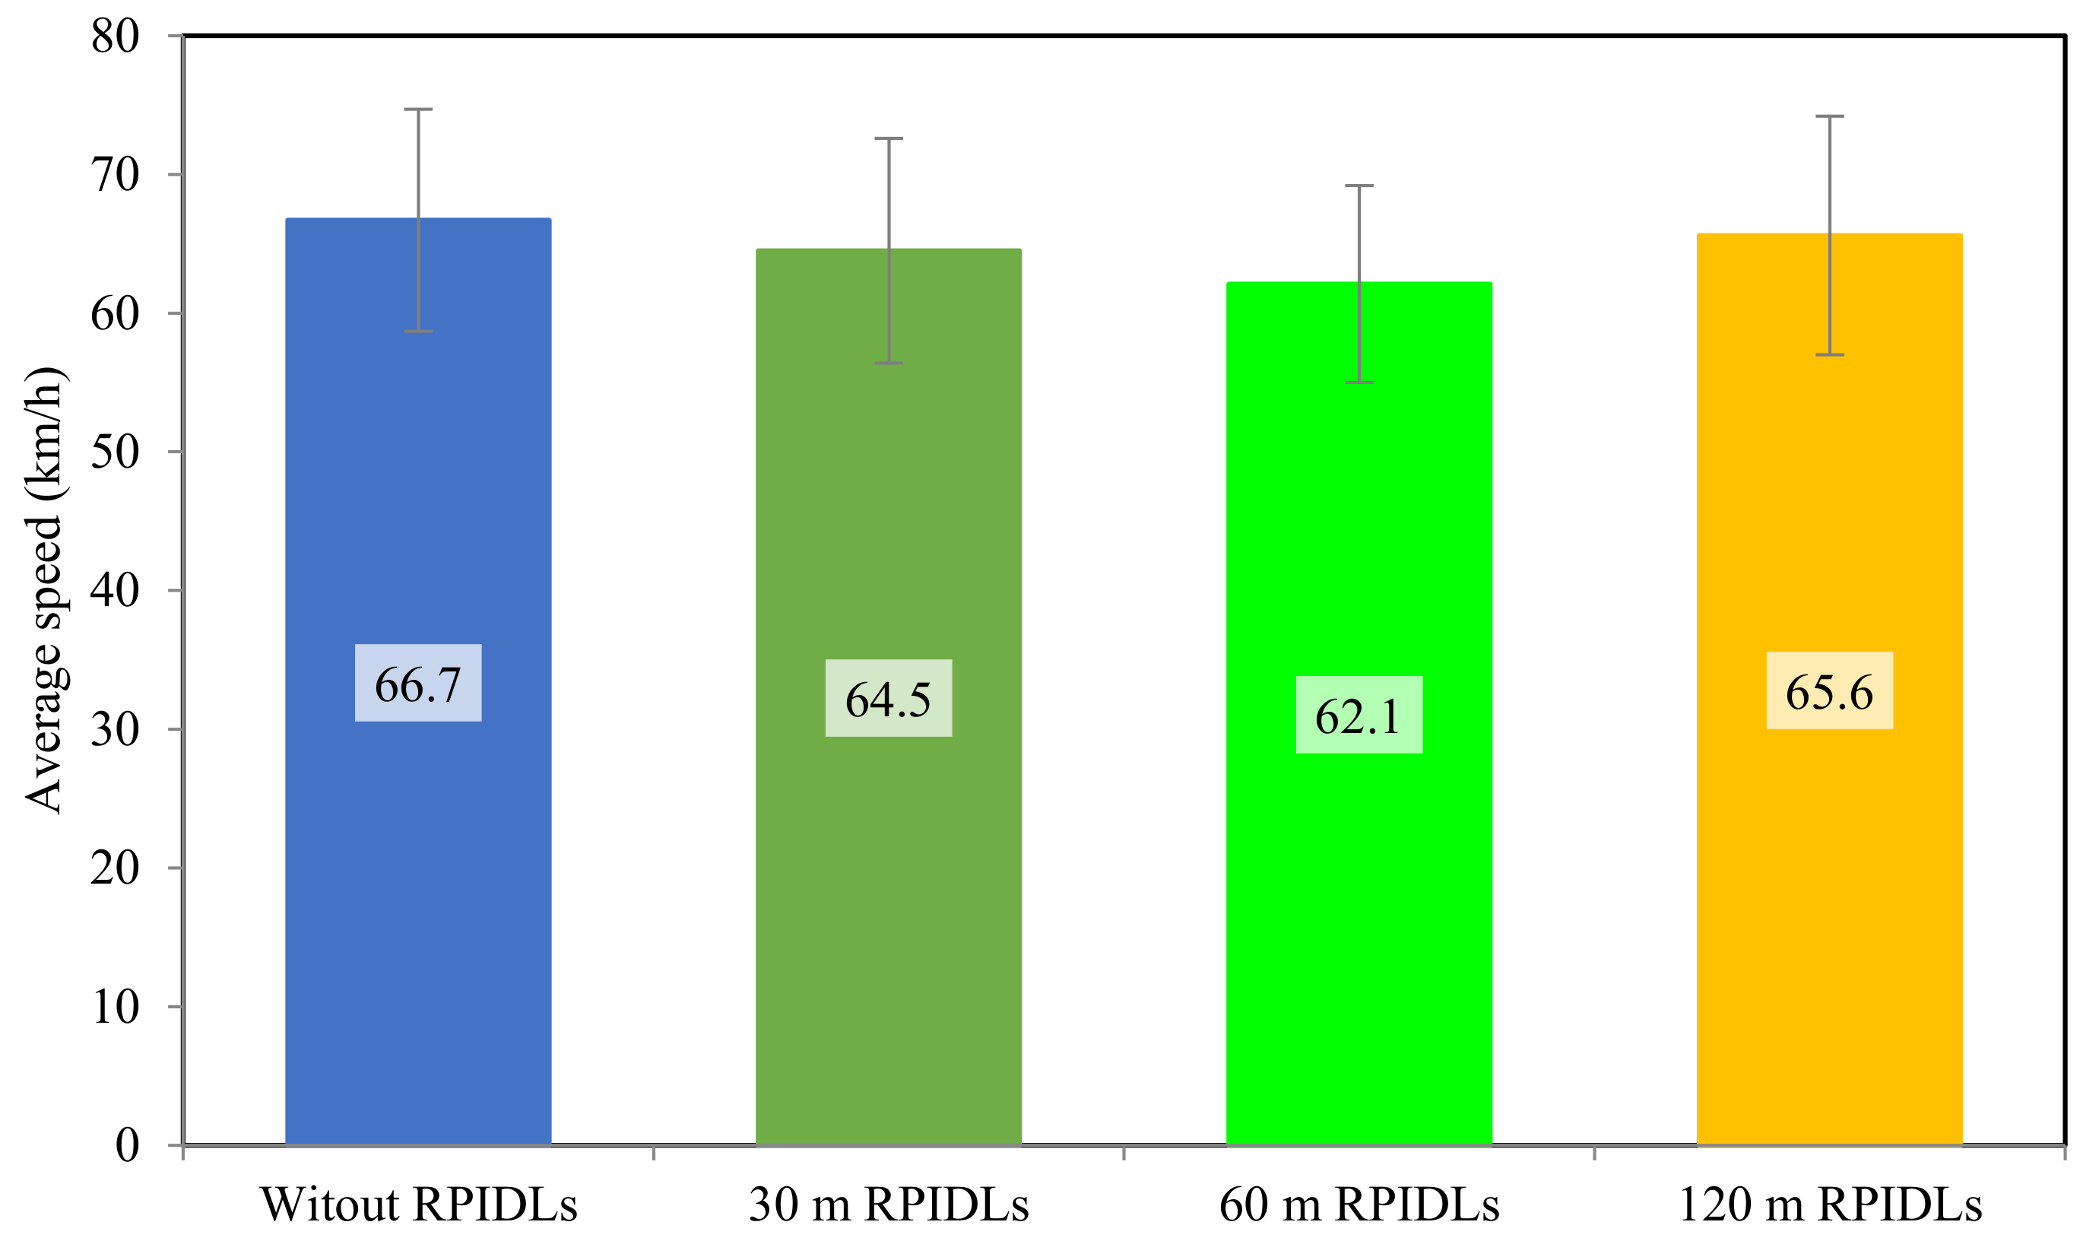
3.1.2. Effect on Average Vehicle Speed

The average speed and standard deviation of vehicles in the whole experimental section controlled by RPIDLs with different group lengths are shown in Figure 12. Compared with the average speed without RPIDLs, those with the 30 m, 60 m, and 120 m RPIDLs decreased by around 1.8%, 7.0%, and 3.5%, respectively, indicating that RPIDLs with all three group lengths decrease the average speed near the tunnel entrance. Also, the standard deviation of the vehicle speeds with the 60 m RPIDLs is the lowest, being 11.1% lower than that of the vehicle speeds without RPIDLs. Therefore, the 60 m RPIDLs decrease both the vehicle speeds and their dispersion near the tunnel entrance.

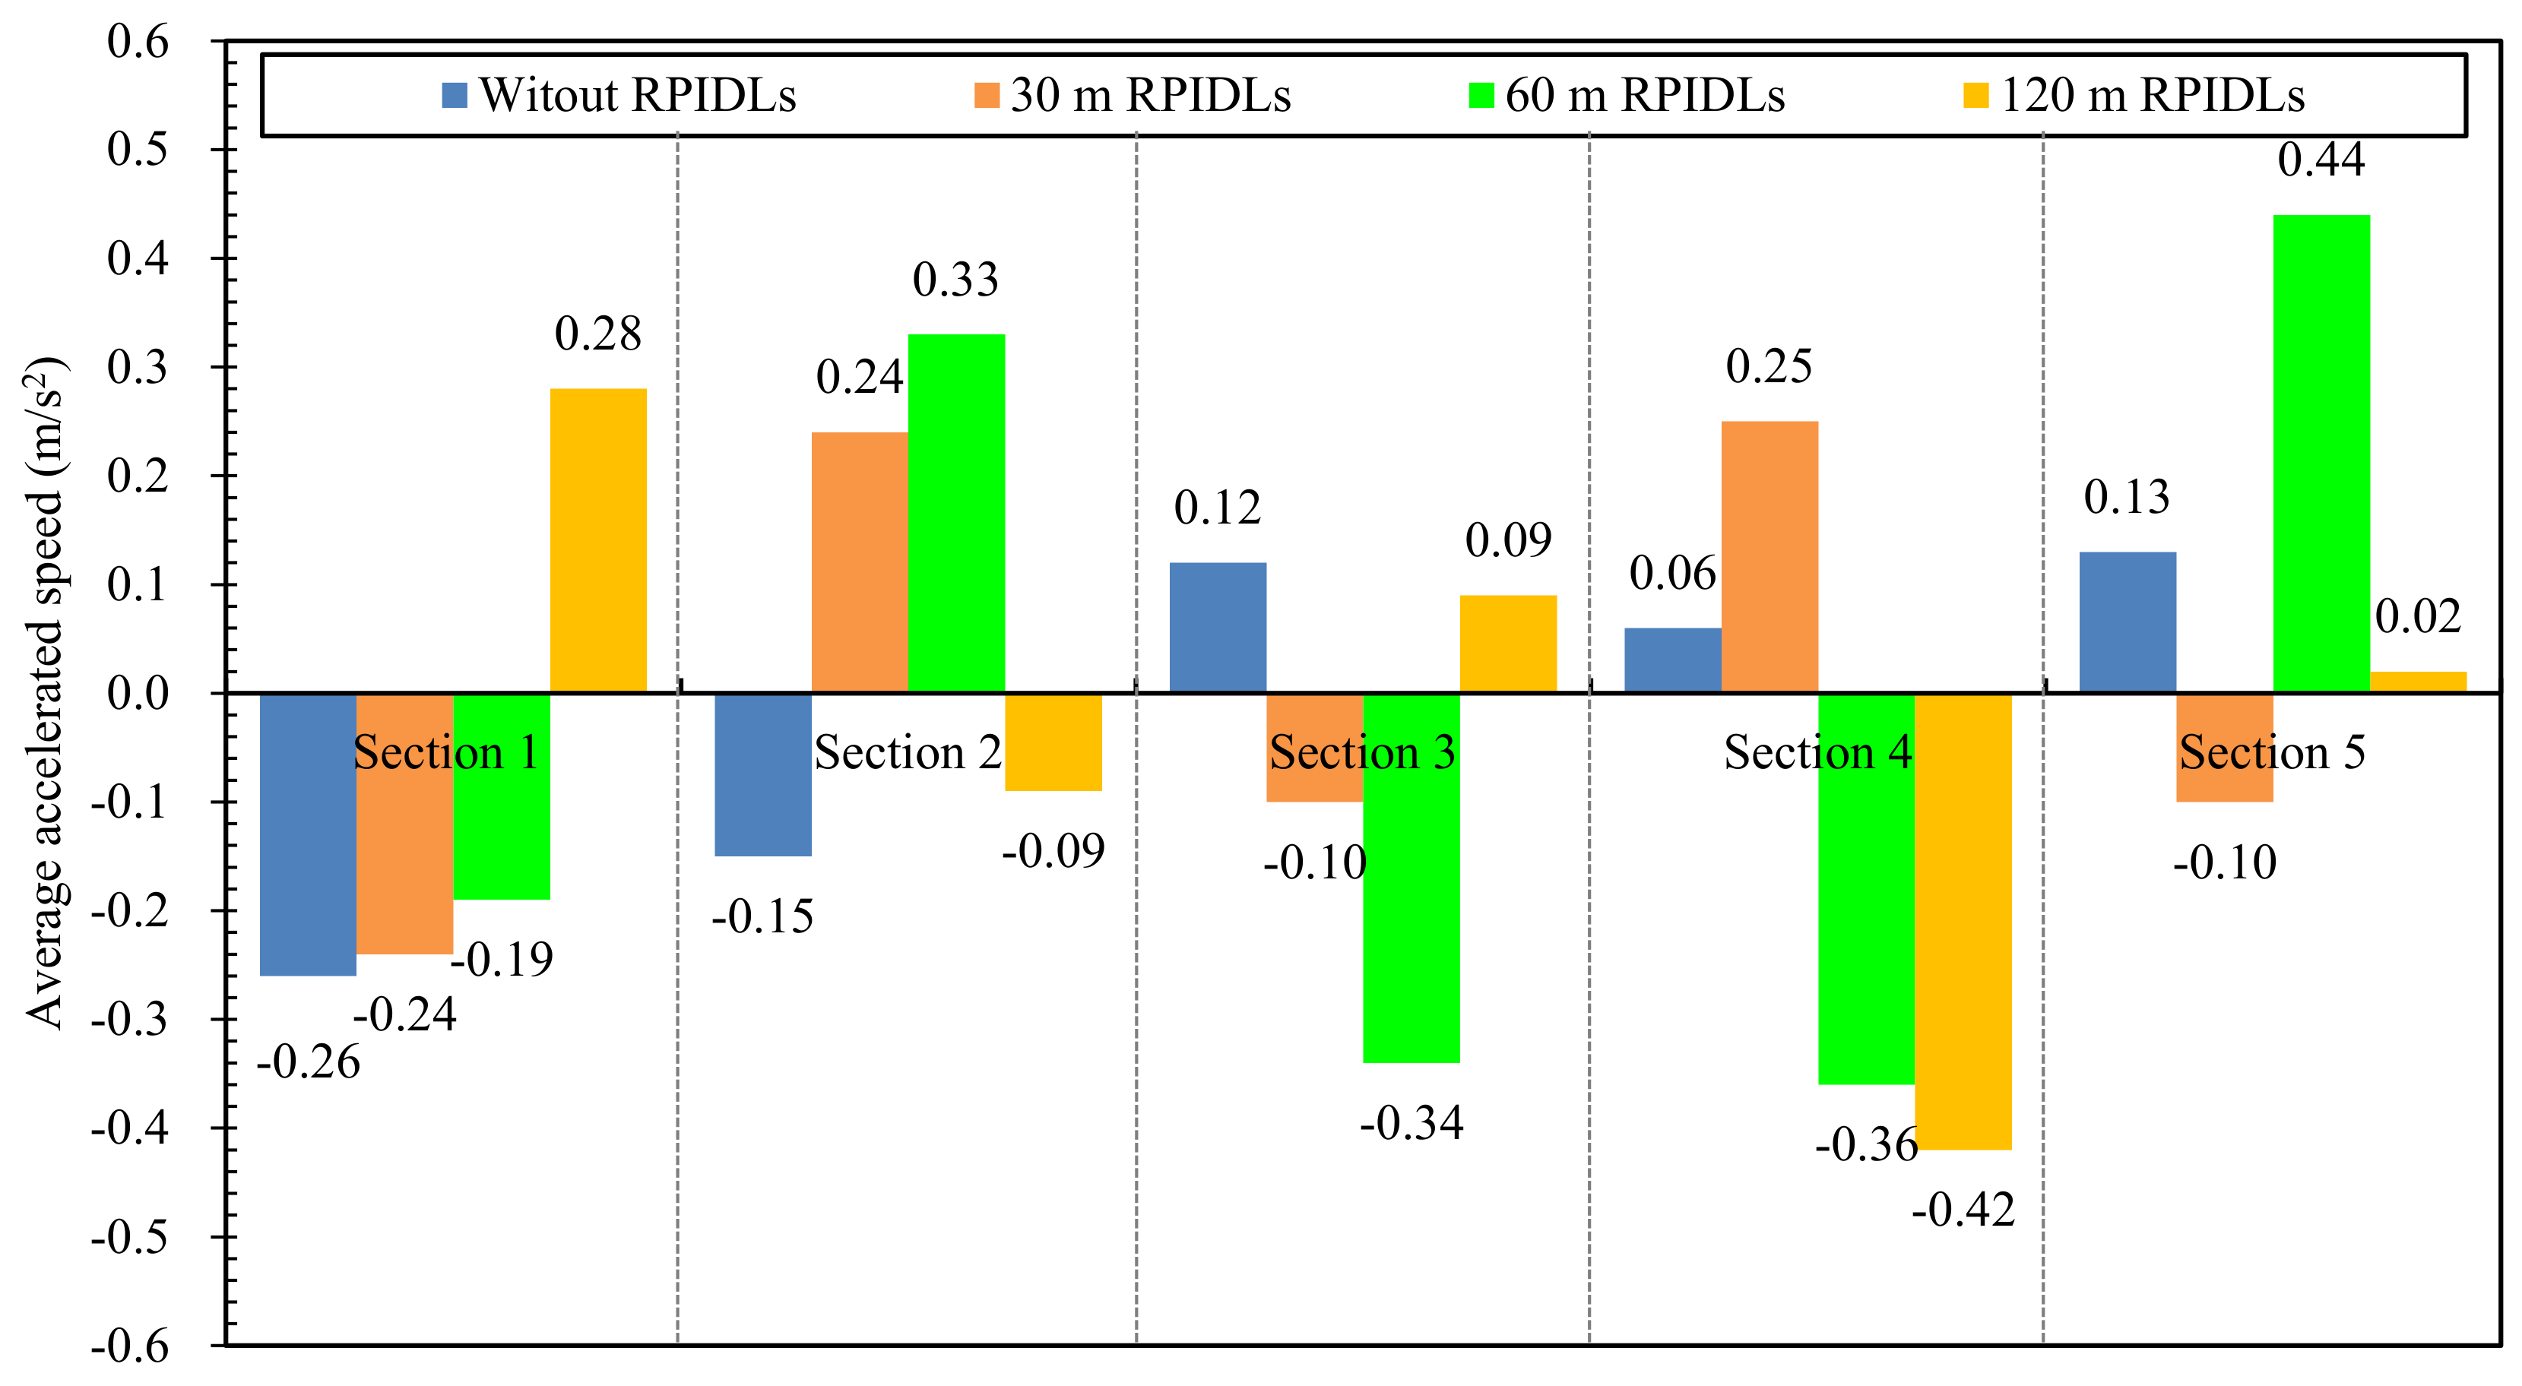
3.1.3. Effect on Average Vehicle Acceleration

The average vehicle acceleration a ¯ [m/s2] is calculated as:
a ¯ = v i + 1 2 v i 2 2 s ,
where vi and vi+1 [m/s] are the vehicle speeds at points i and i + 1, respectively, and s [m] is the distance between those points. The average vehicle accelerations in different sections from observation point 1 to point 6 are shown in Figure 13. In Sections 2 and 4, the 120 m RPIDLs gave the most obvious deceleration, with the highest average acceleration being −0.42 m/s2; this was followed by the 60 m RPIDLs, with which the vehicle speeds decreased obviously in Sections 3 and 4, and the average accelerations in these two sections were −0.34 and −0.36 m/s2, respectively. However, the speeds of vehicles controlled by the 30 m RPIDLs were relatively unstable, exhibiting alternating deceleration and acceleration from Section 1 to Section 5.
There is an obvious positive correlation between the speed and severity of traffic accidents, and the dispersion of speed is another important factor affecting the accident rate [32]. The above analysis shows that without RPIDLs, drivers tend to decelerate slightly at the tunnel entrance because of the changed driving environment upon entering the tunnel; having become accustomed to the environment, the drivers then tend to accelerate. Note that the vehicle speed fluctuates greatly without RPIDLs, which constitutes a traffic safety hazard.
By contrast, all the RPIDLs affect the behavior of drivers, causing them to decelerate. Comparison shows that the 60 m RPIDLs give rise to the most obvious deceleration effect: the average speed and standard deviation decrease by 7.0% and 11.1%, respectively. Therefore, the 60 m RPIDLs have the best deceleration effect on vehicles near the tunnel entrance. The reason is that the RPIDLs affect the perspective of the road, causing the drivers to underestimate the real distance and then take measures to slow down. The resulting lower and less-dispersed speeds are good for decreasing the accident rate and improving the traffic safety of the tunnel.

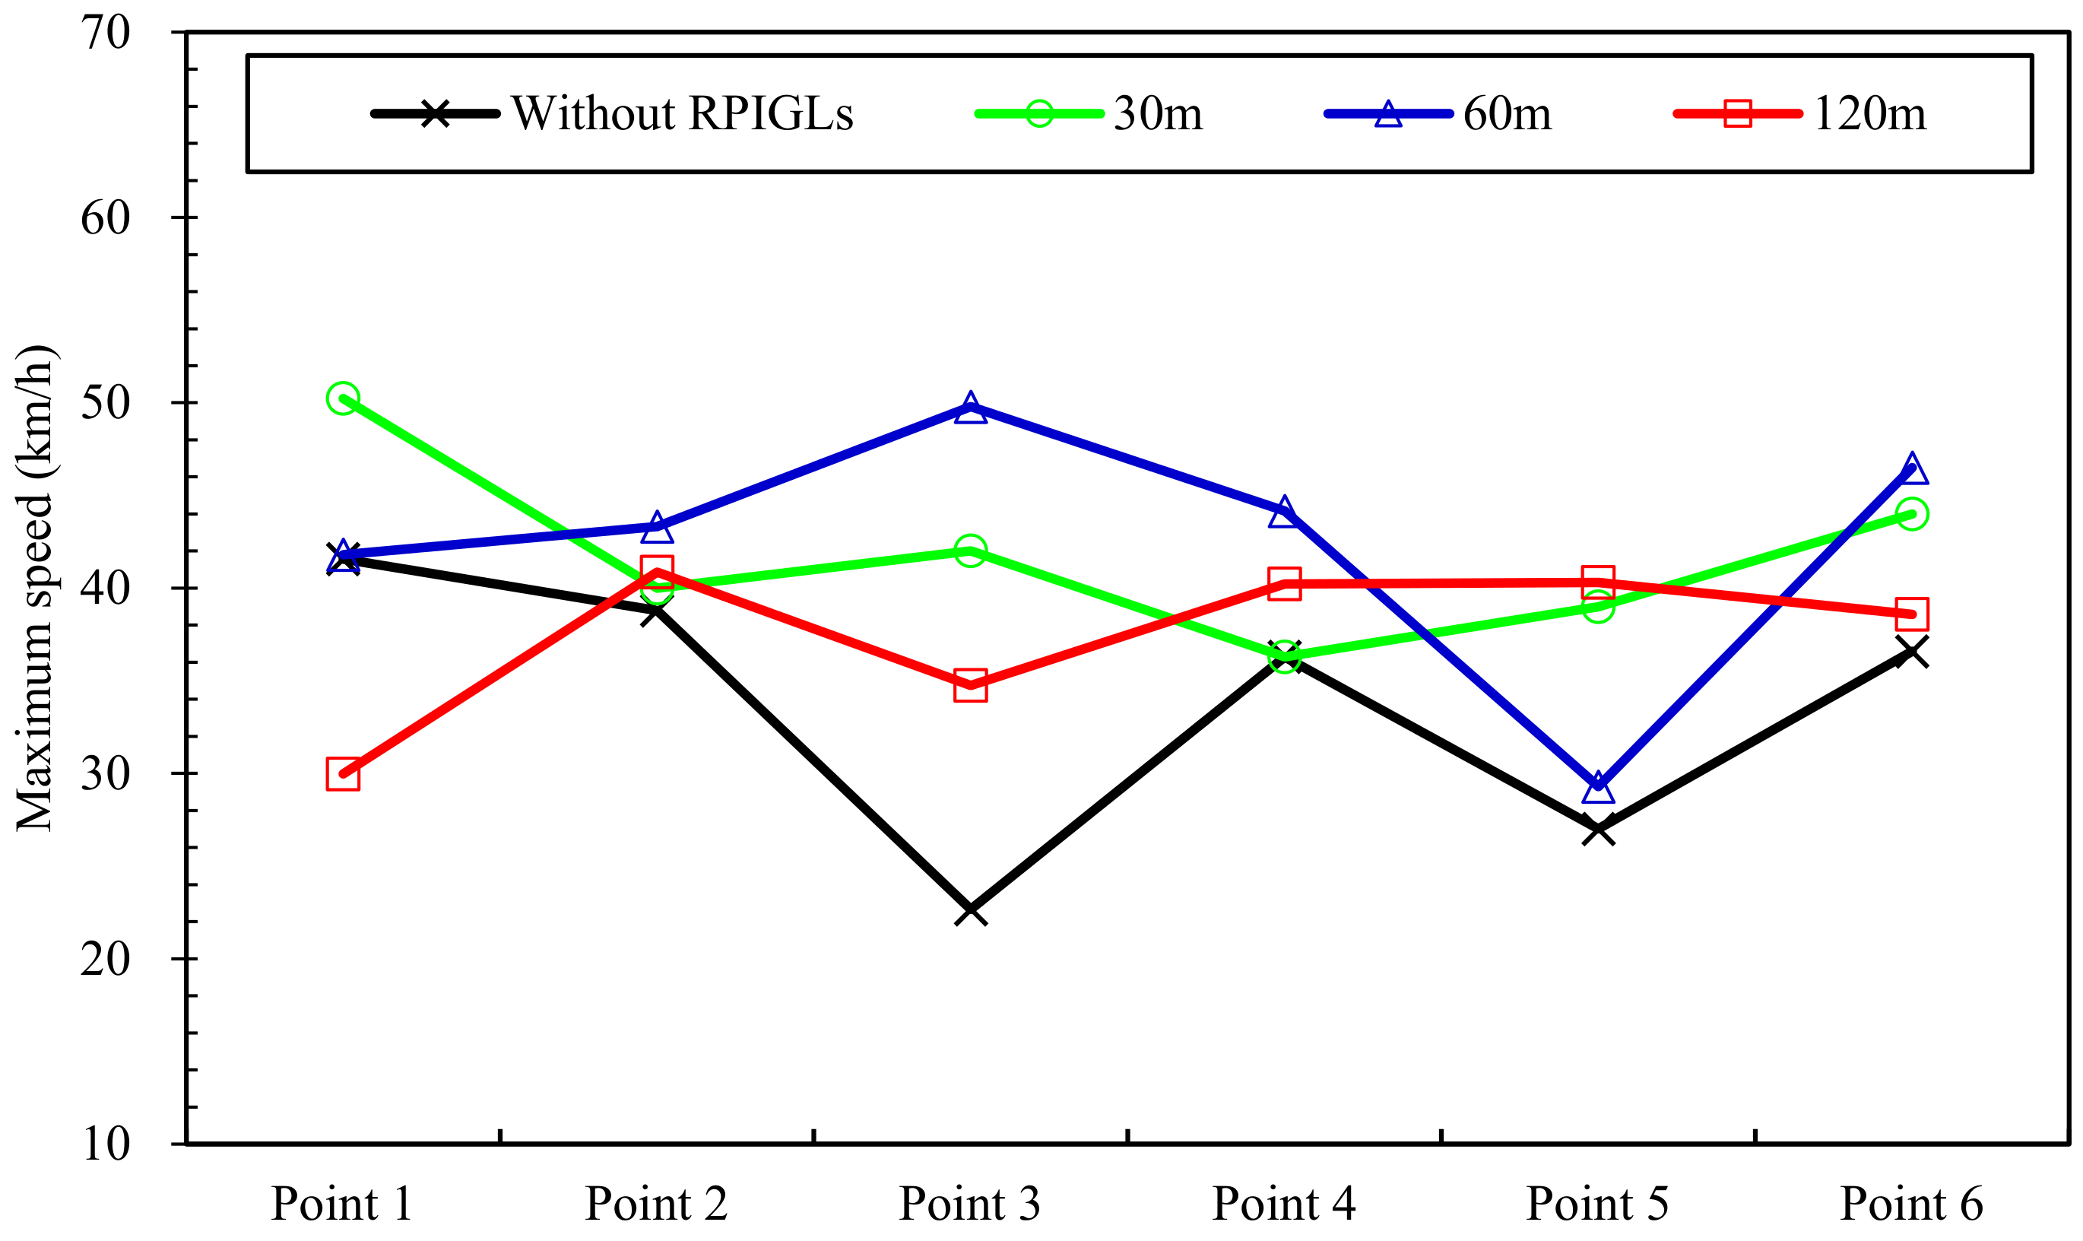
3.2. Effects of VIDD on Vehicle Speeds in Middle of Long Downhill Tunnel

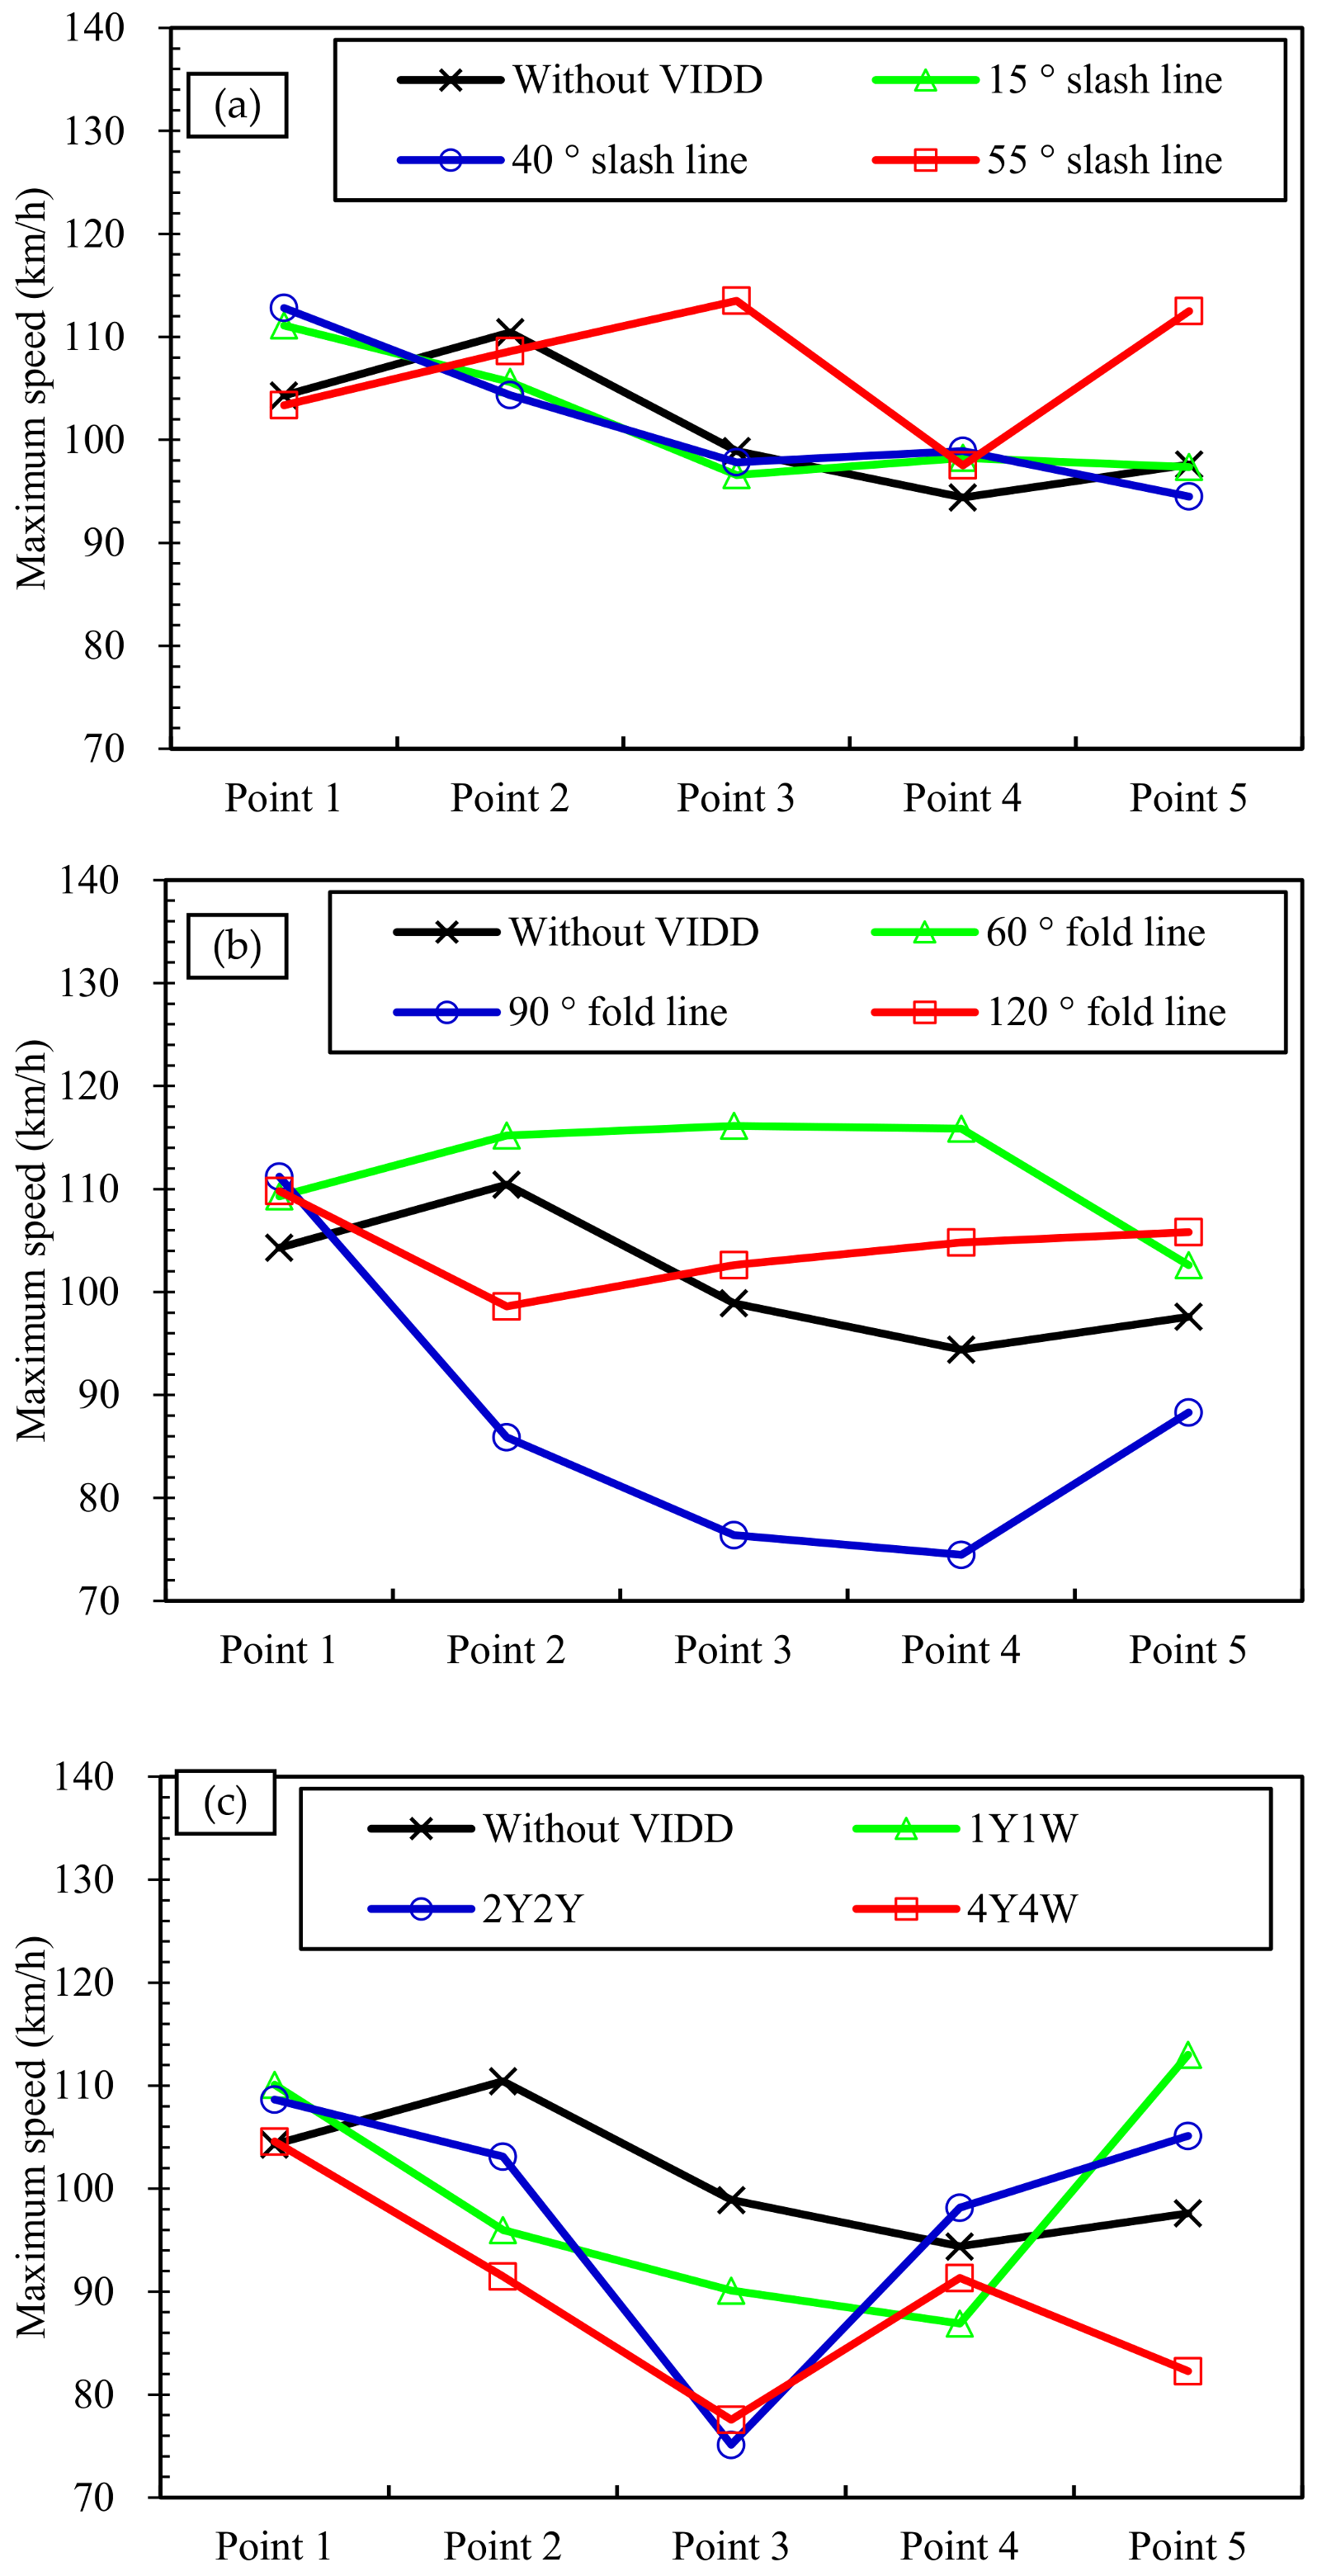
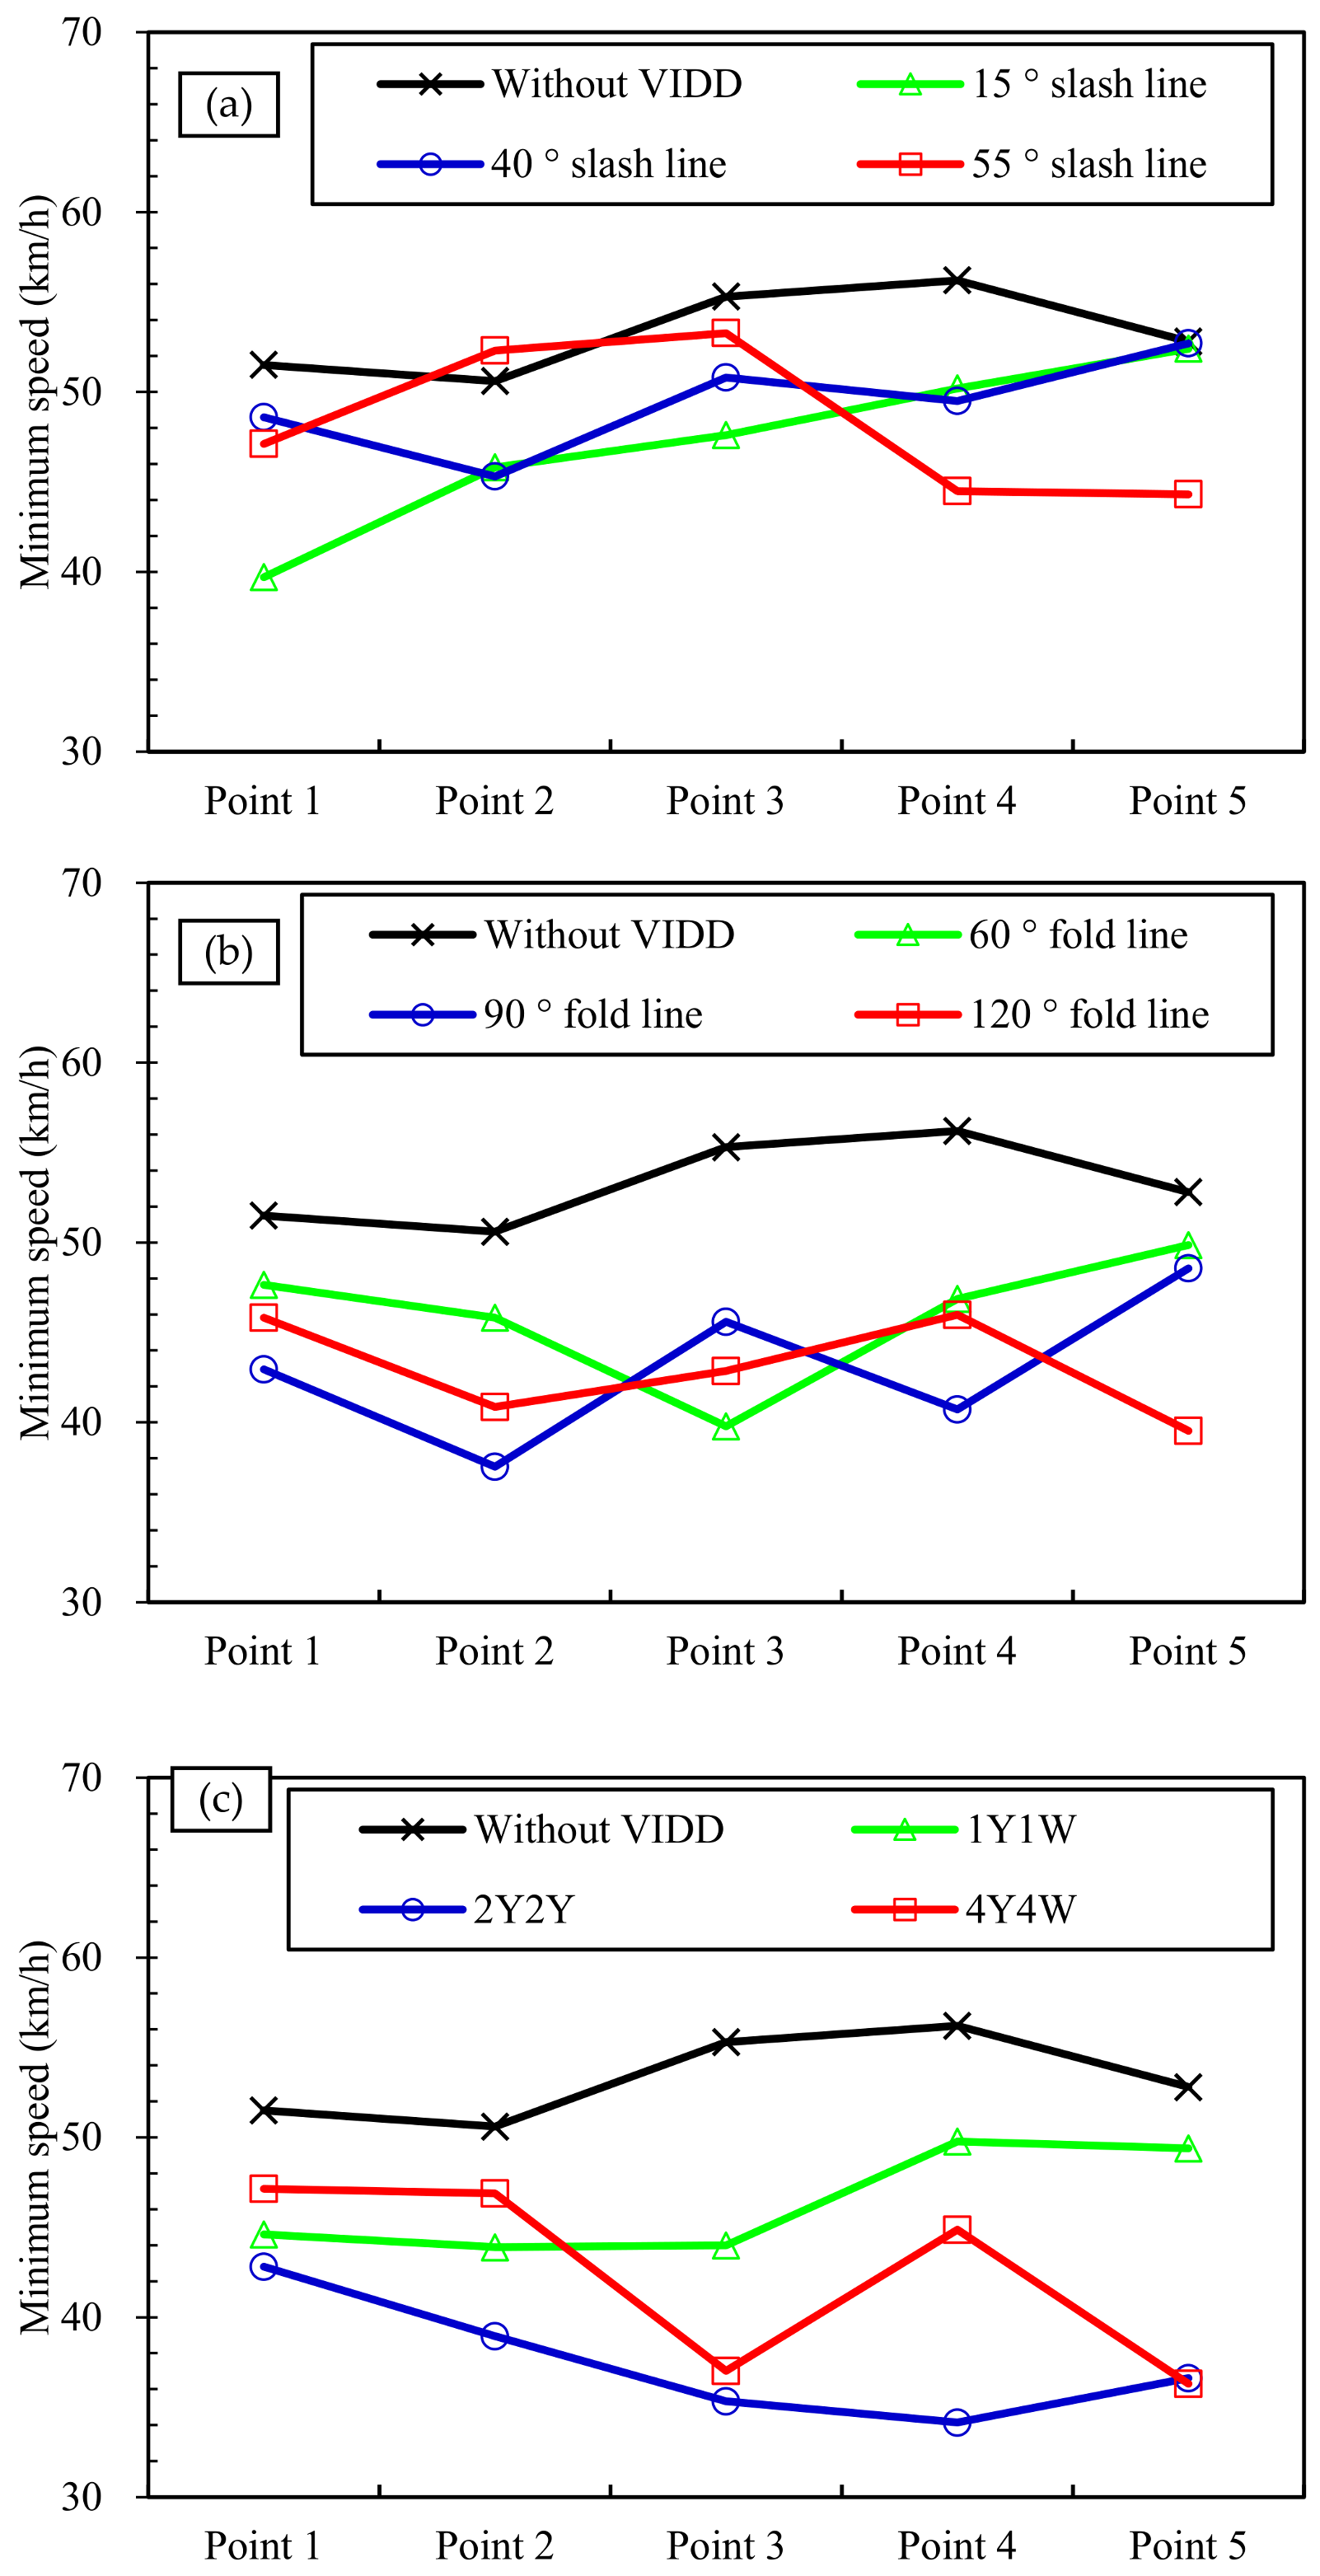
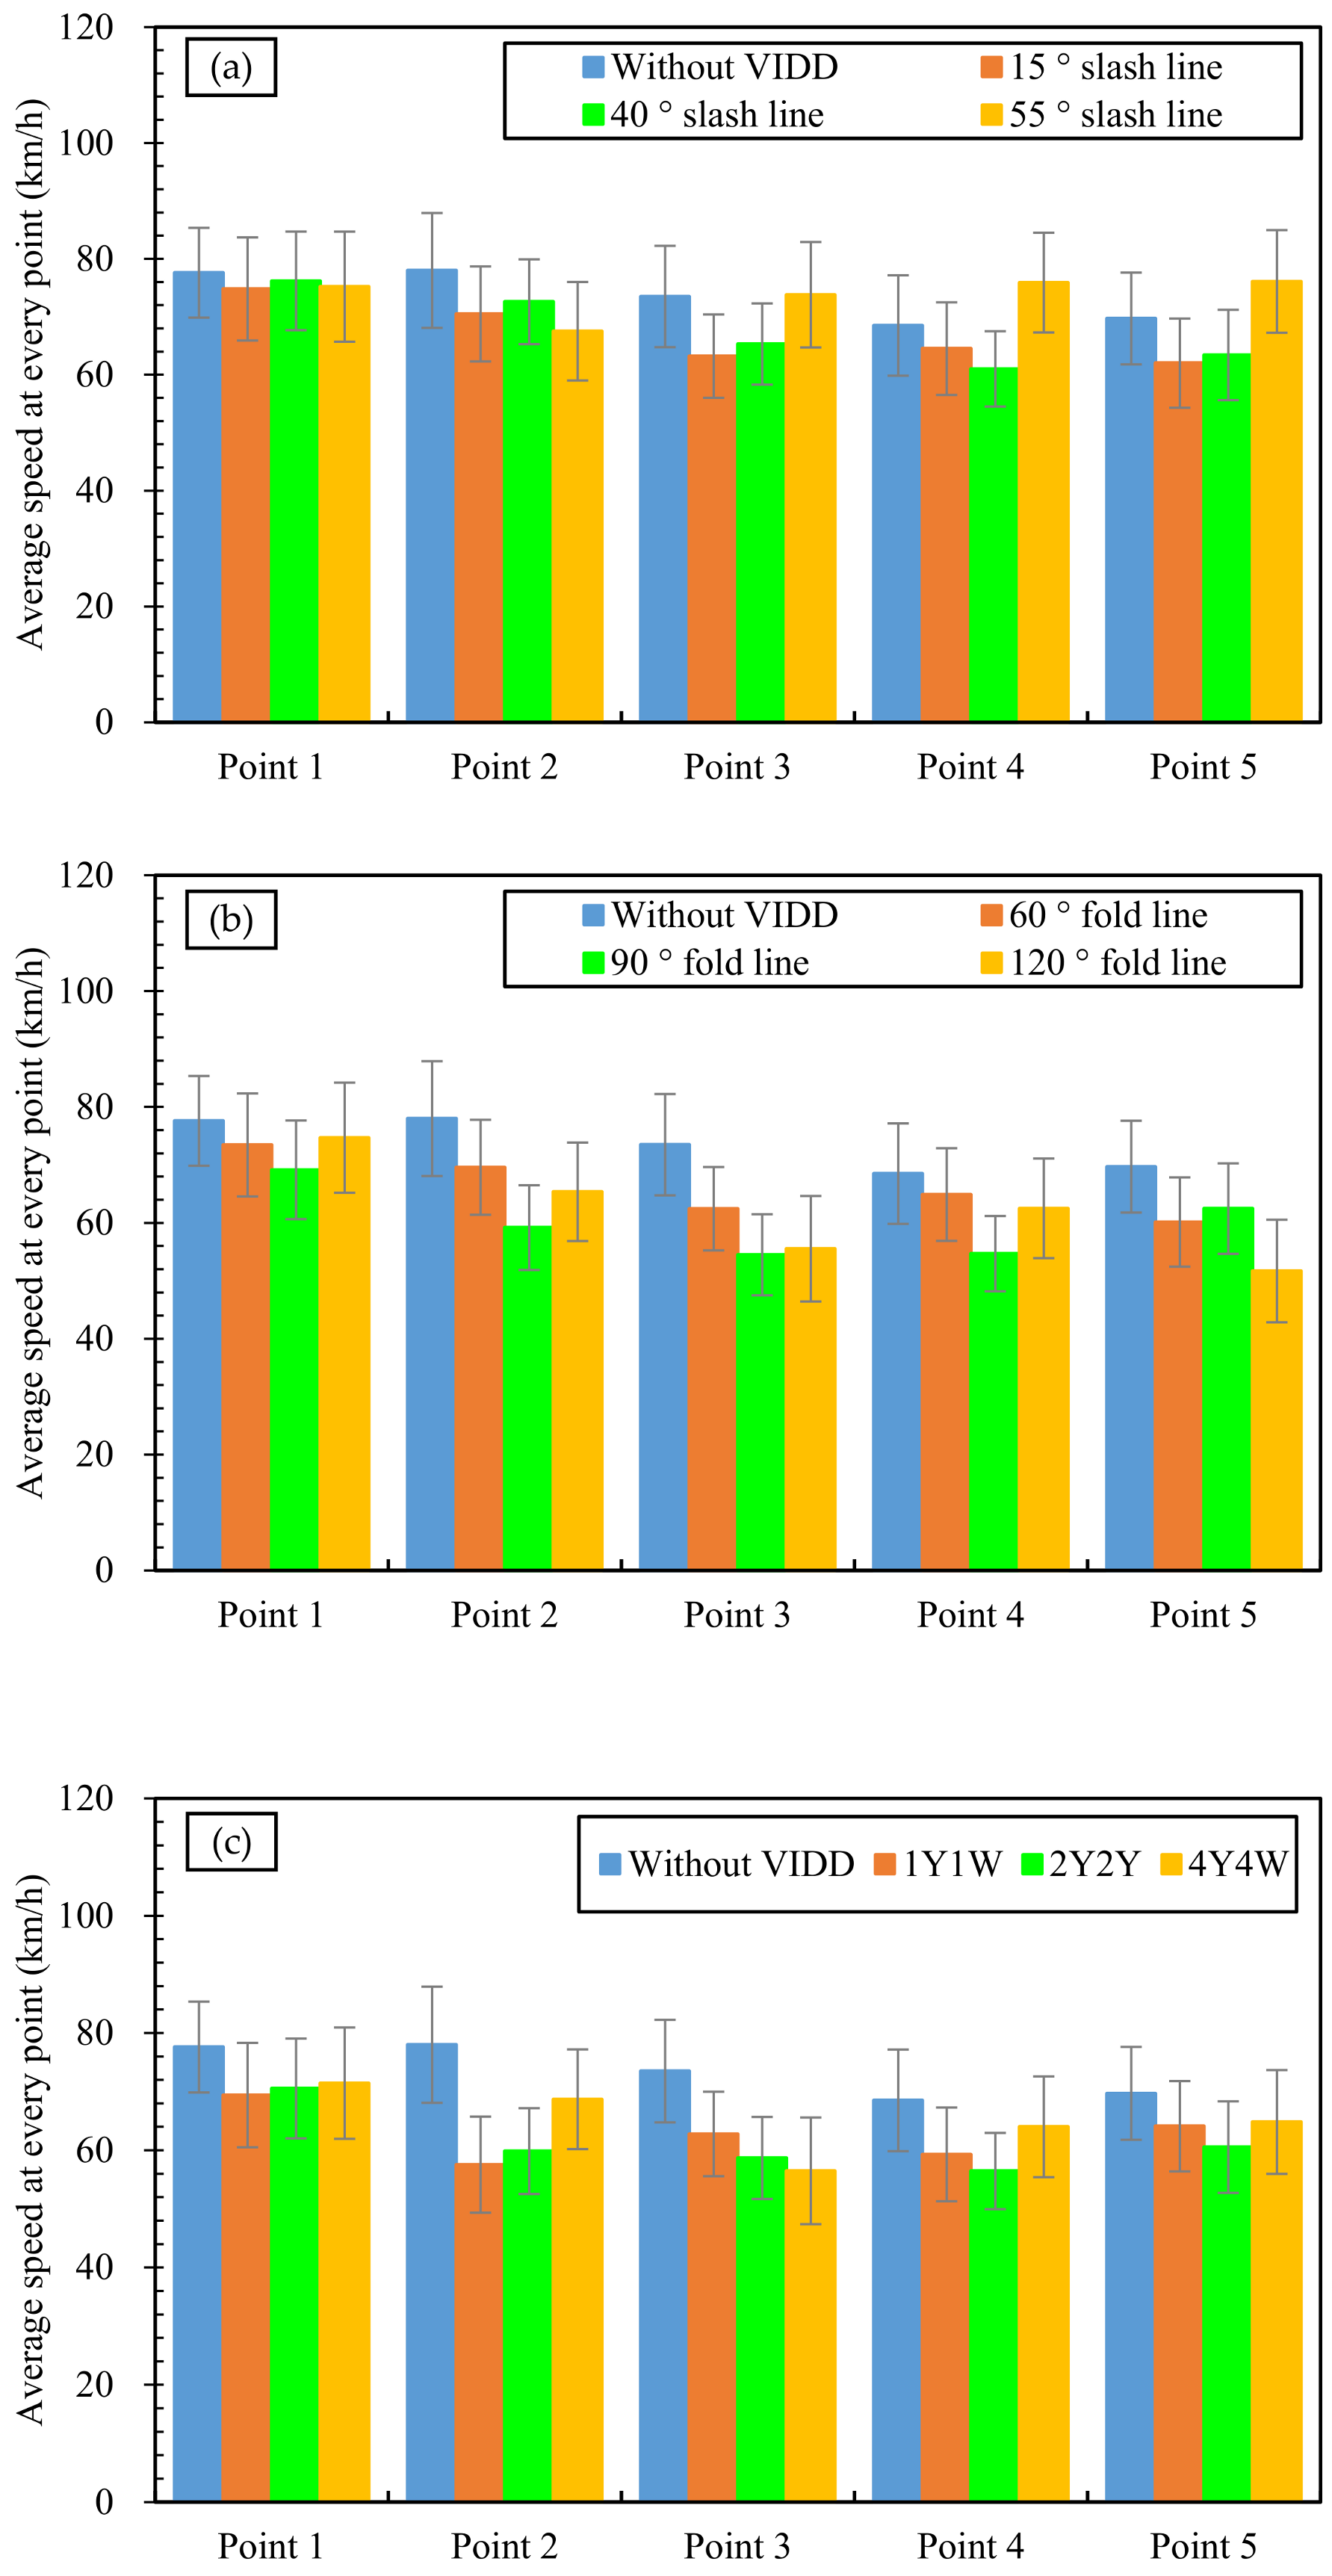
3.2.1. Effect on Vehicle Speeds at Different Observation Points

The maximum and minimum speeds of vehicles controlled by different types of VIDD are shown in Figure 14 and Figure 15, respectively. Figure 14 shows that the slash-type VIDD had no obvious effect on the maximum vehicle speeds in the middle of the tunnel, especially for the 15° and 40° slash lines; the maximum vehicle speeds were almost the same as those without the VIDD. For the fold-line VIDD, 90° fold lines decreased the maximum vehicle speeds significantly from point 2 to point 5. However, the 60° and 120° fold lines actually increased the maximum vehicle speeds, which shows that these two types of VIDD are not suitable for controlling the maximum vehicle speeds in the middle of the tunnel. For the alternating yellow and white VIDD, all three types generally reduced the maximum vehicle speeds, with the 4Y4W VIDD decreasing the maximum vehicle speeds at all observation points. Comparison shows that the 90° fold lines reduced the maximum vehicle speeds by more than did the 4Y4W VIDD.
From Figure 15, each type of VIDD resulted in some decrease in the minimum vehicle speeds in the middle of the tunnel. This is not what we expected, and speeds that are too low may cause a large difference between the maximum and minimum speeds of vehicles, as well as decrease the efficiency of vehicles passing through the tunnel. However, with the 90° fold-line VIDD, the vehicles tended to accelerate and recover their speed from point 4 to point 5.
The differences between the maximum and minimum vehicle speeds with and without a VIDD are given in Table 2. The smaller the difference between the maximum and minimum vehicle speeds, the better the traffic safety in the tunnel. Table 2 shows that the difference between the maximum and minimum vehicle speeds with no VIDD was 47.8 km/h. Among these nine types of VIDD, only the differences between the maximum and minimum speeds of vehicles controlled by the 90° fold-line and 4Y4W types of VIDD are smaller than that of vehicles with no VIDD, these being reduced by 3.6 and 0.8 km/h, respectively. Therefore, the 90° fold-line and 4Y4W types can decrease the dispersion of the vehicle speeds.
The average speeds of vehicles at every point controlled by different types of VIDD are shown in Figure 16. As can be seen, almost all of the average speeds of vehicles controlled by these nine types of VIDD are smaller than that of vehicles with no VIDD, and this tendency shows that a VIDD acts to reduce the speeds, although it can, on occasion, increase the maximum speeds somewhat. Except for the 55° slash-line type of VIDD, all the other types resulted in decreased standard deviation of speeds at every point, indicating enhanced driving stability.

3.2.2. Effect on Average Vehicle Speed

The average speeds and standard deviations of vehicles in the middle of the tunnel controlled by different types of VIDD are shown in Figure 17, and the results can be used to analyze the speed-controlling performance of the latter quantitatively. From Figure 17, except for the 55° slash-line VIDD, all the other types decreased the average speed and standard deviation in the middle of the tunnel. With the 90° fold-line VIDD, the average speed and standard deviation were 18.35% and 24.8% lower, respectively, than those with no VIDD, meaning that this type offers the best deceleration effect.

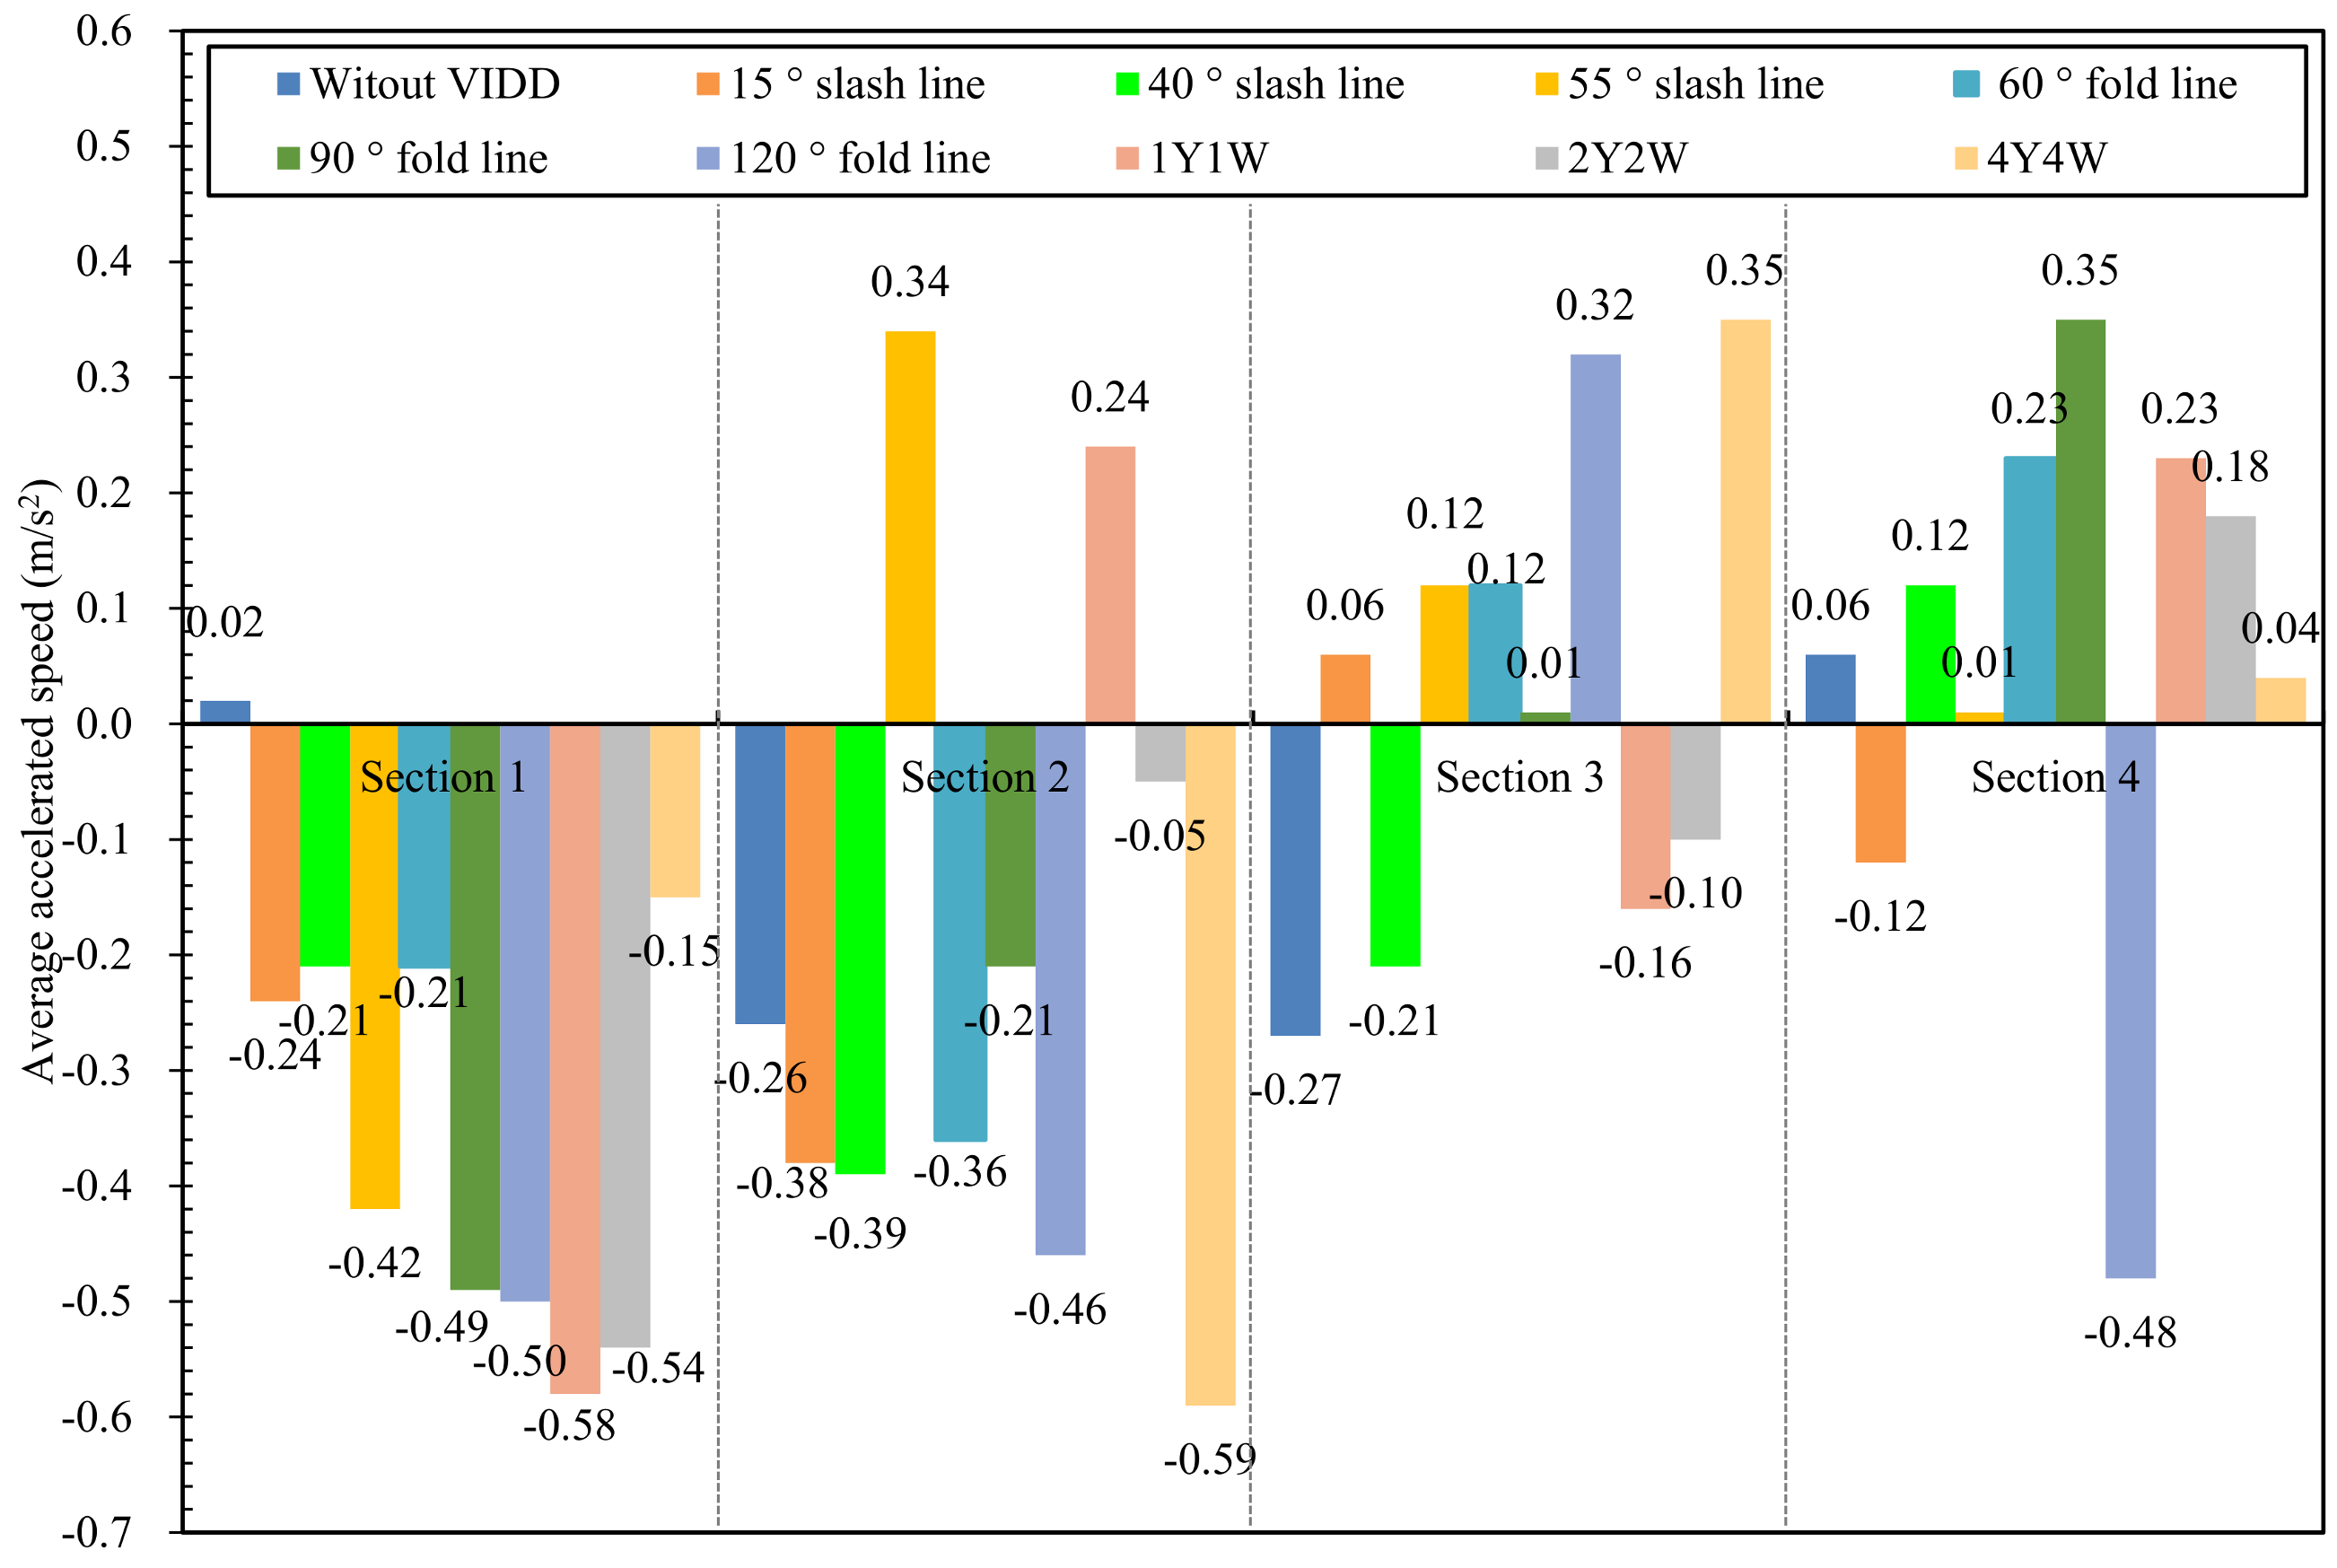
3.2.3. Effect on Average Vehicle Acceleration

The average vehicle accelerations in the middle of the tunnel are shown in Figure 18. In Sections 2 and 3, the 40° slash-line VIDD gave the most obvious deceleration effect, with average vehicle accelerations of −0.39 and −0.21 m/s2, respectively. However, the average vehicle accelerations with the 55° slash-line VIDD were positive in those two sections, exhibiting continuous acceleration. In the whole experimental section, the most obvious deceleration behavior was given by the 1Y1W and 4Y4W VIDDs; the vehicles speeds in Sections 1 and 2 decreased the most quickly, where the average accelerations were −0.58 and −0.59 m/s2, respectively. In Sections 3 and 4, the 90° fold-line and 4Y4W VIDDS gave obvious acceleration characteristics.
Each VIDD on the side wall of the tunnel had a different influence on driving behavior, but the overall performance was to reduce the average speed and standard deviation of vehicles in the middle of tunnel. Among them, the 90° fold-line VIDD had the most significant effect on reducing the average speed, as well as on the standard deviation of speed. Compared with the vehicles with no VIDD, the average and standard deviation of vehicle speeds with the 90° fold-line VIDD decreased by 18.3% and 24.8%, respectively.
With no VIDD, when vehicles passed from Section 1 to Section 5, the speed and standard deviation showed no apparent change, and the driving state of vehicles was basically unchanged. However, after setting a VIDD, the average speed and standard deviation at each observation point decreased initially and then increased. The reason for this is that the visual intervention of the VIDD tends to cause drivers to overestimate the vehicle speed and then take measures to decelerate. The impact of a VIDD on drivers disappears when they have passed it, so that the vehicle speeds recover. A VIDD influences the drivers’ visual frame of reference and can effectively reduce the average speed and its dispersion of vehicles in the middle of the tunnel, thereby reducing the accident rate and improving traffic safety.

4. Conclusions

The main points for decreasing the number of traffic accidents in a tunnel are to control the vehicle speeds and reduce their dispersion. Two visual active deceleration devices with different parameter settings were applied in a long downhill tunnel, and the following conclusions are drawn.
Using 30 m, 60 m, and 120 m RPIDLs increased the minimum speeds of vehicles near the tunnel entrance. Meanwhile, the 30 m RPIDLs had no obvious effect on the maximum speed of vehicles, and the 120 m RPIDLs even increased the highest maximum speed. The 60 m RPIDLs reduced the average speed and had the most obvious deceleration effect. It reduced the maximum speed, increased the minimum speed, and minimized the average standard deviation of the speed, which means that they can improve traffic safety in the tunnel while not lessening the capacity therein.
All the RPIDLs affected the behavior of drivers and caused them to decelerate. Comparison showed that the 60 m RPIDLs gave the most obvious deceleration effect, with the average speed and standard deviation decreasing by 7.0% and 11.1%, respectively. The 60 m RPIDLs had the best deceleration effect on vehicles near the tunnel entrance.
The slash-line VIDD had no obvious effect on the maximum speeds of vehicles. The 90° fold-line VIDD decreased the maximum vehicle speeds significantly, but the 60° and 120° fold-line VIDDs actually increased them, which shows that the latter two types of VIDD are unsuitable for controlling the maximum speeds of vehicles in the middle of the tunnel. The 4Y4W VIDD decreased the maximum vehicle speeds, but comparison showed that the 90° fold-line VIDD reduced the maximum vehicle speeds by more than did the 4Y4W VIDD.
Placing a VIDD on the side wall can reduce the average speed and its standard deviation of vehicles in the middle of the tunnel. The 90° fold-line VIDD had the most significant effect on reducing both the average speed and its standard deviation.
With the RPIDL and VIDD vision-based active deceleration devices, the average speed and speed dispersions of vehicles are controlled effectively. The 60 m RPIDLs and the 90° fold-line VIDD have the best deceleration effect on vehicles near the entrance and in the middle of the tunnel, respectively, and they can control the average speed and its dispersion effectively.

Author Contributions

F.W. conceived, designed, and performed the experiments, analyzed the data. D.G. performed the experiments, analyzed the data, prepared the published work and wrote the manuscript of this paper. Y.L. prepared the published work, translated and reviewed the paper. W.L. performed the experiment and reviewed the paper. G.W. performed the experiment and reviewed the paper. N.D. conceived and formulated the experiments, prepared the published work and reviewed the paper. All authors have read and agreed to the published version of the manuscript.

Funding

The authors acknowledge the financial support received from the Hebei Provincial Department of Transportation, China (No. (2018) 409# 201816); the Plan of Outstanding Young and Middle-aged Scientific and Technological Innovation Team in Universities of Hubei Province [Project No. T2020010].

Data Availability Statement

If necessary, the data covered in this article are available from the corresponding author.

Conflicts of Interest

The authors declare no conflict of interest.

References

  1. Helai, H.; Qizhang, L.; Yunying, P.; Jie, W.; Xiang, L.; Chi, Z. Risk evaluation for hazardous chemicals transportation at mountainous freeway with tunnels groups. J. Cent. South Univ. 2018, 49, 2107–2117. [Google Scholar]
  2. Wan, H.; Du, Z.; Yan, Q. The speed control effect of highway tunnel sidewall markings based on color and temporal frequency. J. Adv. Transp. 2016, 50, 1352–1365. [Google Scholar] [CrossRef]
  3. Schroter, H.G. Research on daytime lighting of tunnel entrances. Lighting Res. Technol. 1977, 9, 194–208. [Google Scholar] [CrossRef]
  4. Amundsen, F.; Ranes, G. Studies on traffic accidents in Norwegian road tunnels. Tunn. Undergr. Space Technol. 2000, 15, 3–11. [Google Scholar] [CrossRef]
  5. Du, Z.; Huang, F.; Ran, B.; Pan, X. Safety Evaluation of Illuminance Transition at Highway Tunnel Portals on Basis of Visual Load. Transp. Res. Rec. J. Transp. Res. Board 2014, 2458, 1–7. [Google Scholar] [CrossRef]
  6. Hirakawa, S.; Karasawa, Y.; Funaki, T. Visibility Evaluation of Expressway-Tunnel Lighting in Consideration of Vehicle Headlights. Electr. Eng. Jpn. 2015, 193, 1–9. [Google Scholar] [CrossRef]
  7. Yong-Zhao, Q.U.; Bei-Ping, X.U.; Liang, J. Traffic Characteristics of The Driver Heart Rate in Han Highway Tunnels. Traffic Transp. 2011, 1, 158–160. [Google Scholar]
  8. Caliendo, C.; De Guglielmo, M.L. Accident Rates in Road Tunnels and Social Cost Evaluation. Procedia Soc. Behav. Sci. 2012, 53, 166–177. [Google Scholar] [CrossRef] [Green Version]
  9. Bassan, S. Overview of traffic safety aspects and design in road tunnels. Iatss Res. 2016, 40, 35–46. [Google Scholar] [CrossRef] [Green Version]
  10. Cornelia, N. Comparative Analysis of Safety in Tunnels. In Proceedings of the Young Researchers Seminar, Brno, Czech Republic, 28–30 May 2007. [Google Scholar]
  11. Kaabi, A.A.; Dissanayake, D.; Bird, R. Response time of highway traffic accidents in Abu Dhabi: Investigation with hazard-based duration models. Transp. Res. Rec. 2012, 2278, 95–103. [Google Scholar] [CrossRef]
  12. Walu, K.J.; Olszewski, Z. Analysis Of Tire-road Contact Under Winter Conditions. Lect. Notes Eng. Comput. Sci. 2011, 2192, 2381–2384. [Google Scholar]
  13. Polasik, J.; Walu, K.J. Comparative Analysis of the Roughness of Asphalt and Concrete Surface; Springer: Berlin/Heidelberg, Germany, 2014. [Google Scholar]
  14. Aarts, L.T.; Van Schagen, I. Driving speed and the risk of road crashes: A review. Accid. Anal. Prev. 2006, 38, 215–224. [Google Scholar] [CrossRef] [PubMed]
  15. Gargoum, S.A.; El-Basyouny, K. Exploring the association between speed and safety: A path analysis approach. Accid Anal Prev 2016, 93, 32–40. [Google Scholar] [CrossRef] [PubMed]
  16. Bowie, N.; Walz, M. Data analysis of the speed-related crash issue. Auto Traffic Saf. 1994, 1, 31–38. [Google Scholar]
  17. Shao, M.; Xie, C.; Sun, L.; Wan, X.; Chen, Z. Left-Side On-Ramp Metering for Improving Safety and Efficiency in Underground Expressway Systems. Sustainability 2019, 11, 3247. [Google Scholar] [CrossRef] [Green Version]
  18. Patten, C.; Mårdh, S. Interior tunnel design and traffic safety aspects. In Proceedings of the 16th international conference, Beijing, China, 15–17 May 2013. [Google Scholar]
  19. Huang, Y.Y.; Menozzi, M. Evaluation of Risky Driving Performance in Lighting Transition Zones Near Tunnel Portals. In Proceedings of the Institute of Industrial Engineers Asian Conference 2013; Springer: Berlin/Heidelberg, Germany, 2013. [Google Scholar]
  20. He, S.; Bo, L.; Pan, G.; Feng, W.; Cui, L. Influence of dynamic highway tunnel lighting environment on driving safety based on eye movement parameters of the driver. Tunn. Undergr. Space Technol. 2017, 67, 52–60. [Google Scholar] [CrossRef]
  21. Ran, L. Study on Entrance Lighting and Traffic Safety of Expressway Tunnel. In Proceedings of the International Conference on Machinery, 2017 2nd International Conference on Machinery, Electronics and Control Simulation (MECS 2017), Taiyuan, China, 24–25 June 2017. [Google Scholar]
  22. Kircher, K.; Lundkvist, S.O. The influence of lighting, wall colour and inattention on traffic safety in tunnels: A simulator study. Tillämpad Psykologi. 2011. Available online: http://citeseerx.ist.psu.edu/viewdoc/download;jsessionid=7BDF5482844F85A783D9644E5DDD8AE6?doi=10.1.1.452.6630&rep=rep1&type=pdf (accessed on 1 July 2021).
  23. Kim, J.; Lee, S.; Hong, J.; Lim, J.; Song, B.K.; Kim, W. A Study on Influences of Long Tunnel Landscape Images on Driver Response through Virtual Driving Experiment. Proc. East. Asia Soc. Transp. Stud. 2012, 2011, 153–160. [Google Scholar]
  24. Shi, X.H.; Zhi-Gang, D.U.; Zheng, Z.J.; Chao-Zhong, W.U.; Transportation, S.O. Optimization of Optical Illusion Deceleration Markings in Middle of Highway Tunnel. J. Highw. Transp. Res. Dev. 2016, 33, 89–96. [Google Scholar]
  25. Wan, H.; Du, Z.; Ran, B.; Wang, M. Speed Control Method for Highway Tunnel Safety Based on Visual Illusion. Transp. Res. Rec. J. Transp. Res. Board 2015, 2485, 1–7. [Google Scholar] [CrossRef]
  26. Zheng, Z.; Du, Z.; Yan, Q.; Xiang, Q.; Chen, G. The impact of rhythm-based visual reference system in long highway tunnels. Saf. Sci. 2017, 95, 75–82. [Google Scholar] [CrossRef]
  27. Jia, X.; Li, M.; Jin, L. Study on Effects of Safety Facilities on driver’s Speed Perception and Concentration in Expressway Tunnel. J. Residuals Sci. Technol. 2016, 13, 139.1–139.5. [Google Scholar]
  28. Nd, A.; Sz, B.; Hong, W.B.; Nj, C. Effects of reverse linear perspective of transverse line markings on car-following headway: A naturalistic driving study. Saf. Sci. 2019, 119, 50–57. [Google Scholar]
  29. Elvik, R. Speed and Road Safety—New Models. Transp. Res. Rec. J. Transp. Res. Board 2014, 1908, 59–69. [Google Scholar] [CrossRef]
  30. Elvik, R. A re-parameterisation of the Power Model of the relationship between the speed of traffic and the number of accidents and accident victims. Accid. Anal. Prev. 2013, 50, 854–860. [Google Scholar] [CrossRef] [PubMed] [Green Version]
  31. Feldman, M.; Manzi, J.G.; Mitman, M.F. Empirical Bayesian Evaluation of Safety Effects of High-Visibility School (Yellow) Crosswalks in San Francisco, California. Transp. Res. Rec. 2018, 2198, 8–14. [Google Scholar] [CrossRef]
  32. Derry, J.D.; Afukaar, F.K.; Donkor, P.; Mock, C. Study of Vehicle Speeds on a Major Highway in Ghana: Implication for monitoring and control. Traffic Inj. Prev. 2007, 8, 142–146. [Google Scholar] [CrossRef]
Figure 1. Design of reverse-perspective-illusion deceleration lines (RPIDLs) with different group lengths: (a) 30 m; (b) 60 m; (c) 120 m.
Applsci 11 06753 g001
Figure 2. Location of visual-intervention deceleration device (VIDD) on side wall of tunnel.
Applsci 11 06753 g002
Figure 3. Schematics of slash-line VIDD: (a) 15°; (b) 40°; (c) 55°.
Applsci 11 06753 g003
Figure 4. Schematics of fold-line VIDD: (a) 60°; (b) 90°; (c) 120°.
Applsci 11 06753 g004
Figure 5. Schematics of alternating-color VIDD: (a) one yellow then one white (1Y1W); (b) two yellows then two whites (2Y2W); (c) four yellows then four whites (4Y4W).
Applsci 11 06753 g005aApplsci 11 06753 g005b
Figure 6. Photographs of actual RPIDLs and VIDDs: (a) 60 m RPIDLs; (b) 55° slash-line VIDD; (c) 2Y2W VIDD; (d) 60° fold-line VIDD.
Applsci 11 06753 g006
Figure 7. Assessing vehicle speeds controlled by RPIDLs.
Applsci 11 06753 g007
Figure 8. Assessing vehicle speeds controlled by VIDD.
Applsci 11 06753 g008
Figure 9. Maximum speeds of vehicles controlled by RPIDLs with different group lengths.
Applsci 11 06753 g009
Figure 10. Minimum speeds of vehicles controlled by RPIDLs with different group lengths.
Applsci 11 06753 g010
Figure 11. Average speeds of vehicle controlled by RPIDLs with different group lengths: (a) no RPIDLs; (b) 30 m; (c) 60 m; (d) 120 m.
Applsci 11 06753 g011
Figure 12. Average speeds and standard deviations of vehicles near tunnel entrance with and without RPIDLs.
Applsci 11 06753 g012
Figure 13. Average accelerations of vehicles near tunnel entrance with and without RPIDLs.
Applsci 11 06753 g013
Figure 14. Maximum speeds of vehicles controlled by VIDD: (a) slash lines; (b) fold lines; (c) alternating yellow and white lines.
Applsci 11 06753 g014
Figure 15. Minimum speeds of vehicles controlled by VIDD: (a) slash lines; (b) fold lines; (c) alternating yellow and white lines.
Applsci 11 06753 g015
Figure 16. Average speeds at every point for vehicles controlled by different types of VIDD: (a) slash lines; (b) fold lines; (c) alternating yellow and white lines.
Applsci 11 06753 g016
Figure 17. Average speeds and standard deviations of vehicles in middle of tunnel with and without VIDD.
Applsci 11 06753 g017
Figure 18. Average acceleration of vehicles in middle of tunnel with and without VIDD.
Applsci 11 06753 g018
Table 1. Difference between maximum and minimum vehicle speeds with and without RPIDLs.
RPIDL LengthNo RPIDLs30 m60 m120 m
Speed difference 66.0 km/h59.2 km/h45.8 km/h79.1 km/h
Table 2. Differences between maximum and minimum speeds of vehicles with VIDDs.
VIDD
Type
NoneSlash LinesFold LinesAlternating Yellow and White Lines
15°40°55°60°90°120°1Y1W2Y2W4Y4W
Speed difference (km/h)47.854.652.358.865.844.261.352.960.547.0
Publisher’s Note: MDPI stays neutral with regard to jurisdictional claims in published maps and institutional affiliations.

