1. Introduction
The main goal of the digital marketing ecosystem is connecting advertisers with users that may be potentially interested in the products or services they advertise. This means serving relevant ads to users to maximize the likelihood of engaging them and lead an interaction from the user with the ad, such as a click that forwards the user to the advertiser’s landing page. It may happen that the user does not interact with the first ad impression it receives, but this does not prevent that the user may interact in subsequent ad impressions. Therefore, ad campaigns are created to impact multiple times (i.e., deliver multiple ad impressions) the same user as long as it matches the targeted audience defined in the campaign. A user could be even reached by hundreds of impressions of the same ad. To prevent this situation, many advertising platforms allow advertisers (or media agencies running ad campaigns on their behalf) to define a maximum threshold, referred to as Frequency Cap (), to the number of impressions a user can receive from an ad campaign. The is a fundamental metric that can heavily impact the cost and performance of an ad campaign.
On the one hand, defining a very low (e.g., ) is very rarely used by advertisers because users do not always interact with the first impression of an ad but with subsequent impressions. Even more, if the user clicks on an ad impression, it is a positive signal that the user is very likely interested in the advertised product/service. Therefore, even if they do not complete a conversion (i.e., purchase, subscription, installation, etc.) in that interaction for whatever reason, they may be persuaded through later ad impressions.
On the other hand, configuring a very high or not using it in an ad campaign implies that the same individual may receive many ad impressions from the same ad campaign. In case that user is not interested in what is being advertised (even though it matches the targeted audience), delivering many ads has at least two potential pernicious effects: (i) the advertiser is wasting its ad campaign budget delivering ads to a user that will neither interact with the ad nor lead to a conversion, and (ii) the user may get annoyed with the continuous repetition of the ad and this may negatively impact the perception of the user in the brand behind the ad.
The concern of the users is shown in the number of ad blockers that the users use [
1,
2]. The studies show that the main two reasons for the users to install the ad blockers are too many ads, ads are annoying, or irrelevant.
Based on this discussion, it seems crucial to define reasonable strategies to set up efficient values for ad campaigns to improve the metric Return On Ad Spend (ROAS). ROAS is one of the key metrics agencies and advertisers use to validate the efficiency of a campaign. Therefore, our paper aims to define efficient values from the advertiser point of view to improve the ROAS. Towards this end, we will use the user click as the key event to be measured in the context of as most conversions in digital marketing imply a user click at some point. By defining appropriate values towards maximizing ROAS, we will also limit the number of impressions from the same advertiser a user will receive, which may be helpful to avoid the second pernicious effect described in the previous paragraph. The rationale behind our solution is to stop sending ad impressions to users based on the number of non-clicked impressions rather than the number of received impressions.
The industry recognizes the importance of using the data as the driver of the digital marketing strategy [
3,
4]. It also recognizes the importance of
to improve the user experience and to increase revenues. In academia, different articles show the relevance of considering the
as part of the digital marketing strategy [
5,
6]. The different marketing stakeholders have documentation where they focus on defining the
[
7,
8,
9] as well as documentation focus on how to implement in each of their platforms [
10,
11,
12,
13]. However, unfortunately, there is still very little research, both in academia and industry, on how to decide the optimal value that maximizes performance and do not annoy the user. One of the paper’s co-authors has been working in the digital marketing sector for six years, and he can confirm that, to the best of his knowledge, there are no systematic data-driven methodologies implemented in the industry to define
values for ad campaigns.
Our work aims to build a robust and reliable methodology to define the number of ads that should be delivered to different users (i.e., ) to optimize marketing budgets, maximize the ROAS, and reduce the possibility that users get annoyed with the brand behind the ads. In addition, the proposed methodology will be validated both using simulations and using large-scale datasets obtained from real ad campaigns data from 5 different companies.
Most of the works in the literature, which directly or indirectly address the optimization of the
, are validated only using simulations but not using data from real ad campaigns. In [
14], the authors study the problem from the ad server point of view running simulations that include strong assumptions regarding the number of advertisers, the demand, the supply, and the
. In particular, this work analyses how the ad server should allocate ad impressions from advertisers when it does not know what will be the future ad impressions to users to maximize its revenue. In [
15], the authors analyze the problem from the point of view of a website (publisher). They develop an algorithm that assumes an accurate prediction of the behaviour of the website users to define an optimal plan for delivering ad impressions to users. In [
16,
17], the authors define a two-stage optimization model for the
problem. They rely on a computational process approach to validate the proposed model. This model proposes an optimal
value that adapts to reducing click-through rate as the number of impressions grows. Finally, the authors of [
18] address the problem from a data privacy perspective. They propose a linear programming model that relies on the current page users are browsing to avoid cross-site cookies. The proposed model is tested in a simulation.
We could only find two works—one academic paper [
19] and one industrial report from Microsoft [
20], where the proposed solution relies on actual advertising datasets. The first work uses Facebook ad data and shows that using large
values is a bad strategy as the probability of gathering a user click quickly decreases with the number of ad impressions delivered to that user. More related to our work, the Microsoft report studies the impact of the
on conversion rates for different companies. They conclude that the conversion rate on the first impression usually was the highest, and the first three impressions all had at least 100% conversion rate lift on average. Then, the most efficient frequency (best conversion rate) is not the most profitable (better cost per conversion). Finally, they found that it is difficult to apply a standard
across advertisers, but defining an optimal
requires analyzing each advertiser’s data and campaign strategies.
Our research differs from most of the previously described works because we validate our model using real datasets from ad campaigns beyond using simulations. In addition, our work focuses on improving the efficiency of to benefit the customers (advertisers) and product (users) of the AdTech ecosystem, rather than focusing on publishers or Ad Exchanges. Finally, the work of Microsoft is the most related one to our article. However, they do not provide any theoretical framework to optimize the but simply conclude that you require a specific analysis per advertiser, which is precisely what our framework offers. Our work is more ambitious, and we provide a framework that can be implemented in real settings to configure efficient values. Finally, our solution is the only one that allows integrating a critical metric such as the ROAS as an indicator to measure the performance of a given value. In other words, our work proves that it is feasible to address the optimization as a business problem so that the value proposed by our solution is better than the traditional one.
2. Background
Digital advertising spending worldwide stood at an estimated 378 billion U.S. dollars in 2020. This figure is forecast to increase in the coming years. All of this investment in digital marketing is activated using different marketing channels. Where the digital marketing channels are defined as the different online means, an advertiser/agency can use to show their ads. The most common channels used in digital marketing are Paid Search, Display, Paid Social, Affiliation, and Email. Each one of these channels can be used in combination with the others.
The concept of digital marketing has evolved over the years. It has gone from just being a means to market the business to a way to engage with the audience. The concept of digital marketing has evolved so much that it has gone past online marketing and become a generic term for marketing any product or service in the digital world, for instance, on programmatic TV or IoT devices. Digital marketing is now a part of everyone’s business and marketing strategy.
A company’s marketing strategy is at the high level defined by its media investment plan, which is determined by its marketing goals. The marketing plan includes the marketing budget allocation, the goal of the communications effort, and the campaigns to achieve the goals. The marketing plan specifies the criteria for measuring the success of the communication campaigns and what the communication campaigns should achieve.
These investment plans involve matters as, for example, the creativity used, what are the audiences that should be targeted, or the discount values that should be included. Another critical but less studied aspect is limiting user exposure to an ad—displaying the same ad to a user multiple times is a common practice, but it is not a good one. There is evidence showing that users can get annoyed by the same ad and block it. Therefore, showing the same ad multiple times to a user diminishes value to the advertiser as the incremental benefit from repeatedly displaying the same ad to a user is likely to be minor, if any.
The notion of limiting the number of times a user is exposed to an ad is called frequency capping. prevents ads from being displayed repeatedly to where visitors are overexposed and response drops. Serving frequency capped ads is a genuine requirement to maximize the value delivered to advertisers, particularly in the pay-per-impression arrangement of the display advertising marketplace. This is recognized by several publishers and ad networks (for instance, RightMedia, Google, and Yahoo!) who offer for their display advertisers.
Selecting a constraint poses a challenge to the marketing planner since the supply of users, impressions, or responses to the ads are unknown in advance. However, the marketing planner needs to address how to allocate the advertising budget to maximize the advertising value. The highly affects the campaign performance because a too big could mean a waste of the campaign budget in uninterested users while not reaching other interested users. However, having too low could mean losing interested users and not spending the campaign budget.
The problem can be further complicated by the fact that the advertising value of the same user can vary widely, which means the campaign budget allocation should take the value of the user into account. Therefore, it is necessary to investigate the problem from a value-based perspective. We need to find the optimum allocation of the campaign budget to maximize the expected value of the campaign.
In these times, thanks to internet accessibility and platforms such as Google or Facebook that encourage small companies to activate campaigns, competition is increasing, and it is essential that those who participate make an effort to optimize their investments and online positioning. Defining good marketing strategies is no longer enough, and companies need to differentiate themselves to gain market share. Faced with this situation, finding the right for each business can make a difference. Those who are capable of optimizing the number of impacts, and therefore making each euro invested more efficient, will reach more potential clients and not only be able to increase their business volumes, but will also do so profitably by improving their ROAS.
3. Materials and Methods
This section will focus on understanding the and the elements surrounding it, like the impressions and clicks. The is restraining the number of ads (impressions) sent to the users. Furthermore, the only action that the user can take on an impression is clicking on it. Therefore, to understand the environment for the , we need to comprehend impressions, clicks, and their relation to restraining the number of impressions.
First of all, we will describe how the user is tracked, impacted, and how they click. We will also describe the underlying probabilities that will describe the behaviour of clicks and impressions. Finally, we will show how the
problem could be interpreted as a network problem (
Section 3.1).
Once we understand the behaviour of the impressions and clicks, we will study the effect of different
on these metrics. First, we will perform a theoretically-based analysis only on the previously described relations (
Section 3.2). Furthermore, we will show the effect of
on the expected number of impressions, the chances of getting the first click, the expected number of impressions to reach this first click, and the expected number of clicks.
Once we have the theoretical understanding of the problem, we will use real data, including impressions and clicks events from real ad campaigns belonging to different companies (
Section 3.3). We will use this data to analyze the performance across different
values (
Section 3.4). First, we will study the new impression rate and the click rate, and we will approximate them. Using these approximations, we will show the effect of
on the expected number of impressions, the probability of getting a click, and the expected number of impressions until the first click.
Finally, after understanding how the environment reacts, we are interested in refactoring the problem as a business problem. For this, we will find out how to get from the click ratio to a business metric, i.e., the ROAS (
Section 3.5).
3.1. The Problem
3.1.1. Frequency Capping Environment
In digital marketing, ads are delivered to users. We refer to it as an ad impression to each ad is displayed on the screen of a user. A user may eventually click on the ad. That action will redirect the user to the advertiser webpage, generally known as the landing page. Advertisers and other ad tech players can record that visit and try to impact that user with new ad impressions in the future.
New impressions may be potentially sent to the user forever, while tracking the user unless some action is taken to limit the number of impressions a particular user can receive. It is also important to note that, in some cases, the ad tech players may not be able to track or identify the user again after a click. Some of the reasons for this are as follows:
The user has deleted the cookie that was being used to track him/her.
The user does not come back to the pages that we can track.
The user has activated an ad blocker.
The user stops using the device or browser that we are tracking her on.
We might track him/her, but the impression that will be shown is based on a bidding system, and we might not win the auction to deliver ad impressions to that user.
It seems reasonable to think that if a user has received many impressions from an ad, and he/she has not clicked on it, he/she is probably not interested in whatever that ad is promoting. Therefore, there should be some limitation to the number of ad impressions delivered to a user that will optimize the advertiser KPIs. As the click is the way to access the web page, if our objective is to lead people to the web, then the click will be our KPI. However, even if we are interested in getting web actions, such as purchasing, we will need first to get clicks as people first need to get to the page.
Although we are interested in getting as many clicks as possible, we have to be careful about sending too many impression to the user as we have two main concerns:
The agency and advertiser might be wasting their budget sending many impressions to users who are not interested in the product.
From the user perspective, the extra amount of impressions can be negatively perceived, impacting the brand’s user experience and perception.
As a final note, it is important to emphasize that the user does not choose the impression. While browsing, the user will receive impressions from different companies whether they like it or not. On the other hand, clicking is a user choice. Advertisers and agencies would like users to click as much as possible, but it is out of their control. As the user has complete control over whether he/she clicks or not on a particular ad impression, we will use the users’ clicks as the indicator of the interest/boredom in the ads they receive. Therefore, we will use the clicks as the primary indicator to optimize the number of impressions that should be sent to each user, i.e., the .
3.1.2. Network
A user will receive an ad impression, and he/she decides whether to click or not that ad. After he/she has decided, a new impression may be sent to him/her until the advertiser cannot send more impressions (e.g., ad campaign ends).
As they are ordered in time, this collection of events (impressions and clicks) will define a path for each user. The number of interactions will be an even number because there will always be a click or not click after receiving an impression. As these are always in pairs for describing the user path, we will describe each step as the combination of impression and action taken on it, and we will call it state. Then, each state will be defined as click or not click, and then we will follow to the next or state. As a result, after each state, there are only two possible states that are click or not click. We define a transition as the process of going from one state to the following one.
In terms of notation, we will represent the clicks as 1 and the non-click as 0. To have a complete understanding and simplify the analysis, each state will be represented as the interaction took plus the history of all previous interactions. For instance, if a user receives 5 impressions and clicked only in the third and fifth impression, the representation for the complete path will be 00101. Then, every state will be an ordered collection of interactions. Then, for the transitions, we will have two possibilities that are getting a click o getting a non-click, which in terms of representation implies adding a 1 or adding a 0, respectively. Furthermore, each state will have only one incoming transition and to find out the previous state we only have to remove the last interaction.
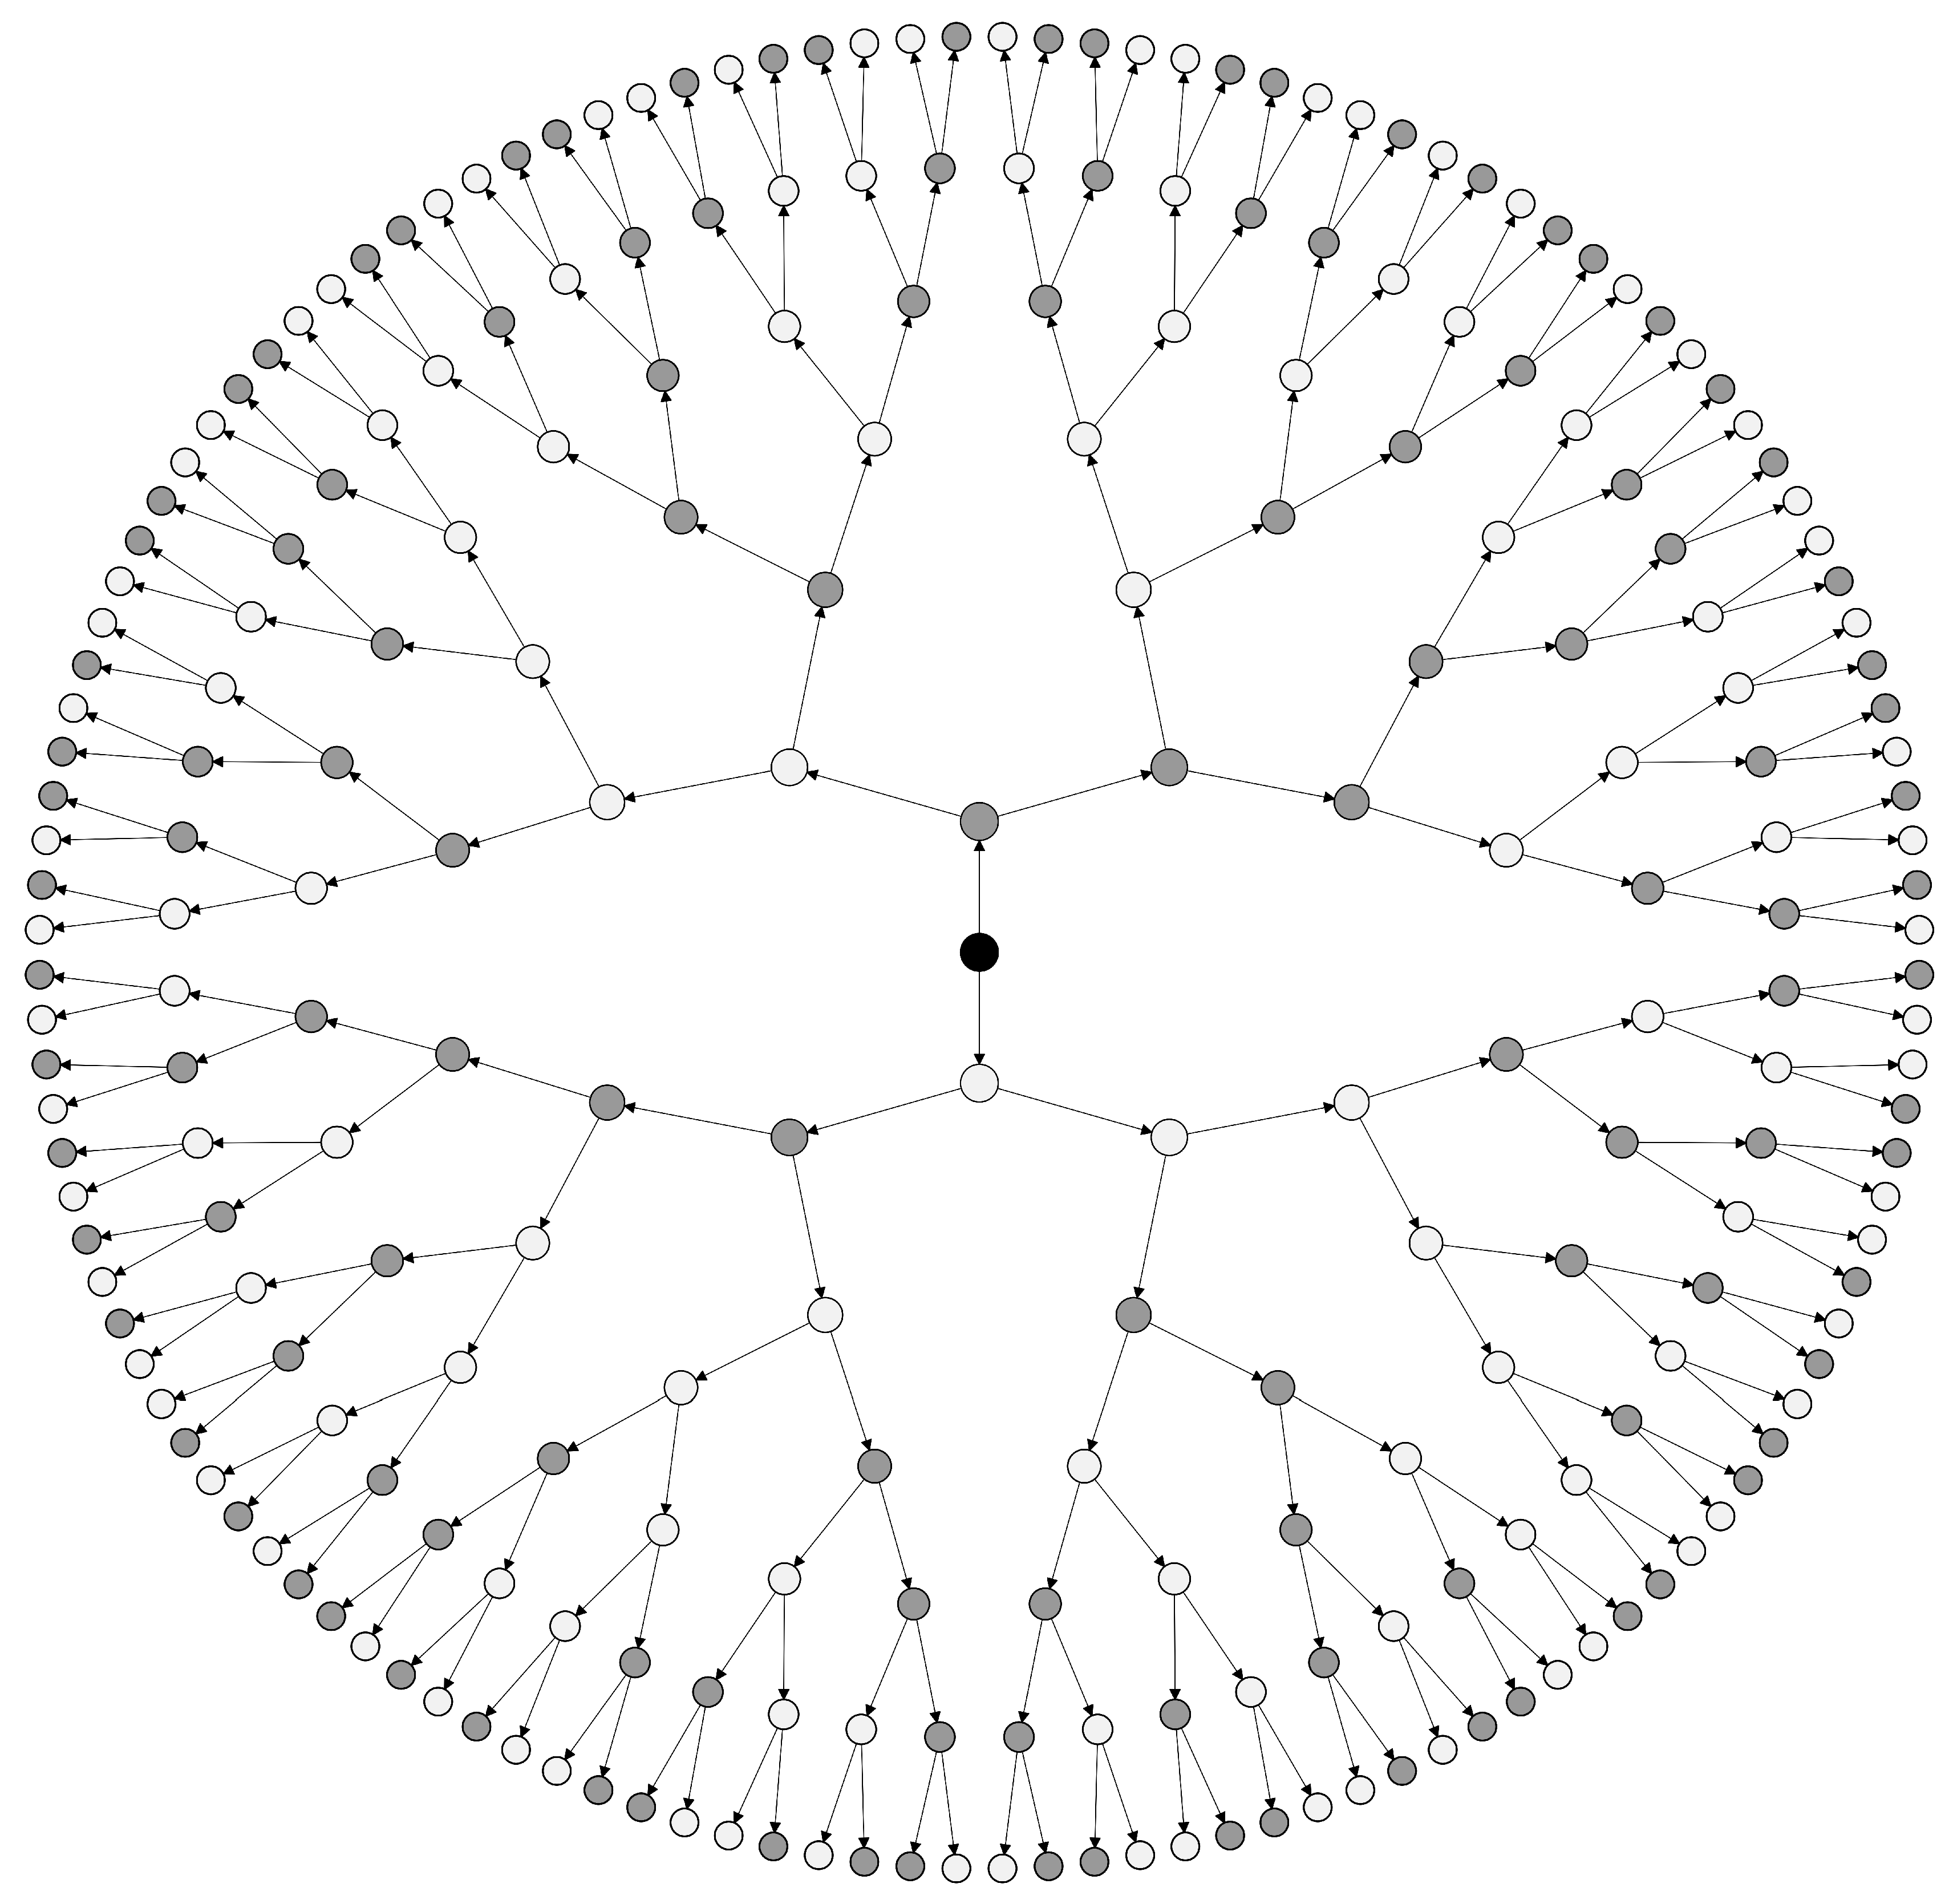
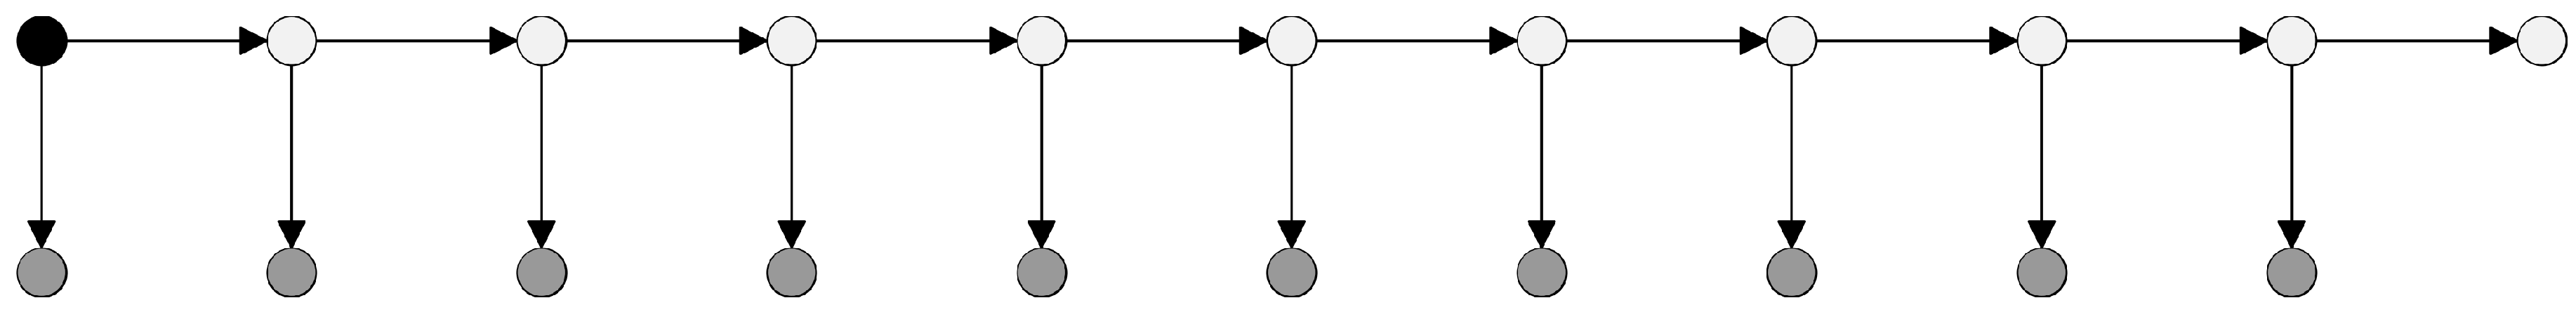
Next, we are interested in studying where to cap this path to optimize the overall performance of the marketing campaigns. To this end, we will study the collection of all possible states and transition. In this case, we have two potential states after a given previous state. This generates a network instead of a path, where each of the states is a node. For completion, we add a root node that is the node of all population before receiving any impression. A representation of this network (up to 7 impressions) can be seen in
Figure 1.
The resulting network is a directed graph where the nodes N will include all the possible states for the users, and E will be the transition probabilities from one state to the next one. This network can be used in our analysis because it easily describes the path users have followed and all the potential paths they may travel in the future. This allows computing the performance of each of the estates, and in turn, identifying the ones that we want to cut and the ones that we want to boost. Furthermore, all the users targeted by an advertiser can be mapped into this network. This means we will be able to know the number of users that are in each of the states. This will allow us to understand the relevance of each of the states and where we have to focus our attention.
3.1.3. Probabilities
The final step for understanding the tackled environment is understanding when a user takes one transition or the other. We cannot have certainty regarding whether a user will click or not in an ad impression. Therefore, we will treat it as a probabilistic problem where each transition will have different probabilities of occurring. To understand the probability, let us remember that the transition is moving to a new state, which consists of receiving a new impression and click. Then, the transition probability is the combination of two probabilities:
Probability of getting a new impression (): This is the probability of getting impacted by a new impression. We remind that users may or may not receive a new impression depending on different considerations previously described.
Probability of clicking (): This is the probability of clicking once a user has received an impression.
With these two probabilities, we can define the probabilities for the transition. The probability of moving to a clicking state is while the chances of moving to a not-clicking state is . In most cases, the probability of getting a new impression () will be lower than 1. Therefore, there will be a probability of of getting stuck in a particular state.
These probabilities will be one of the main elements used through the article, as understanding them means that we can find the optimal values analytically. Note that these probabilities are not the same for each of the transitions, and they will change based on the number of previous impressions and the user’s actions. We will use data gathered from different real ad campaigns with thousands of users to approximate the referred probabilities.
3.2. Theoretical Study
3.2.1. Expected Number of Impressions
In this section, we focus on investigating the probability of getting new impressions. This probability is crucial because it controls the advertiser’s chances of sending a new impression to the user. If this probability is always high, we will be able to send many impressions to the user, while if the probability is small, the user will receive few impressions, and the advertiser may not be able to send him/her more. Note that this probability is out of the advertiser’s control, and it could become even equal to zero. The parameter the advertiser can configure to make this probability equal to 0 (stop sending impressions) is the .
Let us study the most basic possible scenario where we assume that the probability of getting a new impression is constant (). Under this assumption, we will understand the number of impressions that each user is expected to receive.
If we call
X the variable of the number of received impressions. Then,
is the probability of getting
X impression, and we have
using the complementary rule, we find that
by definition, the expected value is
where
are the set of outcomes, occurring with probabilities
, respectively.
Then, in our case, we have that
that is the same as
if we make the substitution, we have that
This is for the case when we do not define any
. In case we want to study this scenario with a
value, we have the following formula:
To illustrate the differences between the two cases we can use a few examples. For instance, in the first example, we assume that the probability of the next impression is very high (
) and we will compare the cases of
,
, and
. For each of these values, we will have an expected number of impressions equal to
As we observe, considering a very high new impression probability of , the number of impressions we expect a user receives is 11 in case the is not used; therefore, most users will not receive a massive number of impressions. Our example also shows that if we use high values such as 45, then the expected number of impressions users receive is almost the same as if we were not setting up the . However, the number of impressions considerably decrease with a .
Let us use another scenario where the probability of new impressions is small (
) and comparing the cases of not having
and
We can see that in this case, the number of expected impressions is so small that a equal to 10 will not restrain the number of impressions that users will receive on average.
3.2.2. Chances of Getting the First Click
We have already elaborated a model to obtain the number of expected impressions. However, as we already described, we are interested in gathering clicks. Therefore, we study the probability of getting the first click from a user. This is relevant because, to get multiple clicks, we need the first one prior and because the first click means that the user has reached the advertiser’s landing page.
We will be working under the assumption that both probabilities have a constant value for all states ( and ). Furthermore, we will consider that both probabilities are independent of each other. Finally, we will analyze the impact of using different values.
We have two different probabilities for the transitions. The first one refers to the transition to a clicked impression (
) and, the remaining one for the non clicked impression (
). The formulas for each of them are
Using these results, we calculate the probability of getting a click for a user. That is, we calculate the probability of reaching any of these states:
If we call
X the variable for getting the first click, then we have that the probability of getting the first click is
Note, this result stands for the case where infinite impressions are sent to the user. Instead, if we assume a scenario that implements a
after
n impressions, the equations are formulated as follows:
We can observe that in this case both probabilities are influential. Let us assume that it is always possible to send new impressions to the user (
). This means that all users always will receive a new impression until we reach the
. In this scenario we have that
With this simple example, we can observe that without a in place and being always able to send impressions to the user, there is the certainty that the user will eventually click. On the other hand, if we have a , the user will not always click. The probability of getting the first click, as expected, is affected by the probability of getting clicks. For instance, if , then event with a capping of 1 we will have a probability of of getting the first click of a user. However, if , then with the probability goes down to .
The previous example assumes that we will always be able to send an impression to the user (), but if we remove this assumption, we can observe that (in terms of getting the first click) a is equivalent to a value depending on the value. For instance, if , not having is equivalent to a (P(X) will be the same for both cases no matter the ). Another example will be that for , not having is equivalent to a .
3.2.3. Expected Impressions until First Click
In the previous section, we have explored the probability of getting the first click and how impact it under the assumption that the next impression can be delivered. Following this, we calculate the expected number of impressions before the first click. This is relevant when choosing to guarantee an advertiser does not miss many clicks for choosing a too small.
For this case we again consider both probabilities as constant ( and ). However, this time, we are interested in understanding the number of impressions required until the user reaches the first click. For this exercise, we will further assume that is not only constant, but that the user will always receive a new impression ().
If we refer to X as the expected number of impressions, then we can formulate as follows:
Therefore, we have that the expected number of impressions is
For instance, based on this result, the number of impressions when is and for is 10. Therefore, should be ideally higher than these values.
3.2.4. Expected Number of Clicks
We have studied the probability of attracting the first click from the user and the number of impressions required to obtain that click. However, as we have mentioned, an advertiser would potentially like to obtain many clicks. Therefore, in this section, we focus on studying the expected number of clicks from each user. As for the previous case, we will consider both probabilities as constant ( and ).
This time we refer to
X as the variable that captures the number of clicks a user will realize out of all the received impressions. In the previous section, we have calculated the probability of the first click that is reaching one of the states
for obtaining two clicks the paths are reaching one of the previous and then adding to the path
. Therefore, we have that
If we apply the formula of the probability to the expected value, we obtain
This previous calculation is for the case of not having a
in place. In the case we set up
, we obtain
Let us use some examples to illustrate the obtained result. For instance, if and , the expected number of clicks is 2 if we do not configure . Instead, for and , the expected numbers of clicks are and , respectively. The results suggests that the value of does not have a big impact on the final number of expected clicks from a user. However, if we use another set up with and , the expected number of clicks for the case when no is established are 380, whereas for and , this number goes down to only and clicks, respectively. For the latter set up, has an important impact. In summary, is especially relevant when we use higher and probabilities.
3.3. Dataset
In this section, we first describe the data source considered in the paper and its associated limitations. Afterwards, we provide details of the specific dataset to be used in this paper.
3.3.1. Data Description
Neo Media World has shared five datasets from five different clients ranging from hotel companies to retail.
The data used in this paper correspond to the data collected through the Google Campaign Manager (formerly known as DoubleClick Campaign Manager or DCM) platform for all advertising campaigns run by a marketing agency on behalf of the referred five different companies.
Google Campaign Manager is the most extensively used platform by marketing agencies. It tracks and measures all paid advertising channels (with few exceptions, for instance, impressions on Facebook) and records the conversion events using floodlights [
21]. The collected information is made available through the data transfer logs [
22].
The datasets from each client contain the following columns: DateTime, UserID, Click, and Impression. Each row is a different interaction; the DateTime column identifies when the interaction happened (up to the resolution of seconds), the UserID identifies the user, and the click and impression columns are booleans that indicate if the interaction is a click or an impression.
The user (or cookie-id)—an anonymized unique identifier [
23], serves as a unique key to merge the information in the three tables and build the associated user path. In particular, we use the DoubleClick tracking ID, which is an anonymized ID. This tracking ID does not expose either the user’s browser cookie or mobile device ID and complied with the data protection regulation in effect at the data collection time. The different interactions can be sequenced using the timestamp of each of them.
The DoubleClick tracking ID may be zeroed for different reasons, e.g., problem in the tracking process, privacy reasons, etc. [
24]. If this happens, it is impossible to know which user has generated that event and, therefore, such touchpoint cannot be incorporated into any user path, creating a gap. As a result, all the rows in the transfer logs with zeroed user-id will be removed for our analysis.
The size of the data shared with us is large enough to extract statistically valid conclusions.
Table 1 shows the number of impressions and interactions that we have for each of the companies datasets.
3.3.2. Data Curation
In order to use the data from the raw dataset, we need first to implement a data curation process. First, we have to remove all events from zeroed users as they avoid building users’ paths, which are not valid for our analysis.
The next step is building the user path. We consider the user path from the first impression up to the last event (click or impression) associated with the user. However, if two consecutive impressions are separated more than seven days apart, we consider the last impression to be part of a new path.
After building the paths for all the users, we have to retrieve which impressions have received a click. Note that if the same ad impression receives multiple clicks from a user, we consider it as a clicked impression as it had received a single click. Once we have labeled all the impressions as clicked or not clicked, we will include this information in the user path.
At this moment, we build the states the user travels for each impression and the subsequent ones in the path. We can aggregate all the information to retrieve how many users in our dataset have stayed in each of the possible states.
We implement a final step to simplify the complexity of the analysis. We calculate the number of users in the previous state and those who have received an impression for each state. With that information, we compute the following ratios: the probability of transition from the previous node to this one, probability of clicking in after receiving an impression from the previous state, and probability of receiving an impression from the previous state.
3.3.3. Final Dataset
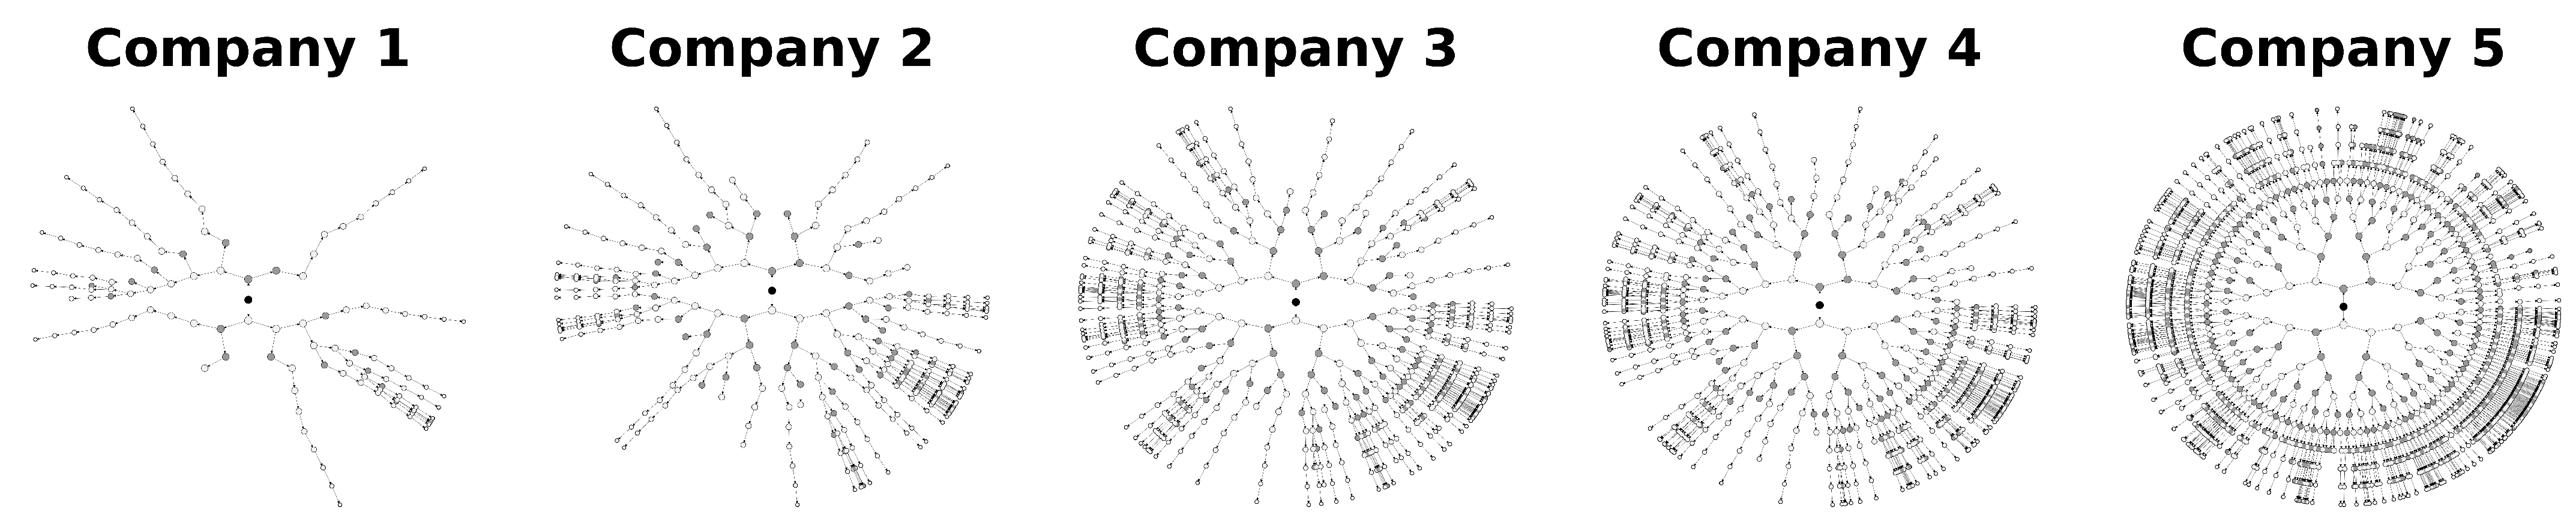
In
Figure 1, we showed the complete graph for all possible states that can exist. However, that is a theoretical model. Network graphs for real scenarios are a subgraph of that complete graph.
Figure 2 depicts for each of the 5 companies dataset considered in our study the graph for the states with more than 100 users and less than 12 interactions for each client.
3.3.4. Data Availability
Our study is based on third party data from Neo Media World (
https://neomediaworld.com/, accessed on 20 June 2021), which has its own regulations for data sharing. We accepted those regulations that, due to privacy and business reasons, do not allow sharing the raw data publicly. However, the processed anonymous dataset used for our analysis can be shared under request as long it is used for research purposes.
3.4. Analysis Based on Real Datasets
3.4.1. New Impression Rate
In
Section 3.2, we focused on executing a theoretical analysis of the impact of
. For this analysis, we used fixed values for the probabilities of getting new impressions. This section will study the probability of sending a new impression to a user based on the real data. For this purpose, we will use data from the five different companies.
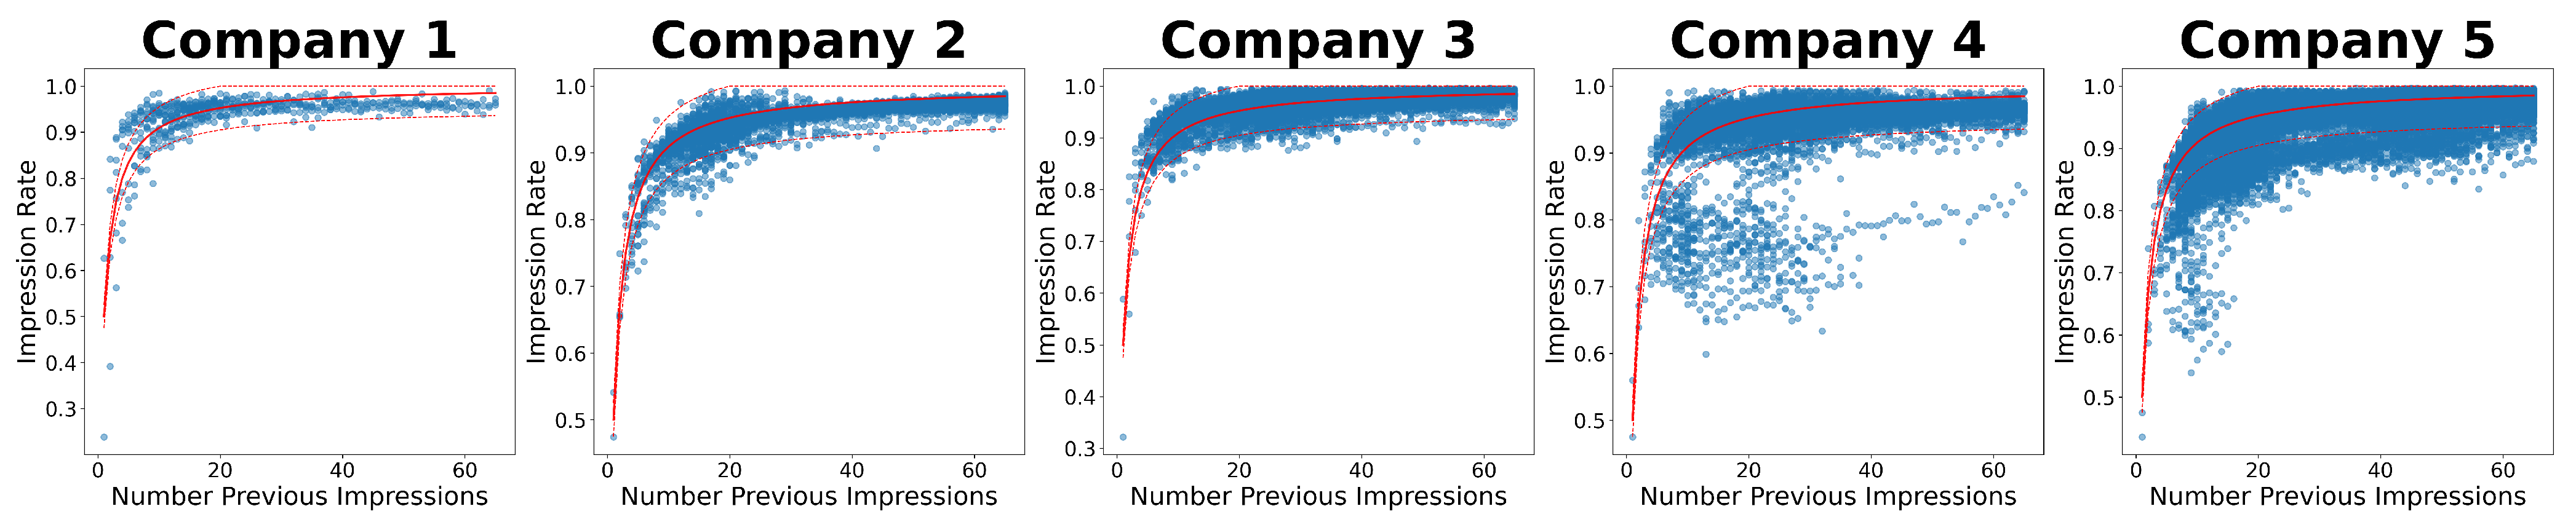
For studying the probability of getting a new impression, we use the number of previous impressions that the user has received.
Figure 3 shows for each of the five clients the portion of users that receive the next impression based on the number of previous impressions received. The impression ratio grows at a very high pace for few impressions and starts to move slowly towards an asymptotic value between
and
after 10 impressions.
It is important to explain why the ratio is low for a small number of previous impressions. This happens because for a low number of impressions, the major part of the users is still available, and there exists a greater chance to lose track of a large number of users as well, so no further impressions can be delivered.
The red line in
Figure 3 shows that the function
is a good approximation to measure the ratio. Therefore, we will use this function for numerical approximation calculations later in the article. Finally, note that although the shape of the distribution of the ratio of users per number of impressions is similar in all the 5 companies, the actual value of the ratio changes significantly among them.
3.4.2. Click Rate
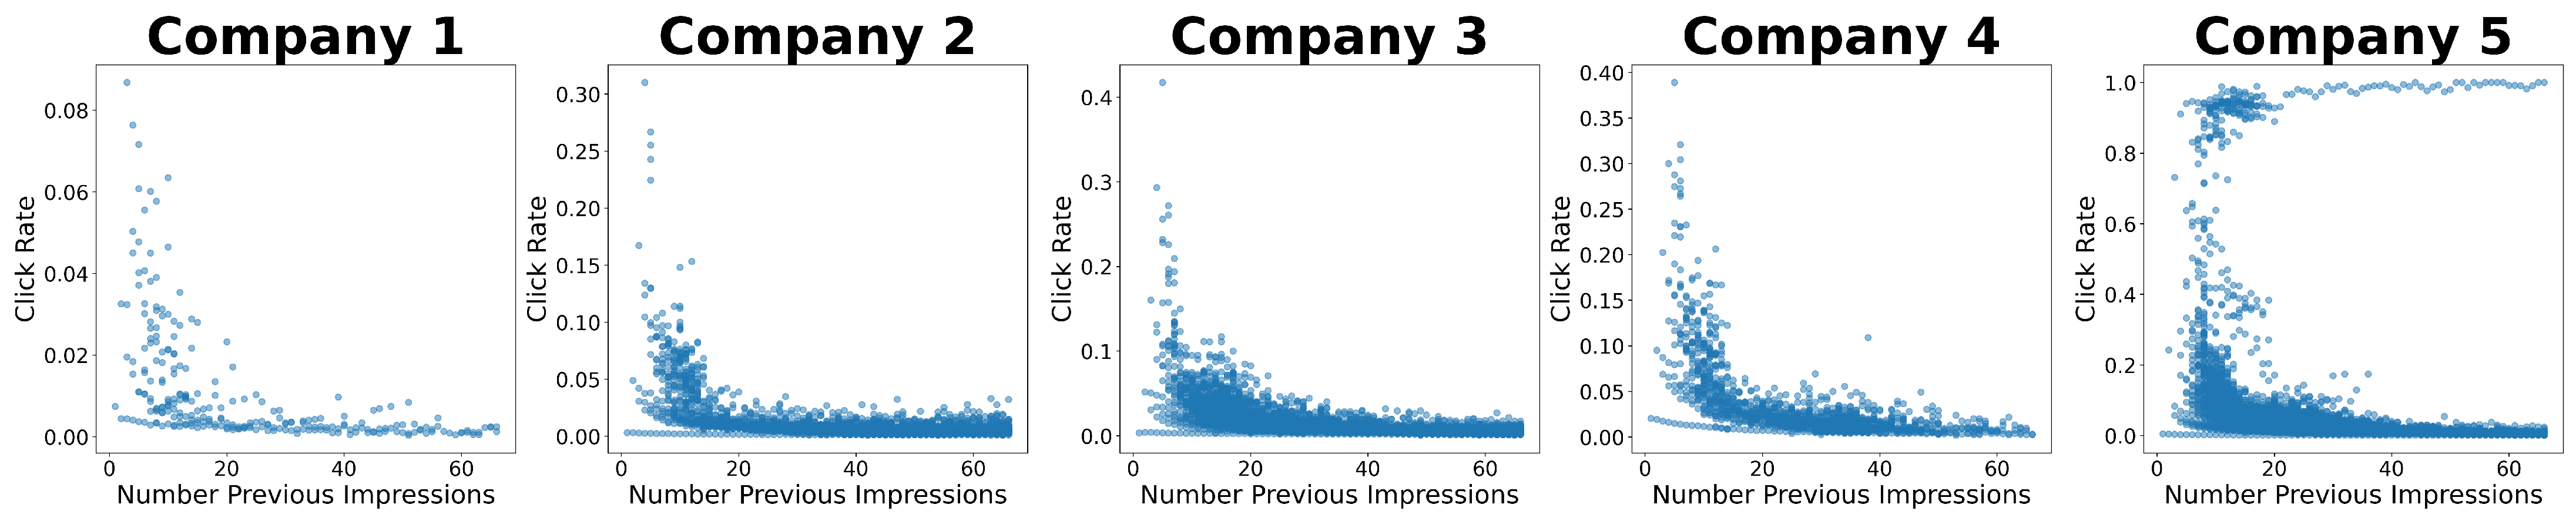
This section will adopt the analysis used in the new impression rate for the click rate. We will use our real datasets to study the performance of the click rate. In particular, we analyze the evolution of the click rate based on the number of preceding impressions.
Figure 4 shows the click rate for each of the five considered companies according to the number of previously received impressions. In all the cases, but company 5, the rate drops as the number of previous impressions increases. This reduction is especially intense for the first impressions to later martin a slightly continuous drop. The only exception where we can observe high rates (in some cases) for a high number of impressions is company five.
The noise in this figure comes from the fact that we can have previously clicked and non-clicked impressions. In most cases, the long paths are composed of a vast majority of non-clicked impressions.
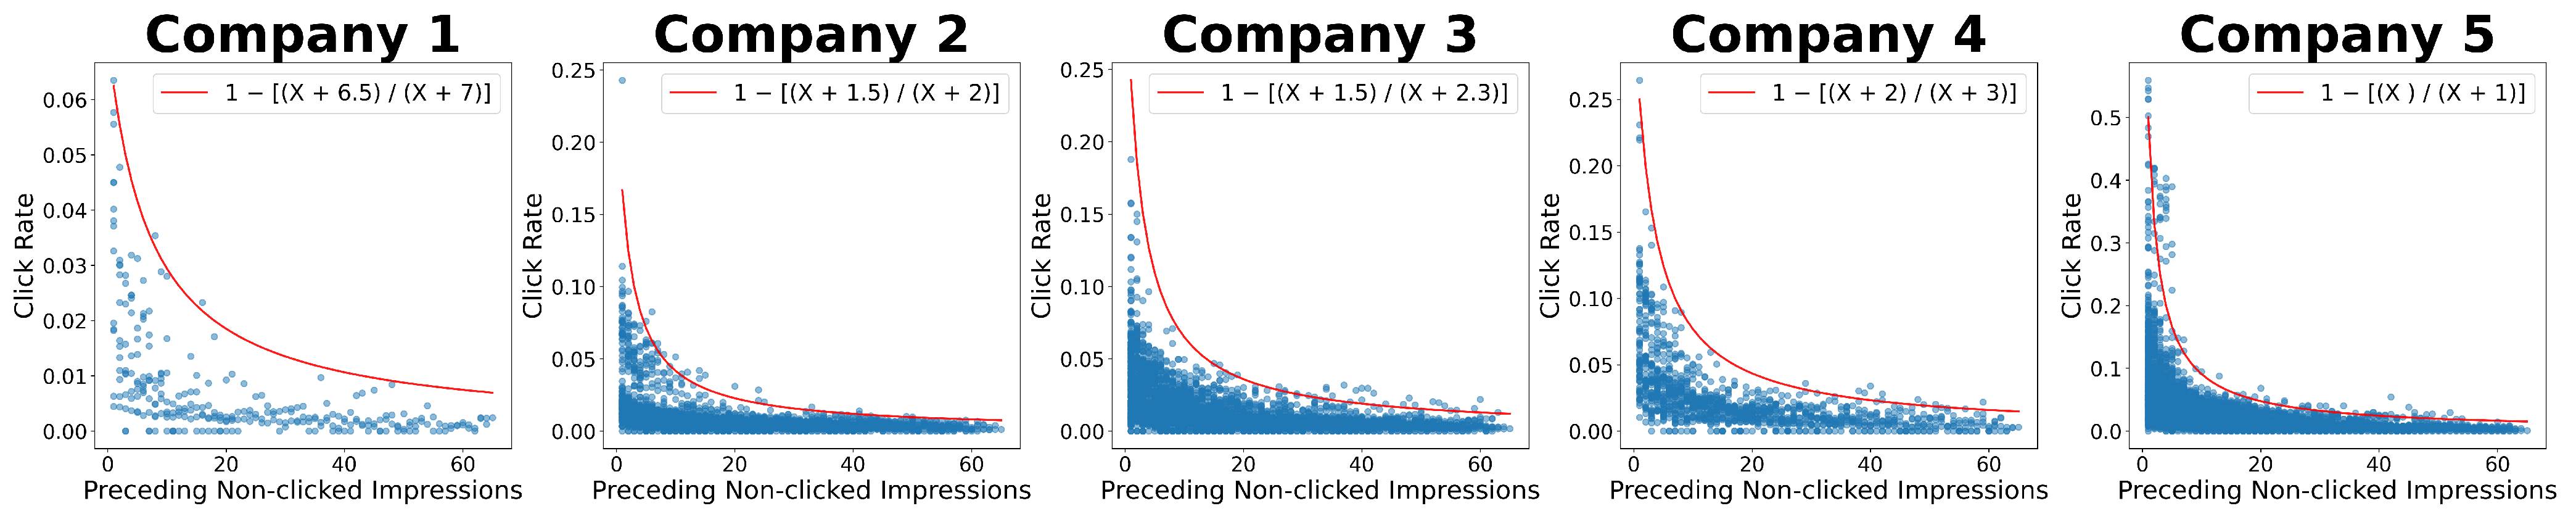
Figure 5 shows the click rate based on the number of preceding non-clicked impressions.
As in the previous case, the click rate drops as the number of preceding impressions without click increases. Furthermore, it can be seen that the shape of the distribution is similar for all companies, while the actual number differs from company to company. The red line in the figure approximates the distribution using the following function:
Note that the function will differ from company to company. Choosing the correct n and m can be used as an upper bound for the click rate. Moreover, the approximation for the upper bound shown in the figure will be used in the article.
3.4.3. Expected Number of Impressions
The goal is computing the expected number of impressions emulating what we have done in
Section 3.2.1. However, in this case, we will use the approximation we have proposed in
Section 3.4.1, which allow us to get a real approximation to the number of expected impressions and the effect of
according to them.
We refer to
X as the variable of the number of received impressions.
is the probability of getting
X impressions. Using the computed formula, we have that the probability of getting a new impression given that we have received
is
but for computing the expected value, we need to compute
. The our result is
We can now use the obtained formula to compute
The sum in the formula above is infinite, which means that in an ideal case where we can Send impressions to the users forever, the expected number of impressions will also be infinite. However, we want to find a result in practical scenarios where it is not plausible to send impressions infinitely. For a practical scenario, we find
where
n is the maximum number of impressions that the user can receive. This is the case for
, where
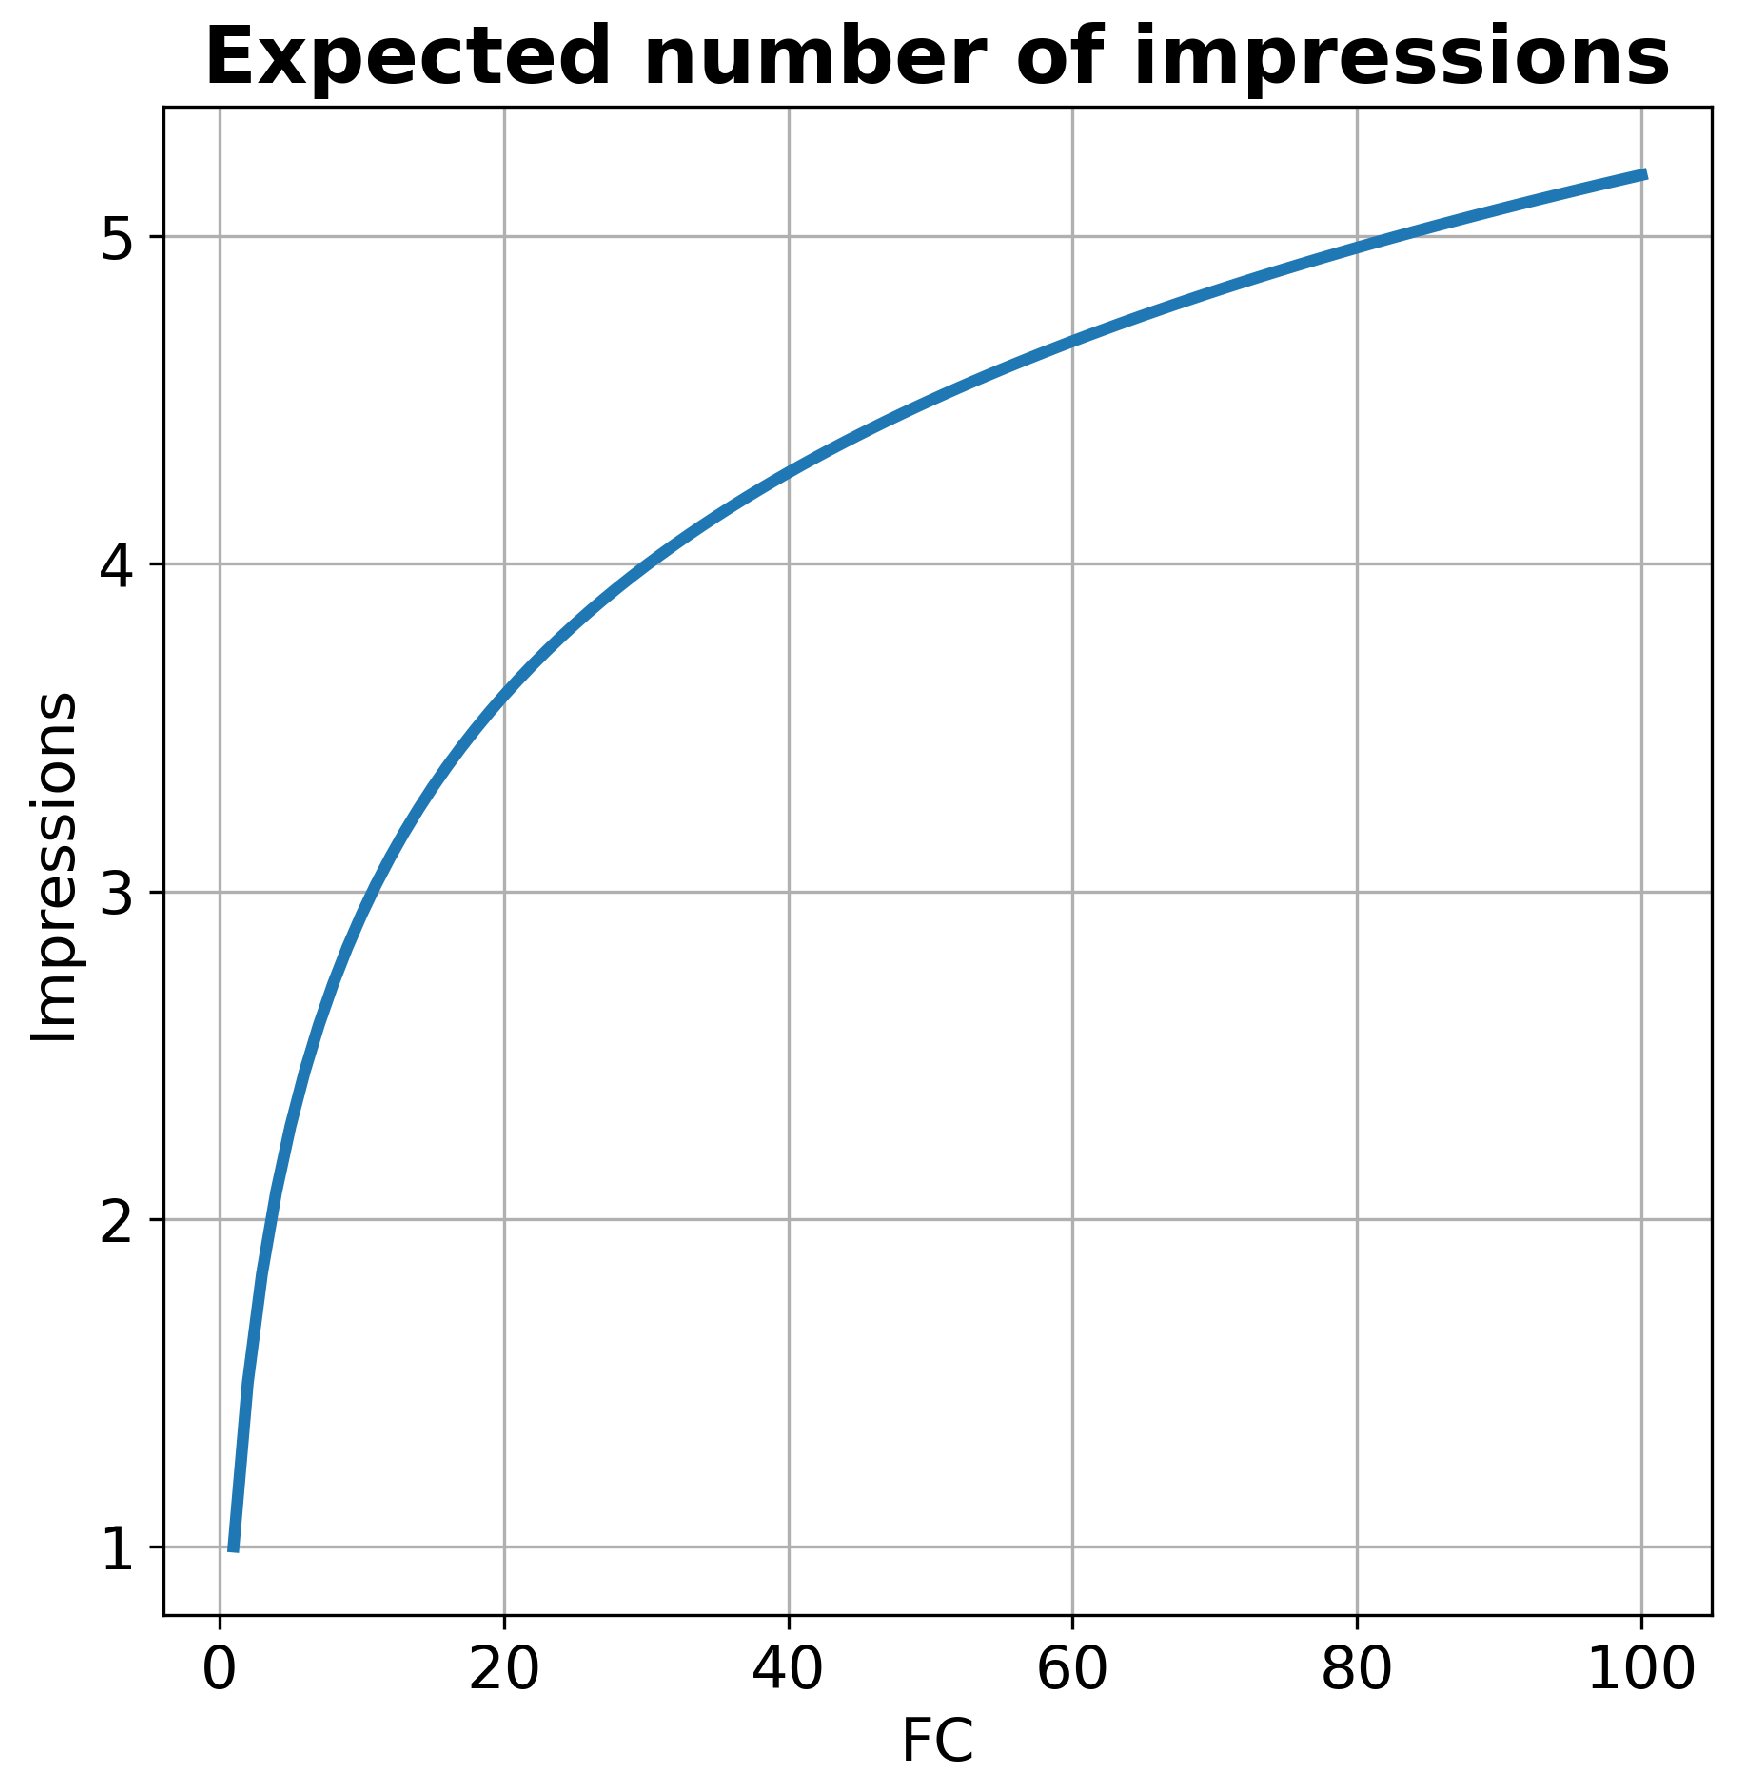
n will be capped on the maximum number of impressions a user will receive. Using this formula, we can draw the curve that describes the relation between the number of expected impressions and
. The result is depicted in
Figure 6.
In a real scenario, we observe that the expected number of impressions that the users will receive is relatively small, even if is very high.
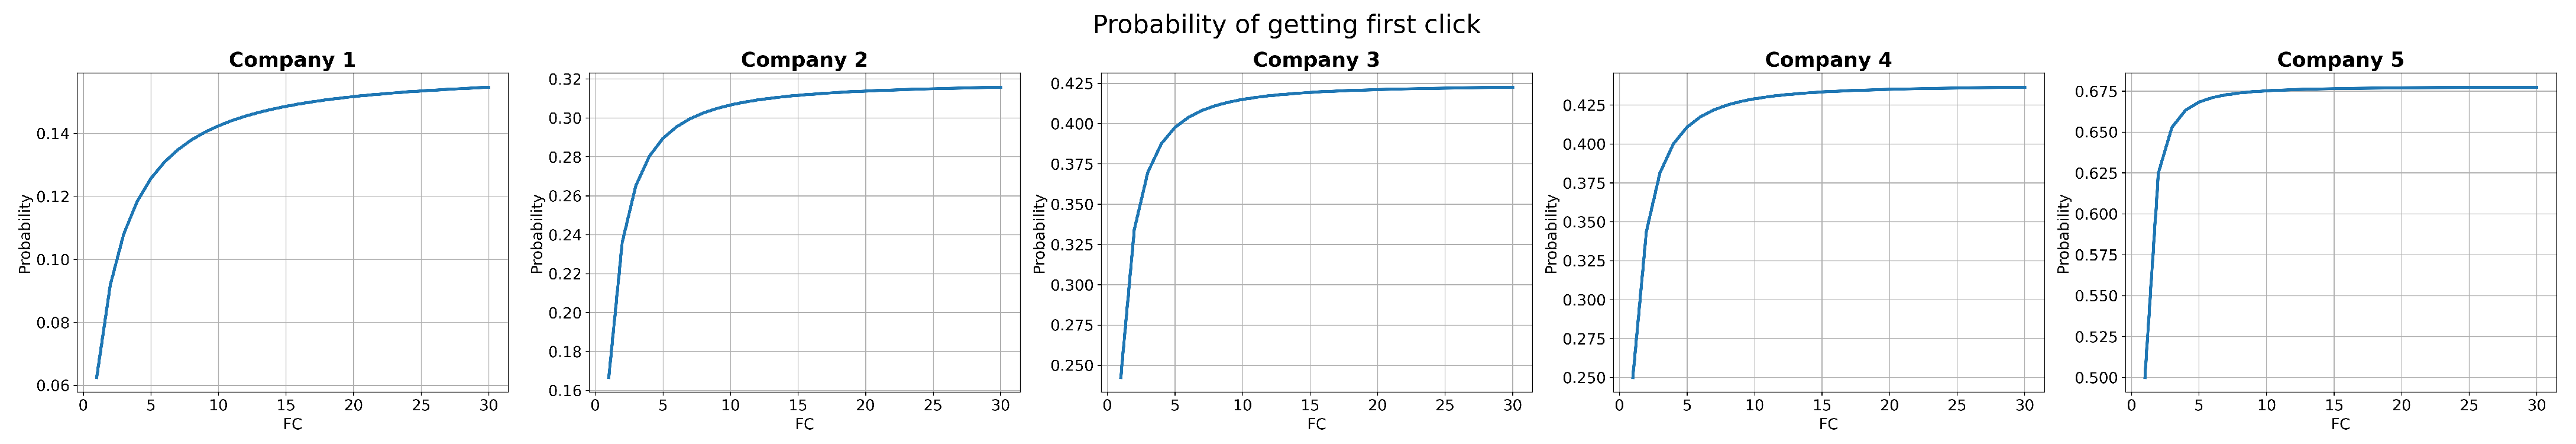
3.4.4. Probability of Getting the First Click
We study the impact of
on the probability of obtaining the first click emulating what we have done in
Section 3.2.2 for a simulated scenario. We will use the two approximations presented before for the probability of a new impression and a click, respectively.
To achieve our goal, we need to define two variables: X the total number of clicks by the user. We will also define two new probabilities: , where n is the number of previous non-clicked impressions as this is the metric used for the upper bound in the probability of click, and , the probability of getting an impression after n previous impressions. Both probabilities are defined by the formulas computed in previous sections.
Based on all the previous discussion, we propose
Using this formula, we can compute the probability of getting the first click as
In turn, using this formula, we can compute the maximum probability (remember that
Section 3.4.2 gives us an upper bound) of getting the first click.
Figure 7 shows the relation between the
and the probability of the first click.
We observe that has an impact on the probability of the first click for low values. We can also notice that the different click rate for each of the companies also affects these probabilities.
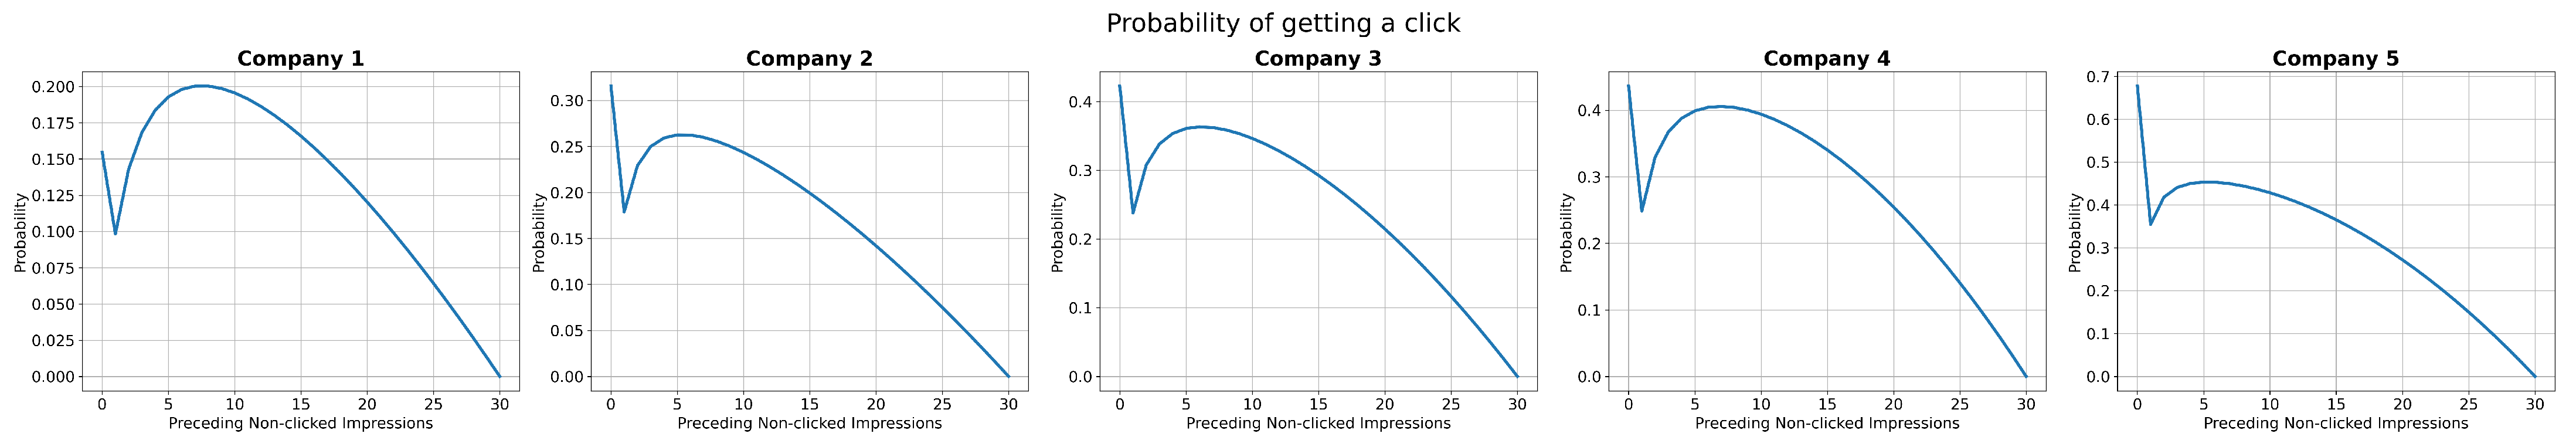
Furthermore, we go beyond the probability of getting the first click from scratch. We analyze how this probability evolves as the number of non-clicked impressions increases. To illustrate the case, we will set
and find the probability of getting the click after several non-clicked impressions. The results are shown in
Figure 8.
The results show that the probability decreases initially because of the enormous risk of not getting any new impression. Nevertheless, after overcoming the high chances of not receiving more impressions, the probability increases quickly up to the fifth impression when it starts dropping again until it reaches 0.
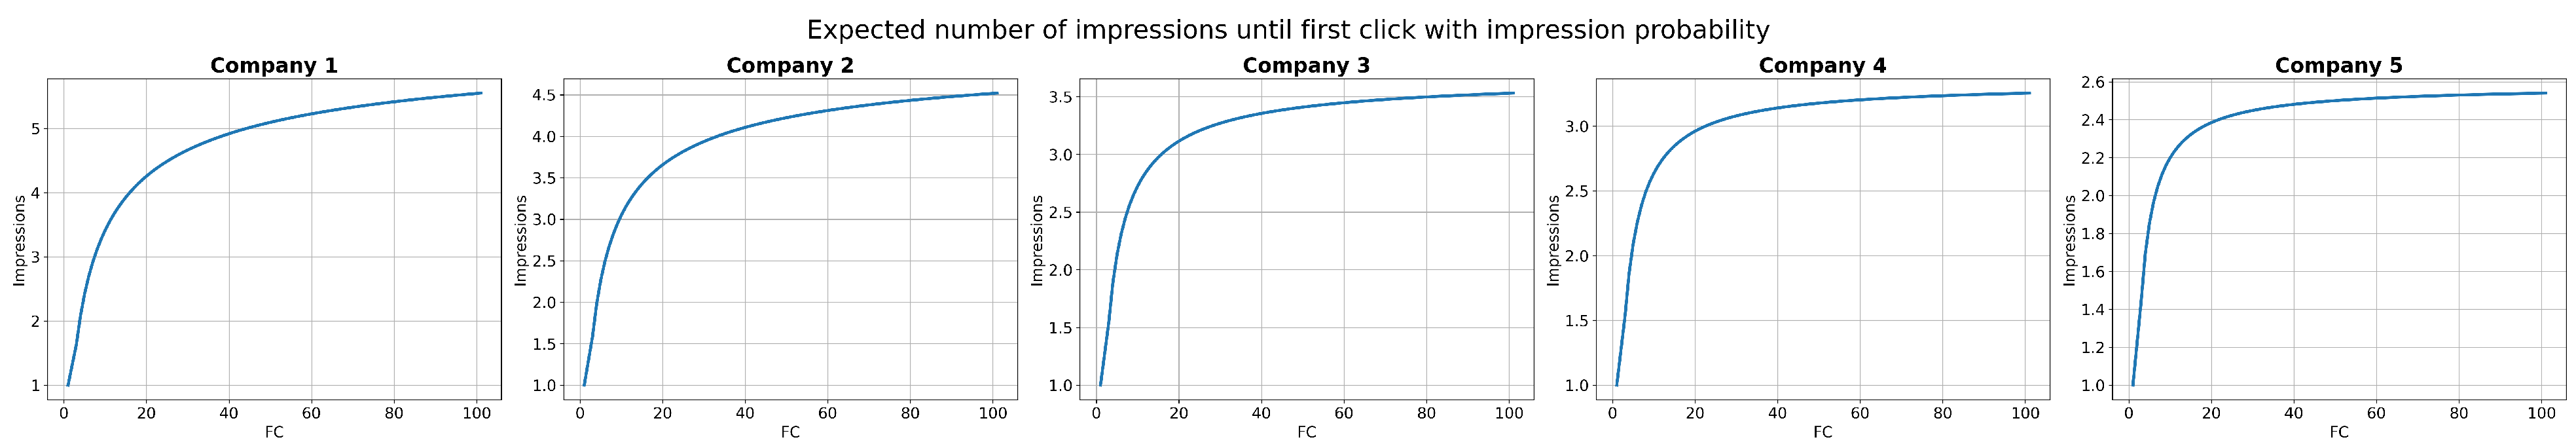
3.4.5. Expected Impressions until First Click
We study the expected number of impressions before getting the first click. It will be a similar exercise to the one carried out in
Section 3.2.3, but in this case, we will use the real data approximations for the new impression and click probabilities.
This section will use the probabilities
and
that have been described in the previous section. Using these probabilities, the formula for the expected number of impressions until the first click is
We can use this formula to describe the relation between the expected number of impressions until the first click and
. The results are presented in
Figure 9.
The expected number of impressions to reach the first click grows as the increases. This is actually a bad result as it implies it is more expensive to get the first click from the user, but we need to consider that the number of users we will reach is probably higher. Therefore, it does not make sense to set up a high value as it will me user acquisition too expensive and too small.
3.5. Business Interpretation
While restraining the number of impressions that we are sending a user is by default important, it becomes particularly relevant when we are discussing performance in the context of digital marketing. In this scenario, there is a clear focus on obtaining a measurable user action. Usually, the final goal is to increase sales as a means to get as much revenue as possible.
In this context is where the metric ROAS (Return On Ad Spend) emerges. This metric is a critical indicator of the profitability of digital marketing campaigns. Therefore, companies always have an interest and focus on optimizing this metric. We next analyze how to optimize the ROAS as a optimization.
The definition of ROAS is
The cost will be calculated as the sum of the cost of all the impressions sent to the users. We use other variables that we need to apply to our calculations: AOV (Average Order Value) is the average revenue per sale, CR (Conversion Rate) is the ratio of clicks that lead to a conversion, and CTR (Click Through Rate) is the ratio of impressions that are clicked. Then, we propose the following definitions:
Applying the previous definitions on the formula of ROAS, we have the following:
This last formula was what we were looking to use in our problem of . and are values that vary from company to company but can be easily calculated if you access the company performance information. ROAS is the business metric we want to optimize, and we have already shown that we can improve the CTR using the appropriate . In summary, if we define a specific value for the ROAS a company wants to achieve, the formula will provide the minimum CTR to be achieved through the appropriate .
4. Results
In this section, we define two business cases to illustrate how the proposed methodology could be applied in order to define an efficient value according to the pursued goal. The goal in the first business case is to get new users/subscribers for a service. The second business case illustrates a scenario where a company aims to maximize revenue and maintain a predefined profitability.
4.1. Business Case: Get New Users
In this business case, the advertiser is willing to expand its user base for re-targeting. Therefore, their digital marketing effort aims to bring new users to their website to increase the user base of potentially interested users that will be further re-targeted to attract them as new users or subscribers. This is a very common strategy used nowadays by advertisers. The referred objective is subject to a specific budget; thus, the actual goal is maximizing the number of new users for the defined budget.
In this scenario, we are interested in the users’ paths until they perform the first click to reach the landing page of the advertiser. Once a user has clicked on the ad (i.e., have reached the advertising landing page), we remove the user from our targeting base, and he/she will move into the re-targeting tactic.
Following our strategy, we are only interested on the paths formed by a subsequent list of non-clicked impressions events with a click as last event such as (1, 0, 01, 00, 001, 000, 0001, 0000, 00001, ⋯). Therefore, we are only working with the subsample of the graph represented in
Figure 1 that includes the previously described paths. The resulting subgraph, used in this business case, is depicted in
Figure 10.
In this scenario, based on our methodology, we need to predict the probability of getting a click after a chain of non-clicked impressions. We can approximate that probability using the upper bound equation formulated in
Section 3.4.2.
In a real business scenario, the first step would be to determine the proper parameters for the Equation (
1) for a given client. After that, we will be able to estimate the probability for the client. Based on this information, we could simulate a particular scenario for the client and find out the optima
.
To run the simulation, we will need to use the formula obtained in
Section 3.4.1. Using that equation, we can compute the number of impressions each user will receive and accurately estimate the number of clicks. In summary, we can predict the number of new users (i.e., number of clicks) we will attract from the overall targeted set of users (i.e., targeted audience). For the case in which the desired number of new users is pre-established, we could provide the audience size that the advertiser has to target to reach the objective. We will present the simulation for both options: (i) the number of new users that will be attracted from a given audience, and (ii) the size of the targeted audience to achieve a predefined number of new users.
4.1.1. Computing Number of New Users Achieved
We simulate the behaviour of multiple users following the rules used to construct the graph in
Figure 10. Each user will have a probability of receiving a new impression and a probability of clicking on it. If the user clicks on the impression, he/she will not receive more impressions. Contrarily, if the user does not click on the received impression, he/she could receive more impressions.
In the following we define the different parameters required for our simulation:
Using the above parameters, we will execute ten different realizations of our simulation to ensure consistent results.
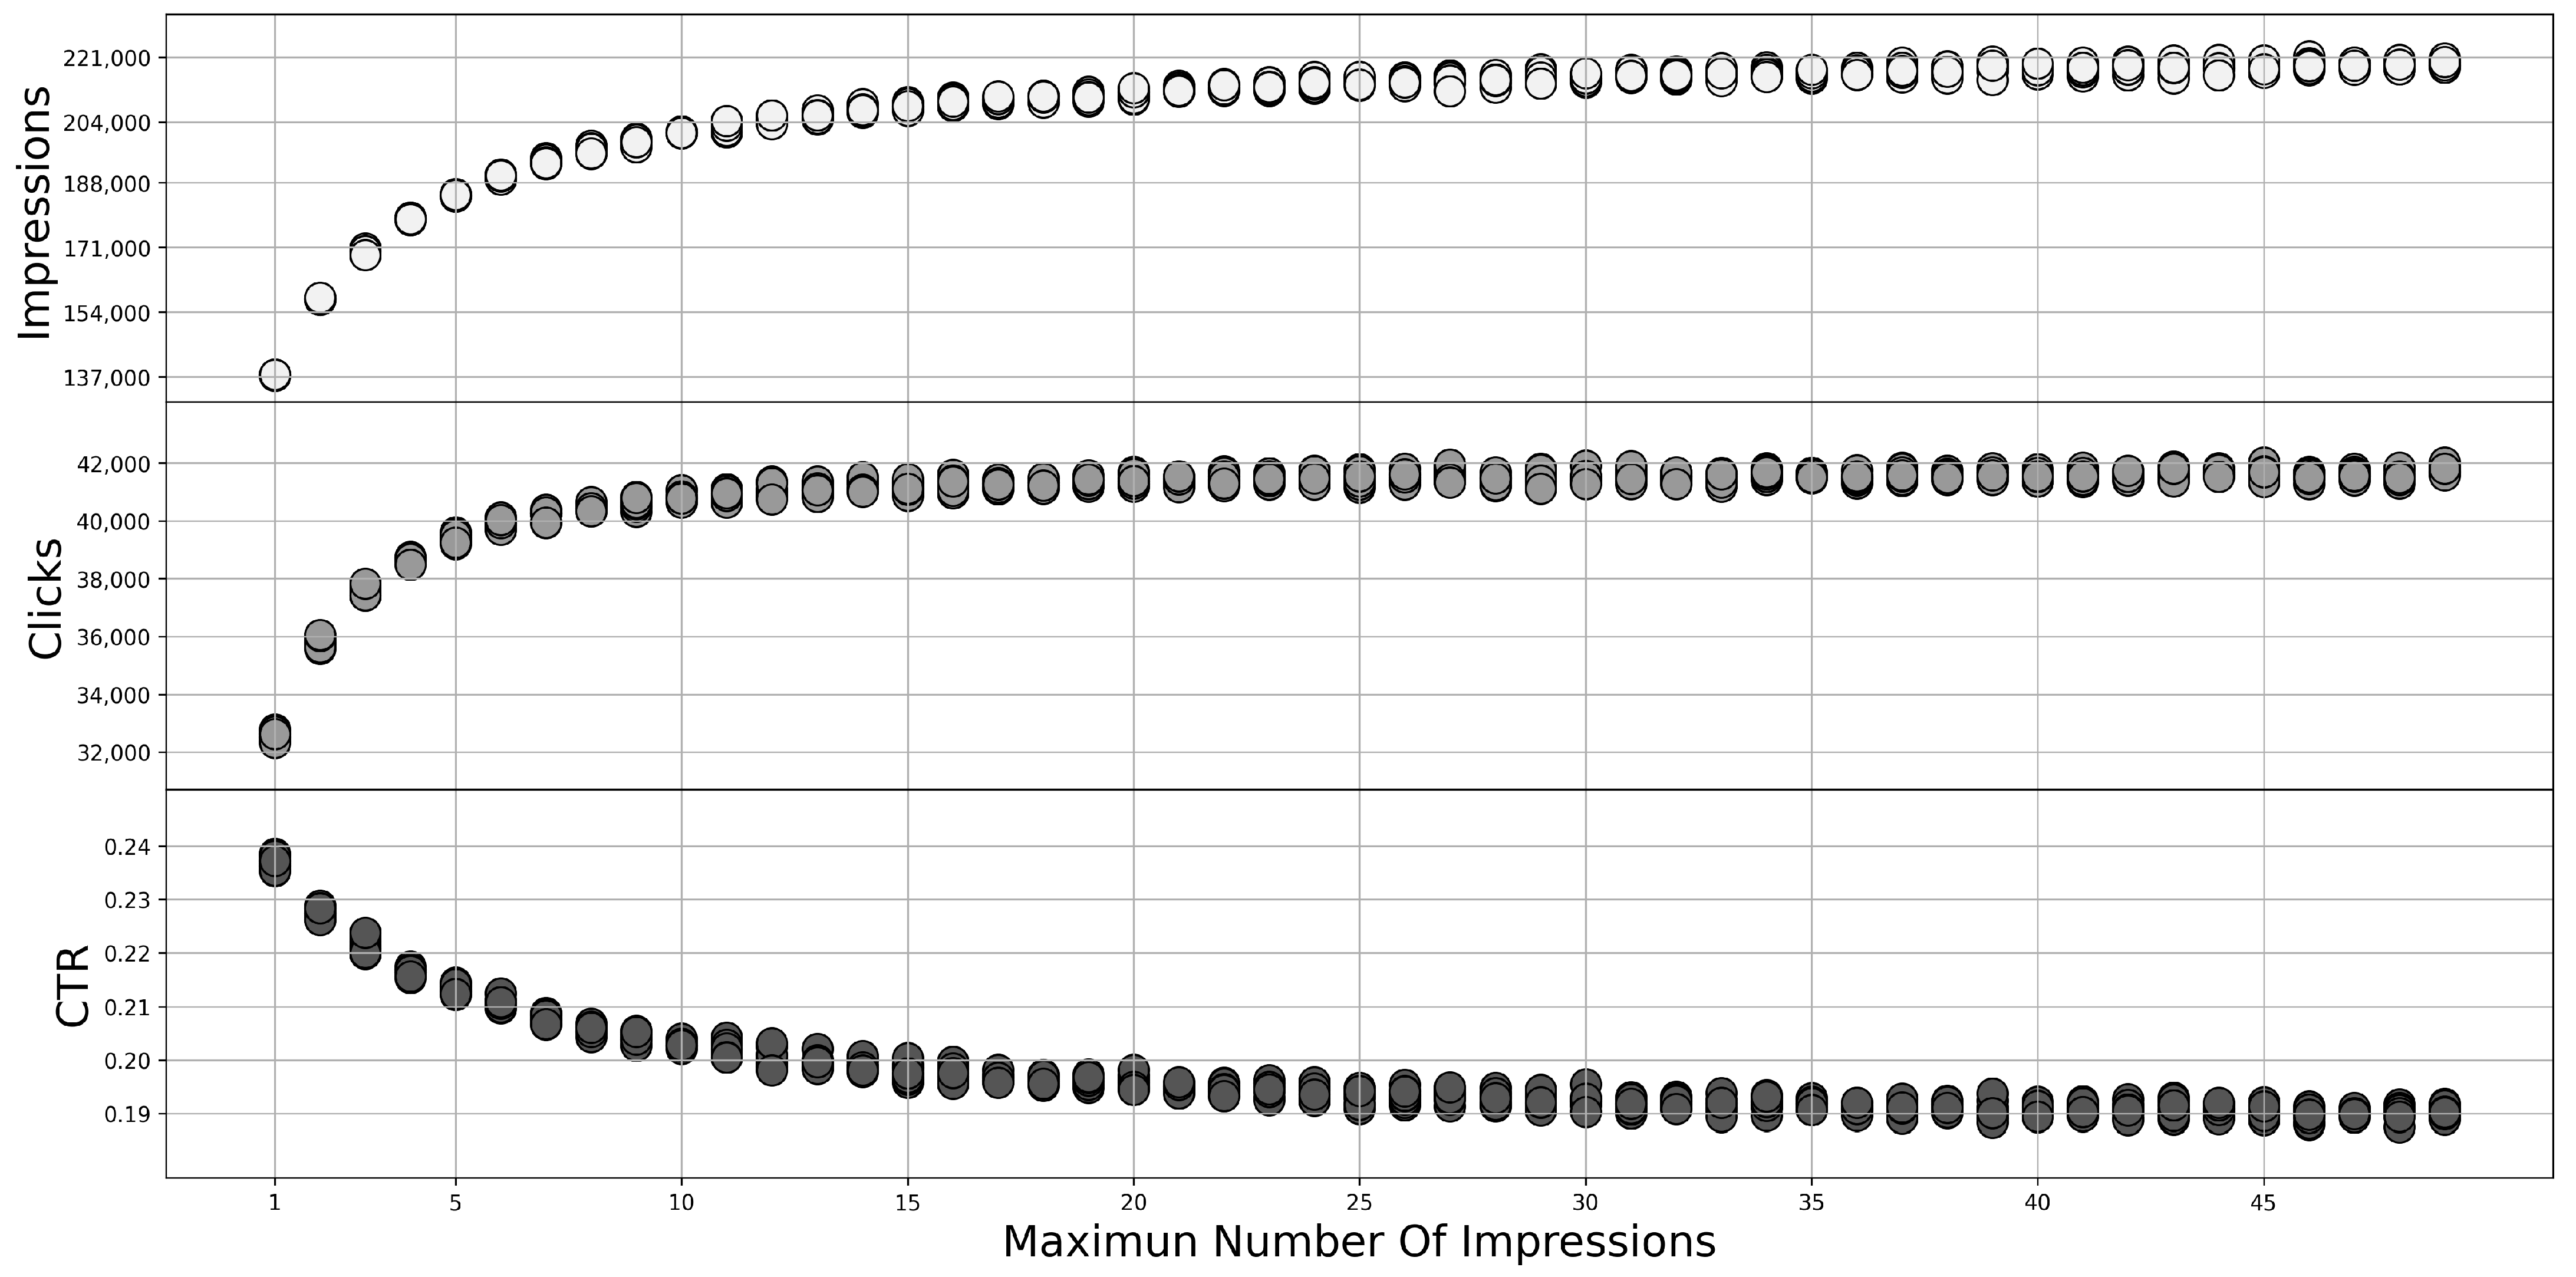
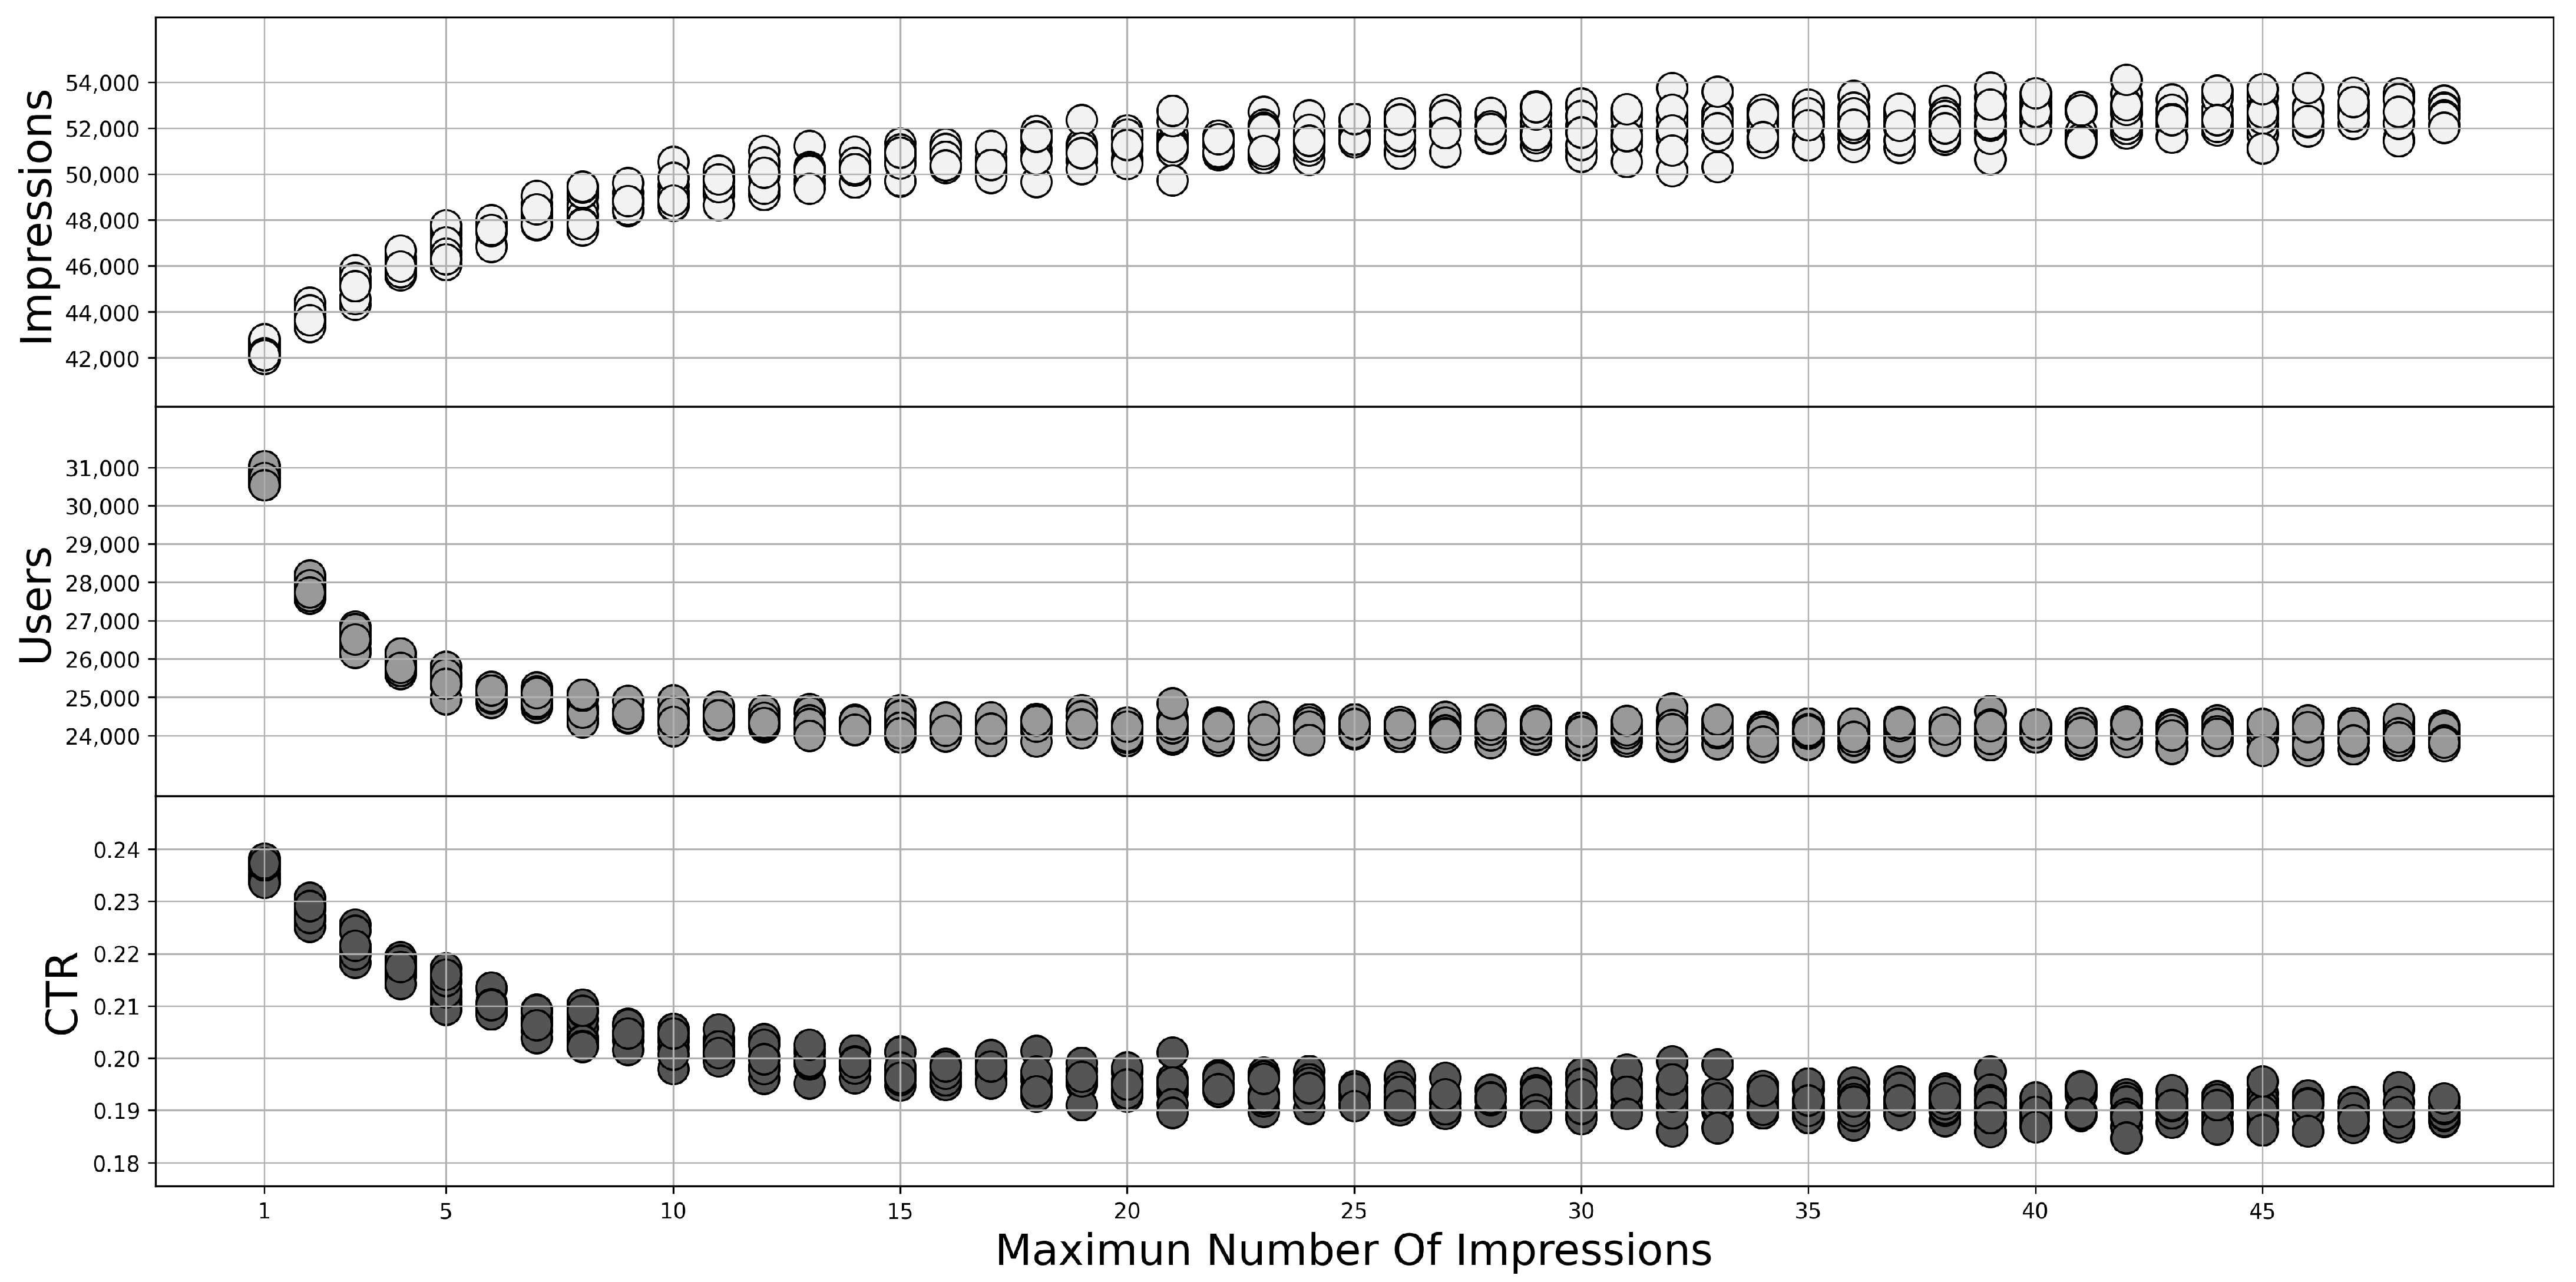
Figure 11 shows the results of the simulation for the following metrics: number of impressions, number of clicks, and CTR. Note that the results of the 10 realizations are represented in the figure, but in most cases, the circles used to represent the values are overlapped.
The simulation results demonstrate that as the increases, the CTR decreases but the number of clicks increases. The figure is an important tool that will allow the client to select the optimal for its objective. For instance, let us use to illustrate how the figure has to be interpreted. On the one hand (negative side), there will be a loss of 5% with respect to the maximum number of clicks (i.e., new users) that could be retrieved. On the other hand (positive side), the client will be saving 20% of the budget (i.e., impressions), which would imply acquiring the referred 5% of extra budget. If we set up , the client may get all the potential users but will incur in a 10% extra cost. In other words, the last 5% of the clients implies spending 10% more budget. Whether this is worthwhile is a decision that each client can take using the results from our methodology.
In terms of business implications, this result is very relevant. The marketing manager will have a group of users (audience) that they want to target; this could be, for instance, people interested in travel or user who have entered the page in the past but not in the last two months. Using this method, the marketing manager will be able to take several actions. First, he/she can determine the maximum number of users to bring to the page, making sure they can fulfill this business objective. Once he/she had checked that the target number of users to bring to the page is a reasonable objective, he/she can tell the activation teams the maximum number of impressions for each user that will ensure that the objective is fulfilled, but not money wasted in unnecessary impressions.
4.1.2. Computing Audience Size
In the previous simulation, we used our methodology to assume a predefined audience size and obtained the actual number of users that would perform a click on the ad impressions for a given value. In this subsection, we analyze a different business case in which the predefined value is the number of users that click in an ad impression (i.e., new users), and we need to obtain what is the required audience size that that should be targeted and the value to achieve the predefined number of clicks.
In our simulation, we will use the same equations as in the previous case for the probability of receiving a new impression and the probability of a user clicking on an ad. In contrast to the previous scenario, this time, we will keep adding users to our simulation until we reach the pre-established number of clicks.
We run simulations that implement the described scenario. Our simulations are configured with a predefined number of clicks to be reached equal to 10k and
values ranging between 1 and 50 ad impressions. In addition, as we did it before, for each
value, we run ten executions of our simulations.
Figure 12 shows the result of our simulations per
value for the following metrics: number of impressions, CTR, and required audience size (i.e., number of users to achieve the expected number of clicks).
Once more,
Figure 12 appears to be a valid tool for advertisers to decide the best
to achieve their objectives. Our results show that the required audience size becomes stable around
. This means using any
imply to reach the same amount of users to obtain 10k clicks. However, the cost (i.e., number of impressions) is not simply derived from
. Actually, a
can save 15% of the impressions compared to higher
values. This roughly means the advertiser can save 15% of the budget.
To conclude this section, it is important to note that our methodology is highly flexible and can be very easily adapted to the actual metrics of the users. This means our methodology in both business cases simulation requires an impression and click probability that may differ from advertiser to advertiser. Therefore, the obtained results are valid for a impression probability and click probability equal to
and
, respectively (obtained from the data that we have available for the company 4 in
Section 3.4.1 and
Section 3.4.2). However, we could obtain ad hoc curves for any advertiser providing probability metrics from their historical ad campaigns.
From a business perspective, this method presents different options compared to the previous case. For this case, the marketing manager will need to obtain a certain number of new users on the web. This could be to showcase the products catalog, give visibility for a new product, or just a corporate campaign to help build the brand. Knowing the number of new visitors that have to reach, he/she uses this method to figure out the minimum number of people in the target audience. Therefore she can point look for the audience that fits the desired behaviour, and that has enough users to ensure a good CTR and not waste impressions.
4.2. Business Case: Maximize Revenue and Maintain Certain Profitability Level
A second plausible business case is related to the willingness to improve performance. In particular, we envision a case where the advertiser aims to maintain certain profitability and increase revenue.
The restriction of the profitability will define the minimum ROAS the client can afford. In addition, by exploiting the advertiser’s historical data from previous ad campaigns and associated conversions, we could compute the cost per impression for that client. Similarly, based on the client historical data, we can compute the revenue per click for the client. With all this information, we will use the following formula introduced in
Section 3.5:
Using this formula, we can obtain the lower bound for the CTR that will guarantee to maintain the desired profitability.
In this setting, we will test two different strategies to define the optimal value:
Absolute capping: This strategy is the one currently implemented in the digital marketing industry. A particular user will keep receiving impressions until the is reached and will not receive any further impression from that moment. This strategy does not consider any interaction (i.e., click of the user) of the user with the ad. For instance, if we define a and a user clicks and converts in the first impression, he/she can receive 4 more ads.
Non-clicked based: We propose a novel strategy to define the based on the number of consecutive non-clicked impressions. This means we stop sending impressions to a user if he/she has received consecutive impressions and did not click any of them. Then, if the user clicks on an impression, the counter to reach is restarted. For instance, if we define a and a user does not click in the first 5 impressions, we stop sending impressions. However, if he/she clicks on the fourth impression, he/she can receive up to 5 new impressions even if he/she does not click again.
Note that we did not compare these strategies in the previous business case because as the considered paths are formed only by zeros, both strategies become the same.
Frequency Capping Strategies Evaluation Using Real Datasets
For the business case under consideration, we work with the entire graph of paths
Figure 1. We do not require to use simulations for this business case. Instead, we use the real data belonging to five different companies. We apply different
values to the historical data and study how this impacts the CTR and ROAS. In this business case, we evaluate
values ranging from 1 to 80.
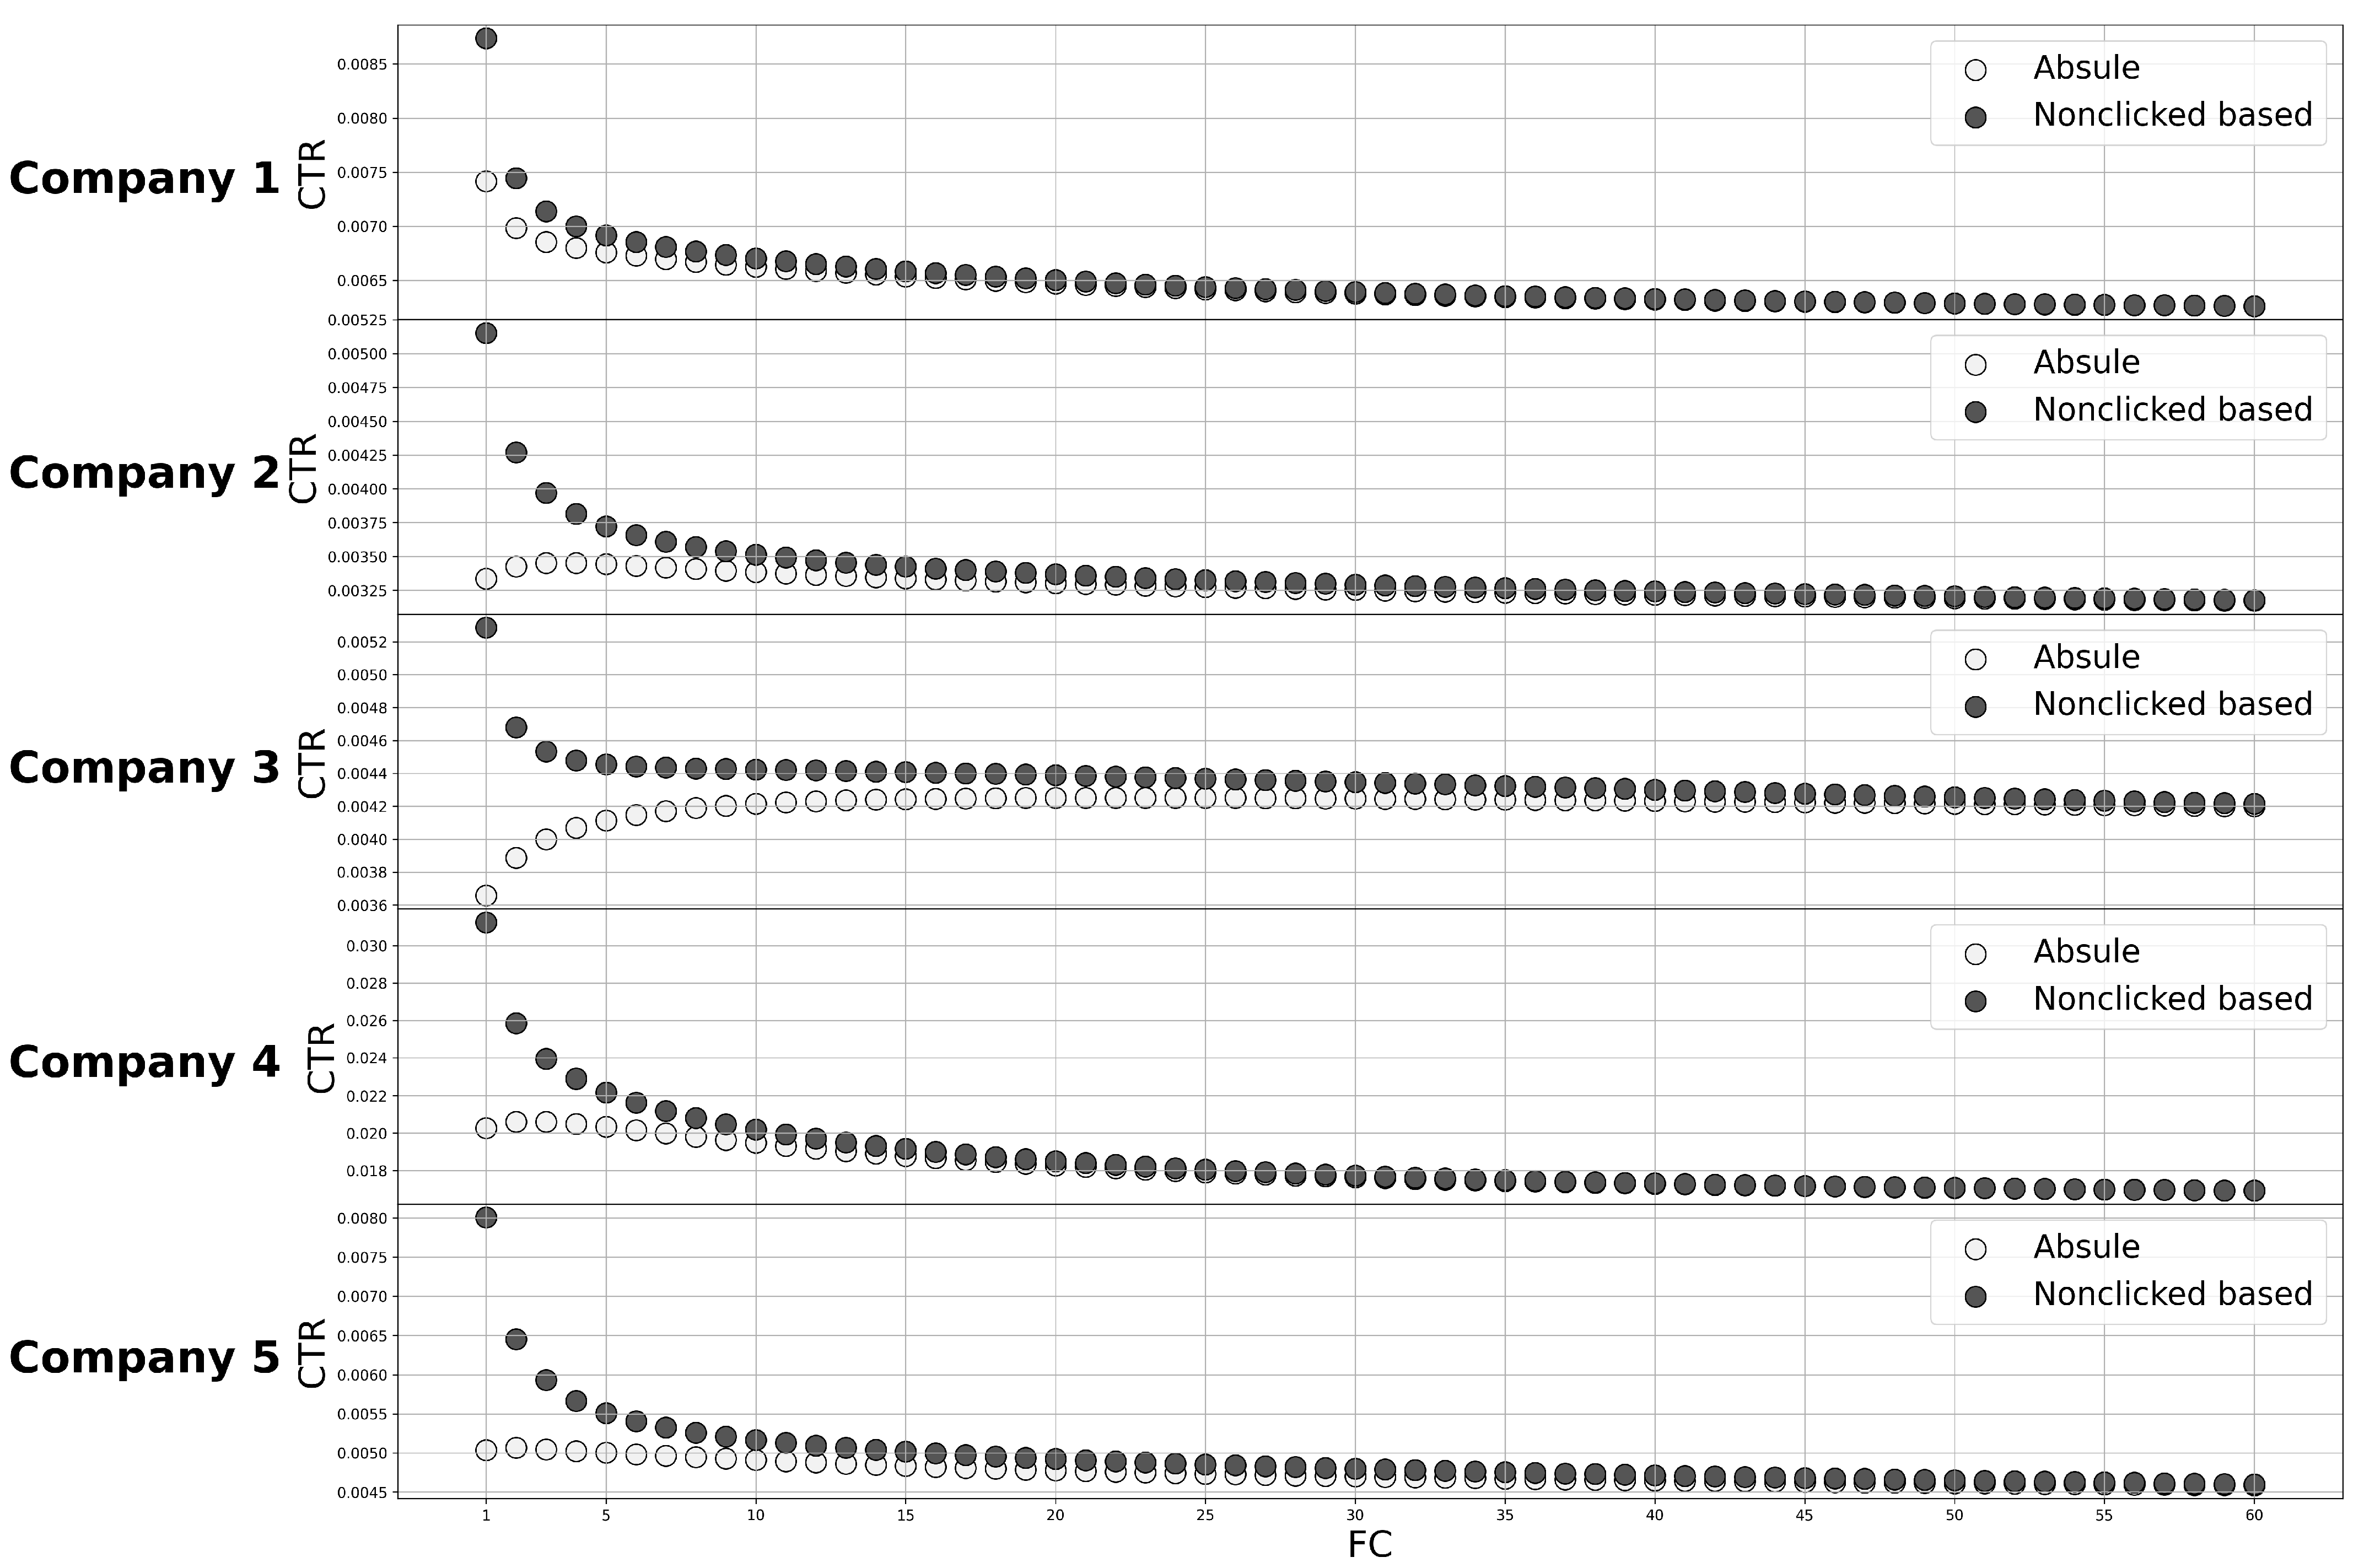
Figure 13 shows the CTR for the Absolute and Non-click-based strategies for each of the five advertisers analyzed and the different
values considered.
We observe that the Non-click-based strategy outperforms the Absolute approach. The difference is especially relevant for in all the advertisers. Both strategies become similar for , and from that point, the CTR decrement is very low. Furthermore, while the absolute method does not describe the same shape for all the clients, in the non-clicked strategy, the results show a continuously decreasing shape in all five companies. Finally, we can appreciate that from a value of 30, no matter the method, the CTR tends to stabilize with a slight decrease but not significant.
Once we have obtained the CTR for both strategies, we could easily convert the ROAS into CTR and use the previous
Figure 13 to find the best CTR. However, it is even better to convert CTRs into ROAS and create new plots showing the ROAS value for the
range under analysis. To perform this exercise, we use a CPM equal to
€, which means a cost per impression of
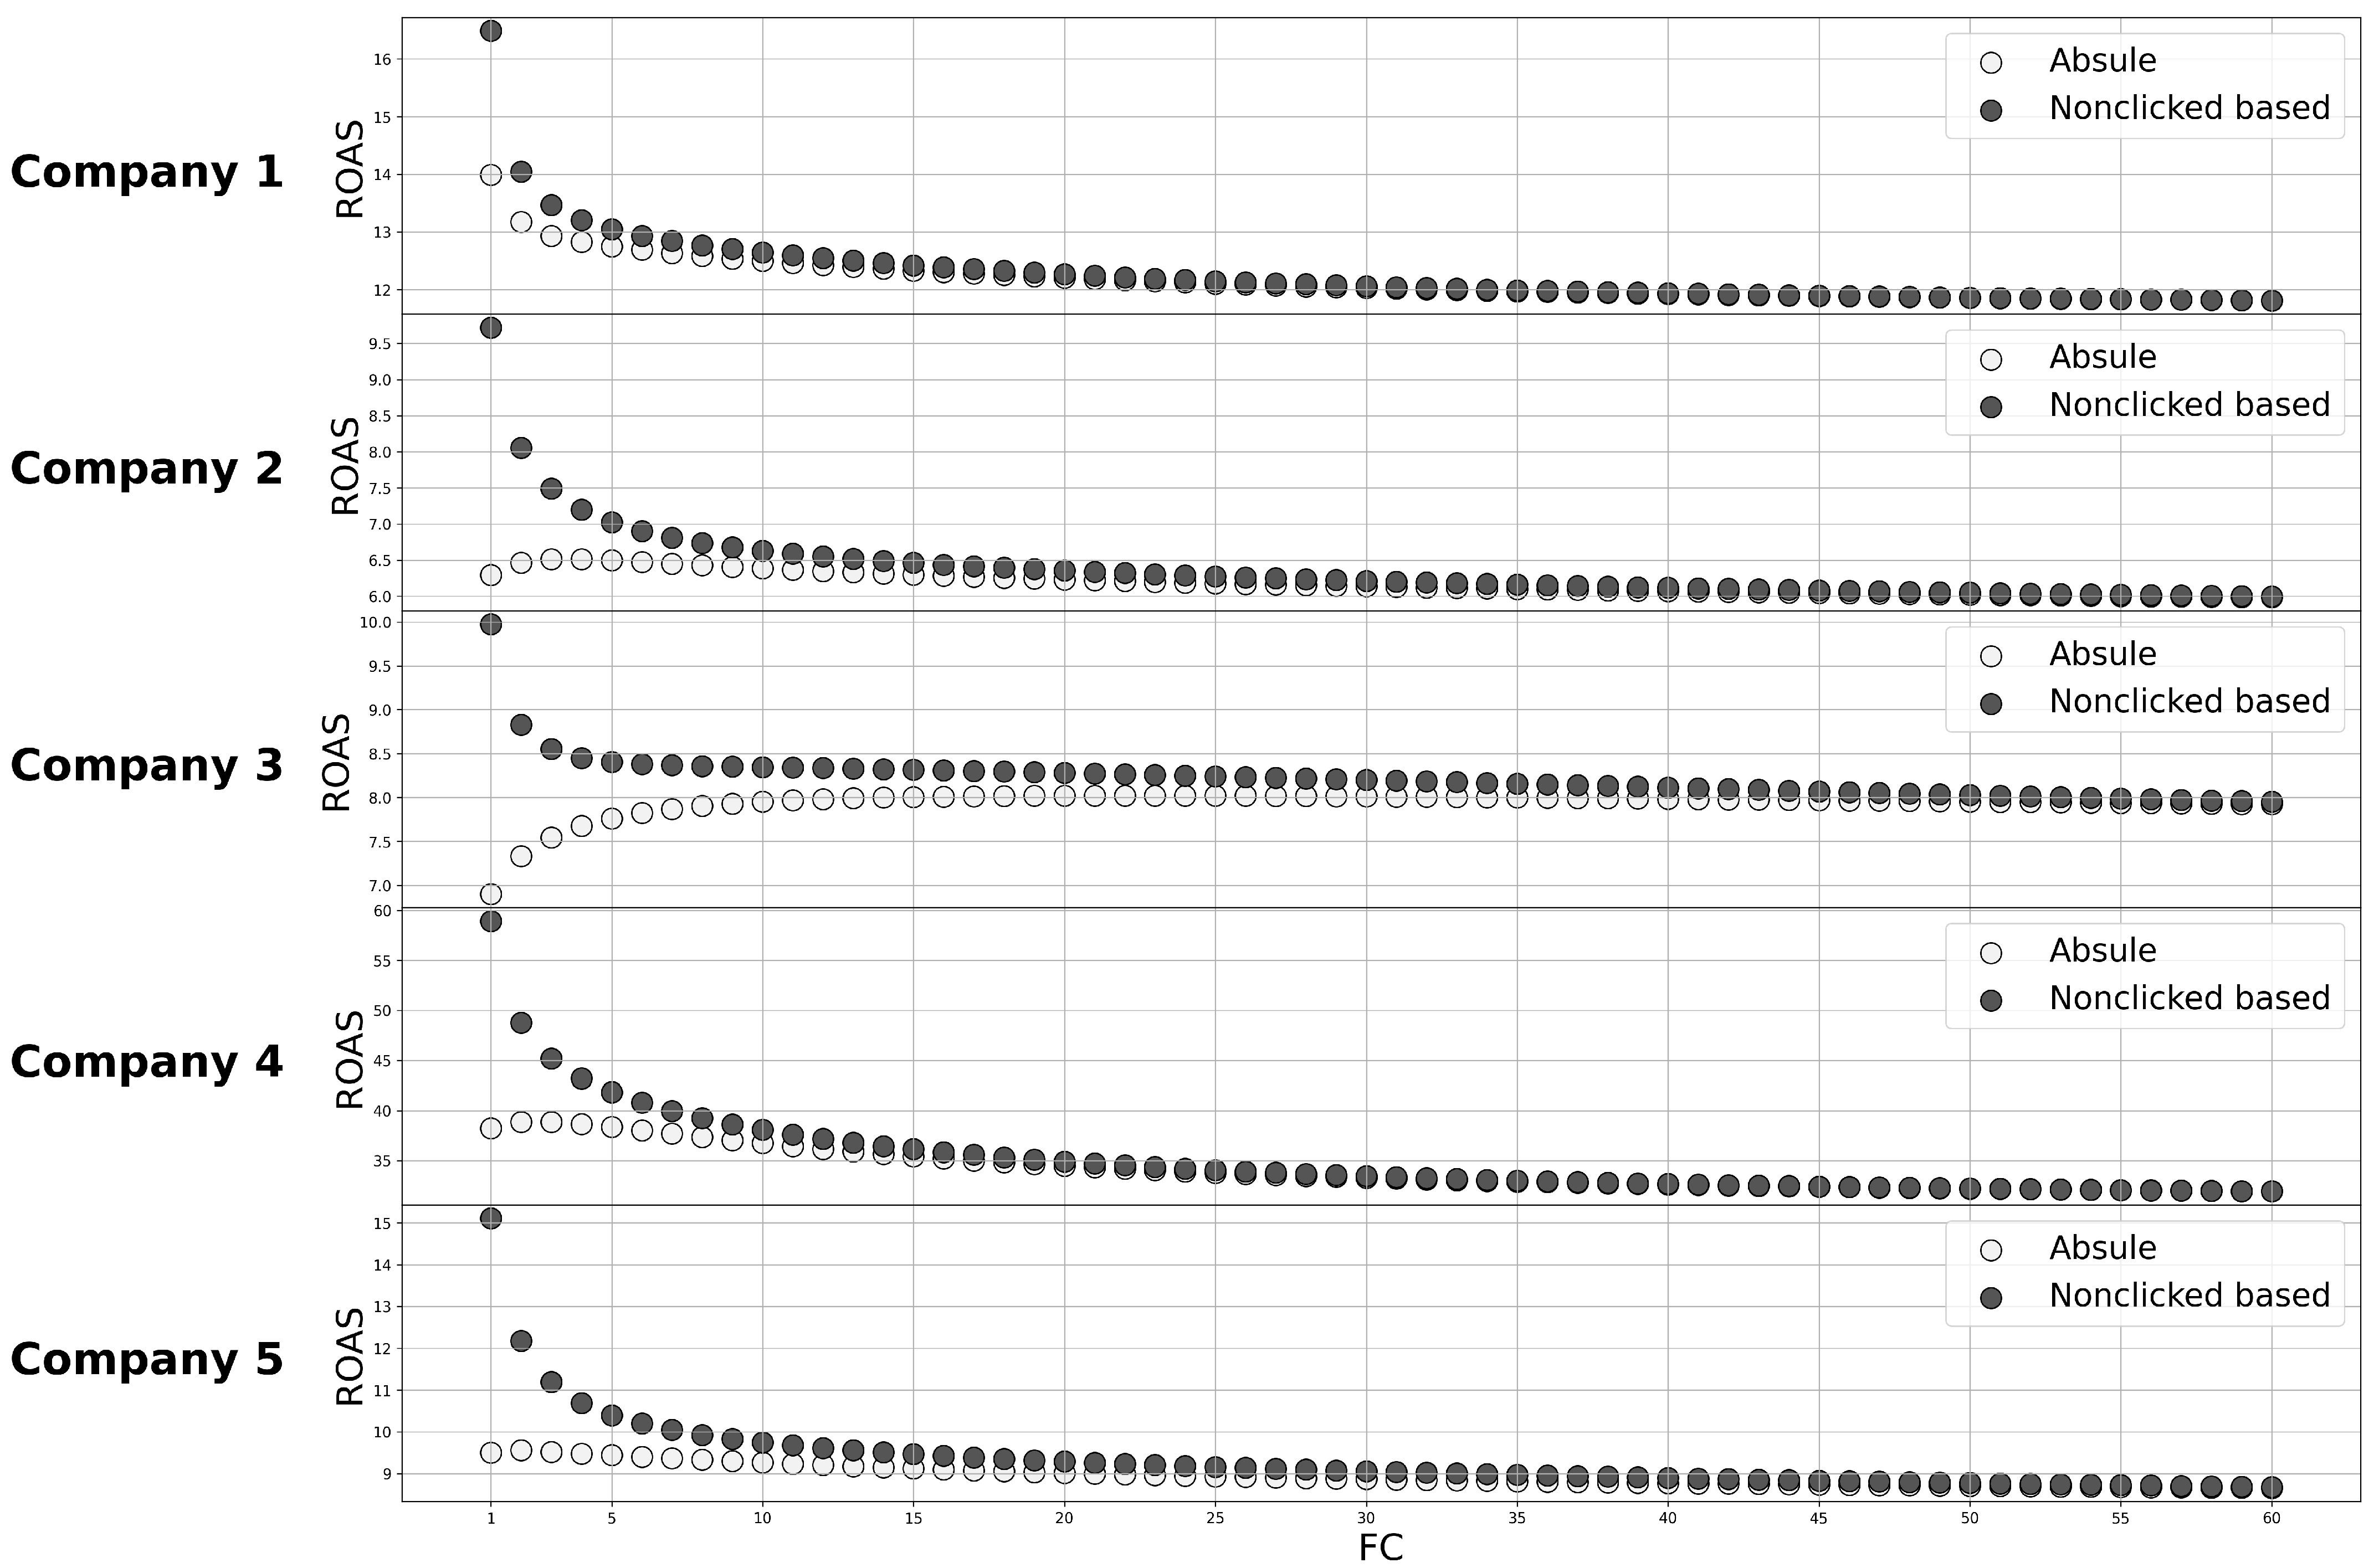
€. In addition, we consider a revenue per click of 3 €. These values are the real values from a company, and they were provided directly from Neo Media World. Based on this values,
Figure 14 shows the ROAS for both strategies.
Figure 14 may again be a handy tool to select the
value that leads to obtaining a minimum ROAS considered good by the client. The selected
will guarantee the desired profitability while maximizing the revenue. If a advertiser decides to use a lower
, it will obtain better profitability at the cost of reducing the revenue.
ROAS is arguably the most important performance indicator when running a marketing campaign as it measures profitability of the campaign. Therefore, this is the main focus for the executive level in any company trying to use digital marketing to sell products or services over the internet. Having this in mind, they will take care of ensuring profitability from the digital marketing campaign to ensure that the business is working correctly. To this objective, the method we have designed will help the managers decide on the number of impressions to show each user. This number will allow the activation teams to ensure that they are fulfilling the profitability target while maximizing the revenue. Furthermore, using the noble non-clicked strategies, even better performance can be achieved from the digital marketing campaigns.
5. Discussion
As we have demonstrated, the selected in an ad campaign is a very important parameter that significantly impacts the campaign’s performance.
Contrary to what is currently considered in the digital marketing sector, is not just another irrelevant metric. If not, it is a key element when defining campaign strategies for any business: businesses such as the ones we have seen throughout the article and through which we have understood and demonstrated the relevance of optimizing FC.
The main contribution of our work is proposing a novel and systematic methodology that allows advertisers to optimize their business goals by making informed decisions on the best value to be selected. To this end, we can construct graphs based on historical data of the advertiser that, for instance, depict the expected evolution of the ROAS as we increase the value. Our methodology follows a data-driven approach that exploits internal information from the advertisers such as CPM, CR, or AOV, to deliver ad hoc curves that allow selecting the optimal value to optimize business goals. For instance, in this paper, we show how selecting the appropriate allows maximizing the revenue, guaranteeing a certain return on ads expenditure (i.e., the profitability).
Even though we face business cases that seemingly may not require the use of the FC, studying its impact on the campaigns is still important. For instance, if we think of brand awareness campaigns, where the goal is to increase brand recognition rather than increasing sales or users acquisition, someone could wrongly think that the more impressions, the better. However, we can use the click rate as a proxy that implicitly includes the interest or attention of the users. A drop in the click rate may indicate that the company is starting to fail to capture the users’ attention. While multiple factors may cause this, one of them might be the overexposure of the users to the same brand. Therefore, analyzing the impact of the in brand awareness campaigns would also be relevant to understand whether setting a value (even if it is high) can help improve the business goal.
The second contribution of this paper is proposing an alternative method on the way we count impressions towards the frequency cap. In contrast to the standard approach in the industry (referred to as Absolute method) that counts all the impressions irrespective of users’ interactions with those impressions, we proposed a method that only considers non-clicked impressions towards the (referred to as non-clicked impressions). We show that the non-clicked based approach outperforms the absolute method, especially for values lower or equal than 10. Therefore, this alternative method to restrains the number of impressions can help marketing directors improve the performance of their campaigns. As the profitability of this method is always better than the industry standard, then when using the same budget, the revenue will be increased.
Most of the players using the in their daily operation rely on the experience of professionals configuring ad campaigns to define the value. However, we believe that the definition of the value should be based on data-driven and probabilistic methods that exploit the historical information from an advertiser. This requires defining systematic methodologies that help advertisers (or companies representing them, such as agencies) make informed decisions to configure values to achieve the desired business goals.
Concerning the industry, our results show that it is necessary to consider alternative strategies that may be more effective than the industry standard approach. Therefore, we recommend replicating our method to set a new standard that will improve the overall performance of digital campaigns. If this method is widely used, it will also improve the users’ experience with digital marketing.
All previous discussion means that there is a change that people responsible for the marketing strategies should implement. If they decide to start using this method, they can implement the based on data instead of expert knowledge. Having a data approach allows for more reliable methods to ensure the business objective and more scalable activation of the campaigns.
The methodology described in this paper can be used to design effective strategies that can be applied to any other industry, especially those with always-on marketing campaigns. Furthermore, our methodology can be replicated for different companies, as long as they have data that can be used to infer the user paths. Therefore, we can make informed decisions to select the , leading to more profitable campaigns.
The main concern for replicating the methodology lies in obtaining the data needed for conducting the analysis. This methodology works better on companies that have always-on marketing campaigns. Otherwise, there is the risk of working with non-consistent data that will show unrealistic user paths, leading to wrong conclusions.
Throughout this article, we have focused on the benefits and implications of this new methodology, which allows advertisers to select the to guarantee a certain ROAS on businesses or their advertising agencies. However, we have not talked so far about the people responsible for putting it into practice. Programmatic traders or digital marketing specialists who work with display campaigns in Youtube, GDN, Microsoft Advertising, or Facebook are very interested in knowing the optimal to apply when setting up a campaign. They also underestimate the importance of this metric, and as we have mentioned previously, they usually rely on their previous experience to determine the value of the they apply in the campaigns, and they increase or lower it blindly and are guided by intuition when optimizing campaigns. For these marketing specialists, knowing precisely the optimal that they should apply to the campaigns will not only help them improve the results of their campaign and achieve their goals faster, but it will also save them valuable time that they can dedicate to reinforcing the campaign in other areas that they need their attention. If they can achieve the campaign objectives faster, fewer resources (time and people) will need to be spent on advertising management. This again means more cost savings for the company or agency that manages the marketing investment.
We demonstrate the relevance that optimizing can have in the digital marketing ecosystem and how all participants (business, agencies, marketing specialists, and users) benefit from having it defined optimally.
6. Conclusions, Limitations, and Implications
The excessive number of impressions sent to the user by the advertisers cause the users to get annoyed with products they are not interested in. At the same time, it causes the advertiser to waste vast amounts of money. The industry is already aware of this serious problem. Thus, a solution has been designed to deal with this problem; that solution is . At this point, advertisers should decide the number of impressions they will send to the user.
This solution is based on the idea of capping the number of impressions received by a user. The number of impressions for an advertiser is capped to a certain value. The is based on the hypothesis that the more impressions the user receives, the less likely they will be to become interested in the advertiser’s products. The more impressions the user receives, the more likely they will ignore the advertiser’s products. This solution will significantly increase the advertiser’s campaign’s performance.
With the research conducted on this paper, we have confirmed this hypothesis. We have found that the interaction ratio tends to decay as the number of impressions received by the user increases. This means that for advertisers it is crucial to find the correct number of impressions to maximize the performance of their campaigns.
Nowadays, is considered a secondary parameter for the campaigns’ performance based mainly on experience. In our study, we have shown the relevance of this parameter that directly impacts business profitability. Therefore, it should be considered as the main parameter when designing the strategy for a new marketing campaign.
The methodology developed along the paper can help management people understand how feasible the targets are for a particular campaign to define them better. Furthermore, it helps them face the problem as a business problem where they are looking to maximize the company’s profitability. From an activation point of view, it will be used to decide on the best to maximize the campaign’s performance. Furthermore, a brand new method to decide when to stop sending new impressions to the users has been designed to improve on the current one.
Although the paper has shown that the number of impressions that the user receive is very relevant and will have a relevant impact on the performance of the campaign is important to highlight that multiple factors impact the performance of the campaign, additionally on the other factors as in the audience, the creative that is being used, or the landing page should be considered. Furthermore, in our study, we focus on the total number of impressions in the cookie lifetime. However, the number of impressions that the user receives each hour, day, or week must be relevant.
We hope that our work will serve the industry and the academy, encouraging them to continue investigating how to improve the performance of marketing campaigns using data and machine learning. Innovative methodologies and new approaches in order to understand the digital ecosystem and users are essential for companies that want to increase the profitability of their advertising campaigns and grow the demand for their businesses. We have opened the investigation about with our work, but there is still a long way to go. For instance, something that we have not covered in this article, and that we believe could be relevant to understand optimal delivery better, is to consider the impact of changing the number of impressions but at different timeframes or to different types of users (e.g., young/old/new users). Furthermore, suppose we could continue this study and collect large datasets from different industries. In that case, we could get relevant insights into user behaviour that would allow companies to create better marketing strategies and save investment while improving the relationship with their potential customers.


