1. Introduction
This paper is an extended version of the paper presented at the 14th International Symposium INTELS ’20, which will be published after the conference. The paper proposes an improved and expanded methodology that is tested on new material of urban conflicts.
Differential features of the human brain cognitive systems and artificial intelligence have a rather long history of development [
1]. One of the relevant tasks is to analyze social media users’ perception of certain situations, events and phenomena using new technologies. The main source of information, in this case, is digital footprints, among which unstructured linguistic data are of importance. Neural network technologies open up new possibilities for studying the specifics of perception of a situation on large volumes of verbal data. Various aspects of linguistic representations in artificial neural networks have been presented in studies over recent years [
2,
3,
4], and the speech behavior of Facebook users enabled creation of new personality constructs [
5]. Various aspects of perception are presented in numerous works, for example, speech perception [
6], and Bayesian analysis of data from cross-linguistic studies on color and memory perception [
7], etc. It should be noted that the new autoregressive language model GPT-3 with 175 billion parameters marked a new stage in the field of natural language processing technologies [
8].
The analysis of speech behavior and perception of social media actors can be applied in a wide variety of areas, particularly in intelligent control systems gaining popularity in recent years [
9,
10,
11].
The demand for intelligent control systems explains the emergence of numerous scientific works in this area [
12,
13,
14,
15,
16] It should also be noted that researchers show great interest in the study of intellectual control of robotic systems [
17,
18]. In urban projects, intelligent control systems have also taken a strong position; these systems are especially in demand in the structure of a smart city. The accumulation of knowledge about the complexity of the modern urban environment has led to doubts about the effectiveness of management approaches based on institutional, administrative and geographic isolation and has drawn attention to the search for ways of intelligent urban management [
19]. Thus, building automation and advanced sensing [
20], electronic solutions to reduce social isolation and reconstruction of problem areas [
21] have been developed and are actively used; and the social dividends of using information technologies in urban systems were also analyzed [
22].
In addition, in the 21st century, the requirements for expertise as an important element of multi-criteria decision support tools designed to guide the most complex and uncertain decisions have become more stringent. The organization and mechanisms of expert decision-making support with the help of E-Expertise and Modern Collective Intelligence obtained a special status [
23]. These algorithms and the characteristics of well-reasoned decision-making turned out to be in demand, especially in the field of environmental protection and safety [
24]. It is the state of the environment that becomes the most important indicator of the urban system efficiency [
25].
The development of the urban structure inevitably collides with the resistance of residents since, to some extent, it affects the symbolic space, the historically formed image of the city. The transfer of a significant part of communications to the digital environment makes it relevant to study conflicts in a virtual environment, develop new techniques and approaches, in particular, those involving text mining, machine learning, and agent-based modeling [
26]. In addition, network data turn out to be an indispensable empirical material for the study of social processes, behavioral characteristics, perception of various events and phenomena by residents, and allow real-time analysis on large data sets [
5].
It can be assumed that the analysis of social media data and intelligent control systems technologies have great potential for timely response, detection and defusing of urban conflicts, search for compromise solutions to improve the efficiency of urban systems management.
The aims of this study were to develop and test an algorithm for analyzing urban planning conflicts. This paper presents the results of research on the development of methods and approaches to the construction of mathematical and neural network models for analyzing the perception of social networks users on the basis of their digital footprints, as well as for the rapid identification, prevention and resolution of urban planning conflicts necessary for effective urban systems management.
Our research questions are as follows: Will the results of all applied models be consistent? In addition, will the developed approach make it possible to identify conflict zones around urban development projects?
Hypothesis 1 (H1). The approach of combining mathematical and neural network models to analyze the social media users’ perception based on their digital footprints allows for the effective analysis of social tension or its absence around urban development projects.
Sections of manuscript: Introduction. 2. Materials and Methods. 2.1. Text Analysis Methods. 2.2. Approaches to Mathematical Modeling. 2.3. Formalization and Mathematical Statement of Problem. 2.4. Mathematical Models. 2.4.1. Mathematical Statistics. 2.4.2. ODE and Its Parameterization. 3. Results. 3.1. Neural Network Semantic Model. 3.1.1. Rating of Digital Platforms According to Actors’ Preferences. 3.1.2. Semantic Network Analysis. 3.1.3. Sentiment Analysis of the Content. 3.1.4. Analysis of the Topic Structure and Content Analysis. 3.1.5. Analysis of the Users’ Perception of the Situation. 3.2. Mathematical Modeling Results. 3.2.1. Statistical Analysis of Data. 3.2.2. Autoregressive Models ARIMA. 3.2.3. ODE 1 Models. 3.2.4. ODE 2 Model. 3.2.5. Analysis of Model Accuracy. 4. Discussion. 5. Conclusions. Author Contributions. Funding. Institutional Review Board Statement. Informed Consent Statement. Data Availability Statement. Conflicts of Interest.
Appendix A. References.
2. Materials and Methods
The data for the study was obtained from social networks, microblogs, blogs, instant messaging, forums, reviews, videos dedicated to the construction of the North-Eastern Chord (NEC) in Moscow, collected for the period between 1 January 2019 to 20 September 2020, 13,827,304 messages. The dynamics of messages are shown in
Figure 1.
Data analysis was carried out using the Brand Analytics monitoring and analysis system for social media and mass media.
Several parallel models were used to optimize the analysis of the social media users’ perception based on their digital footprints. The results were obtained using the semantic neural network model. In parallel with the neural network model, statistical analysis of experimental data was performed, and dynamic models of processes were built.
The types of models used for data analysis were: a model based on the neural network paradigm of using neural-like elements with temporal summation of signals [
27], statistical analysis [
28] and differential equations [
29].
2.1. Text Analysis Methods
Using a model based on the neural network paradigm of using neural-like elements with temporal summation of signals (the so-called corticomorphic associative memory), the topic structure of the database and the results of summarization were analyzed, which made it possible to extract explicit information. On the other hand, such a network representation of the text made it possible to isolate and interpret the semantic network in the form of a set of interrelated concepts. With the help of the semantic network, implicatures, semantic accents that are most important for actors were analyzed and rated [
27].
Sentiment analysis was performed using the Eureka Engine sentiment determination module. The technique is based on a statistical algorithm for conditional random CRF fields using sentiment dictionaries. Sequences of lexemes are used as input data, after which the algorithm calculates the probabilities of possible sequences of tags and chooses the maximum probable one.
Content analysis was performed in accordance with [
30,
31] using the AutoMap text mining tool.
For visual analytics, the Tableau platform was used.
2.2. Approaches to Mathematical Modeling
Today, complex processes require mathematical and computer modeling to be managed. The approaches to mathematical modeling have seen substantial change thanks to the explosion in available data and to the advances in machine learning. Complex nonlinear dynamics arise in many fields of science, but uncovering the underlying differential equations directly from observations poses a challenging task. Paper [
32] is the first to propose a method that can automatically generate symbolic equations for a nonlinear coupled dynamical system directly from time-series data. The most interesting of the recent studies are papers that dwell upon Gaussian processes [
33], physics-informed neural networks, i.e., neural networks that are trained to solve supervised learning tasks while respecting any given law of physics described by general nonlinear partial differential equations [
34].
By using state-of-the-art methods to derive differential equations from data, this paper investigates the applicability of such methods to sociological modeling on social media data. However, the problem covered herein has several peculiarities that set it apart. The complexity of this problem stems from its specific features, such as data format. Data is textual. Neural networks and cluster analysis are applied to convert text into numerical data.
Section 2.3 addresses the solution. Another issue is that models are built upon data of the object’s implicit variables. Implicit variables are defined herein as variables that are functions of the modeled object’s state variables. Observational data are known to be very noisy. Models built herein are based on earlier research in sociophysics [
35,
36,
37,
38]. The problem is relevant in light of the recent events (terror attacks, strikes, etc.).
This paper presents mathematical problems in the context of addressing two main classes of problems: (1) using machine learning to build mathematical models on observational data sets; (2) behavioral analysis of the system based on such models. The developed approaches and models are proven effective by building parallel models and checking the resulting solutions for consistency with the solutions derived from visual data analysis.
2.3. Formalization and Mathematical Statement of Problem
Section 2.1 describes how text mining isolated a cluster of texts mentioning attitude to the subway line project from the entire social media data array. Text mining also split the entire cluster into subclusters based on attitude: negative, positive, or neutral. Filtered and clustered data helped word the problem.
A project is planned that may affect the interests of residents in a specific, limited area. The problem is to build a mathematical model to assess the utility of this project on social media data only without any additional research such as population surveying. The utility is defined herein as the residents’ positive attitude to the project.
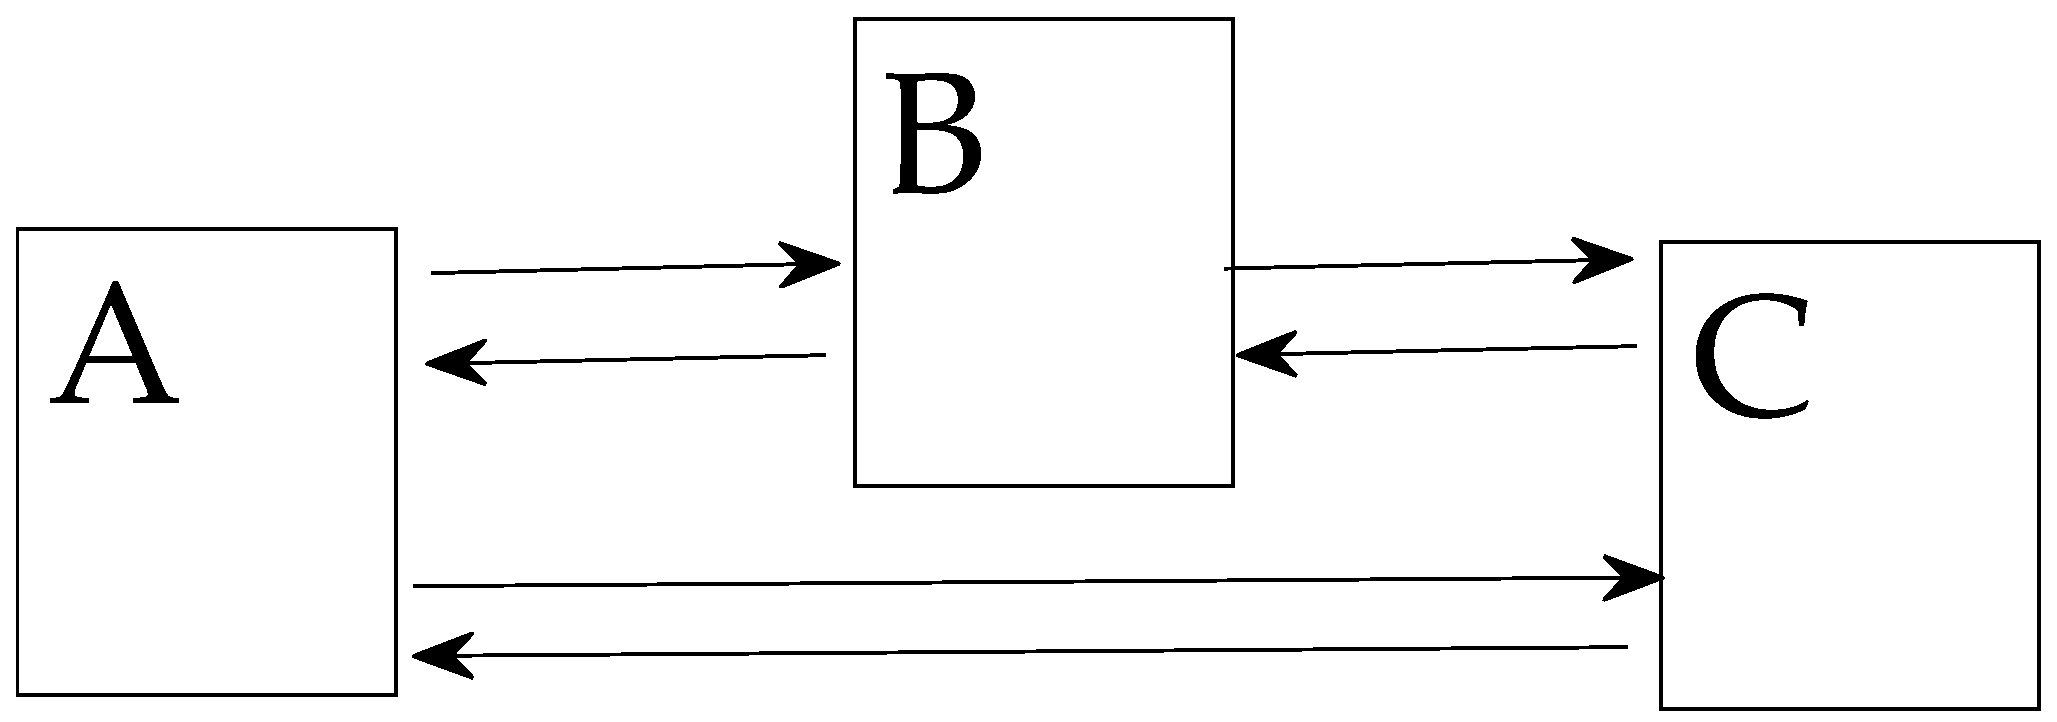
Let:
A be the subpopulation with a negative attitude to the project;
B be the subpopulation with a positive attitude to the project;
C be the subpopulation with a neutral attitude to the project.
Social attitude to the project could be assessed by analyzing the size of these subpopulations in dynamics. However, such data is not available. Therefore, it is proposed to estimate such subpopulations by means of digital footprint. The models are based on the assumption that the community consists of three subpopulations A, B, C, holding a negative, positive, or neutral attitude to the project. Let N(A), N(B), and N(C) be the sizes of the sets A, B, C, and D be the sum of the disjoint sets D = A + B + C. Subjects may move from one group to another as a result of communication or an event. Therefore, the percentage of each subpopulation may change over time.
Figure 2 shows the flowchart of the modeled objects. Let D1 be the set of social media actors whose posts and comments contain one of the three possible attitudes to the project. Assume that the set D is mapped to the set D1,
Assume that the mapping F is such that the percentage of negative/positive/neutral groups in D1 fully matches that in D.
The objective is to use digital data of the actors in D1 to model the dynamics of the residents’ attitude to the project.
Mathematical Statement of Problem. Let X(t), P(t), Z(t) be the number of posts at the time t that express negative, positive, or neutral attitude to the project, respectively; let S(t) = X(t) + P(t) + Z(t), t = 1, 2, …, n.
Consider society as a dynamic system. Let the state of the dynamic system at the time t be described by the vector Y(t) = (X(t), P(t), Z(t)). The objective is to use observations of X(t), P(t), Z(t) over the period t = 1, 2, …, n to build a mathematical model to describe the behavior of the dynamic system.
The behavior dynamics of X(t), P(t), Z(t) contains important data: the ratio of these figures; for this reason, the figures are normalized for modeling. The normalization rule is as follows: x = X/S; p = P/S; z = Z/S, then the follows holds: x + p + z = 1, y = (x, p, z), .
To make a managerial decision on the basis of the built mathematical models, introduce the preferential attitude and its numerical representation. Let χ be a non-empty set. Interpret the elements of this set as a possible choice of attitude to the project:
(negative, neutral, positive). Numerical representation of the preferential attitude ≻ is such function
V:
χ →
R that
The function V(∙) can be defined in different ways, e.g., as a function of the first differences of a time series.
2.4. Mathematical Models
2.4.1. Mathematical Statistics
Models based on mathematical statistics are used herein as parallel models. Parallel models can be seen as something similar to cross-validation in machine learning.
The quality of the solution to the symbolic regression problem was assessed by means of the calculated paired coefficients.
Considering the data {
x(
t),
p(
t),
z(
t),
t = 1, …,
n} as time series, we can build autoregressive models [
39,
40]. Autocorrelation functions and partial autocorrelation functions were found on the initial data of the time series
x(
t),
p(
t),
z(
t). Studies showed linear ARMA models could be built for these series. ARMA are dynamic statistical models. This study used ARMA models to analyze the behavior of the dynamic systems and to cross-validate the ODE models.
Section 3.2.2 presents the output of the resulting ARMA models.
2.4.2. ODE and its Parameterization
Dynamic systems (DS) are conventionally modeled by differential equations. In order to use differential equations as a solution, one needs to find a differential equation from the observational data. This is an inverse problem. Inverse problems are conventionally solved by analytical or numerical methods. Artificial neural networks are on the rise as a method for finding differential equations from data. The methods are convenient to use in parametrizing differential equations; another advantage is that they handle data noise pretty well—this research utilized machine learning to build differential equations.
Consider the system in question as a dynamic system S, the variables (
x(
t),
p(
t),
z(
t)) being its response to some input
u(
t). Several events (bots, media) can be considered inputs. Let
P be the modeled object;
U be the managerial decisions,
y = (
x,
p,
z) be the system’s response to a control input. With these definitions, state the key problems pertaining to the dynamic system (DS):
This paper investigates the third problem. The other two have been solved in part. DS behavior was described by a system of autonomous differential equations:
The right-side function in (2) was found by two methods, resulting in the ODE 1 and ODE 2 models. ODE 1 models were built in the local domain. ODE 1 models were linear systems of ordinary differential equations; ODE 2 models were nonlinear systems of ordinary differential equations.
The occurrence rate of bots or posts in the media can serve as the variable u(t) in (2). The variable was not used in modeling for this research; however, the variable can be introduced if data is available.
Let us state the mathematical problem for problems written in (1) as forward and inverse ODE solution problems.
Statement of the forward problem.
where
,
,
are the initial conditions. For this forward problem, from the given initial conditions find
. The forward problem is stated to solve Problems 1, 2.
Statement of the inverse problem.
Readings are known for some points. From these readings, find in (3). To solve the inverse problem means to solve the problem of identifying the system, i.e., Problem 3.
ODE 1 Model
The ODE 1 model was built by cluster analysis using the Nelder–Mead method.
Figure 1 shows the non-normalized time series in dynamics. It makes clear that the initial data do not have identical time series. To describe DS behavior in terms of differential equations, the observation interval [0;
n] was split into several subintervals by cluster analysis. A model was built for each cluster. This approach is similar to modeling in the low-mod domain, where the behavior of a dynamic system can be described with only a few variables [
41]. As a result, we were able to choose the simplest writing for the right side in (3) to describe the processes and to track the change in the model parameters in order to analyze the processes in the system.
DS behavior in each cluster was described by a system of autonomous differential equations:
The parameters of the model (4) were estimated by the Nelder–Mead method [
42]. The following function served as the optimization criterion:
Find the optimum of F in (5) for all , .
When estimating the model parameters, set the threshold h. If the optimization (5) for some i,j produces estimates: , then assume .
ODE 2 Model
The ODE 2 was built using symbolic regression. Control problems necessitate equations that describe the behavior of the dynamic system over the entire modeled domain. The structure
in (3) is unknown. Let DS be describable as a nonlinear dynamic system. The nonlinear function
represents the dynamic constraints that define the system’s motion equations. Given that epidemiological models are well-suited for such problems in sociology, the structure of the functions
was written in the form of second-degree polynomials. The first step is to combine data into three large matrices:
where
,
.
Each element in the matrices is a vector. Introduce the coefficient matrix:
where
Then the system (3) will be rewritten as:
The structure (3) is found by solving the optimization problem:
where
is the ith column of the matrix
.
The coefficients
were approximated by an artificial neural network, an MLP with a single hidden layer and the training tuples
, I = 1, …,
n’. Where the coefficients were below the selected threshold h in absolute value, they were equated to zero.
Section 3 presents the solution.
3. Results
3.1. Neural Network Semantic Model
3.1.1. Rating of Digital Platforms According to Actors’ Preferences
At the initial stage, digital platforms were identified where the actors discussed the problems of the NEC construction most actively. After identifying conflict zones, these platforms’ data were used to defuse the conflict.
To discuss topics related to the NEC construction, the actors preferred microblogging (11,864,333), social networks (826,516), videos (560,681), instant messaging (517,164), blogs (55,403), as well as Internet media (2 706), forums (378), thematic platforms (103), shops (11), print media (5), television (1) and review sites (1).
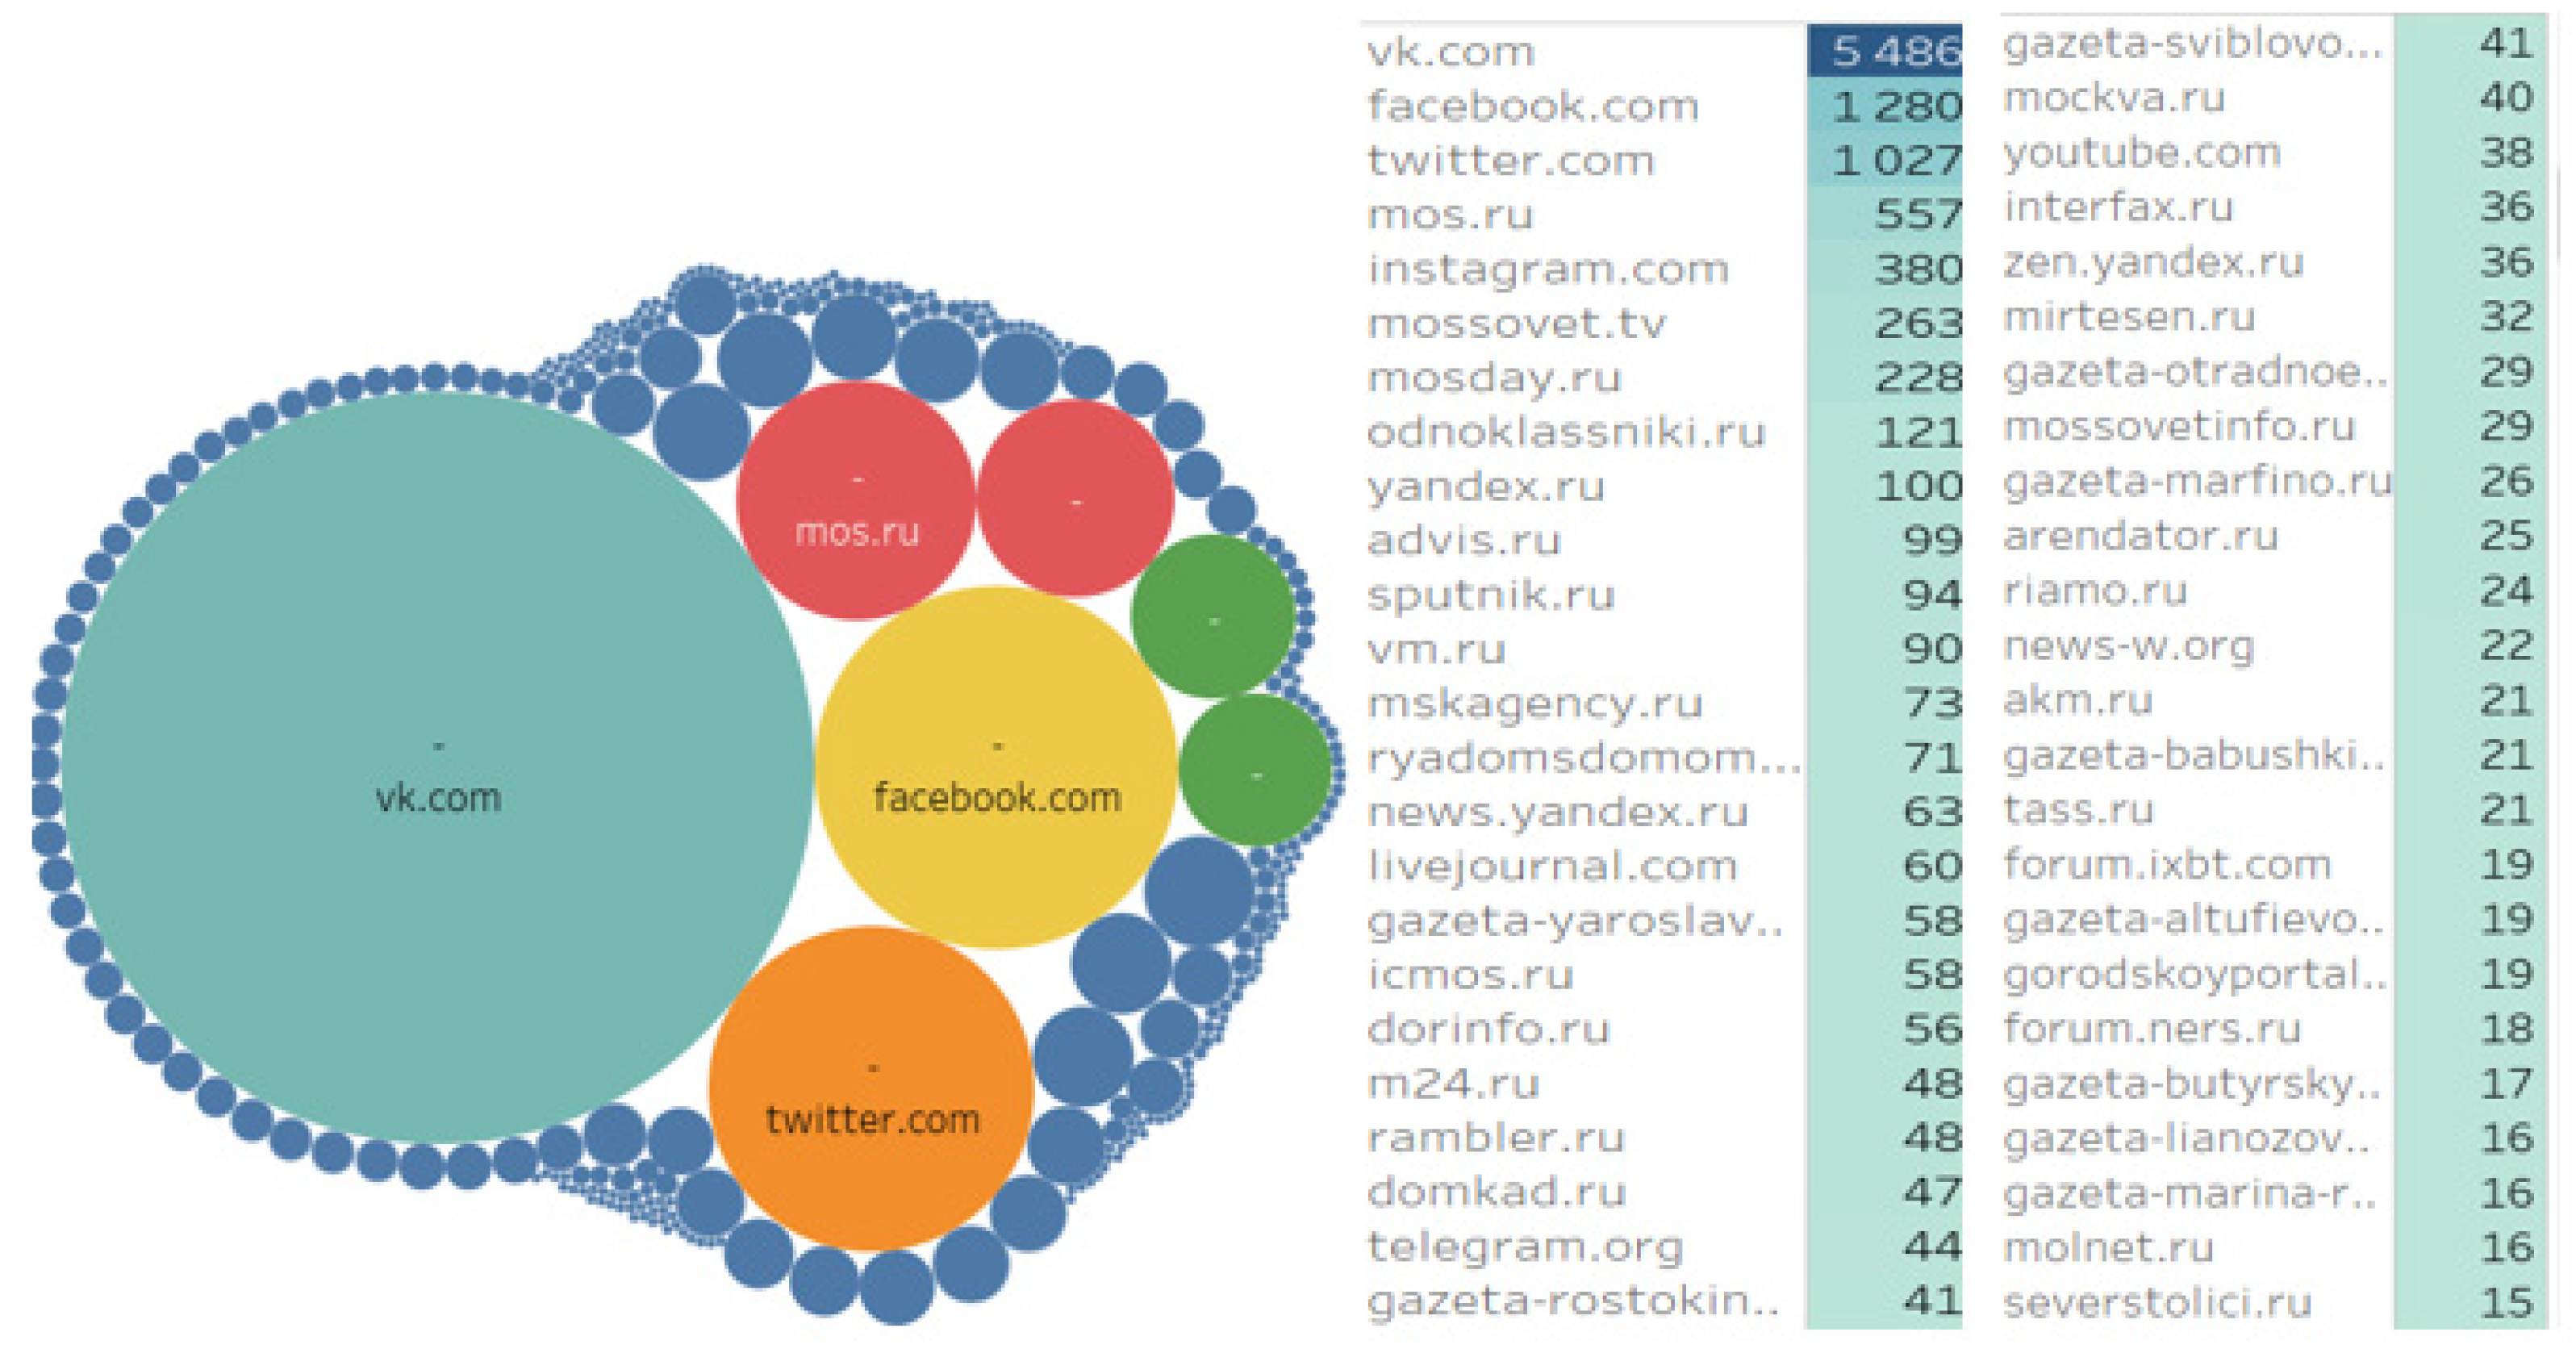
Among the digital platforms where digital content dedicated to the NEC project implementation was most actively disseminated, the social network VKontakte was leading substantially. Top positions were also taken by Facebook, Twitter, mos.ru and Instagram, respectively (
Figure 3).
3.1.2. Semantic Network Analysis
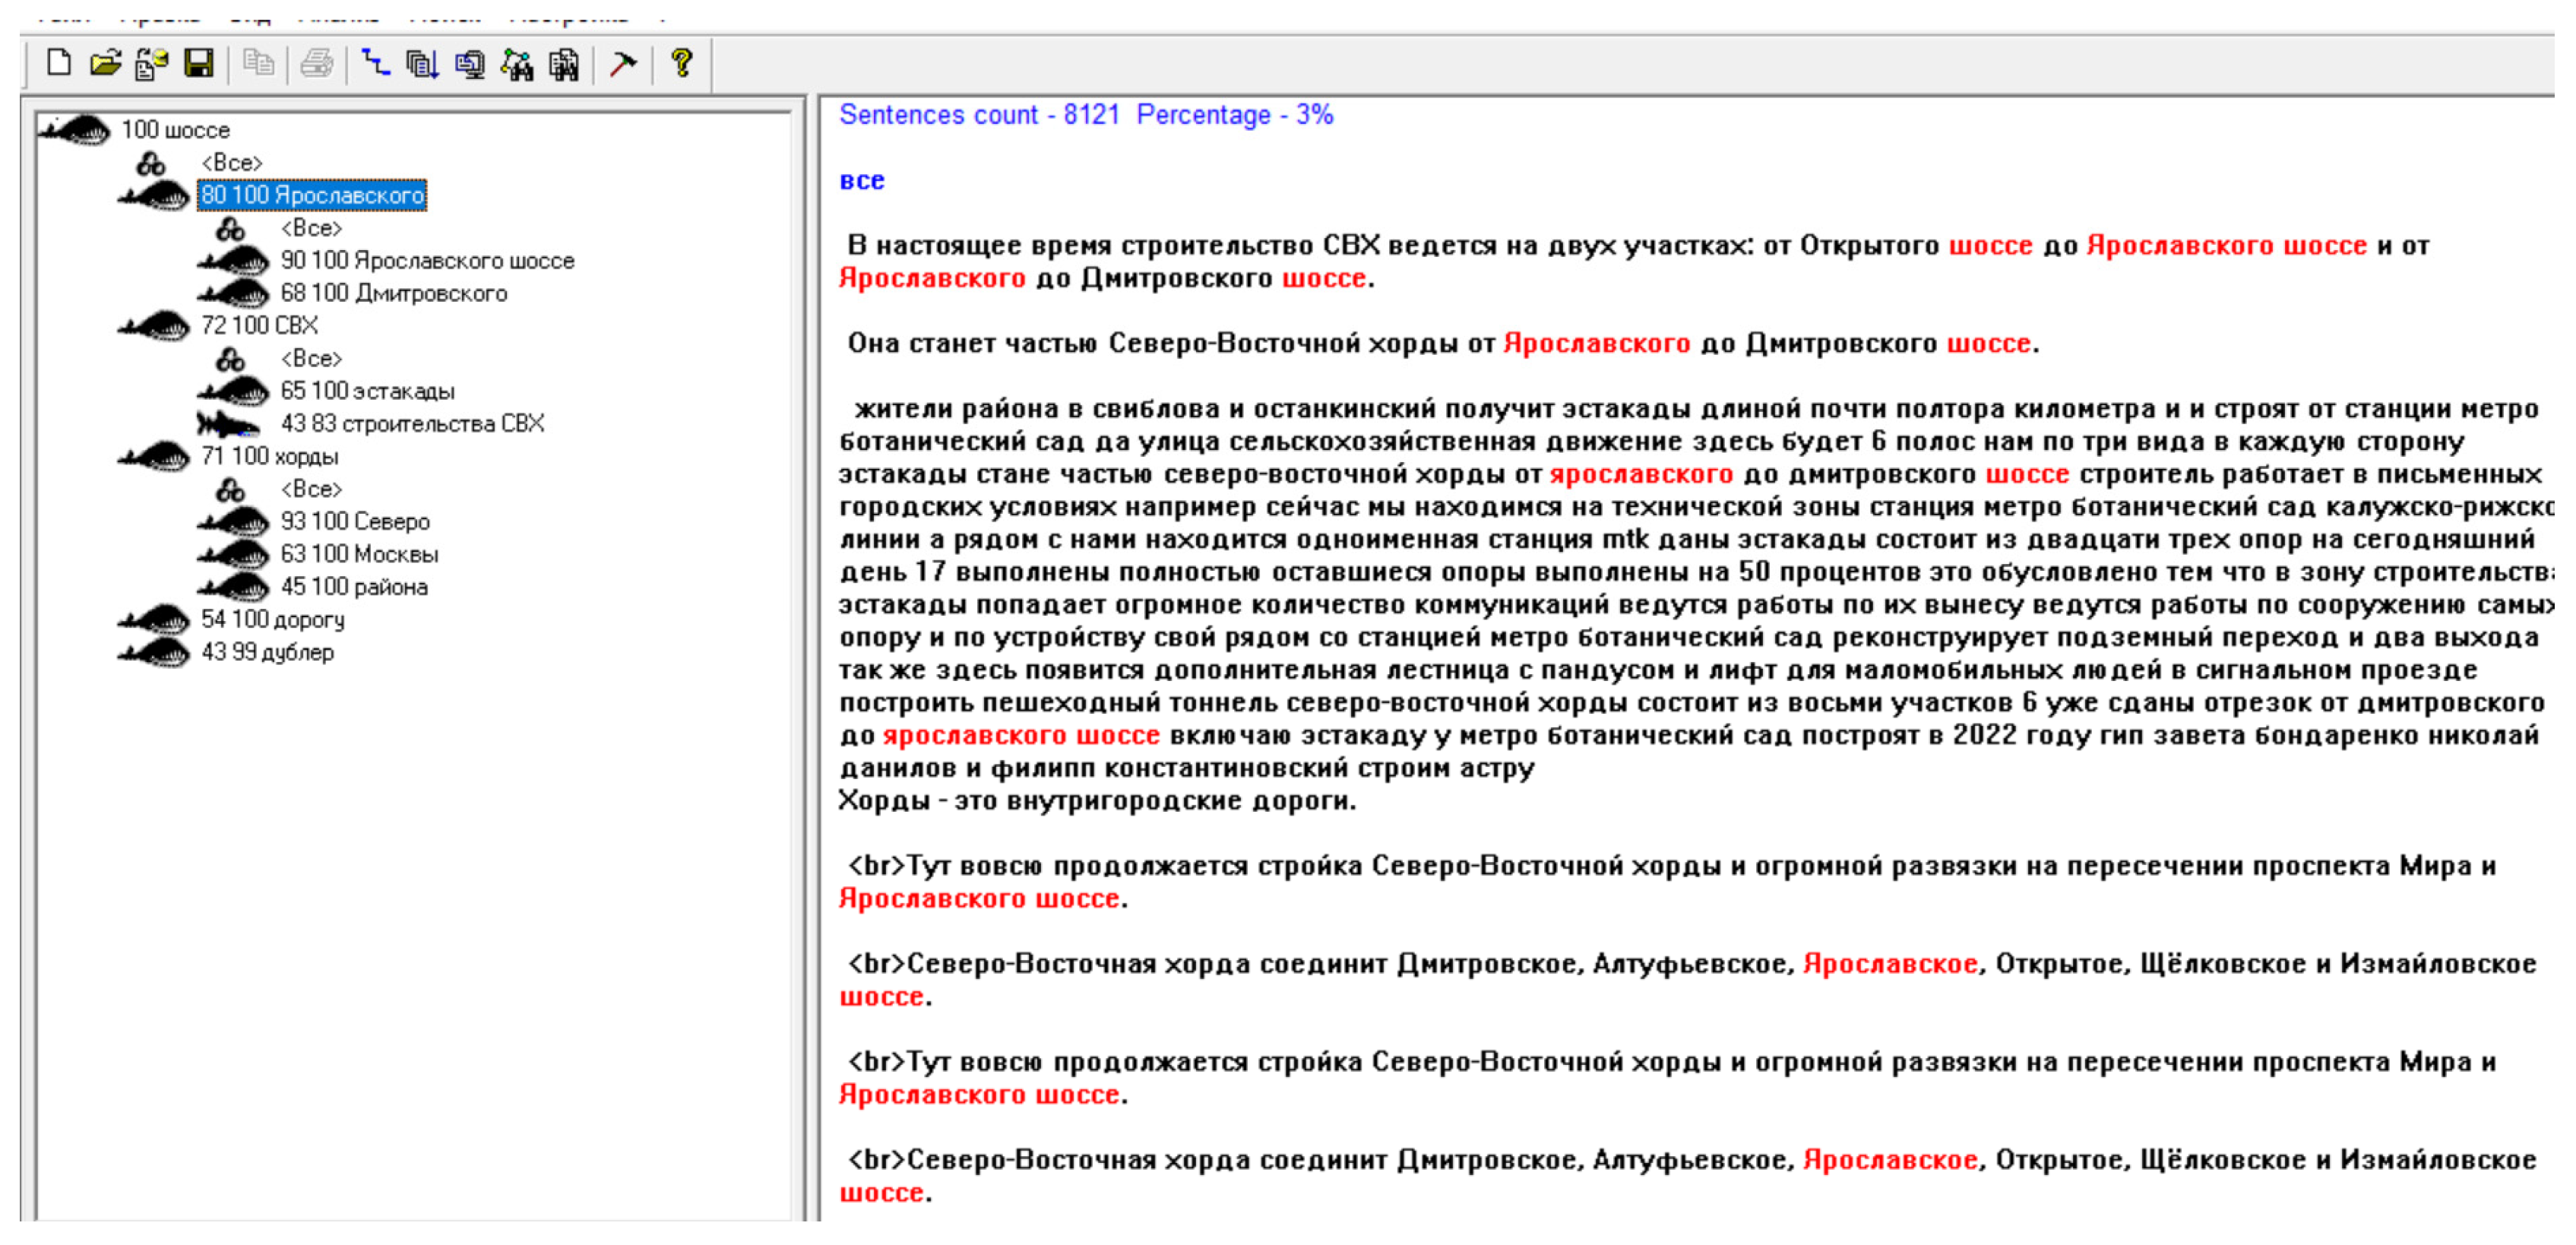
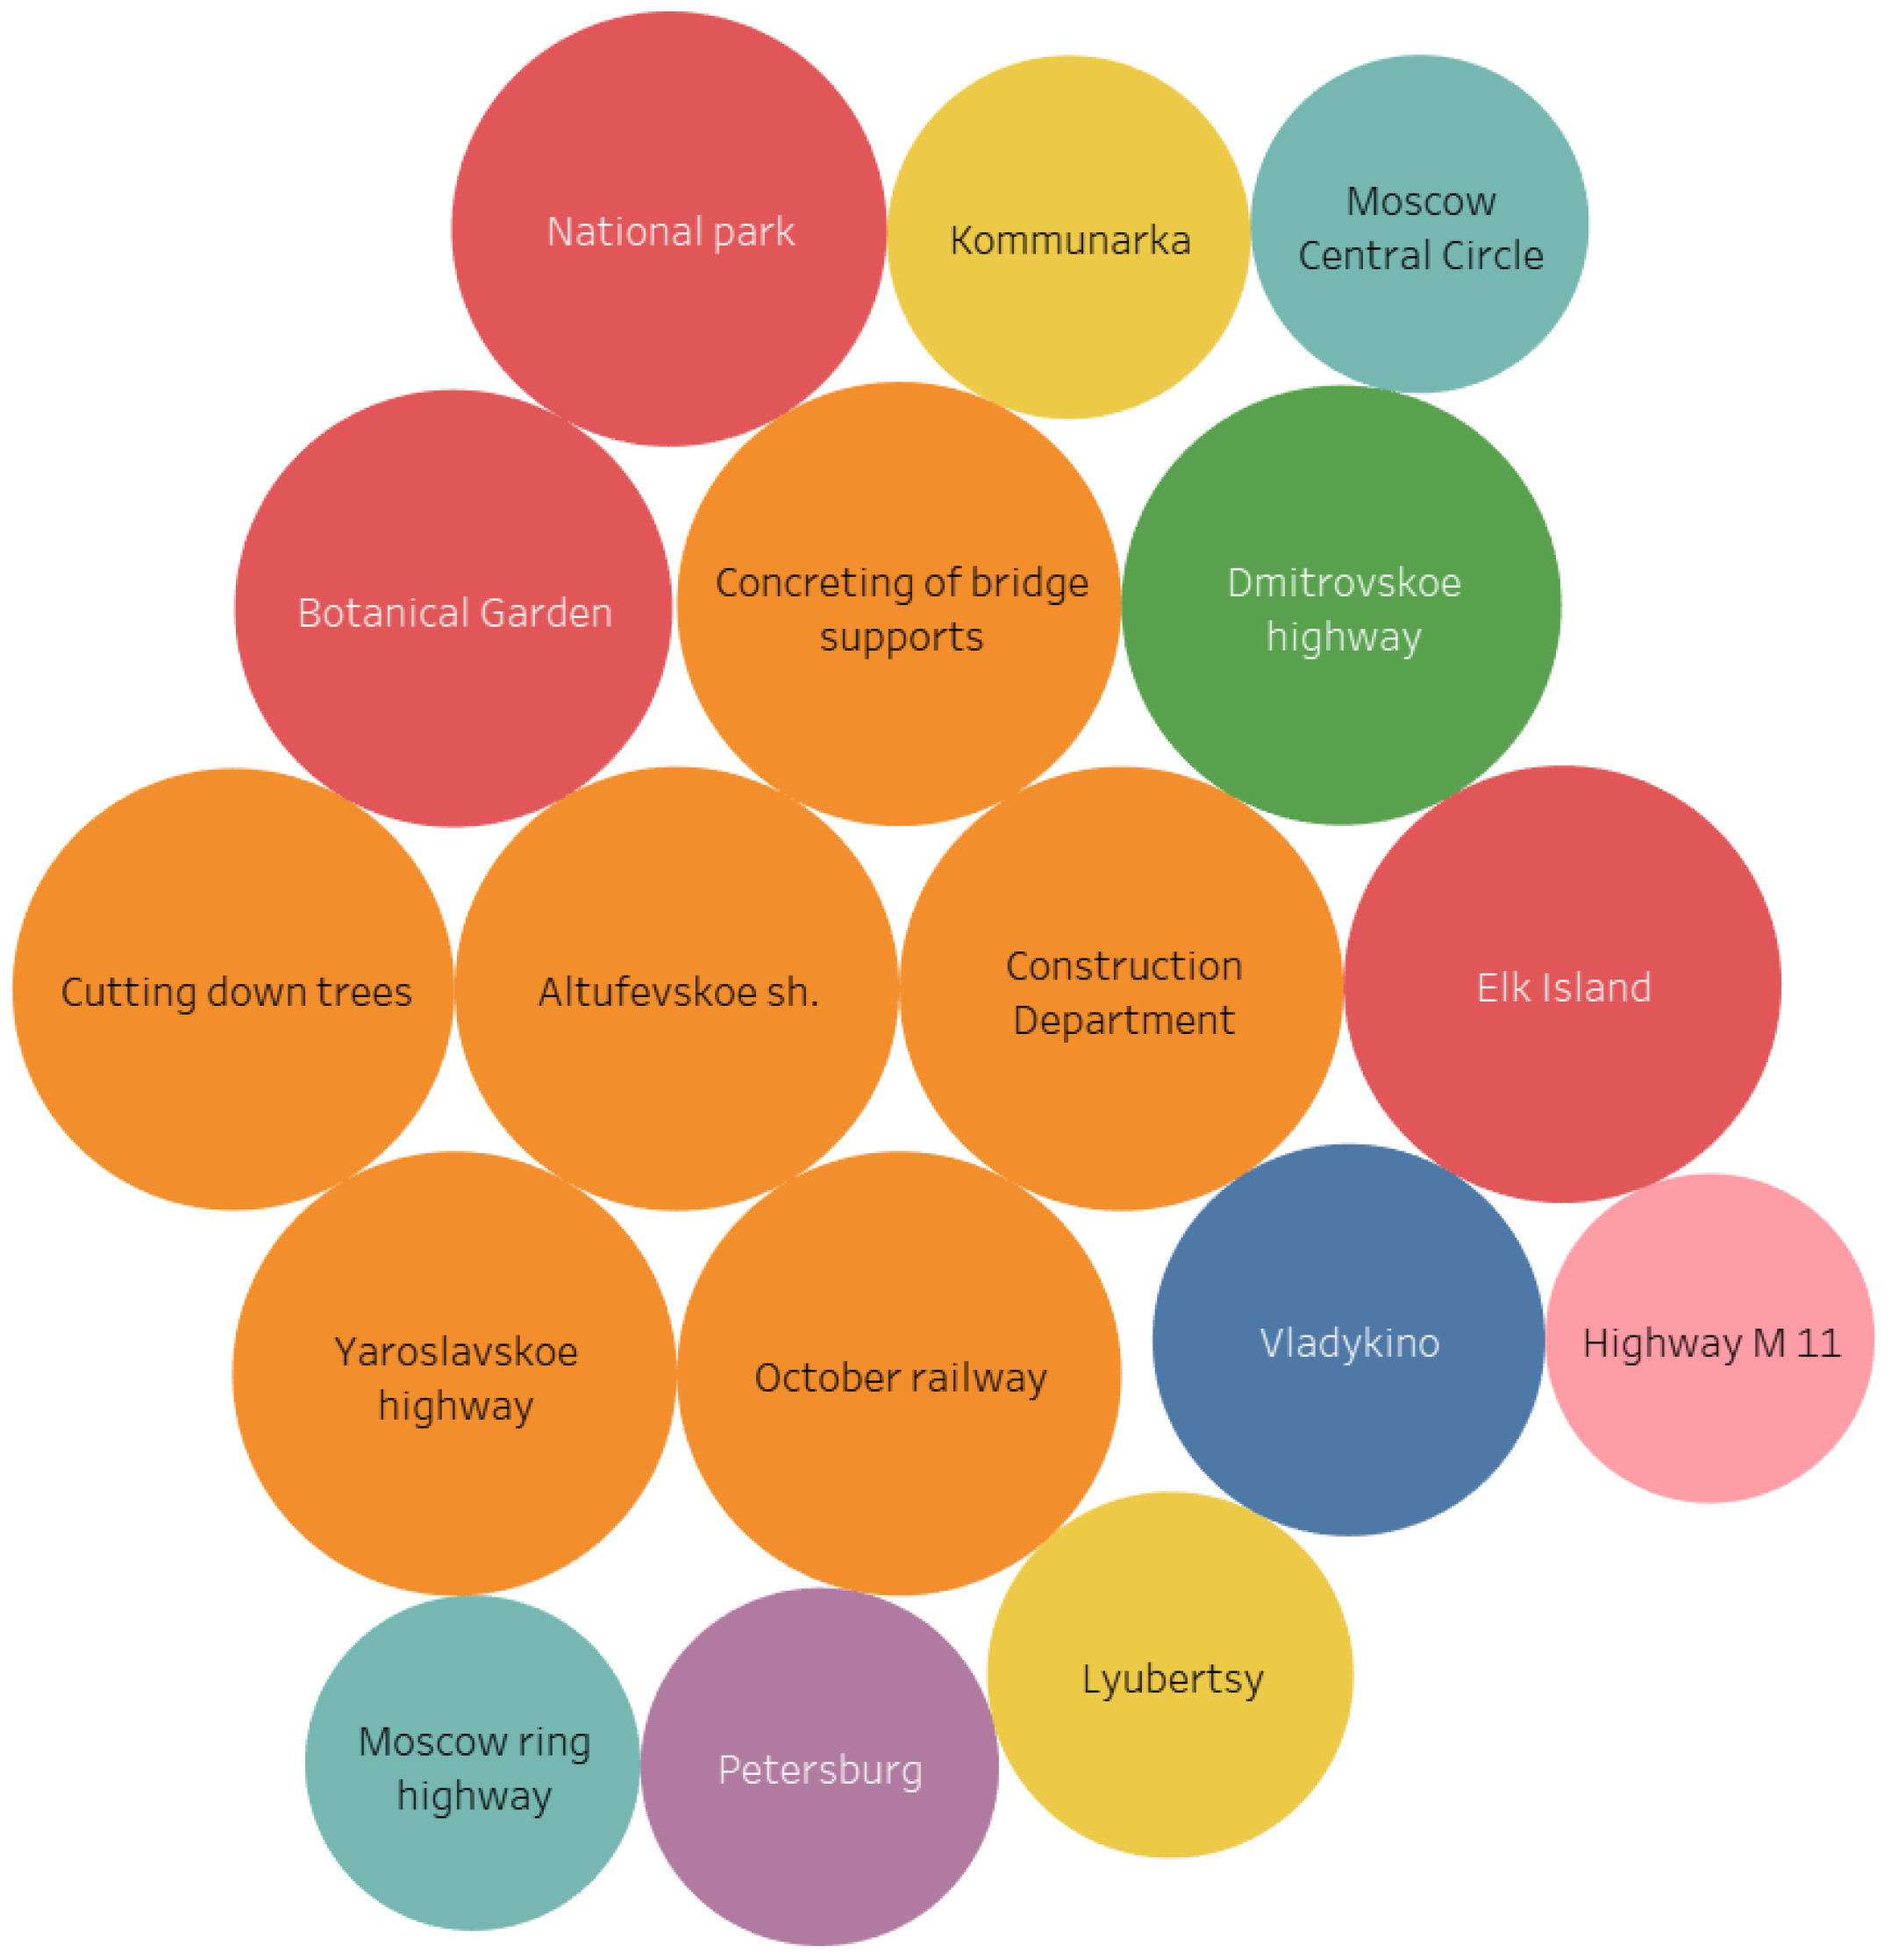
The semantic network of the consolidated dataset shows the semantic accents that prevail when covering the topic of the NEC implementation (
Appendix A). A significant role is played by transport facilities, which are most closely related to the NEC construction, as well as various problems of urban planning policy and construction and technical aspects. Despite the fact that the topic structure and semantic network show the predominance of official content with specific given topics, the core also includes nominations signaling the main claims of residents: Botanical Garden (99), Elk Island (99), National Park (99), cutting down trees (98) (
Figure 4). In
Figure 4, color and size are shared by clusters according to the weight of the vertices.
3.1.3. Sentiment Analysis of the Content
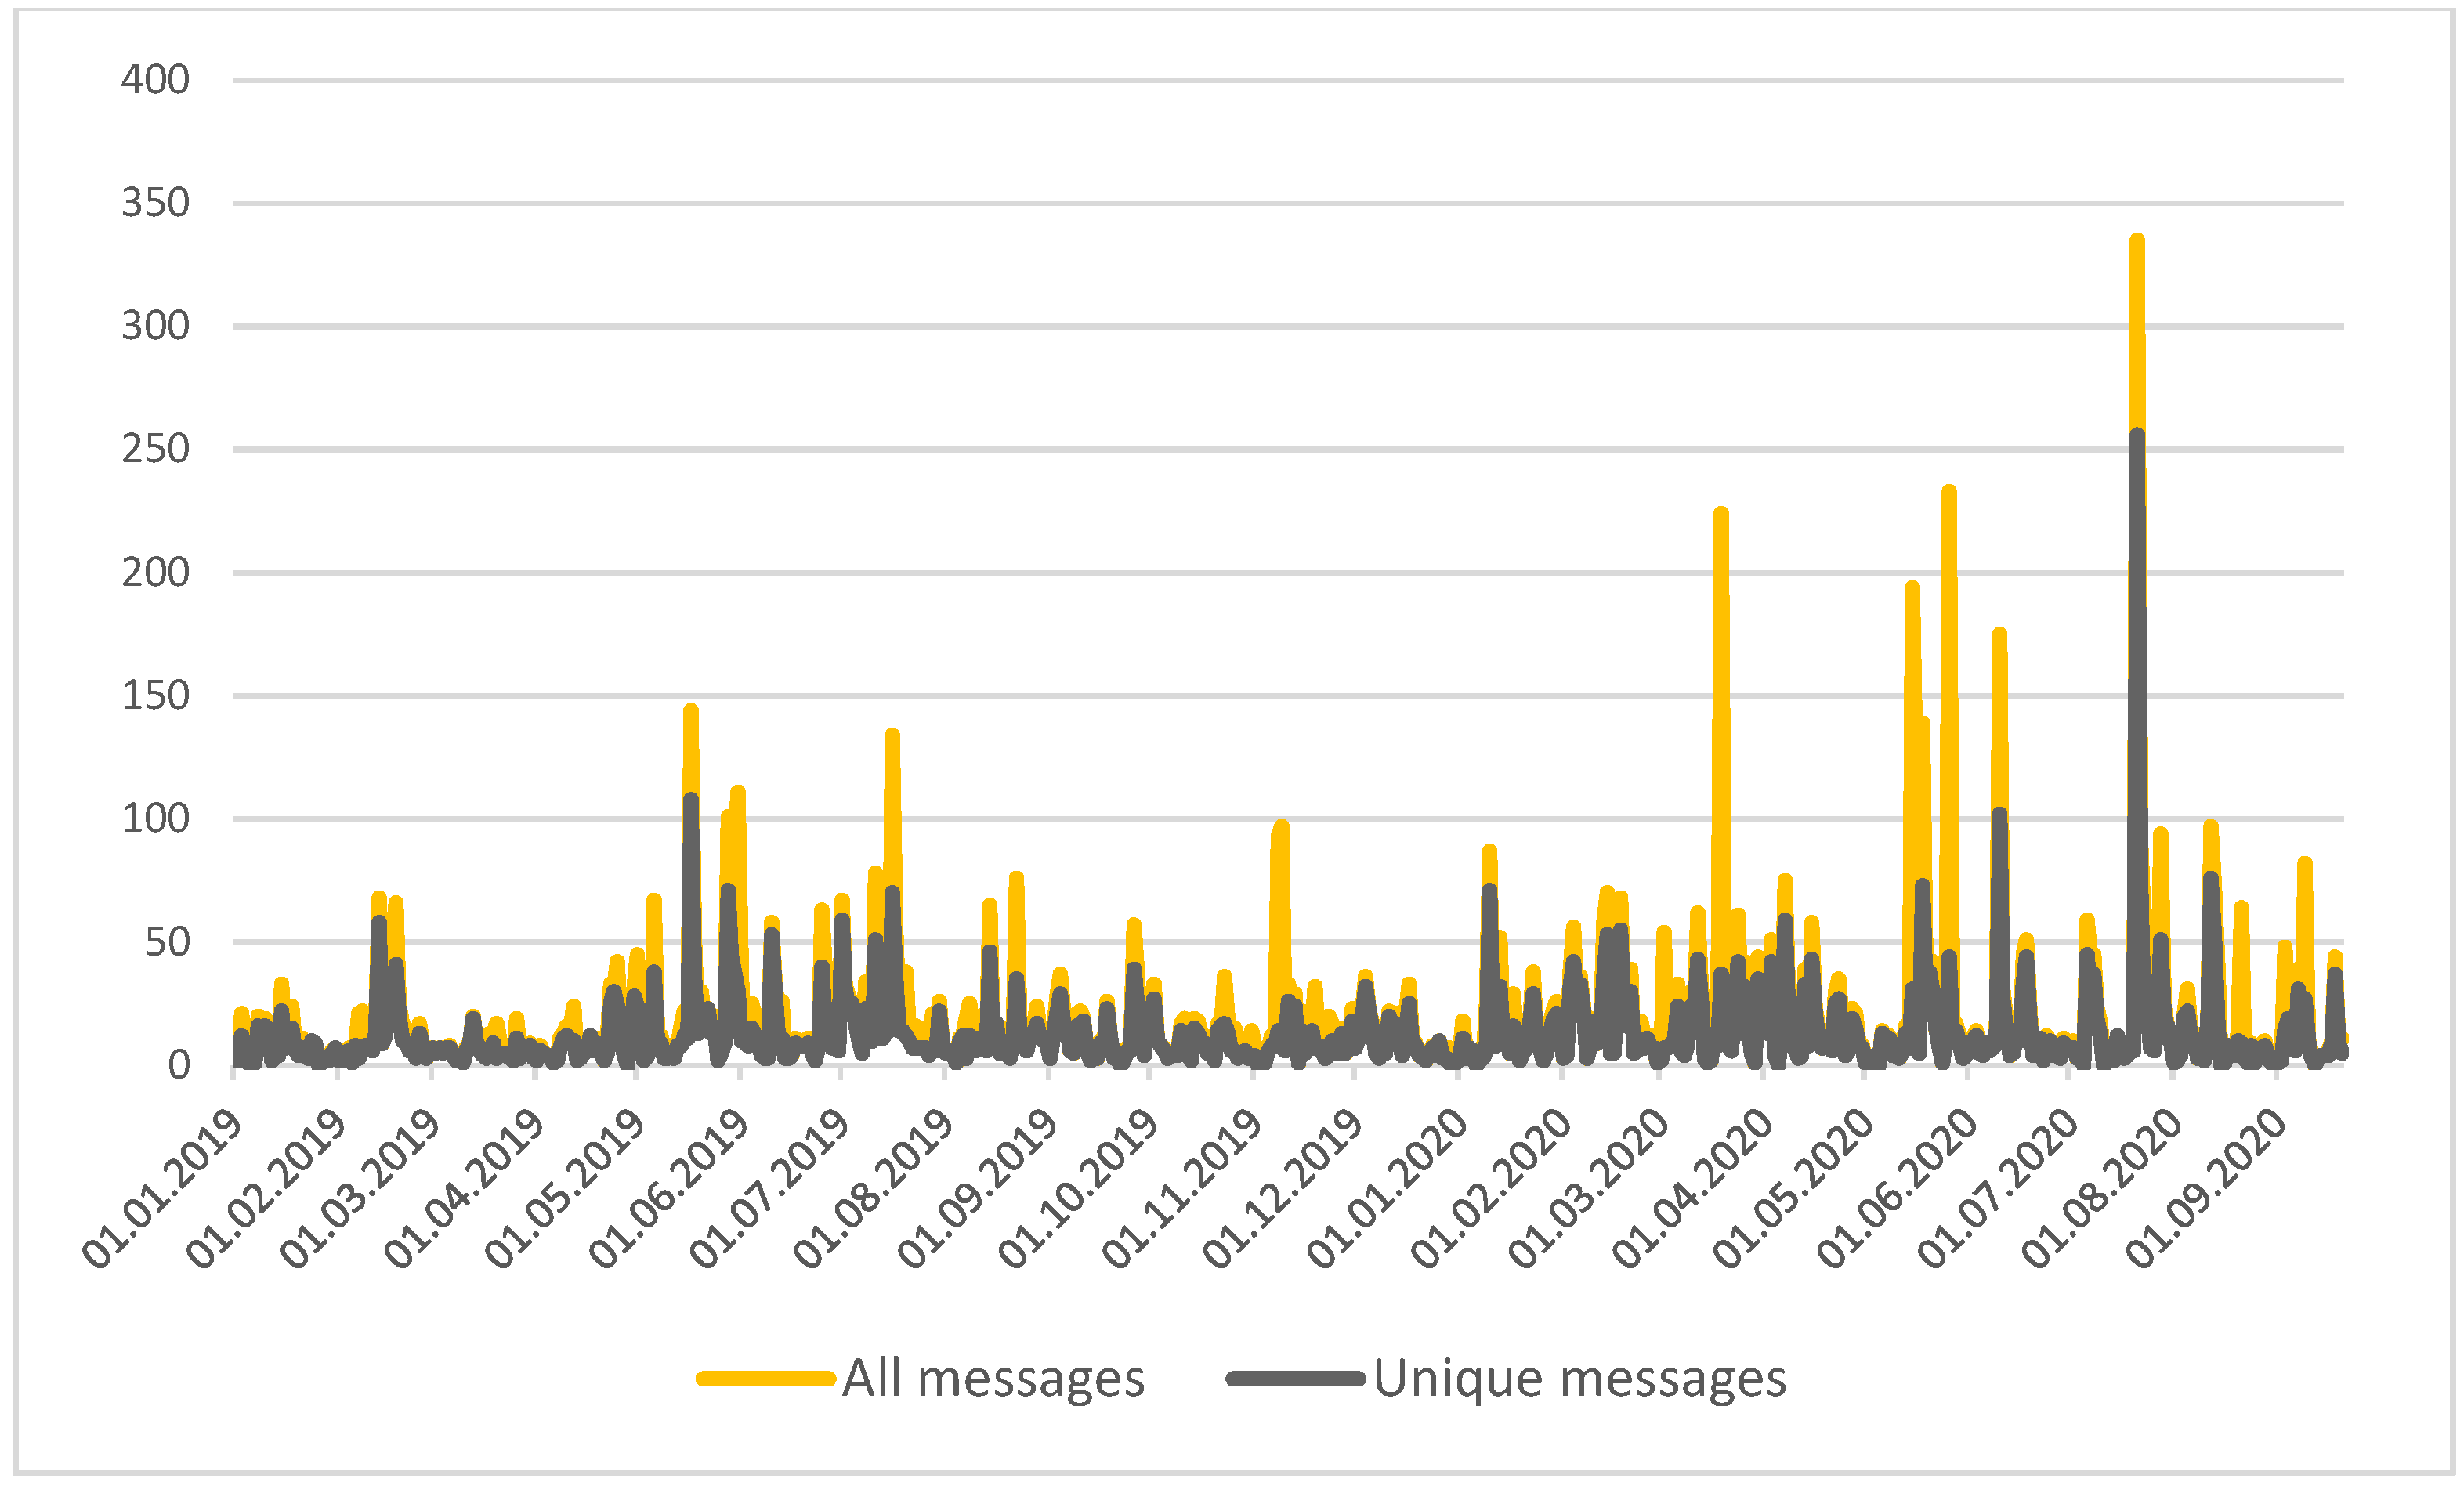
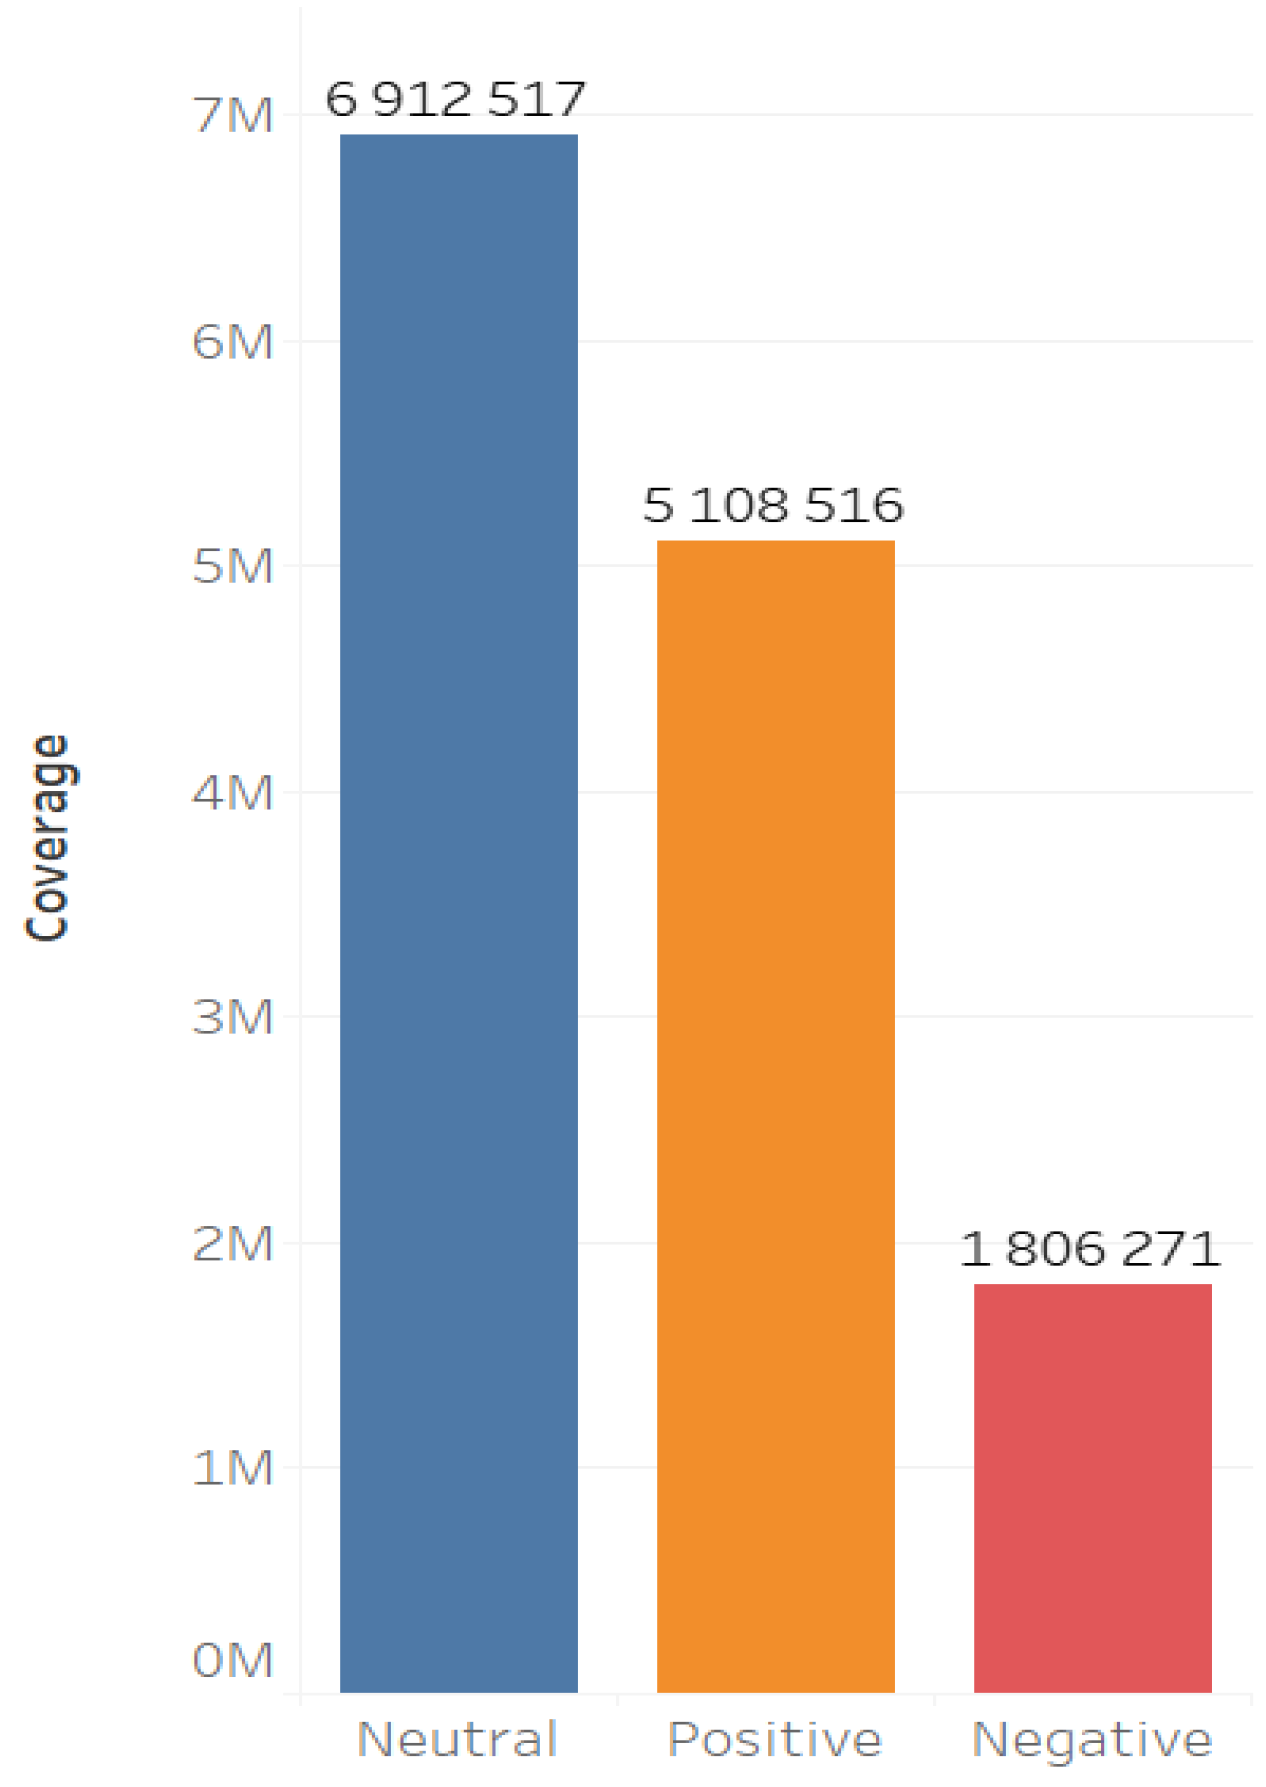
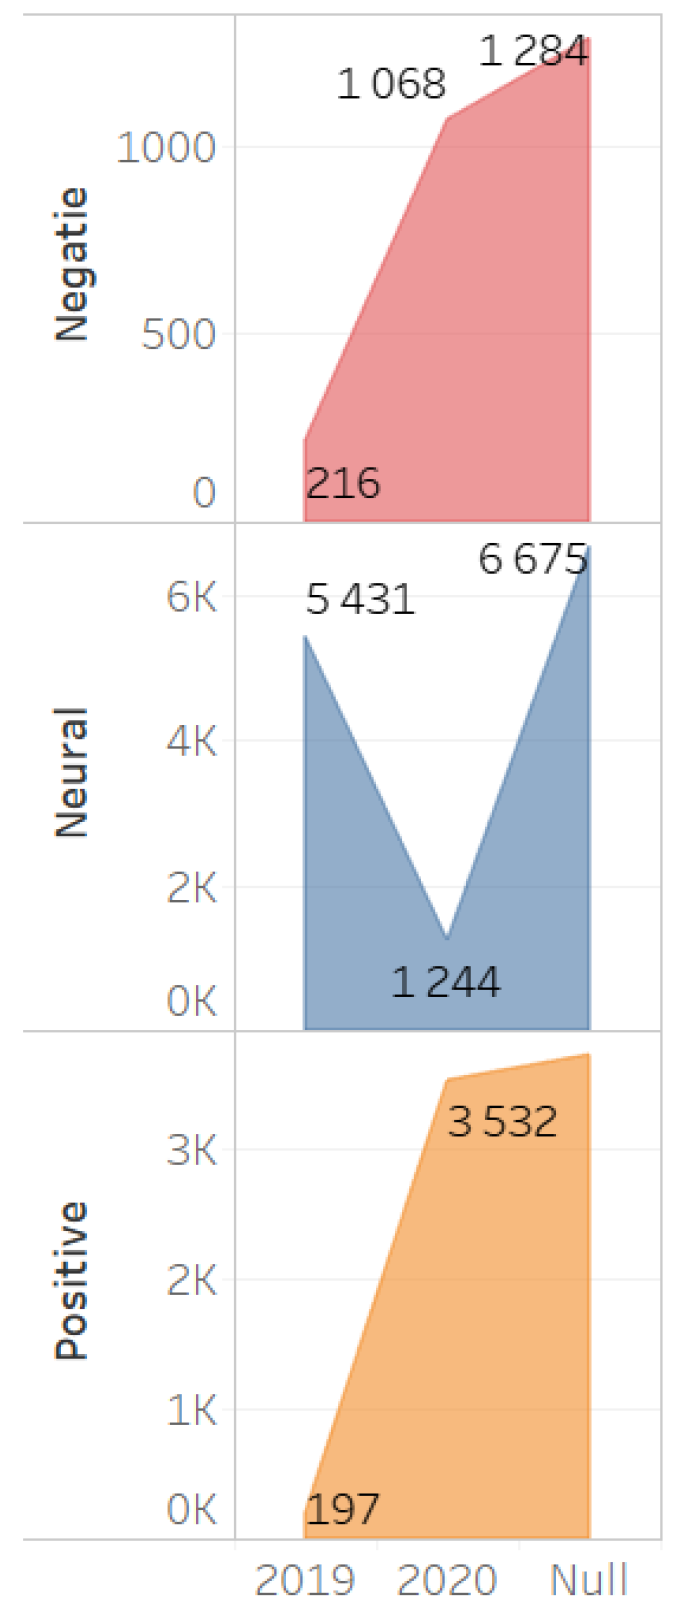
The sentiment analysis of the general database showed that the proportion of the content with neutral and positive sentiment is larger than that of the negative content (
Figure 5 and
Figure 6).
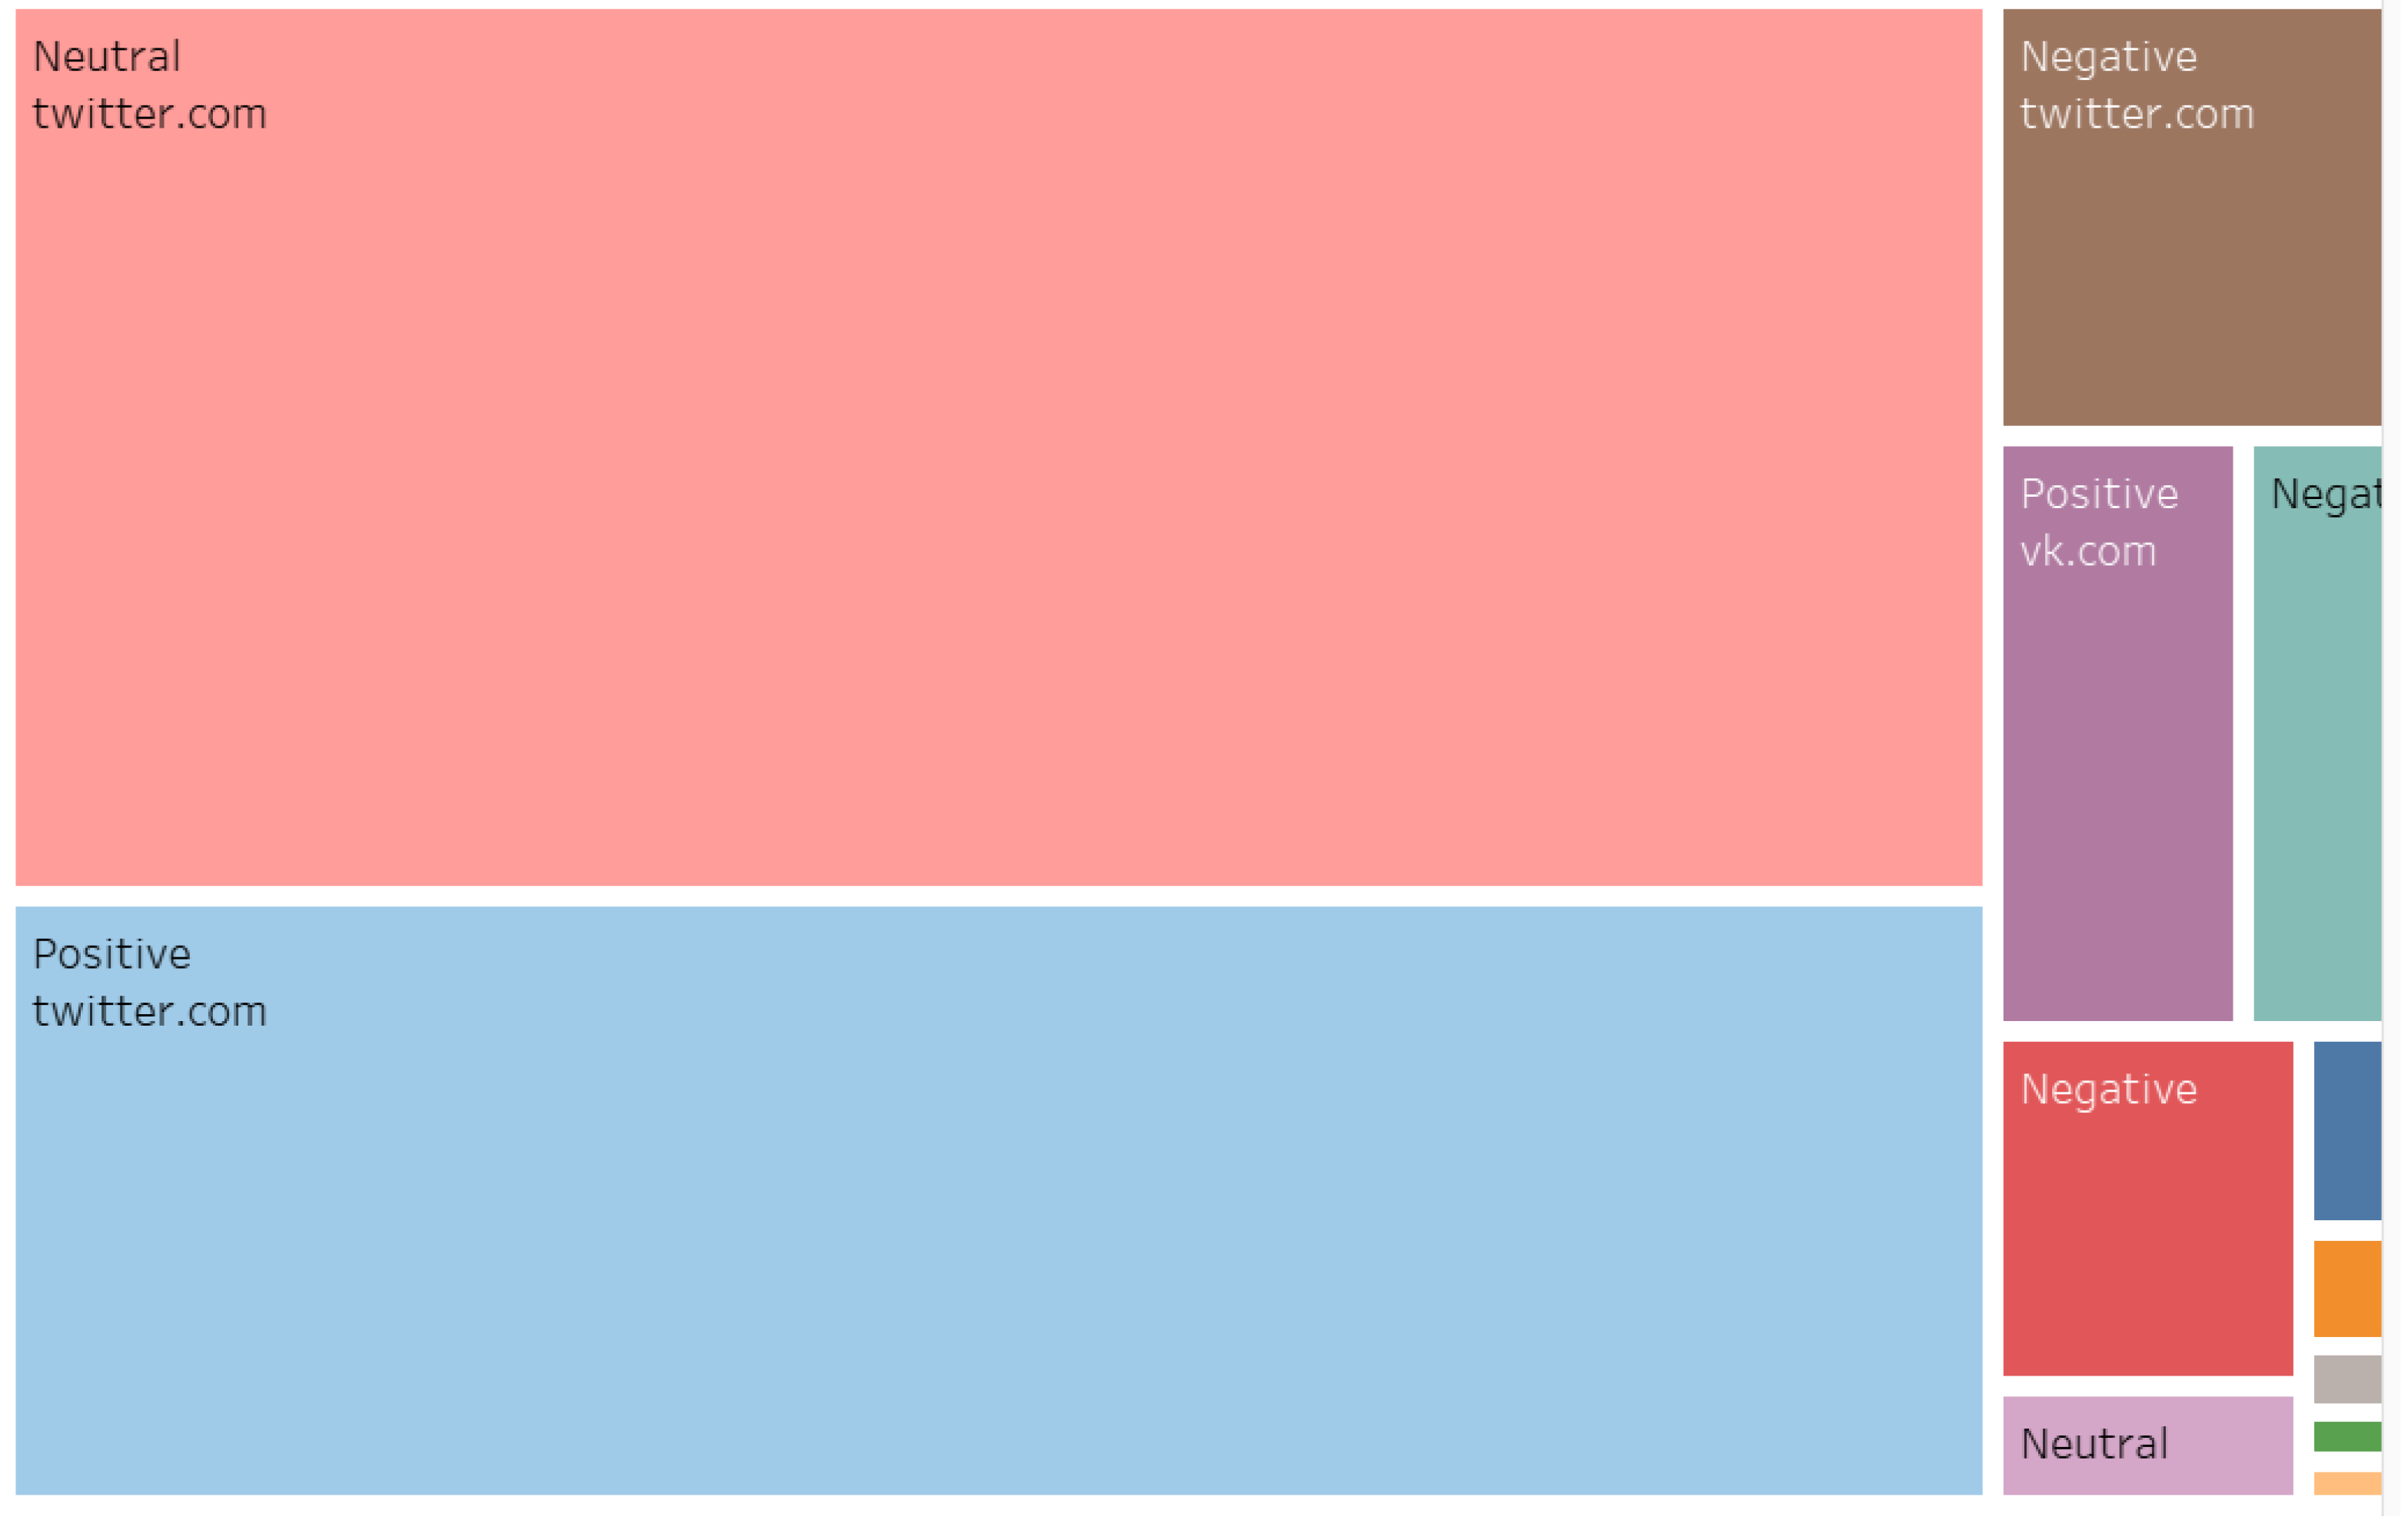
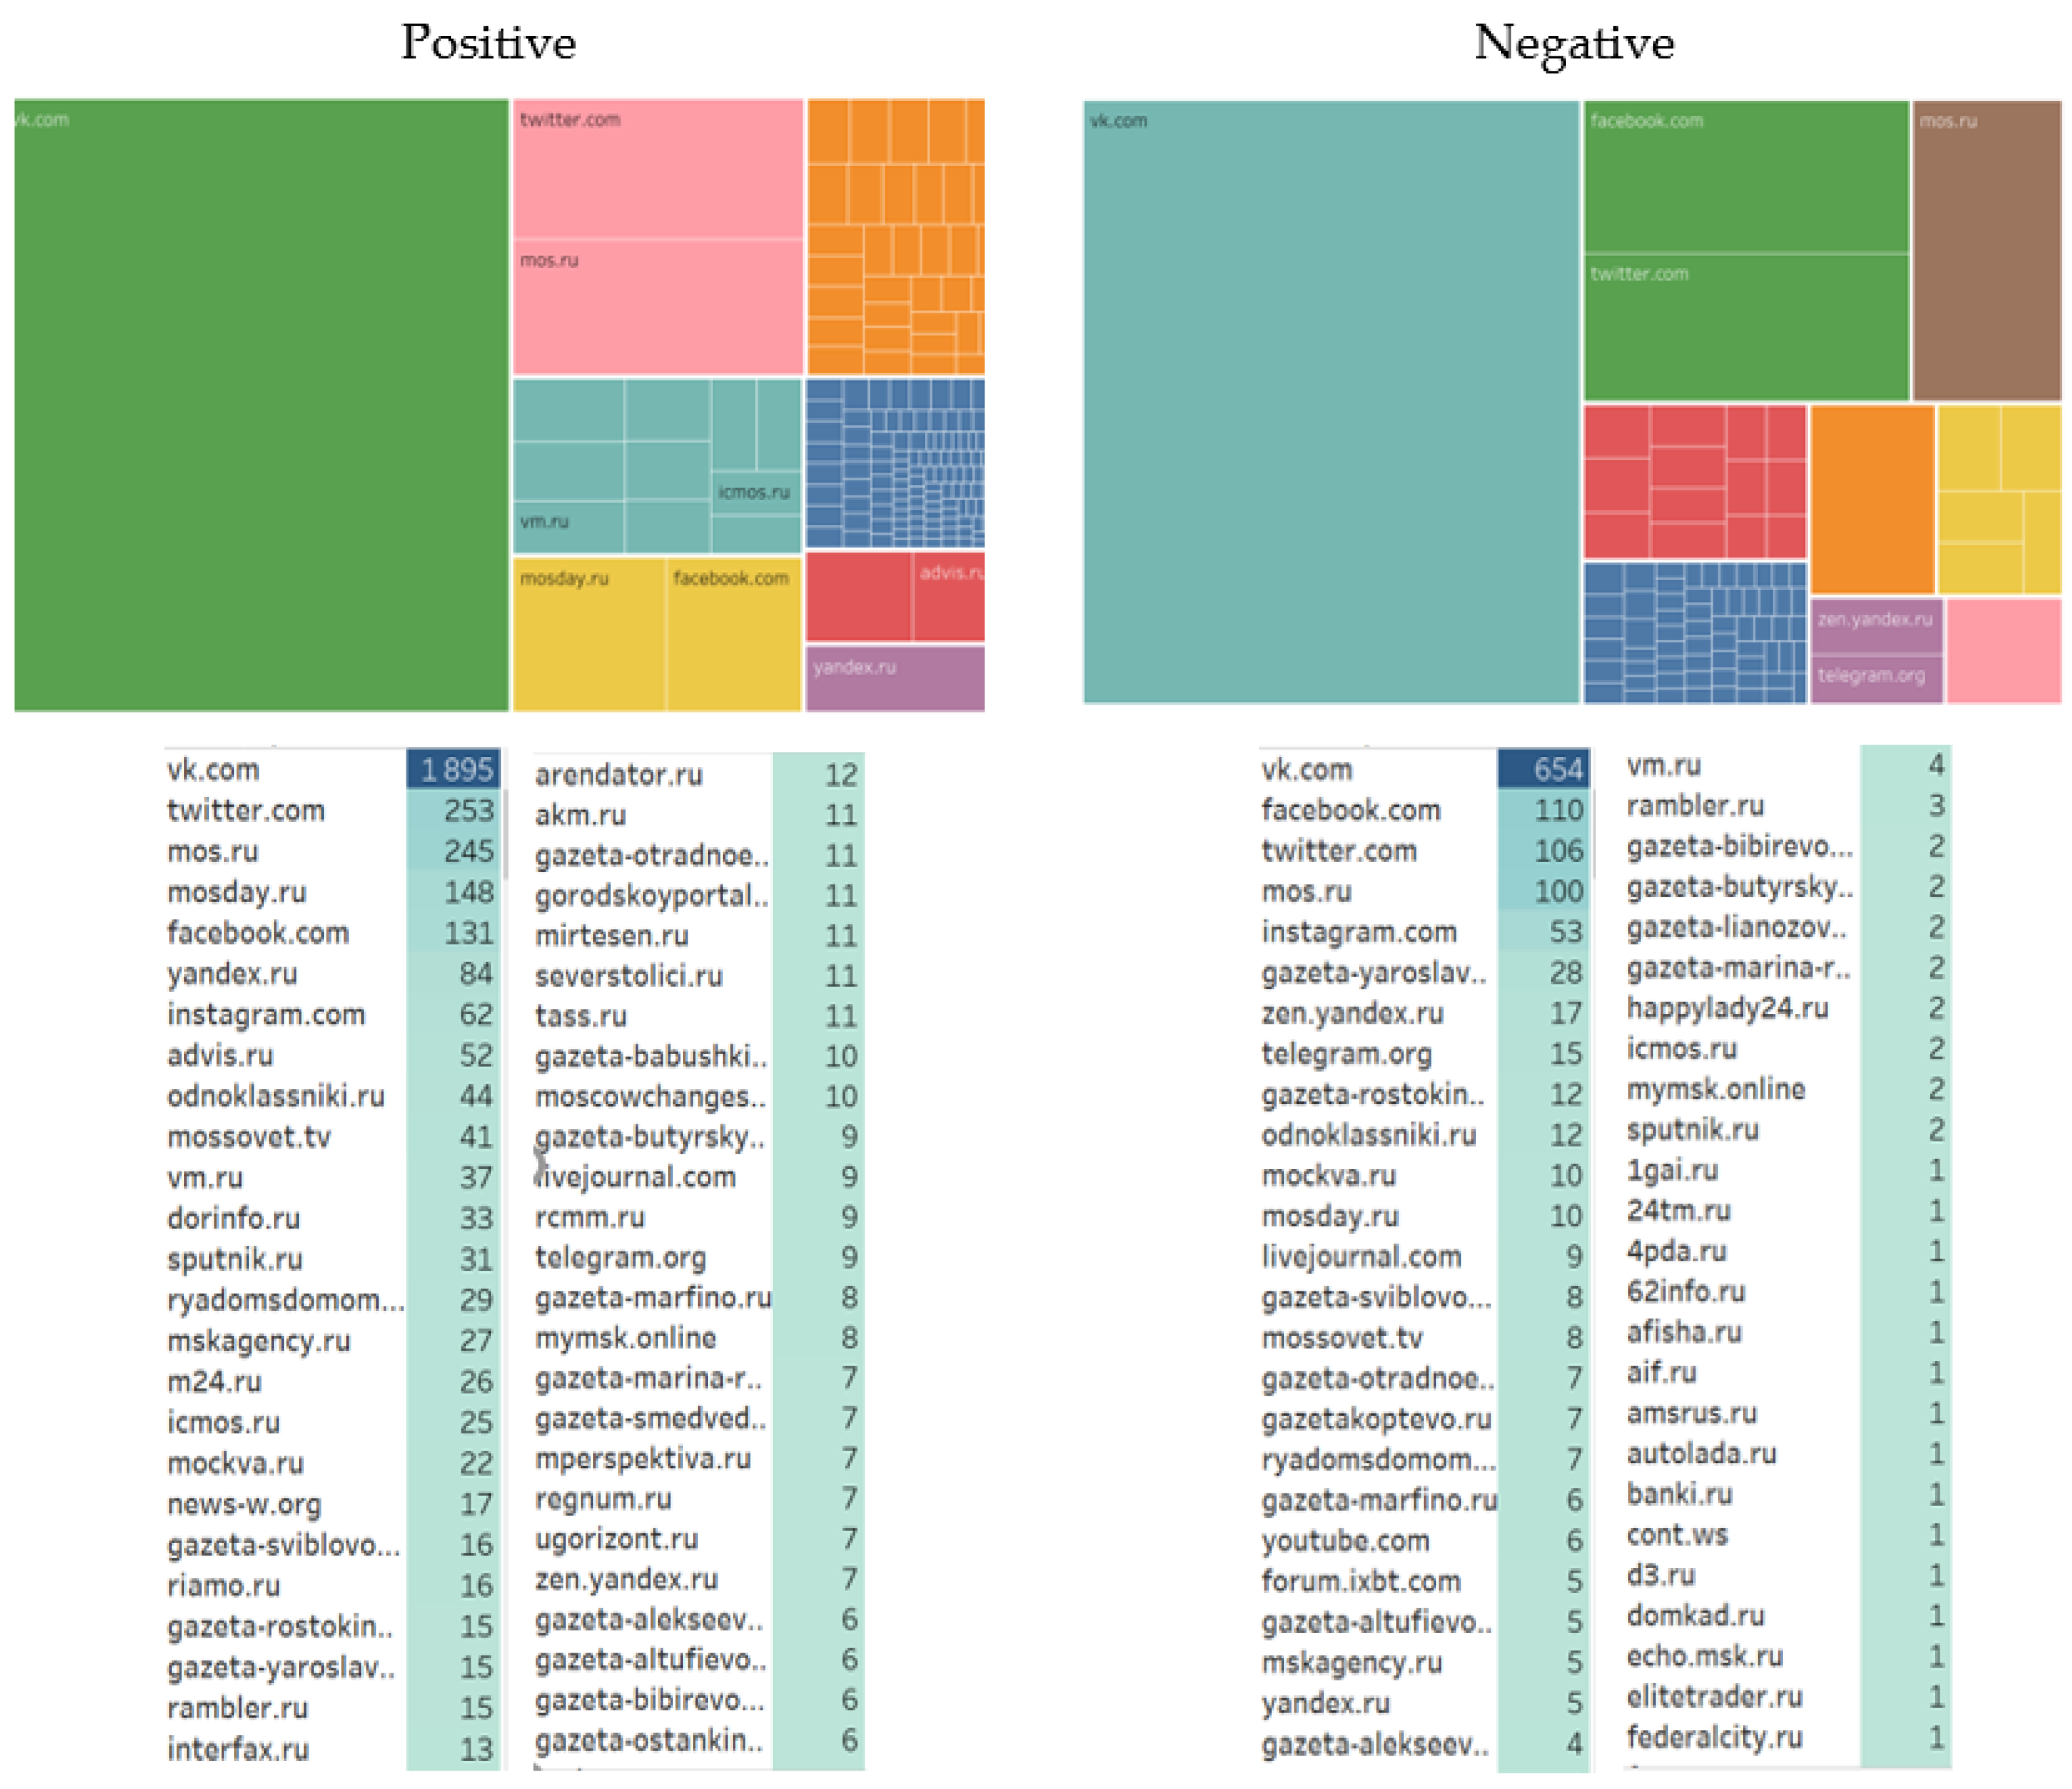
It is revealing that the quantitative indicators of positive and negative communications differ on various digital resources. While positive messages are mostly found on the following platforms: VKontakte, Twitter, mos.ru, and mosday.ru, negative messages are mostly found on these: VKontakte, Facebook, Twitter, mos.ru, and Instagram (
Figure 7).
This situation is due to the leading position of the social network VKontakte in the Russian-speaking media space. According to quantitative data, VKontakte is significantly ahead of similar resources. A large number of positive messages on Twitter, mos.ru, and mosday.ru is, to a certain extent, explained by their active use by official and biased authors and sources. Russian-speaking users traditionally use Facebook as a platform for discussing political and socially significant issues, often with negative connotations.
3.1.4. Analysis of the Topic Structure and Content Analysis
The topic structure of the consolidated dataset reflects the predominant nature of the content, which consists mostly of official messages describing the progress of the construction and potential improvements in the transport situation in the city after the NEC was put into operation. The topics of the negative cluster in accordance with the rating are as follows: traffic limitations due to the NEC construction; destruction of the Losiny Ostrov National Park for the sake of the NEC construction; violation of legislation when cutting the Losiny Ostrov park area; accusations of misuse and overspending of budgetary funds; destruction of the Kuskovo park; danger for architectural monuments (in particular, for the Church of the All-Merciful Savior in Kuskovo, (1644); deterioration of the ecological situation due to the felling of trees; danger of a techno-ecological catastrophe (Lyubertsy sewer collector); and the introduction of a paid fare through the NEC.
The positive (as well as the neutral) cluster consists mainly of official messages. Despite the quantitative predominance, the topics are represented by duplicate messages of the same type concerning the construction progress and the expected improvement of the transport situation after the NEC is put into operation. Positive cluster topics according to the rating are as follows: improving the transport situation; reconstruction of urban facilities, improvement of the environment for the movement of citizens; transport accessibility of areas through which the NEC passes; and the improved accessibility to the MCC and metro stations.
An interesting media fact should be noted: in the rating of positive and negative texts, the top position was taken by texts about the congestion of Altufevskoe highway during the NEC construction.
3.1.5. Analysis of the Users’ Perception of the Situation
Despite the significant quantitative predominance of the official content, which forms the positive and negative clusters, an increase in the number of negative reactions of the users indicates an increase in the negative perception of the NEC construction by the actors.
The dynamics of references with various sentiments also show that the growth of negative messages is accompanied by the growth of positive messages. However, it should be borne in mind that the negative content is generated mainly by the users, while the positive content is generated by official sources and biased actors (
Figure 8 and
Figure 9).
3.2. Mathematical Modeling Results
3.2.1. Statistical Analysis of Data
Statistical analysis of data {
X(
t),
P(
t),
Z(
t)},
t = 1,2, …,
n was performed in the Statistica 10 software [
43]. The research carried out was further used in the development of mathematical models.
Table 1 shows a fragment of the initial data.
The calculated sample estimates of the correlation coefficients (
Table 2) indicate that the indicators under consideration have a linear relationship.
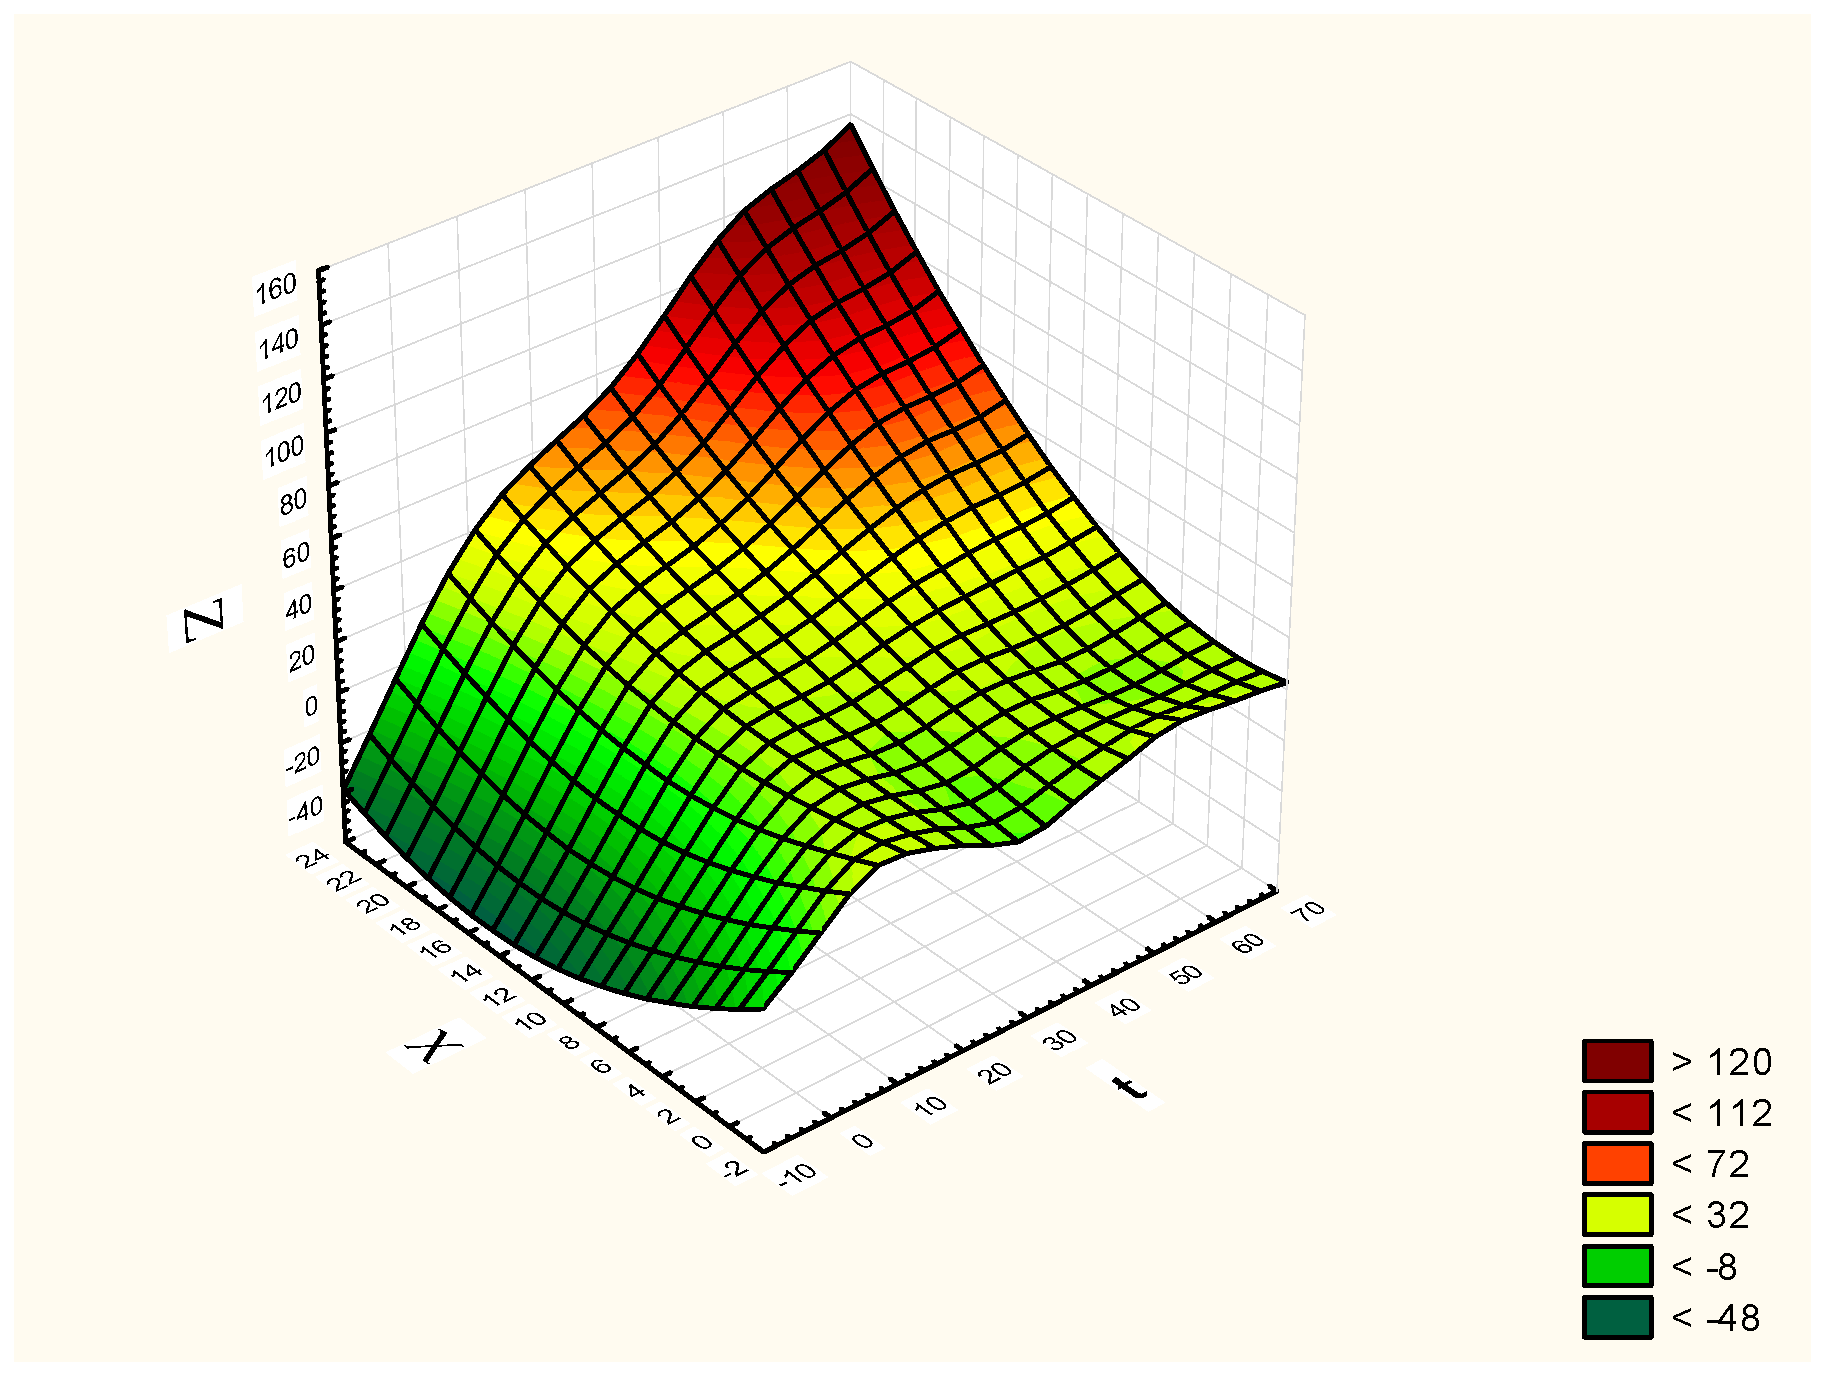
We investigated the behavior of the dependence of indicators
X,
Z (non-normalized indicators are considered).
Figure 10 shows a graph of polynomial smoothing of the dynamics of indicators
X,
Z in the OXZt plane.
When constructing a mathematical models, the initial data are transformed according (2.3) to the rule: x(t) = X(t)/S(t); p(t) = P(t)/S(t); z(t) = Z(t)/S(t).
According to the calculated estimates of the correlation coefficients (
Table 3) between variables x and z, the correlation coefficient is high.
A negative sign in front of the correlation coefficient may indicate that the number of people with a negative attitude is increasing due to the transition of actors from the group of those with a neutral attitude towards the group of those with a negative attitude.
3.2.2. Autoregressive Models ARIMA
Observational data {
x(
t)}, {
p(
t)}, {
z(
t)},
t = 1, ...,
n can be considered as time series.
Figure 11 shows a diagram of the dynamics of the normalized
x(
t) value. On the graph, the abscissa is time and the ordinate is
x(
t) =
X(
t)/
S(
t). For time series, there is a whole arsenal of linear stochastic models. Below, time series models are constructed using normalized data for the first indicator, i.e., according to the data for {
x(
t),
t = 1, …,
n}. It is known that autoregressive models can be constructed only for stationary series. After identifying the trend:
The ARIMA(1,0,1) model is constructed:
The autoregressive model (7) and model (6) can be used to estimate the forecast for indicator
x(
t) several steps ahead. The coefficient
of the model (6) indicates an increase in the number of people in the group with a negative attitude towards the project. The root-mean-square error of the model is:
, where
—model values
.
Figure 11 shows a diagram of the dynamics of the normalized
x(
t) value (blue line) and model values (red line).
After identifying the trend
z(
t):
The ARIMA(1,0,1) model is constructed:
Using the continuous models built to describe the dynamics of negative and neutral messages, let us find estimates of the rate of the share of negative () and neutral () messages. According to (6) and (8), we can write > , therefore .
3.2.3. ODE 1 Models
ODE 1 models were built as systems of linear differential equations (4) was parametrized by the Nelder–Mead method. A program was developed to parametrize the ODE 1 model. Numerical experiments showed the models (4) to be valid only for local forecasting. For that reason, the time interval was split into several subintervals, each of which was modeled. Building the models of the system of linear differential equations (4) enabled convenient analysis of the stability of trajectories the dynamic system has in the phase space, and provide easy identification of bifurcation points. The systems of differential equations were tested for stability [
30] by spectral analysis; testing essentially boiled down to the stability testing of a trivial solution: stationary points. Analysis showed the models built on data from different periods of observation had different types of stable points. This fact might indicate the presence of bifurcation points.
Let us take a look at the analysis of one model:
Characteristic values: , therefore, the stationary point, the unstable focus of the system trajectory that was arbitrarily close to the zero at the initial timepoint deviate from the ε-neighborhood of the zero as t grows on.
Next to a nonsingular point, all vector fields have an identical, simple structure. In order to test the behavior at singularities, use one of the built models:
Near a nonsingular point, all vector fields have a simple and identical structure. To study the behavior at the points of singularities, we use one of the constructed models:
can be ignored in view of its smallness. Then, from the system of differential equations with the defined matrix, find:
According to the general theory [
30], obtain:
The dynamic system is known to be oscillating at
k = 1,1 < 2 and change the direction of movement no more than once at
k = 2. This value of the coefficient can be further used to add the control parameter to the general formulation of the system of differential equations:
where
µ is the control parameter.
Conclusions. (1) Spectral analysis shows the stationary points of the system to be unstable. (2) Negative attitude to the project is on the rise. (3) Analysis of singularities found out ways to introduce the control parameters. (4) The solution obtained by means of the ODE 1 models .
3.2.4. ODE 2 Model
ODE 2 models were built as systems of nonlinear differential equations. Right-side equations and model parameter estimates were obtained by symbolic regression. The functions f on the right side of (2) were structured as second-degree polynomials. The coefficients of the polynomial were approximated by an artificial neural network. Where the coefficients were below the selected threshold h in absolute value, they were equated to zero. ANN-based modeling produced the following models:
First-approximation stability analysis of the solutions (9) showed the solutions to be asymptotically stable.
The solution obtained by means of the ODE 2 models: .
3.2.5. Analysis of Model Accuracy
Analysis shows the solutions found by the ODE 1 do not have initial data stability. Below is a comparison of the resulting solutions
ARMA and ODE 2 in the neighborhood of the selected initial point and actual values (
Table 4). Let:
3.2.6. ODE 1 vs. ODE 2
Analysis shows the solutions found by the ODE 1 do not have initial data stability. Below is a comparison of the resulting solutions by the ODE 1 and ODE 2 in the neighborhood of the selected initial point. Let:
X1 be the ODE 2 solution;
X3 be the ODE 1 solution;
be the absolute difference between X1 and X3:;
D be the relative difference between X1 and X3: .
The mean difference between the solutions produced by the ODE 1 and ODE 2 models is 0.02; the relative difference is 0.04, which indicates a satisfactory quality of the models (
Table 5).
4. Discussion
The paper presents a solution to the problem of discovering what the residents think of a subway line construction project from their social media. The problem was split into subproblems: (1) filter the data; (2) build a mathematical model; and (3) make a managerial decision. These subproblems were solved by artificial neural networks. Solving the subproblems one by one is essentially an algorithm in which an AI automates solving a managerial problem.
Visual analytics and statistical modeling were used to verify the proposed approaches to mathematical modeling. The authors’ comparative analysis showed the solutions produced by visual analytics, mathematical statistics and differential equations matched: the actors have negative attitudes toward the project. Discrepancies in the analyses made by visual analytics and by mathematical models may stem from complex relations that simple methods cannot grasp. The system of differential equations was parametrized by Nelder–Mead optimization and by artificial neural networks.
Although the solutions by the two models were virtually identical at and near the initial conditions, we believe ANN-based models have several advantages. They are adaptive, resistant to noise, easier to use, and have high computational performance. Equally important is the fact that the structure of the ODE 2 models was selected from a class, and the class was selected on the basis of a priori data. However, the model structure was finalized by the neural network from data.
The analysis of messages shows that most of the media content covering the implementation of the NEC project consists of official sources and traditional media. The rating of texts is topped by the mayor’s tweet (17 May 2017) about the completion of the construction of a NEC section from Shchelkovskoye highway to Losinoostrovskaya street (1 031 548).
The analysis of official messages shows the general representation of the media content related to the NEC construction. Meanwhile, the residents’ perception of the project progress and their attitude towards the NEC construction is shown by the analysis of the content generated by users and actors’ digital footprints in social networks.
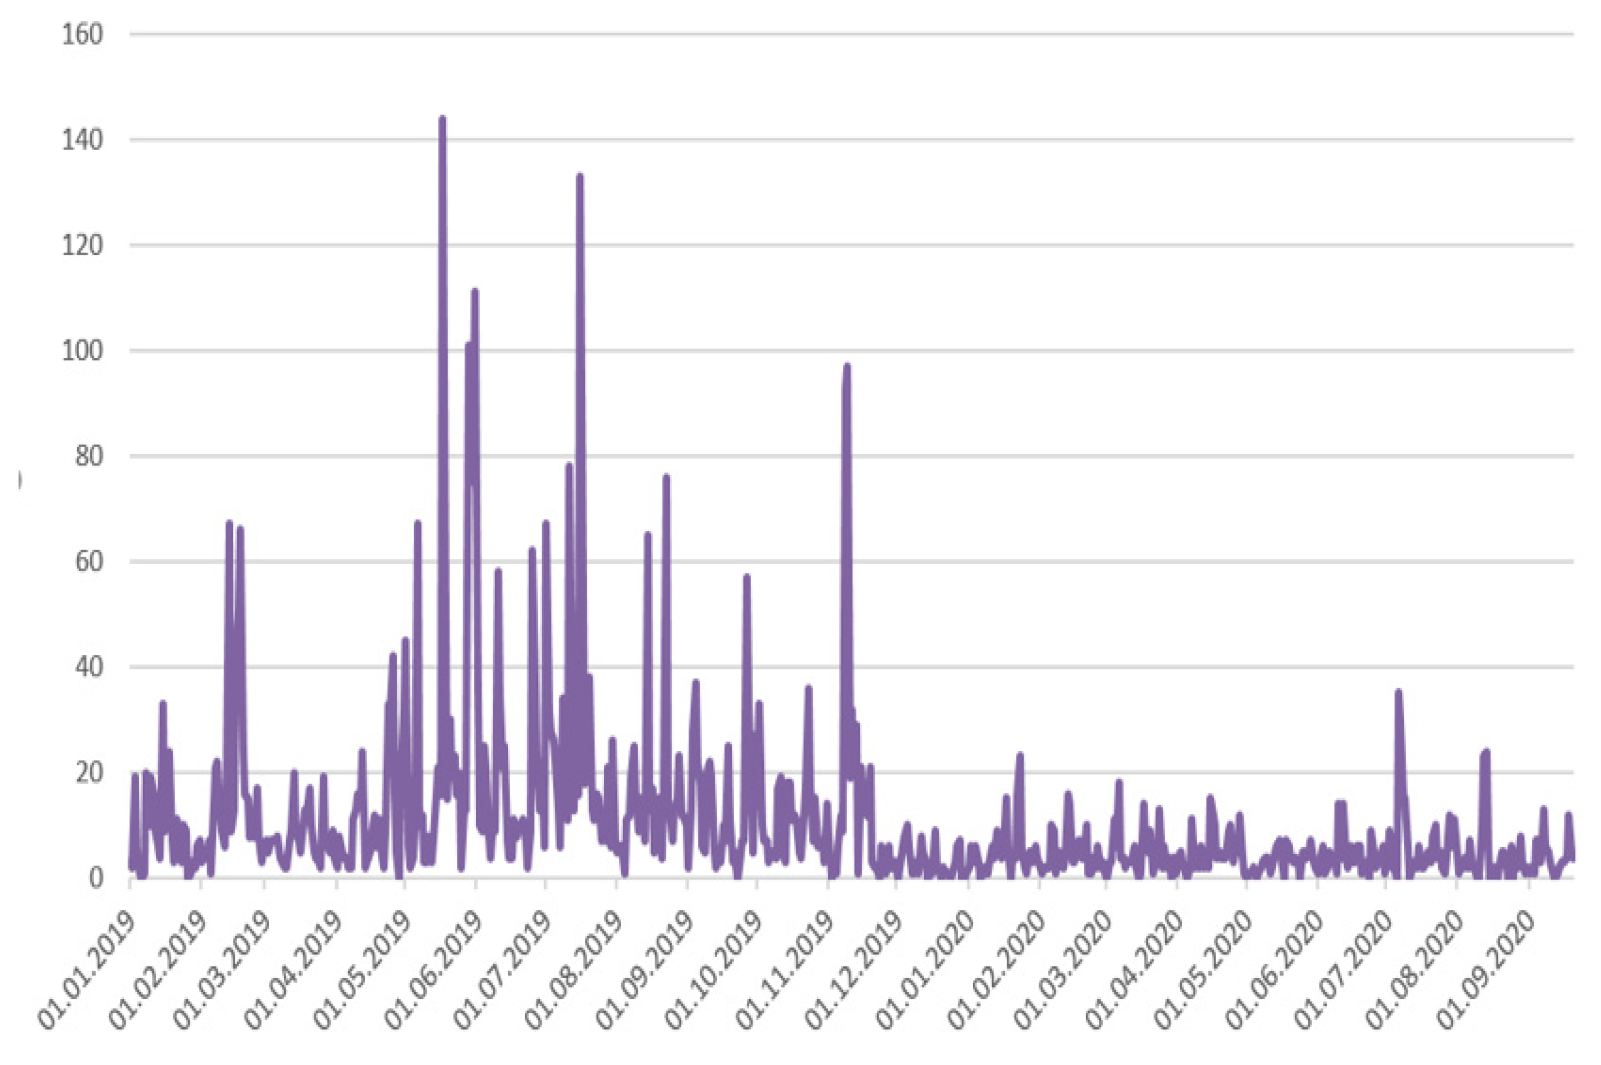
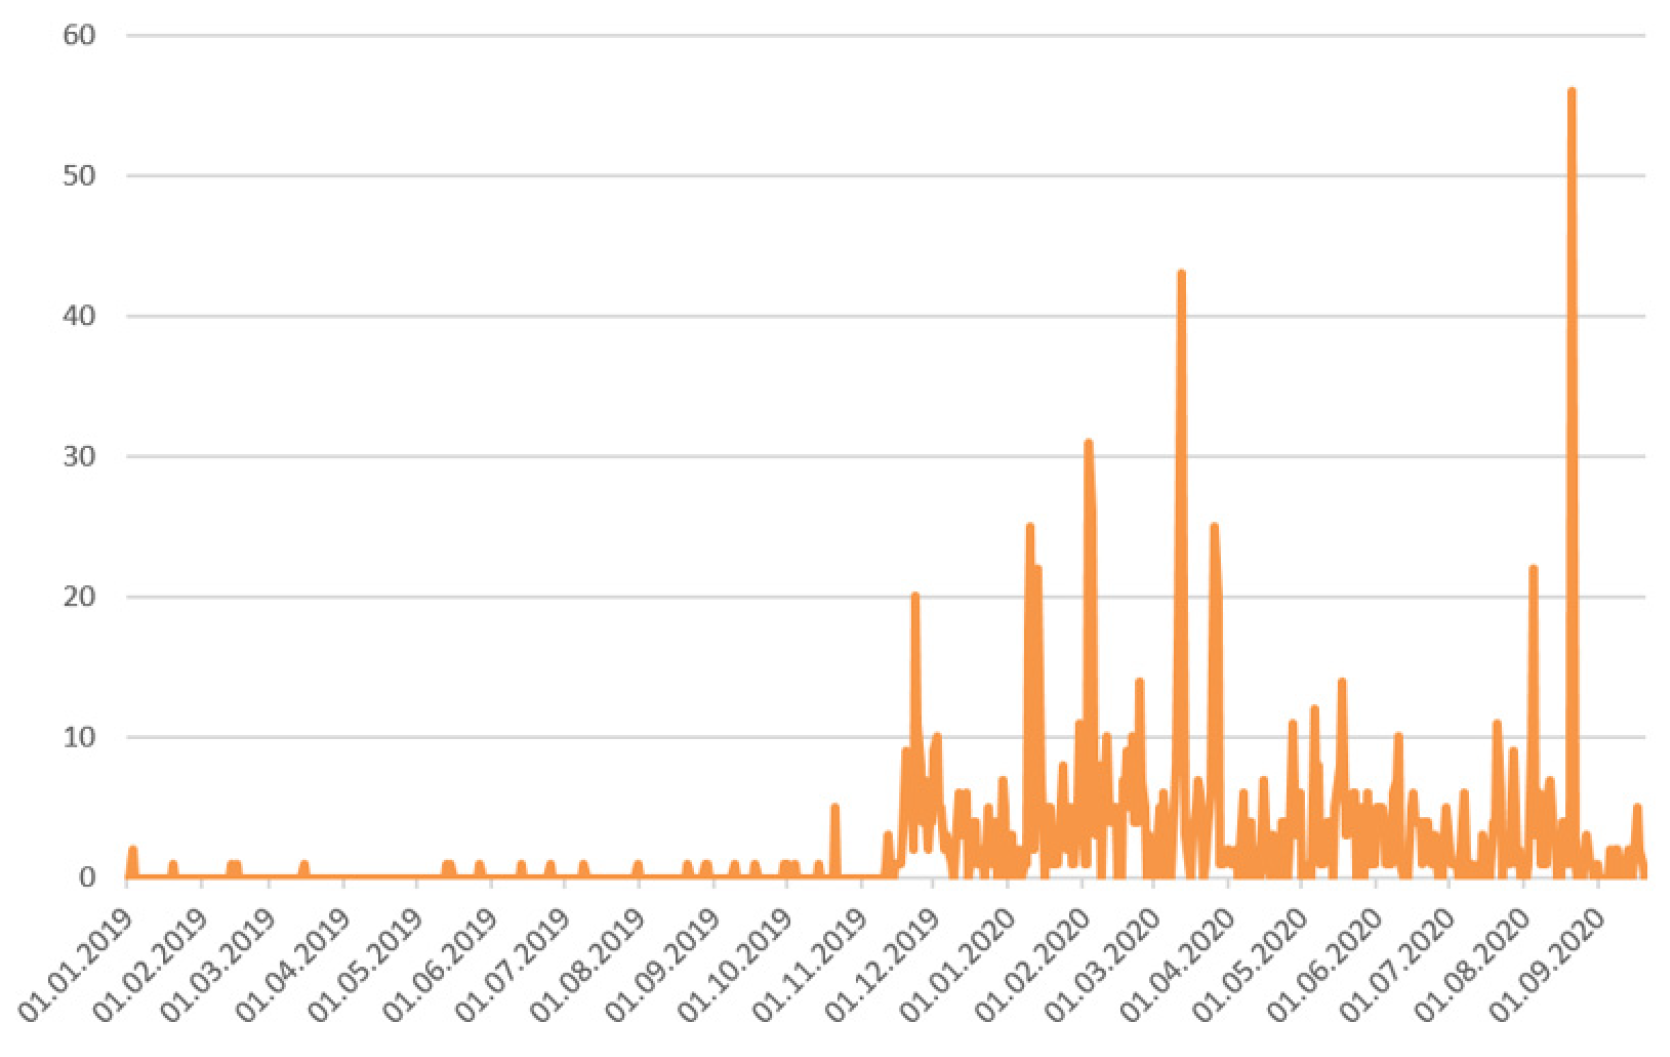
The dynamics of messaging with various sentiment types show a sharp drop in the number of texts with a neutral sentiment during the analyzed period, while the number of negative and positive messages increases.
The analysis of the dynamics of messages shows that neutral messages forming a large part of the media content regarding the NEC construction, and positive references do not in any way correlate with the negative content. Thus, the official neutral and positive messages do not correlate and do not affect the perception of users who generate the negative content dedicated to the NEC implementation project, and expressed the negative perception of the project by the residents (
Figure 12 and
Figure 13).
The peak of negative reactions was recorded on August 21, 2020 (
Figure 13) and was associated with the trial of Moscow City Duma deputy, Oleg Sheremet, who campaigned against the NEC construction and the destruction of Kuskovo Park. Thus, the NEC construction is actively involved in the political process, associated with the activities of certain political actors, embedded in political content, and is brought beyond the urban conflict.
Approaches for constructing mathematical models based on digital footprints have been developed. The peculiarity of the problem is that the data used are the data of the indirect variables of the dynamic system, and the data of the indirect variables are very noisy. To solve the problem, models were constructed in the form of systems of linear differential equations in a few-mode region. The estimates of the coefficients of the equations were found using the Nelder–Mead method, for which a Python code had been developed. Physics-based neural networks were used to describe the behavior of a dynamic system throughout the entire course of the study. The study shows that machine learning allows for the construction of adequate mathematical models for the problem considered.
5. Conclusions
The analysis of the solutions from all models showed that all solutions were consistent.
The developed approach of combining mathematical and neural network models to analyze the social media users’ perception based on their digital footprints led to the conclusion about the tense situation around the construction of the NEC.
The proposed approach for analyzing the social networks users’ perception based on their digital footprints made it possible to quickly identify conflict zones associated with the NEC implementation project and propose recommendations to resolve and prevent conflicts.
The solutions obtained using the developed mathematical models in
Section 3.2 are fully consistent with the study carried out on the issue under consideration in
Section 3.1. Therefore, we can speak about the adequacy of the constructed mathematical models. The advantage of the constructed mathematical models is that they allow predicting the behavior of dynamic systems. It is possible to introduce control into the constructed models, which will make it possible to plan in advance certain measures to stabilize the situation.
Research data could be of use in solving similar problems in sociology, ecology, and economics.


