Article

Experiments on Longitudinal and Transverse Bedload Transport in Sine-Generated Meandering Channels

1
Key Laboratory of Water Cycle and Related Land Surface Processes, Institute of Geographic Sciences and Natural Resources Research, Chinese Academy of Sciences, Beijing 100101, China
2
College of Resources and Environment, University of Chinese Academy of Sciences, Beijing 100101, China
3
Department of Engineering, University of Palermo, 90128 Palermo, Italy
4
Yellow River Institute of Hydraulic Research, Zhengzhou 450003, China
*
Author to whom correspondence should be addressed.
Appl. Sci. 2021, 11(14), 6560; https://doi.org/10.3390/app11146560
Submission received: 8 June 2021 / Revised: 6 July 2021 / Accepted: 14 July 2021 / Published: 16 July 2021
(This article belongs to the Special Issue Fluvial Hydrodynamics: Hydrodynamic and Sediment Transport)

Abstract

:
Bedload grains in consecutive meandering bends either move longitudinally or across the channel centerline. This study traces and quantifies the grains’ movement in two laboratorial sine-generated channels, i.e., one with deflection angle θ0 = 30° and the other 110°. The grains originally paved along the channels are uniform in size with D = 1 mm and are dyed in various colors, according to their initial location. The experiments recorded the changes in the flow patterns, bed deformation, and the gain-loss distribution of the colored grains in the pool-bar complexes. We observed the formation of two types of erosion zones during the process of the bed deformation, i.e., Zone 1 in the foreside of the point bars and Zone 2 near the concave bank downstream of the bend apexes. Most grains eroded from Zone 1 are observed moving longitudinally as opposed to crossing the channel centerline. Contrastingly, the dominant moving direction of the grains eroded from Zone 2 changes from the longitudinal direction to the transversal one as the bed topography evolves. Besides, most building material of the point bars comes from the upstream bends, although low- and highly curved channels behave differently.

1. Introduction

Point bars and scouring pools are typical geometric characteristics of meanders, whose formation is strongly related to longitudinal and transverse sediment transport. A deeper understanding of the bed deformation and bedload movement can significantly benefit both river engineers in river restoration, flood control, navigation, etc., and ecologists in protecting aquatic communities, e.g., macrozoobenthic species.
Transverse bedload transport refers to the “crossing-centerline” sediment movement in consecutive meandering bends. Otherwise, it is longitudinal transport [1]. Observation in both field and laboratories has evidenced that the curved channels often orientate the bedload with significant deviation from the general flow direction [2,3,4], and the transport rates are neither homogenous nor isotropic [5]. According to Zeng et al. [3], the angle between trajectories of flow and sediment is a function of threshold velocity of sediment, transverse slope of riverbed and sectional averaged velocity. Dietrich et al. [2] took measurements at a bend of Muddy Creek; they observed that the topography-induced longitudinal and transverse bedload transport prevail at the first two-thirds and at the downstream end of the bend, respectively. Leopold [6] emphasized the role of the secondary circulation and argued that the transverse bedload transport could be significant even in straight channels, resulting in alternating bars and in meanders’ initiation. In contrast, laboratory experiments by Friedkin [7], Rui [8], and Wang [9] indicated that most grains eroded near a concave bank are transported longitudinally and deposited at the downstream point bar on the same side of the riverbed, rather than being transported across the centerline and deposited at the point bar on the opposite side. Wang et al. [10] tested the bedload transport in a sine-generated flume with the deflection angle at the inflection section θ0 = 60° and found that longitudinal and transverse transport dominate alternatively along the channel; the bedload “belt” tends to cross the channel centerline right after the bend apexes. He et al. [11] applied a depth-averaged two-dimensional model to evaluate the influences of flow discharge and particle size on bedload transport trajectories based on the 110° sine-generated flume experiment with wide-and shallow sections [12]; they found that the shifting of bedload trajectory in the curved channel is not susceptible to particle size, while it considerably varies with flow discharge.
Although previous studies on longitudinal and transverse sediment transport offer valuable insights regarding morphological changes in meanders, they could not precisely identify and quantify the “sources” and “sinks” of bed material during the formation of pools and point bars. Specifically, tracing the movement of bedload grains in a laboratory provides a promising way to measure the accurate rates of bedload grains in any arbitrary directions as well as their destination. Besides, particle tracing technology is able to “tell” whether the deposited grains come from the concave banks or their convex counterparts, which is hard to discern in the field. Zhang and Xie [13] have dyed bed materials with different colors at different locations in a single 180° bend in the laboratory. They have also found that most bed material deposited at the point bar came from the same side of the riverbed, and this longitudinal sediment transport is more significant when the flow discharge is higher. The present study builds on Zhang and Xie’s [13] particle tracing experiment and goes a step further from a single bend to continuous meander loops. Two sine-generated planforms, i.e., θ0 = 30° and 110°, were selected. The small- and large-sinuosity flumes represent the planforms of meander channels in the earlier and later stages, respectively. This study aims to unveil the transport characteristics of bedload in meandering channels with continuous bends. Our findings could provide an insight into the evolution processes of meandering channels from low to high sinuosity. Besides, the outputs may benefit river restoration activities including protecting streambank as well as riparian infrastructures and habitats.

2. Experimental Setup and Measurements

Experiments were conducted in the laboratory of the Institute of Geographic Sciences and Nature Resources Research, Chinese Academy of Sciences. The centerlines of the plexiglass meandering flumes under consideration follow the sine-generated curve with deflection angles (θ0) of 30° and 110°, representing channels with small and large sinuosity, respectively (Figure 1). The two curved flumes share the same meander wavelength ( Λ = 2 π B , where B is channel width), which is approximately 2.518 m, while their curve lengths are 2.694 m and 9.298 m, respectively. Table 1 summarizes the channel characteristics and the hydraulic conditions of the experimental runs. The curve lengths were calculated in curvilinear orthogonal coordinates, i.e., longitudinal (s) and transverse (n) (Figure 1). The upstream end of each curved flume was connected to a 0.8 m-long straight approach channel; the downstream end was connected to a 0.6 m-long straight exit channel. The banks are rigid. The flume widths are constant at 40 cm, and the cross sections are rectangular. The flumes were installed on a basin equipped with a water recirculating system. The flow was turbulent and subcritical based on the Re and Fr values (Table 1); tailgates were used to keep the initial water depths uniform along the channels. The water temperature was approximately 14 °C.
The channel beds were paved with well-sorted silica sand with a specific density of 2.65 and a mean diameter Dm = 1 mm. We chose relatively coarser grains to avoid sand waves on the beds as far as possible during bed deformation. The initial thicknesses of the sediment layer in the two experimental flumes were 5 cm and 8 cm, respectively. The run started from a bed with zero transverse slope. Specified longitudinal slopes, i.e., 1.12‰ and 2‰, were set up for the θ0 = 30° and 110° flumes, respectively. Besides, the flow rates were designed as 60 and 50 m3/h, respectively, for the two experimental runs. We chose these slopes and discharges to maintain moderate sediment transport rates in both experimental runs. Too much erosion would result in a scouring of the glass bottom, while too slow sediment transport rates would unnecessarily expand the experimental time and cost. In order to obtain various fluvial regimes (will be discussed later), we designed a steeper slope for the θ0 = 110° flume. As shown in Figure 1, bends B1 and B2 were paved with colored (nonwhite) grains, and the rest of the flume was paved with white grains with the same diameter, i.e., 1 mm. Using the channel centerline as a divider, the colors of grains paved on the left and right half-width parts of bends B1 and B2 were also different. Thus, the uniform-sized grains initially paved in bends B1 and B2 are distinguished by four different colors, named D1 (green), D2 (yellow), D3 (red) and D4 (blue). Grains D1 and D4 are initially paved on the concave side and grains D2 and D3 are initially paved on the convex side. The experiments were designed as closed systems, i.e., no sediment feed at the inlets.
After the bed deformation reached equilibrium (no measurable bed deformation was observed), flow velocities and bed topography at each cross section were measured by Nortek micro-ADV (Vectrino+, Rijeka, Croatia) and a metal probe at 15 equally spaced verticals. The measuring range of the ADV was 0.01 m/s to 4 m/s, with an accuracy of ±1 mm/s. The sampling frequency is 200 Hz. To monitor the temporal variation of bed elevation, plastic rulers were also pasted at both sides of each section of the two flumes. After this, the water in the flume was carefully drained, and the spatial distributions of the colored grains were estimated by the following procedure. The first step was to identify the sampling spots. For each section, there were 4 sampling plots and the width of each plot is approximately B/4. Therefore, the 4 plots almost covered the whole cross section. Thus, there were a total of 56 and 336 sampling plots in the θ0 = 30° and 110° flumes, respectively. All of the grains remaining in each sampling plot were excavated to the flume bottom, dried, tiled over a white paper, and photographed. Then, the number of colored grains was counted by the Matlab Image Analysis Toolbox [14,15]. The accuracy of the automatic image processing method was verified by comparing with manual recognition (by eyes). Table 2 shows the four test scenarios. In each scenario, a certain amount (5000 or 10,000) of mixed grains (D1, D2, D3, and D4) was counted manually by eyes and tiled over a white paper. Then, we took a picture of the samples and counted the numbers of colored grains by the Matlab Image Analysis Toolbox. We repeated this procedure five times and adopted the average. Verification showed that the recognition rate was ranging from 91% to 96%, with an average of about 94.35%. The distinguishing of red and yellow grains was slightly better than blue and green grains. Besides, adding artificial light proved necessary when taking photos. In this way, we obtained the number ratios of colored particles to the mix. We can safely assume the volume ratios are the same as the number ratios. The volume of each sampler could be estimated with dried weight of sampler and its buck density. Thus, the volume of each colored particle in each sampler could be estimated. Comparing the initially paved volume and the sampled volume, we obtained the gain and loss of colored grains in each sampling plot. Finally, particle source for bar deposition could be estimated.
In this way, we could obtain the gain and loss of color grains D1, D2, D3, and D4 along the meandering channels, and estimate the longitudinal and transverse bedload transport in the bends.

3. Results

3.1. The 110° Flume

Figure 2a shows the bed elevation change (cm) in the sine-generated flume with deflection angle θ0 = 110°. Figure 2b,c show the gain and loss of colored grains (D1, D2, D3, and D4) at each cross section along the left and right half-width parts of bends (using the channel centerline as the divider), respectively. The vertical axes in Figure 2b,c i.e., SV, display the sample volume (m3) of colored grains, and positive and negative values indicate gain and loss, respectively.
Figure 2a shows the bed elevation change (cm) in the 110° flume. To trace bedload movement in various fluvial regimes, we designed a closed system for the 110° flume in this study, i.e., no sediment feed at the inlets. Since the bedload transport rates are relatively low and bed deformation is relatively mild in either B1 or B3, the intermediate scenario in B2 can be considered to be in quasi-equilibrium. From Figure 2a, one can observe a continuous deposit along the convex bank (sections 41–57). Relatively severe scouring occurred near the apex sections 48–49 and the downstream of sections 55–57.
For the 110° flume, sand grains of D1 and D2 are initially paved along the left (concave) and right (convex) bank of the B1 bend (sections 13–37, as shown in Figure 1). The general bed topography shown in Figure 2a indicates the formation of alternate erosion/deposition areas whose localization along the bend is similar to that obtained by Termini (13, 19) in a meandering flume characterized by the same planimetric configuration as that of the 110° flume considered in this work. Figure 2b indicates a large quantity of D1 grains (total volumes of 34.9 × 10⁻⁴ m3) were eroded from the left (concave) bank. Within the B1 bend, most of those eroded D1 grains (72%) were longitudinally transported to the next bend B2 and only a small proportion (28%) crossed the channel centerline and contributed to the point bar deformation (as shown in Figure 2c). The evacuating amount of D2 in the B1 bend is relatively small (18.1 × 10⁻⁴ m3) compared to the scouring near the concave bank (about 52% in volume). About 86% of the D2 grains eroded from the B1 bend were longitudinally transported to the next bend B2, i.e., the transverse transport of D2 grains accounts for only 14% (as shown in Figure 2c).
Therefore, in the B1 bend of the 110° flume, bed degradation occurred, and the longitudinal bedload transport prevailed along both sides of the banks. As D1 and D2 grains moved into the next bend B2 (sections 37–61, as shown in Figure 1), the longitudinal-transverse sorting continues. From Figure 2b,c, we measured the volumes of 15.9 × 10⁻⁴ m3 and 11.3 × 10⁻⁴ m3 of D1 grains in the left (longitudinally transported) and right (transversely transported) half-width, respectively. The ratio of longitudinal to transverse transport for D1 in the B2 bend is about 1.4, while for D2 grains, we measured the volumes of 2.0 × 10⁻⁴ m3 and 5.0 × 10⁻⁴ m3 in the right (longitudinally transported) and left (transversely transported) half-width, respectively. The ratio of longitudinal to transverse transport for D2 in the B2 bend is about 0.4.
Sand grains of D3 and D4 are initially paved along the left (convex) and right (concave) bank of the B2 bend of the 110° flume (sections 37–61, as shown in Figure 1). On the contrary, to the bend of B1, the B2 bend presents a quasi-equilibrium regime. Figure 2c indicates a large quantity of D4 grains (total volumes of 28.4 × 10⁻⁴ m3) were eroded from the right (concave) bank. Within the B2 bend, most of those eroded D4 grains (75%) were longitudinally transported to the next bend B3, and only a small proportion (25%) crossed the channel centerline and contributed to the point bar deformation in the same bend, i.e., the B2 bend (as shown in Figure 2b). The ratio of longitudinal to transverse transport of D4 in the B2 bend is about 3.0, even larger than the longitudinal-transverse ratio of D1 in the B1 bend (about 2.6). In contrast to the traditional bend theory [16,17], which assumes that the point bar is mainly composed of the other-bank sediment moved by laterally asymmetrical longitudinal flow pattern, the observed behavior suggests that, especially in highly curved channels, the point bar is composed by the combination of a dominant longitudinal transport and a cross-sectional motion. The evacuating amount of D3 in the B2 bend is relatively small (14.0 × 10⁻⁴ m3) compared to the scouring near the concave bank (about a half in volume). About 73% of the D3 grains eroded from the B2 bend were longitudinally transported to the next bend B3, i.e., the transverse transport of D3 grains accounts for 27% (as shown in Figure 2c). The high ratio obviously resulted from the direction of near-bed flow, which constrains the bedload from moving toward the concave bank.
White-color grains are initially paved along the entire area of the B3 bend of the 110° flume (sections 61–85, as shown in Figure 1). In contrast to the bends of B1 and B2, the B3 bend presents a mild aggradation regime. As D3 and D4 grains moved into the B3 bend, the longitudinal-transverse sorting continues. From Figure 2b,c, in the B3 bend we measured the volumes of 4.1 × 10⁻⁴ m3 and 2.8 × 10⁻⁴ m3 of D3 grains in the left (longitudinally transported) and right (transversely transported) half-width, respectively. The ratio of longitudinal to transverse transport for D3 in the B3 bend is about 1.5, while for D4 grains, we measured the volumes of 12.5 × 10⁻⁴ m3 and 10.4 × 10⁻⁴ m3 in the right (longitudinally transported) and left (transversely transported) half-width channel, respectively. The ratio of longitudinal to transverse transport for D4 in the B3 bend is about 1.2.

3.2. The 30° Flume

Figure 3a shows the bed elevation change (cm) in the sine-generated flume with the deflection angle θ0 = 30°. The most profound scouring-deposit was observed around the inflection points of the sine-generated curve rather than the apexes. Similar to Figure 2, Figure 3b,c show the gain and loss of colored grains (D1, D2, D3, and D4) at each cross section along the left and right half-width of bends (using the channel centerline as the divider), respectively.
The 30° flume is also a closed system in this study, i.e., no sediment feed at the inlets. Compared with the 110° flume, the channel slope for the 30° flume decreases from 2% to 1.12‰; however, the inflow discharge increases from 50 to 60 m3/h, which results in a 15% increase in sectional-averaged velocity (see Table 1).
For the 30° flume, sand grains of D1 and D2 are initially paved along the left (concave) and right (convex) bank of the B1 bend (sections 5–13, as shown in Figure 1). Figure 3b indicates a quantity of D1 grains (total volumes of 3.5 × 10⁻⁴ m3) were eroded from the left (concave) bank. Similar to the 110° flume, within the B1 bend of the 30° flume, most of those eroded D1 grains (71%) were longitudinally transported to the next bend B2, and only a small proportion (29%) crossed the channel centerline and contributed to the B1 bend point bar deformation (as shown in Figure 3c). Differing from the 110° flume, the evacuating amount of D2 in the B1 bend of the 30° flume is relatively large (5.5 × 10⁻⁴ m3) compared to the scouring near the concave bank (about 1.6 times in volume). For the 30° flume, about 90% of the D2 grains eroded from the B1 bend were longitudinally transported to the next bend B2, i.e., the transverse transport of D2 grains accounts for only 10% (as shown in Figure 3c).
Similarly, in the B1 bend of the 30° flume, bed degradation occurred, and the longitudinal bedload transport prevailed along both sides of the banks. As D1 and D2 grains moved into the next bend B2 (section 13–21, as shown in Figure 1), the longitudinal-transverse sorting continues. As shown in Figure 3b,c, we measured almost identical volumes of 0.9 × 10⁻⁴ m3 of D1 grains for both the left (longitudinally transported) and right (transversely transported) half-width channel in the B2 bend. In other words, the ratio of longitudinal to transverse transport for D1 in the B2 bend is about 1.0. For D2 grains. We measured the volumes of 2.3 × 10⁻⁴ m3 and 2.9 × 10⁻⁴ m3 in the right (longitudinally transported) and left (transversely transported) half-width channel, respectively. The ratio of longitudinal to transverse transport for D2 in the B2 bend is about 0.8.
Sand grains of D3 and D4 are initially paved along the left (convex) and right (concave) bank of the B2 bend of the 30° flume (Figure 1). Figure 3b indicates a quantity of D4 grains (total volumes of 3.1 × 10⁻⁴ m3) were eroded from the left (concave) bank. Within the B2 bend, most of those eroded D4 grains (81%) were longitudinally transported to the next bend B3, and only a small proportion (19%) crossed the channel centerline and contributed to the point bar deformation (as shown in Figure 3c). The ratio of longitudinal to transverse transport of D4 in the B2 bend is about 4.3, much larger than the ratio of D1 in the B1 bend (about 2.4). The evacuating amount of D3 in the B2 bend is about 5.2 × 10⁻⁴ m3. About 90% of the D3 grains eroded from the B2 bend were longitudinally transported to the next bend B3, i.e., the transverse transport of D3 grains accounts for only 10% (as shown in Figure 3c).
Similarly, white-color grains are initially paved along the entire area of the B3 bend of the 30° flume (sections 21–29, as shown in Figure 1). As D3 and D4 grains moved into the B3 bend, the longitudinal-transverse sorting continues. Based on Figure 3b,c, we measured the volumes of 2.7 × 10⁻⁴ m3 and 0.5 × 10⁻⁴ m3 of D3 grains in the left (longitudinally transported) and right (transversely transported) half-width channel, respectively. The ratio of longitudinal to transverse transport for D3 in the B3 bend is about 5.4, while for D4 grains, we measured the volumes of 0.7 × 10⁻⁴ m3 and 1.2 × 10⁻⁴ m3 in the right (longitudinally transported) and left (transversely transported) half-width channel, respectively. The ratio of longitudinal to transverse transport for D4 in the B3 bend is about 0.6.
Table 3 shows the gain and loss volumes of all the colored grains in the B1–B3 bends of the two flumes.

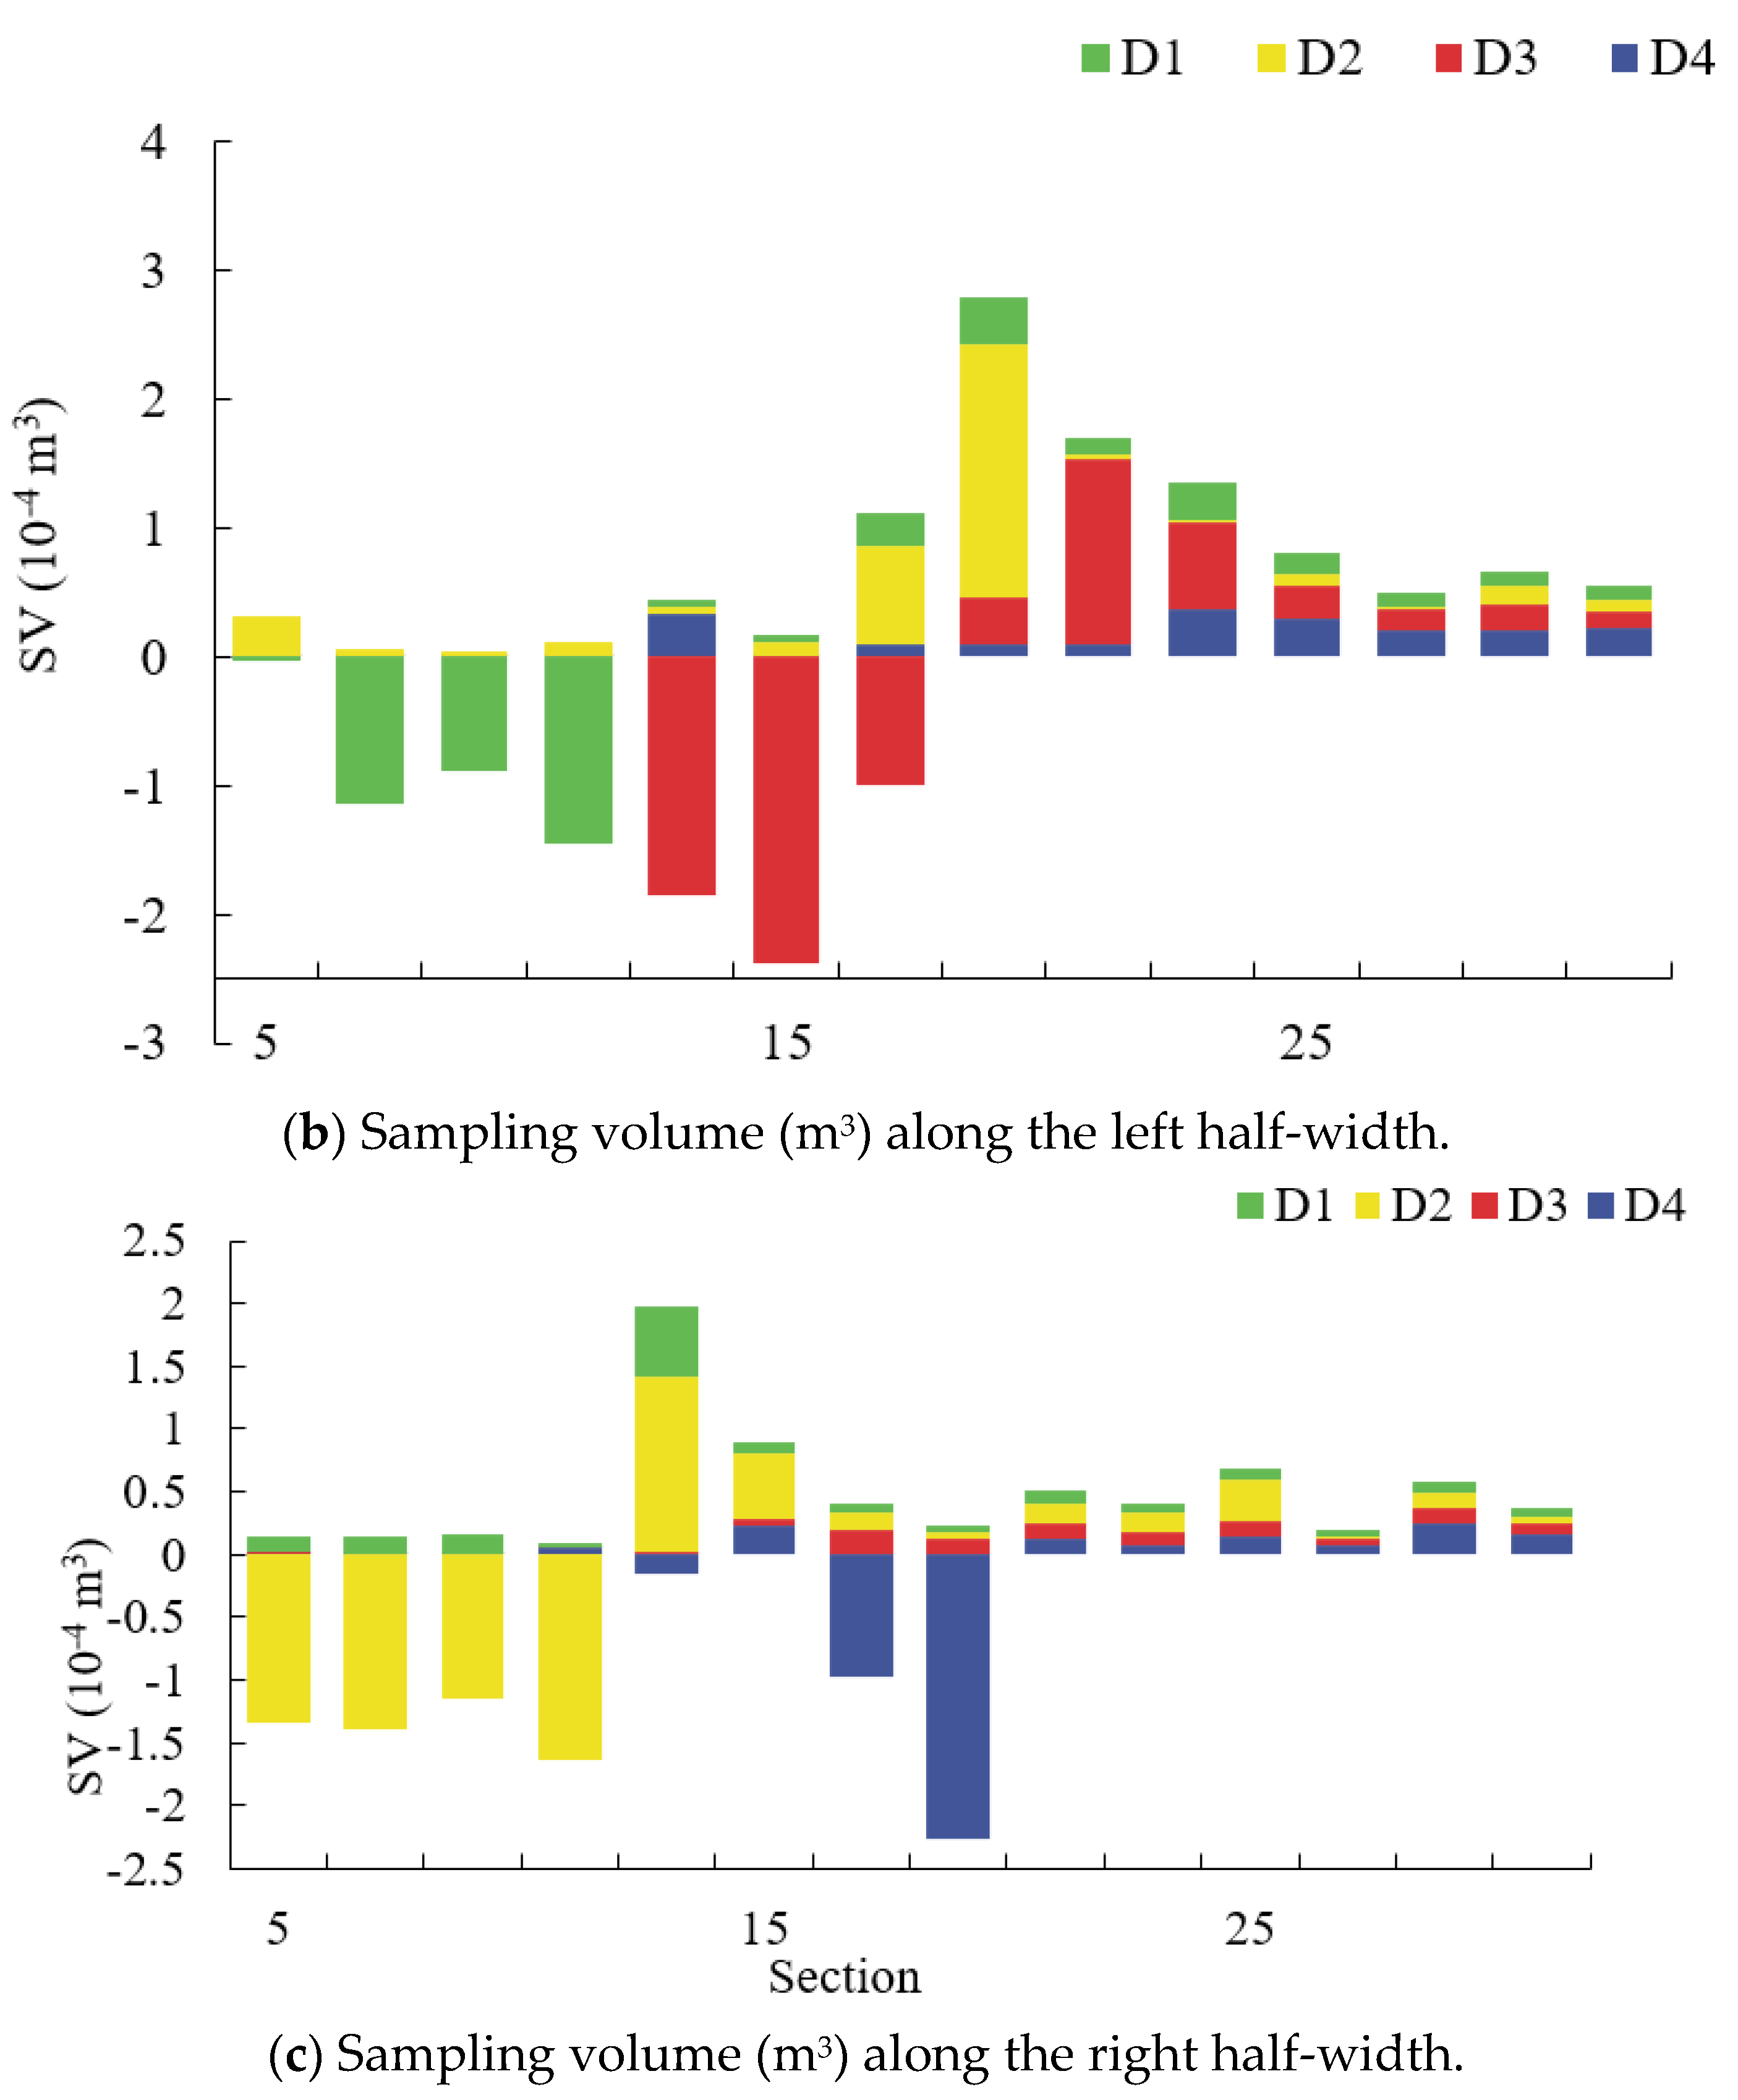
3.3. Accumulated Sample Volume of the Colored Grains

In Figure 4, we accumulate the longitudinally and transversely transported colored grains along the 110° channel in the “next” bend (for instance, B2 bend for D1 or D2 grains.) In this way, one can visually see the spatial variation of longitudinal and transverse transport of the colored grains. Figure 4 indicates that the downstream bends (the B2 or B3 bends) receive sediment supply from both sides of the half-width of the upstream reach (i.e., from the B1 or B2 bends), and for the highly curved channel most grains come from the upstream bed near the concave banks. For the D1 and D4 grains, longitudinal transport is superior. However, it seems that D2 and D3 have opposite behaviors with regard to sorting in the B1 and B2 bends, respectively: for the D2 grains in the B2 bend, the transverse transport is stronger than the longitudinal transport, which is a result of the cross-sectional flow motion; for the D3 grains in the B3 bend, the less transverse transport may be related to the general aggradation occurring in the B3 bend.

3.4. Point Bar Composition

In our flumes, during the formation of point bars, the B2 bends continuously receive D1, D2 and D4 grains and lose D3 grains. The white grains are relatively rare; therefore, they can be neglected. Table 4 summarized the proportions of D1, D2 and D4 grains in the point bars in the B2 bends of the 30° and 110° flumes. Our statistics show that there are 15.9 × 10⁻⁴ m3 of D1, 5 × 10⁻⁴ m3 of D2, and 7.1 × 10⁻⁴ m3 of D4 that contribute to the B2 bend point bar of the 110° flume. It indicates that for the point bars of highly curved channels, most building material (about 73% in this case) comes from upstream bend. Compared to D2, D1 (i.e., the material of the outer side of the upstream bend) makes a much larger contribution (about three times in quantity) to shaping the point bar of the B2 bend. Besides, about 40% D1 and 30% D2 grains were transported toward the concave bank of the B2 bend, compensating for the local grain loss and maintaining the bed elevation.
For the 30° flume, the statistics show there are 0.9 × 10⁻⁴ m3 of D1, 2.9 × 10⁻⁴ m3 of D2, and 0.589 × 10⁻⁴ m3 of D4 that contribute to the B2 bend point bar. It indicates that for the point bar building material about 87% comes from the upstream bend. In contrast to case of the 110° flume, D2 (i.e., the material of the inner-side of the upstream bend) makes a much larger contribution (about three times in quantity) to shaping the point bar of the B2 bend than D1 does.

4. Implication and Discussion

The above analyses are based on our well-controlled flume experiments, in which both the channel width and the flow discharge are constant. Although channel widening or narrowing is common in fluvial rivers, countless aerial and satellite views indicate a relatively constant width prevails in a meandering channel with high sinuosity. In addition, bed deformation is related more to the bankfull discharge or the equivalent effective discharge. Therefore, it is reasonable to maintain steady and uniform flow in our experiments.
The observed behavior of moving grains in Zone 1 (foreside of the point bars) and in Zone 2 (near the concave bank downstream of the bend apexes) is in agreement with what was observed by Termini [18], when she performed an order-of-magnitude analysis of the momentum equation terms with data collected in a meandering laboratory flume having similar general bed topography and same planimetric configuration as the 110° flume used in the present work. Termini [18] observed the existence of a good correspondence between the regions of outward direction of the bed shear stress and the regions of deposition. On the other side, Termini [18] also verified that there is a strong interdependence between the downstream velocity and bed shear stress non-uniformity along the channel and the cross-circulation momentum transport, whose entity depends on the channel’s curvature and on the aspect ratio. She verified the relative importance of the convective and the circulation motions with respect to the distribution of the bed shear stress, which determines the sediment transport along the channel. By comparing the map of positive/negative ratio of the downstream and the cross-stream components of the bed shear stress (which indicates the deviation of the bed shear stress vector from the downstream direction) along a bend with that of the erosion/deposition zones, she observed a good correspondence between the regions of outward direction of the bed shear stress and the regions of deposition. The strong mutual interaction between the cross-circulation and the downstream velocity affects not only the downstream component of the bed shear stress but also the transverse one and, consequently, the direction of the bed shear stress vector. As the curvature increases, the convective accelerations also increase, and the downstream velocity and the bed shear stress, are forced towards the outer bank; as a result, the bed shear stress decreases along the inner bank and increases along the outer bank. Based on her experimental results, she observed that the combination of forces along the bend causes the bed shear stress to shift outwards, i.e., from the inner bank of the upstream bend to the outer bank of the downstream bend. This further confirms that the combination of the dominant longitudinal transport and the cross-sectional motion determines the grains’ distribution along the channel.

5. Summary and Conclusions

This study conducted two experiments in sine-generated flumes with deflection angles of 30° and 110°, which represent the mildly and highly curved channels, respectively. Bed grains were dyed with four different colors and paved along two consecutive bends in order to quantitively trace the same- and opposite-side sediment transport. The experiments recorded the change in flow patterns, bed deformation and the gain-loss distribution of colored grains in the pool-bar complexes. The longitudinal and transverse transport of bedload were evaluated in the examined bends of the two meandering flumes. The following conclusions can be drawn:
(1)
Two types of erosion zone occurred during the process of the bed deformation, i.e., Zone 1 in the foreside of the point bars and Zone 2 near the concave bank downstream of the bend apexes.
(2)
Most grains eroded from both Zone 1 and Zone 2 are observed moving longitudinally as opposed to crossing the channel centerline. The ratios of eroded D1 grains from the B1 bend who were longitudinally transported to the next bend B2 were 71% for the 30° flume and 72% for the 110° flume. The ratios of the D2 grains eroded from the B1 bend who were longitudinally transported to the next bend B2 were 90% for the 30° flume and 86% for the 110° flume.
(3)
Most building material of the point bars comes from the upstream bends, although low- and highly curved channels behave differently. For building material of the B2 bend point bars, the contribution ratios of grains coming from upstream bend were 87% for the 30° flume and 73% for the 110° flume.
The results of this study are appliable to most free meanders which may develop from low-sinuosity to high-sinuosity meander.

Author Contributions

Conceptualization, L.H. and D.C.; methodology, L.H. and D.C.; validation, L.H. and S.Z.; data curation, Z.Z.; writing—original draft preparation, L.H.; writing—review and editing, D.C. and D.T.; supervision, D.C. and D.T.; funding acquisition, L.H. and D.C. All authors have read and agreed to the published version of the manuscript.

Funding

This research was funded by (1) the National Key R&D Program of China (2017YFC0405203) and (2) the National Natural Science Foundation of China (51779242 and 51979264). This paper does not necessarily reflect the views of the funding agencies.

Institutional Review Board Statement

Not applicable.

Informed Consent Statement

Not applicable.

Data Availability Statement

Not applicable.

Conflicts of Interest

The authors declare no conflict of interest.

References

  1. Qian, N.; Zhang, R.; Zhou, Z.D. Fluvial Evolution; Science Press: Beijing, China, 1987. [Google Scholar]
  2. Dietrich, W.E.; Smith, J.D.; Dunne, T. Flow and sediment transport in a sand bedded meander. J. Geol. 1979, 87, 305–315. [Google Scholar] [CrossRef]
  3. Zeng, Q.H. The movement of bedload in bend river. J. Sediment Res. 1982, 59–65. [Google Scholar] [CrossRef]
  4. Lajeunesse, E.; Devauchelle, O.; Houssais, M.; Seizilles, G. Tracer dispersion in bedload transport. Adv. Geosci. 2013, 37, 1–6. [Google Scholar] [CrossRef] [Green Version]
  5. Kasvi, E.; Laamanen, L.; Lotsari, E.; Alho, P. Flow patterns and morphological changes in a sandy me ander bend during a flood-spatially and temporally intensive ADCP measurement approach. Water 2017, 9, 106. [Google Scholar] [CrossRef] [Green Version]
  6. Leopold, L.B. Water surface topography in river channels and implications for meander development. In Gravel-Bed Rivers; Hey, R.D., Bathurst, J.C., Thorne, C.R., Eds.; John Wiley Sons Ltd.: Hoboken, NJ, USA, 1988; pp. 359–388. [Google Scholar]
  7. Friedkin, J. A Laboratory Study of the Meandering of Alluvial Rivers; Technical Reports; U.S. Waterways Experiment Station: Vicksburg, MS, USA, 1945. [Google Scholar]
  8. Rui, D.F. Numerical Model for Circumfluence and Movement of Sediment in Continuous Meandering River. Ph.D. Thesis, Sichuan University, Chengdu, China, 2005. [Google Scholar]
  9. Wang, B. Experiments of Water Flow and Bed Deformation in a Flume with Consecutive Curves; Tsinghua University: Beijing, China, 2008. [Google Scholar]
  10. Wang, P.Y.; Zhao, S.Q.; Cai, J.D. A study on the belt of bedload transport in sinuous channel. J. Sediment Res. 1995, 2, 43–48. [Google Scholar]
  11. He, L.; Chen, D.; Jia, Y.F.; Zhang, Y.X. Modeling bedload transport along river meanders. J. Hydroelectr. Eng. 2016, 35, 54–60. [Google Scholar]
  12. Termini, D. Experimental Observations of Flow and Bed Processes in Large-Amplitude Meandering Flume. J. Hydraul. Eng. 2009, 135, 575–587. [Google Scholar] [CrossRef]
  13. Zhang, R.J.; Xie, B.L. Study on river meander laws. In Proceedings of the 1st International Symposium on River Sedimentation, Beijing, China, 24–29 March 1980. [Google Scholar]
  14. Heays, K.G.; Friedrich, H.; Melville, B.W. Laboratory study of gravel-bed cluster formation and disintegration. Water Resour. Res. 2014, 50, 2227–2241. [Google Scholar] [CrossRef]
  15. Fredj, E.; Carlson, D.F.; Amitai, Y.; Gozolchiani, A.; Gildor, H. The particle tracking and analysis toolbox (PaTATO) for matlab. Limnol. Oceanogr. Methods 2016, 14, 586–599. [Google Scholar] [CrossRef] [Green Version]
  16. Parker, G.; Sawai, K.; Ikeda, S. Bend theory of river meanders. Part 2: Nonlinear deformation of finite-amplitude bends. J. Fluid Mech. 1982, 115, 303–314. [Google Scholar] [CrossRef]
  17. Blondeaux, P.; Seminara, G. A unified bar-bend theory of river meanders. J. Fluid Mech. 1985, 157, 449–470. [Google Scholar] [CrossRef]
  18. Termini, D. Momentum transport and bed shear stress distribution in a meandering bend: Experimental analysis in a laboratory flume. Adv. Water Resour. 2015, 128, 128–141. [Google Scholar] [CrossRef]
Figure 1. Experimental setup and the initial distribution of bed materials (unit: mm); inserts (a) and (b) are photos of the θ0 = 30° and 110° flumes, respectively.
Applsci 11 06560 g001
Figure 2. (a) Bed elevation change (Run 110/1, unit: cm, flow from left to right). (b) Sample volume (unit: m3) of grains D1, D2, D3, D4 at each section along the left bank. (c) Sampling volume (unit: m3) of grains D1, D2, D3, D4 at each section along the right bank. D1, D2, D3, D4 grains are represented by green, yellow, red, and cyan colors, respectively.
Applsci 11 06560 g002aApplsci 11 06560 g002b
Figure 3. (a) Bed elevation change (units are cm, Run 30/1, flow from left to right). (b) Sample volume (unit: m3) of grains D1, D2, D3, D4 at each section along the left bank. (c) Sample volume (unit: m3) of grains D1, D2, D3, D4 at each section along the right bank. D1, D2, D3, D4 grains are represented by green, yellow, red, and cyan colors, respectively.
Applsci 11 06560 g003aApplsci 11 06560 g003b
Figure 4. Accumulated SV of the colored grains (a) along the B2 bend of the 110° flume; (b) along the B3 bend of the 110° flume.
Applsci 11 06560 g004
Table 1. Flow and geometry characteristics of the two experiments.
θ 0 RunΛ(m)λ(m)δQ
(m3 h−1)
B
(cm)
hm
(cm)
B/hmS
(‰)
Um
(m s−1)
ReFr
30°30/12.5182.6941.07604011.53.481.120.3135,6500.29
110°110/12.5189.2983.70504010.04.002.000.2727,0000.27
Note: θ0 is the deflection angle; Λ is the meander wavelength; λ is the length of a curved channel over one meandering wavelength; δ is the sinuosity; Q is the flow discharge; D50 is the mean diameter; B is the flow width; hm is the channel-averaged flow depth; S is the bed slope; Um is the channel-averaged flow velocity; Re is the flow Reynolds number; and Fr is the Froude number.
Table 2. Verification of the accuracy of recognition by Matlab.
Test ScenariosDiameter (mm)Manually5-Time Averaged Amount by MatlabRecognition Rate (%)Note
D1D2D3D4
T115000925.8942.4963.4964.494.90N/A
T215000967.6954.4899.81012.895.87*
T3110,0001725.618611920.21794.691.27N/A
T4110,0001826.418951963.21944.495.36*
* indicates additional light being added when taking photos.
Table 3. Gain and loss of colored grains in the B1–B3 bends (unit: 10−4 m3, negative values means loss and positive means gain).
Bend30°110°
SectionD1D2SectionD1D2
Left BankRight BankLeft BankRight BankLeft BankRight BankLeft BankRight Bank
B15–13−3.51.00.6−5.513–37−34.99.82.6−18.1
B213–210.90.92.92.337–6115.911.35.02.0
B321–290.80.40.30.861–852.72.40.20.2
Bend30°110°
SectionD3D4SectionD3D4
Left BankRight BankLeft BankRight BankLeft BankRight BankLeft BankRight Bank
B213–21−5.20.50.6−3.137–61−14.011.35.02.0
B321–292.70.51.20.761–854.12.810.412.5
Table 4. Composition of point bars in the left bank of Bend B2.
BendSectionVolume of the Sand Bar (×10−4 m3)Proportions of D1–D4 (%)
D1D2D3 *D4
B2, 30° flume13–21 (Left bank)1.4420.566.1--13.4
B2, 110° flume37–61 (Left bank)13.6056.817.9--25.4
* For a sand bar around the convex bank (Bend B2), local grains initially located in the convex bank (D3) may be removed from the bend, while grains moved from the local concave bank and the upper bend should firstly offset the amount of grains being moved out.
Publisher’s Note: MDPI stays neutral with regard to jurisdictional claims in published maps and institutional affiliations.

