1. Introduction
Myofascial Pain Syndrome (MPS) is a painful, regional, myogenic condition localised in skeletal muscles and mostly caused by muscles overload [
1]. Among the temporomandibular disorders (TMDs), it is reported to be the most common disease (50%), and it is reported to affect 9.7% of the overall population [
2]. It arises from the myofascial trigger points (TrPs): hypersensitive, palpable areas made of several contracted motor unities which are located in a taut skeletal muscle band [
1,
3]. TrPs are characteristically far from the site of perceived pain, and notwithstanding the muscular origins of the pain, the chief complaint is not necessarily located in a muscle and may be associated with referred sensory, motor, and autonomic reactions [
4,
5]. Frequently referred pain has been reported in several structures in the head and neck region fairly distant from the origin point, such as: ears, eyes, sinuses, teeth, throat, temporomandibular joints, temples, occiput, vertex, and forehead [
5].
These characteristics frequently complicate the diagnosis and the gold standard for TrPs diagnosis is systematic palpation of the soft tissue performed by well-trained and expert operators [
1]. Expert clinicians can identify the associated trigger points by the examination of the pain referral pattern, which is predictable and reproducible in the same patient and among different patients forms a body map of the referral patterns [
1,
5,
6]. Referred pain depends on the convergence of the trigger points’ nociceptive fibres and the sensory fibres supplying the target area (reference pain region) on the same interneuron in the spinal cord [
7]. Regarding the head and neck region, referred pain is mostly related to the neuronal convergence between the first and the third trigeminal branches [
8]. Thermography (or thermal infrared imaging—IR imaging) is the graphic representation of the body temperature map obtained by the noncontact and noninvasive recording of the spontaneous infrared thermal emission of the body at the superficial level of the human body. This technique allows visualising in real-time the skin temperature, which is the reflection of the microcirculatory dynamic of the blood flow just below the cutaneous surface of the patients [
9]. Functional analysis of this thermal response is largely described, and several biomedical approaches have been reported [
10]. The analysis of the variations in a specific region of interest (ROI) of the thermal pattern obtained with IR has been described as indicators of changes in metabolism, haemodynamic, or neuronal thermoregulatory processes [
11].
Merla et al. [
12] applied the IR imaging to investigate the head–neck skin temperature in response to maximal voluntary clenching in patients suffering from myofascial pain syndrome and in asymptomatic people, and observed that patients feeling pain showed a more asymmetric skin temperature distribution than controls.
Fisher and Chang [
13] observed that in subjects with unilateral low back pain, the hot points’ pain threshold is lower than the contralateral ones. Kruse and Christiansen [
14] observed that people suffering from myofascial pain have more sensitive “hot points” than asymptomatic people’s “cold points”.
Contrary to these studies, some investigations disagree on the usefulness of thermography to detect myofascial tender spots. Radhakrishna et al. [
15] concluded that skin temperature over tender spots does not correlate with pressure sensitivity. Filho et al. [
16] investigated the central point of the masseter and anterior temporalis muscles and concluded that infrared thermography of the masticatory muscles is not an accurate instrument for myogenous TMD diagnosis. A systematic review by the same authors [
17] observed that there are few studies evaluating the accuracy and reliability of infrared thermography for the diagnosis and assessment of TrPs and concluded that there is no agreement on skin temperature patterns in the presence of TrPs.
Haddad et al. [
18] correlated clinical algometry and thermography, concluding that infrared imaging measurements can provide a useful, noninvasive, and non-ionising examination for the diagnosis of MTPs in masticatory muscles. Haddad et al. [
18] focused on the masticatory muscles such as masseter and anterior temporalis, while in our study, we investigated the sternocleidomastoid. This muscle is a main actor in the stomatognathic system and in the kinematic chain of the overall body, thus being extremely relevant for diagnosis and therapeutic purposes. Therefore, the aim of this study is to identify and correlate the referred pain evocated by myofascial trigger points pressure pain threshold (PPT) in the sternocleidomastoid muscle using thermography.
2. Materials and Methods
The study was approved by the Research Ethics Board of the University of Chieti (reference number: 207/2015) and performed in agreement with the Declaration of Helsinki. All participants signed informed consent and could withdraw from the study at any time. Facial thermal infrared thermography (IR) of 46 volunteers (21 male and 25 female, average age 32 ± 6.3) undergoing pressure pain threshold (PPT) of the sternocleidomastoid trigger points was recorded.
Thermal IR imaging was performed using FLIR CAM SC3000 (NETD = 20 mk) with GaAs cooled sensor, Quantum Well Infrared Photon Detector (QWIP) 320 × 240 pixels with 8–9 μm range and thermal field range from −20 °C up to +80 °C, connected with the ThermaCAM Researcher Professional 2.9 software.
The recordings were performed by observing the Academy of Neuro-Muscular Thermography’s standard protocol [
19]. Before performing IR imaging, participants observed acclimatisation in the measurement room for at least 20 min, the temperature of which was maintained at (23 ± 0.5) °C and the humidity was 40%–50%, with no direct air ventilation or exposure to heat sources. The participants were positioned 100 cm far from the camera and were invited to sit on stiff chairs, straight, with their feet on the floor, looking straight ahead, during all the recordings. Subjects put up their hair before registration, uncovering their neck and forehead. They were asked to avoid hot/cold showers, intensive physical activity, coffee, smoking, stimulants, alcoholic drinks, and medicines able to affect sympathetic functions for at least 3 h before undergoing thermal IR imaging. Moreover, they were asked to avoid the use of cream, make-up, earrings, necklaces, and any contact between their hands and face or neck during the exam.
PPT was simultaneously performed on both left and right muscles. After a 2 min baseline, an experienced operator (M.D.A) performed PPT of five TrPs locations on the sternocleidomastoid belly: (i) mastoid insertion, (ii) front cranium belly point, (iii) front caudal belly point, (iv) sternum insertion, and (v) collarbone insertion. Each PPT lasted 10 s, with an interstimulus interval of 2 min. The trigger points were stimulated in the same order across all the subjects, precisely with a cranio-caudal direction. Sixteen thermal IR imaging were recorded for each subject: at baseline (t0), 2 s before the PPT (t1), and 2 s (t2) and 60 s (t3) after the PPT of each TrPs location.
During the inter-stimuli interval, avoiding any movement of head and neck, subjects were asked to draw over a head–neck template displayed on a computer screen the areas of referred pain eventually evoked by the stimulation and the referred pain intensity by means of a Visual Analogue Scale (VAS) ranked over four-levels values (0 = no pain; 1 = weak pain; 2 = clearly perceived pain; 3 = intense pain). The template was based on the innervation areas of the trigeminus nerve branches (ophthalmic, maxillary, and mandibular) and therefore divided into six areas (three for each side). The following six areas were represented in the template (
Figure 1):
- -
Area 1: left frontal region comprising the left nose pyramid up to the tip of it;
- -
Area 2: right frontal region comprising the right nose pyramid up to the tip of it;
- -
Area 3: left temporal region comprising the left hemiface cheekbone, nostril, and upper lip;
- -
Area 4: right temporal region comprising the right hemiface cheekbone, nostril, and upper lip;
- -
Area 5: left mandibular ramus and mandibular angle area, left hemiface, lower lip, and chin;
- -
Area 6: right mandibular ramus and mandibular angle area, right hemiface, lower lip, and chin.
The temperature (T) measured at baseline (t0) was compared with the temperature at t1 for each TrPs location in the same subject: if at least 2 out the 6 areas of the template showed a ΔT(t1 − t0) ≥ 0.1 °C it meant that the subject did not show basal conditions before the PPT; therefore, the measurement of this TrP location was not processed furtherly. For each TrP location that has been validated, two temperature (T) variations were calculated: ΔT
1 = T(t2) − T(t1) and ΔT
2 = T(t3) − T(t1). As stated by Merla et al. [
20], differences in ∆T range ≥ 0.2 °C have been considered significant.
The same template (
Figure 1) was used to report the self-perceived referred pain intensity (VAS) and localisation, and to extract the temperature variation after PPT. Mouth and eyes regions were excluded as they might be confounding in the morphed files. Using the same template, it was possible to obtain superimpositions of the VAS and the temperature variation.
Thermal IR images were processed by means of an in-home made software (IRI ImagePro) [
21], based on the Matlab platform. The facial thermograms of each subject were projected and registered in post-processing over the same six facial regions template (
Figure 1) used by the subject to describe the area of referred pain.
The registration algorithm was based on a warping technique presented in Paolini et al. [
22]. It allowed performing a spatial normalisation between subjects. Spatial normalisation consisted of warping images from several individuals into a common anatomical space (template) so that alterations of the thermal signal could be compared on a pixel-by-pixel basis. To match images from different subjects, a combination of local transformations is required.
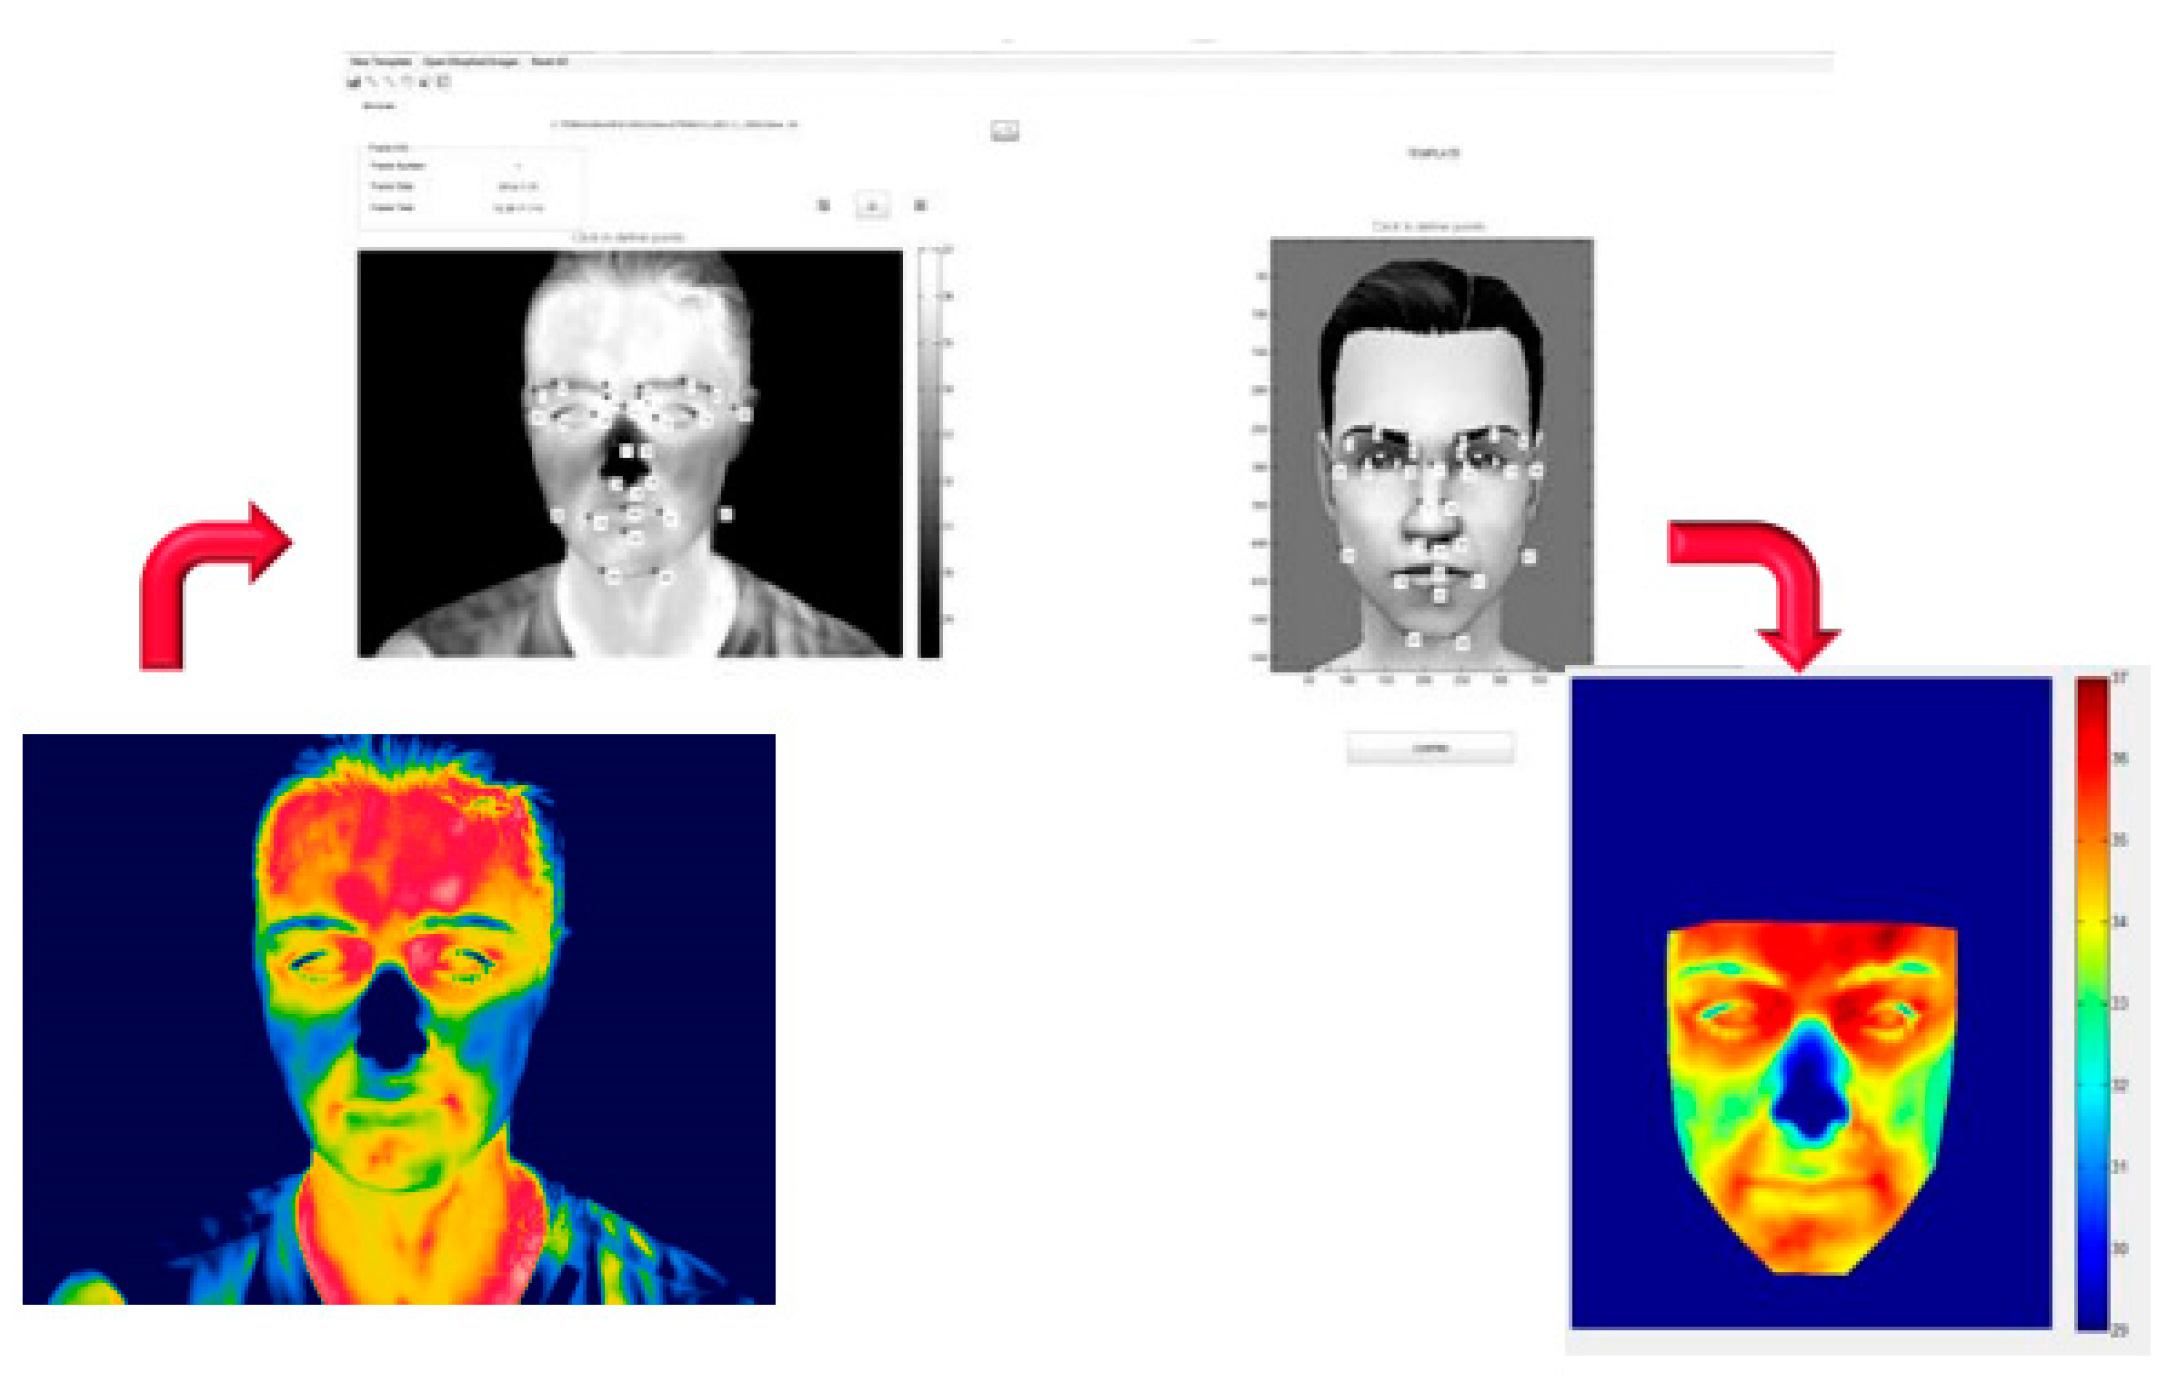
The method was based on the Local Weighted Mean algorithm. It allowed modelling the local varying geometry of the body [
23,
24], based on a set of 28 corresponding points, drawn on the thermogram and template (
Figure 2).
3. Results
Regarding the self-perceived referred pain, 43% of the subjects did not report any pain or discomfort following PPT of any of the TrPs locations on the sternocleidomastoid belly, while 57% of the subjects referred pain in the head and neck. A total of 80% of the latter reported a VAS 3 in at least one of the TrPs locations on the sternocleidomastoid belly, 15% at least a VAS 2 and only 5% a VAS 1. Overall, 244 TrPs locations evocated a referred pain response, of which 127 have been reported evocating a VAS 3 pain intensity, 56 a VAS 2 and 61 a VAS 1. The front cranium belly point resulted in evocating the most referred pain intensity with 46 VAS 3 responses, 11 VAS 2, and 9 VAS 1. The first trigger point situated on the mastoid insertion and the fourth trigger point situated on the sternum insertion did not evocate any VAS 3 or VAS 2 reaction. The frontal region resulted in being the most indicated area as the site of referred pain: 40% and 33% of the subjects reported pain in area 1 and area 2, respectively.
The instantaneous temperature for each of the six areas of the template of each subject was extracted by the “ROI Analysis” at baseline (t0), 2 s before the PPT (t1), and 2 s (t2) and 60 s (t3) after the PPT.
The temperature measured 2 s before the PPT of each TrPs location (t1) was compared with the baseline temperature (t0) of each of the six areas in the same subject. If at least two areas showed a ΔT(t1 − t0) ≥ 0.1 °C, it meant that the subject did not show basal conditions before the PPT; therefore, the measurement of this TrP location was not processed. After performing this comparison, 98 out of 230 PPT were excluded.
In the end, the temperature template of the 132 remaining PPT and the correspondent VAS template were superimposed (
Figure 3).
Regarding the thermal IR imaging data analysis, the following parameters computed over each region’s temperature (T) were calculated ΔT1 = T(t2) − T(t1) and ΔT2 = T(t3) − T(t1); differences in ∆T range ≥ 0.2 °C have been considered significant. 20 In 77% of the superimpositions, the referred pain area corresponded to a ΔT2 ≥ 0.2 °C while only the 59% corresponded to a ΔT1 ≥ 0.2 °C. In 19% of superimpositions, a ΔT2 ≥ 0.2 °C did not correspond to a referred pain area indicated by the patient, and this percentage lowers to 4% for ΔT1 ≥ 0.2 °C. None of the areas that reported a VAS 0 or 1 showed a ΔT1 ≥ 0.2 °C or a ΔT2 ≥ 0.2 °C.
4. Discussion
Referred pain is explained by the converging projection between peripheral nociceptive and sensitive fibres of the reference pain areas on the same interneuron in the spinal marrow. Pain is referred to be felt in a different place from its actual origin site because nociceptive stimuli, both those originating at the trigger points and those of the target area, reach upper nervous centres through just one neuron of second-order [
8].
For this reason, the stimulation of the target area does not increase the symptomatology, while the stimulation of the trigger points increases both local and referred pain. It is also possible that the patient feels the referred pain without perceiving pain at the trigger point location.
Given the central role of the sternocleidomastoid for mastication, swallowing, and control of head movements and the fact that trigger points for referred pain are more commonly found in the sternocleidomastoid, we decided to focus our research only on its trigger points and referred pain areas.
According to the maps of referred pain, the stimulation of the sternocleidomastoid breastbone’s head induces pain in the occiput; then, it radiates in the eyebrow, cheek, and throat, whereas the stimulation of the collarbone’s head is linked to a frontal headache, to a mastoid and auricular pain.
Our investigation wanted to examine thermal reactions in facial areas of referred pain after the stimulation of sternocleidomastoid trigger points. Previous studies focused on the thermographic assessment of facial temperature distribution in patients suffering from myofascial pain [
18]. However, to the best of our knowledge, no one examined whether the temperature changes eventually found in those regions correlates with the intensity of the perceived pain concomitantly with the stimulation of sternocleidomastoid.
No significant local temperature changes were found to be associated with a 0 or 1 VAS score. This result agrees with the literature which reports hyperthermal distribution in the presence of referred pain [
25].
The use of thermographic examination in the diagnosis of TMDs have been largely investigated in the literature [
26,
27,
28,
29], and several studies focused on myogenous pain [
20,
25] but only a few studies applied superimposition of ROI images [
18,
30]. A recent survey also assessed that facial nerve function is one of the possible biomedical applications of infrared thermography [
31]. Starting from these evidences, the present study seems to state the efficiency of the IR thermography in investigating facial nerve response related to TMDs.
Our study refers to a small sample of subjects. There is no clear evidence supported by strong statistical analysis to support our findings, and therefore it might be considered as a pilot study. However, our results seem to prove that the amplitude of the temperature variation is related to the self-reported perceived pain and introduce several elements of novelty such as the stimulation scheme, the focus on the sternocleidomastoid muscle, and the image processing of thermal data.
We found that the temperature variation 2 s after the stimulation (t2) was not significantly different from the pre-stimulation temperature, while the largest temperature differences occurred after several seconds (t3). This result suggests that the thermal processes associated with the pain perception in the referred pain areas are slow and delayed compared to the stimulus.
The absence of previous studies investigating IR imaging the referred pain evocated by stimulation of TrP locations along the sternocleidomastoid belly makes it difficult to compare our results with the existing literature. Haddad et al. [
18] correlated the referred and local pain evocated by TrP situated on masseter and anterior temporalis muscles using thermography and algometry by ROI images, concluding that IR imaging measurement could be an aid in the diagnosis of myofascial trigger points in masticatory muscles. Our results seem to extend this conclusion not only to the chewing muscles but also to those of the neck, closely connected to the stomatognathic system such as the sternocleidomastoid. Another study by Barbosa et al. [
29] used ROI images to investigate the intensity of pain upon palpation of the masseter, anterior temporalis, and TMJ, but their results were not so favourable to use for this appliance in TMD.
However, we can conclude that the referred pain evoked by stimulation of the trigger points of the neck–head region generates a specific thermal signature in those regions, the importance of which appears to be related to the self-report perceived pain. This result should be confirmed over a larger size of subjects and by a statistical correlation analysis of sensitivity and specificity in order to confirm a possible diagnostic sign based on thermal infrared imaging for the characterisation of the referred pain.
5. Conclusions
Considering the limitations of this pilot study, thermography seems to be an effective noninvasive and non-ionising analysis to identify referred pain evocated by TrPs on the sternocleidomastoid muscle. Further studies are needed to assess the potential of IR imaging in TMD.
Author Contributions
Conceptualisation, M.D., L.R. and F.C.; methodology, M.D., L.R. and F.C.; software, L.R.; validation, M.D., F.M. and F.C.; formal analysis, F.C.; investigation, L.R. and M.D.; data curation, L.R.; writing—original draft preparation, L.R. and F.C.; writing—review and editing, F.M.; visualisation, M.D. and F.C.; supervision, M.D. All authors have read and agreed to the published version of the manuscript.
Funding
This research received no external funding.
Institutional Review Board Statement
The study was conducted according to the guidelines of the Declaration of Helsinki and approved by the Institutional Review Board (or Ethics Committee) of the University of Chieti (reference number: 207/2015).
Informed Consent Statement
Informed consent was obtained from all subjects involved in the study.
Data Availability Statement
The data presented in this study are available on request from the corresponding author.
Conflicts of Interest
The authors declare no conflict of interest.
References
- Simons, D.G.; Travell, J.G.; Simons, L.S. Travell & Simons’ Myofascial Pain and Dysfunction: The Trigger Point Manual, 2nd ed.; Williams & Wilkins: Baltimore, MD, USA, 1999; Volume 1. [Google Scholar]
- Manfredini, D.; Guarda-Nardini, L.; Wincour, E.; Piccotti, F.; Ahlberg, J.; Lobbezoo, F. Research diagnostic criteria for temporomandibular disorders. A systematic review of axis epidemiological findings. Oral. Surg. Oral. Med. Oral. Pathol. Oral. Radiol. Endod. 2011, 112, 453–462. [Google Scholar] [CrossRef] [PubMed]
- Gerwin, R.D. A study of 96 subjects examined both for fibromyalgia and myofascial pain. J. Musculoskel Pain 1995, 3 (Suppl. 1), 121. [Google Scholar]
- Couppe, C.; Torelli, P.; Fuglsang-Frederiksen, A.; Andersen, K.V.; Jensen, R. Myofascial trigger points are very prevalent in patients with chronic tension-type headache: A double-blinded controlled study. Clin. J. Pain 2007, 23, 23–27. [Google Scholar] [CrossRef] [PubMed]
- Jaeger, B. Myofascial trigger point pain. Alpha Omegan 2013, 106, 14–22. [Google Scholar] [PubMed]
- Sikdar, S.; Shah, J.P.; Gilliams, E.; Gebreab, T.; Gerber, L.H. Assessment of myofascial trigger points (MTrPs): A new application of ultrasound imaging and vibration sonoelastography. Annu. Int. Conf. IEEE Eng. Med. Biol. Soc. 2008, 2008, 5585–5588. [Google Scholar] [PubMed]
- Travell, J. TMJ pain referred from muscles of head and neck. J. Prosthet. Dent. 1960, 10, 745–763. [Google Scholar] [CrossRef]
- Sessle, B.J.; Hu, J.W.; Amano, N.; Zhong, G. Convergence of cutaneous, tooth pulp, visceral, neck and muscle afferents onto nociceptive and non-noceceptive neurones in trigeminal subnucleuscaudalis (medullary dorsal horn) and its implications for referred pain. Pain 1986, 27, 219–235. [Google Scholar] [CrossRef]
- Vargas, J.V.C.; Brioschi, M.L.; Dias, F.G.; Parolin, M.B.; Mulinari-Brenner, F.A.; Ordonez, J.C.; Colman, D. Normalized methodology for medical infrared imaging. Infrared Phys. Tech. 2009, 52, 42–47. [Google Scholar] [CrossRef]
- Merla, A.; Romani, G.L. Functional infrared imaging in medicine: A quantitative diagnostic approach. Conf. Proc. IEEE Eng. Med. Biol. Soc. 2006, 2006, 224–227. [Google Scholar]
- Gratt, B.M.; Sickles, E.A. Thermographic characterization of the asymptomatic temporomandibular joint. J. Orofac. Pain 1993, 7, 7–14. [Google Scholar]
- Merla, A.; Ciuffolo, F.; De Michele, G.; Tangherlini, A.; D’Attilio, M.; Rezza, S.; Festa, F.; Romani, G.L. Functional infrared imaging in the myofascial pain. In Proceedings of the 3rd European Medical and Biological Engineering Conference, Tampere, Finland, 20–25 November 2005. [Google Scholar]
- Fischer, A.A.; Chang, C.H. Temperature and pressure threshold measurements in trigger points. Thermology 1986, 1, 212–215. [Google Scholar]
- Kruse, R.A., Jr.; Christiansen, J.A. Thermographic imaging of myofascial trigger points: A follow-up study. Arch. Phys. Med. Rehabil. 1992, 73, 819–823. [Google Scholar]
- Radhakrishna, M.; Burnham, R. Infrared Skin Temperature Measurement Cannot Be Used to Detect Myofascial Tender Spots. Arch. Phys Med. Rehabil. 2001, 82, 902–905. [Google Scholar] [CrossRef]
- Dibai Filho, A.V.; Packer, A.C.; Costa, A.C.; Rodrigues-Bigaton, D. Accuracy of infrared thermography of the masticatory muscles for the diagnosis of myogenous temporomandibular disorder. J. Manip. Physiol. Ther. 2013, 36, 245–252. [Google Scholar] [CrossRef]
- Dibai-Filho, A.V.; Guirro, R.R.J. Evaluation of myofascial trigger points using infrared thermography: A critical review of the literature. J. Manip. Physiol. Ther. 2015, 38, 86–92. [Google Scholar] [CrossRef] [PubMed]
- Haddad, D.S.; Brioschi, M.L.; Arita, E.S. Thermographic and clinical correlation of myofascial trigger points in the masticatory muscles. Dentomaxillofac Radiol. 2012, 41, 621–629. [Google Scholar] [CrossRef]
- Schwartz, R.G.; Elliott, R.; Goldberg, G.S.; Govindan, S.; Conwell, T.; Hoekstra, P.P. Guidelines for neuromusculoskeletal thermography. Thermol. Int. 2006, 16, 5–9. [Google Scholar]
- Merla, A.; Ciuffolo, F.; D’Attilio, M.; Tecco, S.; Festa, F.; De Michele, G.; Tangherlini, A.; Romani, G.L. Functional infrared imaging in the diagnosis of the myofascial pain. Conf. Proc. IEEE Eng. Med. Biol. Soc. 2004, 2004, 1188–1191. [Google Scholar] [PubMed]
- Merla, A.; Di Donato, L.; Romani, G.L. ImagePro: Software for Infrared Functional Imaging. In Proceedings of the 2nd European Medical and Biological Engineering Conference EMBEC02, Vienna, Vienna, 4–8 December 2002; Volume 2, pp. 1612–1613. [Google Scholar]
- Paolini, D.; Alparone, F.R.; Cardone, D.; van Bees, I.; Merla, A. “The face of ostracism”: The impact of the social categorization on the thermal facial responses of the target and the observer. Acta Psychol. 2016, 16365–16373. [Google Scholar] [CrossRef]
- Goshtasby, A. Piecewise linear mapping functions for image registration. Pattern Recognit. 1986, 19, 459–466. [Google Scholar] [CrossRef]
- Goshtasby, A. Image registration by local approximation methods. Image Vision Comput. 1988, 6, 255–261. [Google Scholar] [CrossRef]
- Fricova, J.; Janatova, M.; Anders, M.; Albrecht, J.; Rokyta, R. Thermovision: A new diagnostic method for orofacial pain? J. Pain Res. 2018, 11, 3195–3203. [Google Scholar] [CrossRef] [Green Version]
- Clemente, M.P.; Mendes, J.; Moreira, A.; Vardasca, R.; Ferreira, A.P.; Amarante, J.M. Wind Instrumentalists and Temporomandibular Disorder: From Diagnosis to Treatment. Dent. J. 2018, 6, 41. [Google Scholar] [CrossRef] [PubMed] [Green Version]
- de Melo, D.P.; Bento, P.M.; Peixoto, L.R.; Martins, S.K.L.D.; Martins, C.C. Is infrared thermography effective in the diagnosis of temporomandibular disorders? A systematic review. Oral. Surg. Oral. Med. Oral. Pathol. Oral. Radiol. 2019, 127, 185–192. [Google Scholar] [CrossRef]
- Machoy, M.; Szyszka-Sommerfeld, L.; Rahnama, M.; Koprowski, R.; Wilczyński, S.; Woźniak, K. Diagnosis of Temporomandibular Disorders Using Thermovision Imaging. Pain Res. Manag. 2020, 2020, 5481365. [Google Scholar] [CrossRef]
- Mozhdeh, M.; Caroccia, F.; Moscagiuri, F.; Festa, F.; D’Attilio, M. Evaluation of Knowledge among Dentists on Symptoms and Treatments of Temporomandibular Disorders in Italy. Int. J. Environ. Res. Public Health 2020, 17, 8760. [Google Scholar] [CrossRef] [PubMed]
- Barbosa, J.S.; Amorim, A.; Arruda, M.; Medeiros, G.; Freitas, A.; Vieira, L.; Melo, D.P.; Bento, P.M. Infrared thermography assessment of patients with temporomandibular disorders. Dentomaxillofac Radiol. 2020, 49, 20190392. [Google Scholar] [CrossRef] [PubMed]
- Vardasca, R.; Magalhaes, C.; Mendes, J. Biomedical Applications of Infrared Thermal Imaging: Current State of Machine Learning Classification. Proceedings 2019, 27, 46. [Google Scholar] [CrossRef] [Green Version]
| Publisher’s Note: MDPI stays neutral with regard to jurisdictional claims in published maps and institutional affiliations. |
© 2021 by the authors. Licensee MDPI, Basel, Switzerland. This article is an open access article distributed under the terms and conditions of the Creative Commons Attribution (CC BY) license (https://creativecommons.org/licenses/by/4.0/).


