Article

Bamboo Biochar and a Nopal-Based Biofertilizer as Improvers of Alkaline Soils with Low Buffer Capacity

by
Addi Santiago Cruz-Méndez
1,
Esaú Ortega-Ramírez
1,
Carlos Alexander Lucho-Constantino
1,
Oscar Arce-Cervantes
2,
Gabriela Alejandra Vázquez-Rodríguez
1,
Claudia Coronel-Olivares
1 and
Rosa Icela Beltrán-Hernández
1,*
1
Centro de Investigaciones Químicas, Universidad Autónoma del Estado de Hidalgo, Carretera Pachuca-Tulancingo Km. 4.5, Pachuca 42184, Mexico
2
Área Académica de Ciencias Agrícolas y Forestales, Instituto de Ciencias Agropecuarias Universidad Autónoma del Estado de Hidalgo, Tulancingo 43600, Mexico
*
Author to whom correspondence should be addressed.
Appl. Sci. 2021, 11(14), 6502; https://doi.org/10.3390/app11146502
Submission received: 13 May 2021 / Revised: 29 June 2021 / Accepted: 6 July 2021 / Published: 15 July 2021
(This article belongs to the Special Issue Environmental Applications of Char Materials: Pyrochar and Hydrochar)

Abstract

:
Alkaline soils with low buffering capacity are susceptible to amendments such as biochar or biofertilizers, which could drastically alter their pH. For that, this study aimed to evaluate the effectiveness of a low biochar and biofertilizer addition to improve soil characteristics and the use of nutrients to reduce the doses of chemical fertilizer. For that, we measured the initial effect of biochar addition on the soil characteristics. Then, to evaluate the changes produced by biochar and biofertilizer on cultivated soil, we carried out a greenhouse experiment with Physalis ixocarpa for two crop cycles. We also studied the nutrient use efficiency, comparing chemical fertilization at 100% (without biochar) against 50% and 20% with biochar on crop yield, plant height, fruit weight, and root length. Finally, we compared the combination of biochar and biofertilizer with the treatments mentioned earlier. The results showed that after adding 0.2% of bamboo biochar, bulk density (BD) decreased while CEC, as well as OM, Pav, Fe, and Cu contents, increased in the soil. The combination of biochar and biofertilizer improved WHC, Pav, and OM comparing to the soil added with biochar. We found that the bamboo biochar and nopal-based fertilizer are suitable improvers for the studied soil.

1. Introduction

Soils of arid and semi-arid areas are characterized by low contents of organic matter, scarce water storage, imbalanced mineral nutrients, and coarse texture that make them low fertile environments [1]. The progressive land degradation process of arid, semi-arid, and dry sub-humid areas by human activities and climatic variations is known as desertification. This phenomenon is responsible for the gradual loss of fertility, leading to non-fertile and desertified lands [2]. According to the IPCC Fifth Assessment Report, 46.2% of the global land area is occupied by drylands, also called arid lands (i.e., hyper-arid, arid, semi-arid, and dry sub-humid areas) [3], and by the end of this century, a further 10% could be added to the previous value if a high greenhouse emission scenario continues [4].
Some of the limiting conditions of arid zone soils could be reversed with the use of bioproducts such as biofertilizers and biochar. The term biofertilizer is too broad, as it comprises microorganisms, anaerobic digestates, green fertilizers, and manures, as well as plant and algae extracts. Therefore, in general terms, biofertilizers are products of biological origin that contain nutrients and beneficial microorganisms to grow plants [5]. In turn, biochar is a porous, rich-carbon material obtained from biomass pyrolysis with limited or no oxygen [6,7].
Biofertilizers are characterized by providing nutrients to the soil in forms that are either directly absorbed or rapidly transformed into assimilable forms by plants [5]. In addition, microorganisms present in biofertilizers can perform the following functions: (a) biofertilizers, increase the supply of nutrients by fixing atmospheric N, solubilizing minerals, and mineralizing organic compounds [5]; (b) biostimulateprocesses in seeds and plants by the production of phytohormones and vitamins, among others [8]; (c) improve soil by forming stable aggregates [9]; (d) act as biocontrol agents against pathogens [10]; (e) perform bioremediation by degrading xenobiotic or toxic compounds [11]; (f) act as eco-physiological improvers, by increasing the plant resistance to biotic and abiotic stress [12]. According to the above functions, biofertilizers represent an attractive option to improve soil quality, not only in drylands but also in humid ecosystems [13]. However, it is important to keep in mind that there are various factors involved in the interaction of microorganisms, plants, and soil. The crop, the nature of the biofertilizer, the type and current state of the soil, and soil and crop management practices will influence the outcome of biofertilizer application [14].
Currently, biofertilizers have gained importance due to different reasons. On the one hand, for countries that import most chemical fertilizers, biofertilizers represent a more accessible option and tailorable to local needs [14]. On the other hand, in the European Union, the goal for 2030 is to replace 20% of chemical fertilizers with biofertilizers to recover soils, to take care of the health of the population, and to reduce the environmental impact caused by the production and use of chemical fertilizers [15].
Due to its porous carbonaceous structure, high surface area, functional groups, and liming content, biochar is a multifunctional soil product [16]. It has fertilizer potential, depending on the composition of the feedstock and pyrolysis conditions used for its production [17,18,19]. Additionally, it can act as a soil conditioner, improving physical characteristics such as bulk density (BD), porosity, and water-holding capacity (WHC) [7]. Besides, there is evidence about biochar as an amendment to ameliorate chemical soil properties, such as pH, CEC, and mineral nutrient content [16,20]. Likewise, some studies have found positive effects of biochar on the composition and activity of soil microorganisms. [21,22,23]. Additionally, biochar has been proved to be an environmentally friendly and cost-effective adsorbent to treat soils contaminated with heavy metals [24,25]. It is important to take into account that the effects of biochar on soil vary widely. While most studies report positive effects of biochar on soils and crops, there are also others where the effects have been null or negative [26,27].
Several studies have confirmed that infertile, acidic, and coarse-textured soils are more responsive to alkaline biochar addition [16,28,29]. Thanks to porous biochar structure, soil physical characteristics improve (BD, porosity, aggregate stability, WHC, plant available water, and infiltration rate) [7,16,30]. Due to the biochar liming effect, pH increases, which favors alkaline nutrient retention (Na, K, Mg, and P) by increasing the negative charges in the soil (i.e., cation exchange capacity, CEC) [16,20,28]. Consequently, crop productivity raises between 10 and 13% with a median application rate of biochar of 15 Mg·ha−1 [31,32]. Nevertheless, some studies have not found beneficial effects on physical properties related to water retention and porosity by biochar addition to sandy soils [29,33]. Jeffery et al. [29] attributed this to the hydrophobicity of biochar used in their study. This highlights the importance of selecting or designing biochar characteristics according to soil needs.
There is also enough evidence that in temperate soils, biochar has not significantly influenced soil quality [16,29,31]. It is important to take into account that, in general, temperate soils are fertile with a pH close to neutrality [31]. Since pH is not a limiting condition in these soils, the liming effect of biochar is not evident or even often is ignored in the experimental design [16,31]. Besides, the abundance of nutrients in the soil could mask both the addition and immobilization of nutrients by biochar. However, some researchers have found beneficial effects of biochar on physical characteristics of temperate soils with significant impact. [31]. For example, a decrease in BD enhances seed germination, root growth, and mycorrhizal nutrient mining and could reduce tillage costs [34,35]. The median rate of biochar application on temperate soils is 30 Mg·ha−1 [31], double that of tropical soils.
Unlike tropical and temperate soils, the effect of biochar in arid and semi-arid soils has hardly been studied [36]. Some researchers have reported amelioration in BD, WHC, organic matter content (OM), pH, CEC in these soils with biochar additions of 8 Mg·ha−1 [36], 45 Mg·ha−1 [37], ≥39.5 Mg·ha−1 [38], and 135 Mg·ha−1 [39]. Ippolito et al. [40] found that adding 27 Mg·ha−1 of biochar reduced the leaching of some nutrients (Ca, Mg, NO3) and increased the total carbon content in two aridisols. Ducey et al. [41] evaluated activated biochar applications of 12, 24, and 120 Mg·ha−1 on the abundance of genes involved in N cycling. They found that with 120 Mg·ha−1, genes involved in nitrogen fixation and denitrification increased significantly. In the previous studies, the researchers agreed that the acid and neutral biochars, obtained at lower temperatures (250–400 °C), presented better performance, which is understandable due to the alkaline pH of soils studied [36,39,40]. Another characteristic shared by the soils of the previous studies is their calcareous nature, which gives them a high buffering capacity that makes it difficult to correct their pH by biochar addition; only small decreases with respect to unamended soils were observed in some studies [36,39,41]. However, the high application rates used in most of the studies earlier mentioned suggest the need to investigate with other biochars or with periodic applications. The fact that biomass is scarce in drylands should betaken into account, so the production and use of biochar must be sustainable.
Hidalgo (Mexico) is a mining state with a growing industry, where livestock and agriculture are also important economic activities [42]. One of the most evident effects of these activities on soil has been the decrease in its buffer capacity due to the dissolution of carbonates as a consequence of the acid mine drainage, excessive nitrogen fertilization, the use of large amounts of manure, agriculture irrigation with sewage water, and acid depositions [43]. Additionally, at least 33% of Hidalgo’s territory is semi-arid, with poorly fertile soils, where the loss of buffering capacity is combined with low organic matter and clay contents, which make these soils fragile environments, in which a pH modification could severely alter other soil properties. Given the absence of information about the effect that biochar could exert on soils with these characteristics and the irreversible nature of the addition of biochar, we consider it necessary to evaluate the effect of small doses of biochar on a greenhouse scale. We also proposed to use the nopal pruning residues, a locally abundant resource, to obtain a biofertilizer that provides nutrients and beneficial microorganisms to the soil. Thus, the objectives of this study were as follows: (i) evaluate the initial effects of biochar addition on soil characteristics, (ii) study the short term evolution of soil added with biochar and nopal based-biofertilizer along with two crop cycles, and (iii) evaluate the effectiveness of biochar to improve the nutrient-use efficiency, reducing the chemical fertilizers application rates.

2. Materials and Methods

2.1. Biochar

The biochar used in this study was produced by slow pyrolysis at moderate temperature (450–550 °C) from residual bamboo biomass by the Biotecnología Mexicana company. Ghodake et al. [44] emphasize that feedstock selection is crucial to ensure the sustainability of biochar production, namely, that it fulfills its agronomic function without neglecting the socioeconomic and socio-environmental aspects involved. In this sense, residual bamboo biomass is a feedstock with great potential for obtaining biochar. Bamboo is a fast-growing plant, useful for controlling soil erosion and a windbreak barrier during its vegetative development, and once harvested, all its parts are used for different purposes [45]. Bamboo cultivation is currently being encouraged in several Mexican states by creating clusters dedicated to its production and commercialization, guaranteeing its availability as feedstock for biochar.
Biochar was characterized applying the methods proposed by the International Biochar Initiative (IBI) [46]: pH and electrical conductivity (EC) were measured in a dilution 1:20 (w/v) biochar:distilled water after 90 min of shaking using a pH/CON meter (OAKTON, Vernon Hills, IL, USA). Available phosphorus (Pav) was extracted with 2% acid formic and then quantified by spectrophotometry (Thermo Fisher Scientific, Waltham, MA, USA). Total C, N, and H were determined using a dry combustion-elemental analyzer (Perkin Elmer, Waltham, MA, USA). Organic carbon (Corg) was obtained subtracting inorganic carbon from the total carbon. Particle size distribution was obtained by progressive dry sieving with 9.5 mm, 2 mm, 1 mm, and 0.6 mm sieves. For CEC and BD determinations, the AS-03 and AS-12 methods were applied [47]. WHC was determined in the same way it was performed for soil. Each determination was made in triplicate.

2.2. Biofertilizer

The biofertilizer was produced from residual cladodes of nopal (Opuntia ficus-indica) by anaerobic fermentation, using rabbit manure as inoculum. Opuntia ficus-indica is originally from Mexico, currently present all over the world, whose abundance and high water content (approximately 90%) make it an ideal substrate for anaerobic digestion [48]. Opuntias are an important biomass source in arid and semi-arid areas where they thrive by efficiently using scarce water, characteristic of these places, thanks to the crassulacean acid metabolism (CAM) they possess. In Hidalgo, there are 560,160 hectares planted with Opuntias, which generate an average of 6 Mg·ha−1 annually as pruning residues, which are not used, causing environmental and public health problems [49].
The biofertilizer was produced in three 60 L batch reactors, which were fed with an organic load rate (OLR) of 1.5 g VS·L−1d−1, and operated at a hydraulic retention time of 50 days at room temperature (about 20 °C). pH of the feed was adjusted (at 6.5) with KOH. The inoculum was prepared mixing fresh rabbit manure and water (1:3 w/v). The mixture was kept under anaerobic conditions for 50 days before being utilized for inoculating bioreactors. For the biofertilizer characterization, the methods described by Boraste et al. [50] were applied to quantify organic carbon by acidic oxidation with potassium dichromate, total nitrogen by Kjeldahl method, and total phosphorus by Klett–Summerson method. The chemical oxygen demand was determined by method 5220 of the Standard Methods [51]. The contents of Ca, K, Mg, Na, Cu, Fe, and Zn were quantified by atomic absorption spectroscopy (AAS) (Agilent, Santa Clara, CA, USA) in a sample previously digested in a microwave oven (CEM, Matthews, NC, USA) applying the EPA 3051 method [52]. Auxins were analyzed according to Glickmann and Dessaux [53], and for gibberellins, Graham and Henderson [54] methodology was applied. All the above determinations were made in triplicate. To quantify N-fixing microorganisms, tenfold selected dilutions (10−3–10−5 in 0.9% NaCl) were poured by triplicate on plates containing Ashby-Sucrose agar, then plates were incubated at 28 °C for 7 days. To evaluate the total microflora in the biofertilizer, the mesophilic aerobes (MA) were quantified pouring tenfold selected dilutions (10−5–10−7 in 0.9% NaCl) by triplicate on plates with standard count agar (BD Bioxon, Estado de Mexico, Mexico), which were incubated at 37 °C for 48 h. The presence of Salmonella, E. coli, and fecal coliforms was investigated as well. The same dilutions used for MA were poured on plates with eosin methylene blue agar (EMB, Dibico, Cuatitlán Izcalli, Mexico) to quantify fecal coliforms and on violet red bile agar MUG (VRB-MUG, Difco, Waltham, MA, USA) for E. coli and total coliform bacteria counting. After, the plates were incubated at 37 °C for 24 h.

2.3. Sampling Site

The experimental soil was taken from a rainfed agricultural field located in the municipality of Zempoala, Hidalgo, Mexico, at 19°48′20°03′ N and 98°31′98°50′ W, at an altitude between 2400 and 2900 m.a.s.l. Its climate is predominantly dry temperate, with 14.3 °C as annual average temperature and 480 mm of annual precipitation [55]. According to De Martonne’s aridity index (IDM = 19.75), this zone is classified as semi-arid [56]. For almost 20 years, barley had been grown in this soil, with periodical sheep droppings additions, but it has remained uncultivated for the last 5 years.

Preparation and Characterization of Soil

Before taking soil samples, a hand weeding and a 0–40 cm subsoiling using a walking tractor (Honda, Tokyo, Japan) were carried out. A part of the soil was added with biochar at a rate of 8 t/ha (0.2%). Once prepared, the soil and soil with biochar were packed into plastic bags (3 kg/bag), and characterized according to the methods established by the NOM-021-SEMARNAT-2000 [47] (the method number is in parentheses): pH (AS-02), bulk density (BD, AS-03), content of organic matter (OM, AS-07), inorganic nitrogen (Ninorg, AS-08), available phosphorus (Pav, AS-10, AS-11), cation exchange capacity (CEC, AS-12), DTPA-extractable Zn, Fe, Cu, Ni, Pb, Mn, and Cd (AS-14); exchangeable Ca, Mg, and K (AS-13), electric conductivity (EC, AS-18). The water-holding capacity (WHC) was measured gravimetrically placing 10 g of soil into a funnel containing a folded filter paper, then 50 mL of distilled water was added to saturate the soil, and the funnel was covered with an aluminum cap for 12 h to avoid evaporation.
Additionally, to determine if the change in BD y WHC is due only to the dilution effect by the biochar addition, theoretical bulk density and WHC were also evaluated applying Formulas (1) y (2), respectively.
ρ B T = 1 ( 1 ρ B S A S ) + ( 1 ρ B B c A B c )
W H C T = ( W H C s A s ) + ( W H C B c A B c )
where ρBT is the theoretical bulk density, WHCT is theoretical water holding capacity, subscript S stands for soil, subscript Bc stands for biochar, and A is the application rate by weight (99.8% for soil and 0.2% for biochar).

2.4. Greenhouse Experiment

To evaluate the changes produced by biochar and biofertilizer on cultivated soil, we carried out a greenhouse experiment with tomatillo, also known as husk tomato (Physalis ixocarpa), for two crop cycles. We also studied the nutrient use efficiency, comparing chemical fertilization at 100% (without biochar) against 50% and 20% with biochar on crop yield, plant height, fruit weight, and root length. Finally, we compared the combination of biochar and biofertilizer with the treatments mentioned earlier on the variables measured in the plant.
Physalis ixocarpa is a Solanaceae native from Mexico and Central America, which adapts to a variety of climates, and it is therefore produced throughout Mexico and from United States to Nicaragua. Its fruits are widely used in Mexican cuisine and the whole plant in traditional medicine [57]. In addition, it has recently been investigated due to its content of vitamins, minerals, and compounds with antibacterial, antioxidant, antitumor, and anti-inflammatory activity [58]. Since 1970 its demand has increased due to higher domestic consumption and exports to the United States, Canada, Japan, Costa Rica, the Netherlands, the United Kingdom, the United Arab Emirates, Spain, and Germany [59].
Seeds of Physalis ixocarpa (VitaTM, V 954) were germinated, and when seedlings reached 12 cm in height were transplanted in bags containing 3 kg of soil or soil with biochar (0.2% w/w). To study the effect of biochar and biofertilizer as soil conditioners, four treatments were tested: control treatment (CT: soil + 100% chemical fertilization), two treatments with biochar and chemical fertilization (BT20: soil + biochar + 20% chemical fertilization, and BT50: soil + biochar + 50% chemical fertilization), and one treatment with biofertilization (BBfT: soil + biochar + biofertilizer). The biofertilizer was diluted in each cycle to provide the same amount of N as 100% of chemical fertilization. Each treatment was tested in triplicate in random blocks with six plants each. Figure 1 shows the experimental design. The doses of fertilization were calculated according to Formula (3), considering the nutritional requirements of Physalis ixocarpa, for which 100% of chemical fertilization dose corresponds to 200–100–200–80.
F D = N R N S F E
where FD is the fertilization dose, NR is the kilograms of nutrients required by the crop, NS is the content of nutrients in the soil, and FE is the efficiency of absorption of the fertilizer by the crop in percentage.
For the chemical fertilization, the source of nitrogen was urea (46–00–00), that of phosphorus: phosphate rock (00–32–00), that of potassium and nitrogen: potassium nitrate (13.8–44–00), and for calcium and nitrogen: calcium nitrate (15–00–00–26). The fertilization doses of each treatment were divided into 14 portions that were applied weekly during the crop development, from August to November 2018 for the first crop cycle and from April to July 2019 for the second crop cycle.
Once the fruits filled the calyx that covered them, the harvest was carried out. The variables measured in the plant were height, root length, fruit weight, and yield per treatment. After harvest, the soil of each treatment was mixed, and three samples were taken to analyze and evaluate the effect of the treatments. For the second cycle, the soil was mixed again and packed into the bags. Seeds of tomatillo were germinated and transplanted as it was made for the first cycle.

2.5. Statistical Analysis

To determine if the biochar changed the initial soil characteristics significantly, a one-way ANOVA was applied. Subsequently, a post hoc Duncan test was performed in order to identify significant differences between treatments, initial soil, and soil + biochar in both crop cycles. The statistical analyses were made using SPSS software ver. 22.

3. Results and Discussion

3.1. Biochar and Biofetilizer Characteristics

Except for pH, usually alkaline, biochar characteristics vary broadly because they depend upon the origin of feedstock and the pyrolysis conditions. Bamboo biochar used in this study showed a moderately alkaline pH (8.2); different from that strongly alkaline (9.3) produced by Yang et al. [23] (9.3), and significantly different from that which was strongly acidic (5.2) of Suthar et al. [60], all of them produced from bamboo at 450 °C. According to several researchers, pyrolysis temperature is a determining factor for biochar pH: at a higher temperature, higher biochar pH [16,30,31,32,36,44]. Ghodake et al. [44] reported several studies where different feedstocks were pyrolyzed at 500 °C, and the pH of biochars varied from 8.82 to 10.5. According to the above, the differences in pH of Yang’s and ours biochar could be due to biochar’s time and storage conditions. In the case of Suthar et al. [60], it would be interesting to confirm if the great exposed surface of the fine particles of biochar they used (smaller than 0.45 mm) increased the oxidation to such an extent that the resulting pH was acid. Mostly vegetable materials produce biochars richer in C, and with lower contents of N, P, and other nutrients than animal origin materials. Table 1 shows that the biochar used in this study presented C and NT contents within the reported ranges for those of plant origin: 34–82% for C, 1700–17,000 mg·kg−1 for NT, but a higher Pav content than those reported (0.02–0.68 mg·kg−1) [28,44,61]. The previous data confirm that the value of biochar as a soil conditioner is based mainly on its porous structure, surface charge, and recalcitrant nature rather than on its ability to provide nutrients directly. In addition, the biochar showed a low BD (0.2 g·cm−3), which is beneficial to diminish soil compaction; low EC (1021 µS·m−1), which is adequate to preserve the non-saline current condition of the soil, and high values both for CEC (37 cmol+·kg−1) and WHC (61%) to improve the efficiency of fertilizer use, and to increase water availability for plants, respectively. Our biochar presented lower BD than Suthar et al. (0.29 g·cm−3), which we attributed to the particle size, since ours contained 66.5% of medium and large particles (1–9.5 mm) while Suthar’s only had fine particles (<0.45 mm). The CEC value coincides with those reported by Suthar (30 and 41 cmol+·kg−1) reported for biochars obtained at 300 °C and 450 °C, respectively. Finally, the low H:Corg molar ratio of biochar indicated high stability (Table 1). According to Man et al. [25], a low value of H:Corg ratio indicates high biochar aromaticity and, therefore, high stability of carbon in the biochar. The characteristics observed in the bamboo biochar used in this study, such as low bulk density and high porosity, surface area, and charge, are typical of biochars obtained at 400–600 °C, as Bagreev et al. [62] reported.
Our biofertilizer, prepared from O. ficus indica, presented a moderately acid pH (Table 2) as well as that obtained by Quintanar-Orozco et al. [48] from O. heliabravoana. Acidic pH helps to keep nutrients available in biofertilizers. The PT content was similar in both biofertilizers, ours and Quintanar- Orozco´s et al. [48], but ours had higher NT, K, and Mg concentrations, and lower Cu and Fe contents (Table 2). Due to the high water content of nopal, nopal-based biofertilizers’ nutrient content is lower than that of organic fertilizers prepared from animal wastes [63] or other plants by composting [64]. Besides nutrients, biofertilizer provides beneficial microorganisms that improve the use of nutrients. In this case, the biofertilizer presented 5 × 10⁴ CFU·mL−1 of N-fixing microorganisms, and a high mesophilic aerobes population (10.2 × 10⁷ CFU·mL−1), while no fecal coliforms, Salmonella, E. coli, or total coliforms were found, which indicates the biofertilizer is microbiologically safe for foliar or soil application.

3.2. Initial Direct Effects of Biochar on Soil Characteristics

Table 3 shows the characteristics of the soil and the soil added with biochar (soil + biochar) before crop development. Initially, the soil presented a pH that was slightly alkaline, with a sandy texture consistent with its bulk density, and with those characteristics present in arid and semi-arid soils [36,39,40]. Additionally, we found high Pav and exchangeable Ca, Mg, and K contents; very low content of OM, medium CEC, low concentrations of Ninorg, medium content of Mn, Zn, Fe, and Cu; and without problems of salinity or toxicity by metals in this soil. The abundance of Ca and Mg is common in calcareous soils [36,41]. The high content of P and K, and the medium value of CEC could be due to the sheep droppings addition that was added to this soil for 20 years. However, the low OM (2%) content confirms that organic amendments are quickly mineralized in sandy soils [38]. In light of the above, biochar, thanks to its stability, is a better option than organic manure to increase the organic carbon content in this soil.
Once biochar was added, some soil characteristics changed significantly (p < 0.05), as shown in Table 3 and Figure 2, Figure 3 and Figure 4. The bulk density diminished 21%, 1.16 times more than theoretically expected according to Formula (1), while WHC increased 6%, and pH decreased from slightly alkaline to neutral. The previous changes were beneficial for the soil quality, and the modified characteristics were similar to those required by the study crop, since Physalis ixocarpa growths better in sandy loam and well-drained soils, with pH among 5.5 and 7.3. The improvement of the physical characteristics of the soil is explained by the porous structure of the added biochar, which causes a mixing or dilution effect that diminishes BD [7,28,30,33,37] and retains water in its pores [65,66]. In this case, the large difference in density between soil (1.33 g·cm−3) and biochar (0.2 g·cm−3) increases the dilution effect. However, since the amount of biochar applied was only 0.2%, the observed changes are also due to aggregation ability. Notwithstanding, the increase in WHC (6%) was not statistically significant; it was 12.4% higher than the theoretically expected value (49%). Laghari et al. [37] obtained higher increases than us in WHC (11% and 14%) in two arid soils using a much larger application rate of biochar (22 Mg·ha−1) of biochar pyrolyzed at 700 °C. In contrast, Alotaibi et al. [36] achieved an initial increase in WHC of 10% with 8 Mg·ha−1 (equal to that applied in this study) of biochar pyrolyzed at 300 °C. The data from the previous studies demonstrate the importance of selecting the pyrolysis conditions to obtain good outcomes while making efficient use of resources.
Other positive changes in the soil fertility were significant increases (p < 0.05) in the content of OM from very low (2%) to low content (3%); CEC improved from medium (16 cmol+·kg−1) to high content (33 cmol+·kg−1); Ninorg showed the greatest increase (from 0.5 to 7 mg·kg−1), although the content is still very low. Likewise, Pav raised from 24 to 35 mg·kg−1, although the difference was not significant (p < 0.05). Regarding nutrients, with the biochar addition, K and Fe contents increased significantly (p < 0.05) while Ca, Cu, and Zn showed a small increment, and Mn decreased slightly. High CEC and functional groups of biochar explain other changes detected in the soil. For example, diminution in pH could be due to the oxidation of biochar surface, the process responsible for the formation of acidic organic functional groups, such as carboxylic and phenolic groups [67,68]. The mineral ash content in biochar depends on feedstock compositions as well as the pyrolysis temperature. While Ca, Fe, Mg, Mn, and Si are usually retained in biochar because their release requires high temperatures (>1000 °C), P and K start to vaporize at 700–800 °C and N at 200 °C [69]. Our results indicate that bamboo biochar provides mainly N, P, K, Fe, and modest quantities of Ca, Cu, and Zn, but not Mg or Mn.
It is important to remark that the aforementioned changes in soil quality were obtained by adding 8 Mg·ha−1 (0.2%) of biochar, a lower rate than ones commonly applied (10–100 Mg·ha−1 or ≥1%) [22,28,31,32]. We consider that the biochar used and the application rate applied were correct because the study soil did not require pH correction since its initial value was slightly alkaline. A higher biochar dose could have drastically altered pH because the study soil had low contents of components responsible for buffer capacity (OM and clay). To say that coarse-textured soils are more responsive to biochar addition is a general assertion that is not entirely true. Although tropical soils and arid and semi-arid soils have a coarse texture in common, they respond very differently to the addition of biochar because they have characteristics that clearly differentiate them, such as pH. It is also true that there may be particular cases within the soil groups, such as the study soil, which, despite being a semi-arid soil, does not present the buffering capacity that confers a high concentration of carbonates to this type of soil, so it responded to a small application rate of biochar.

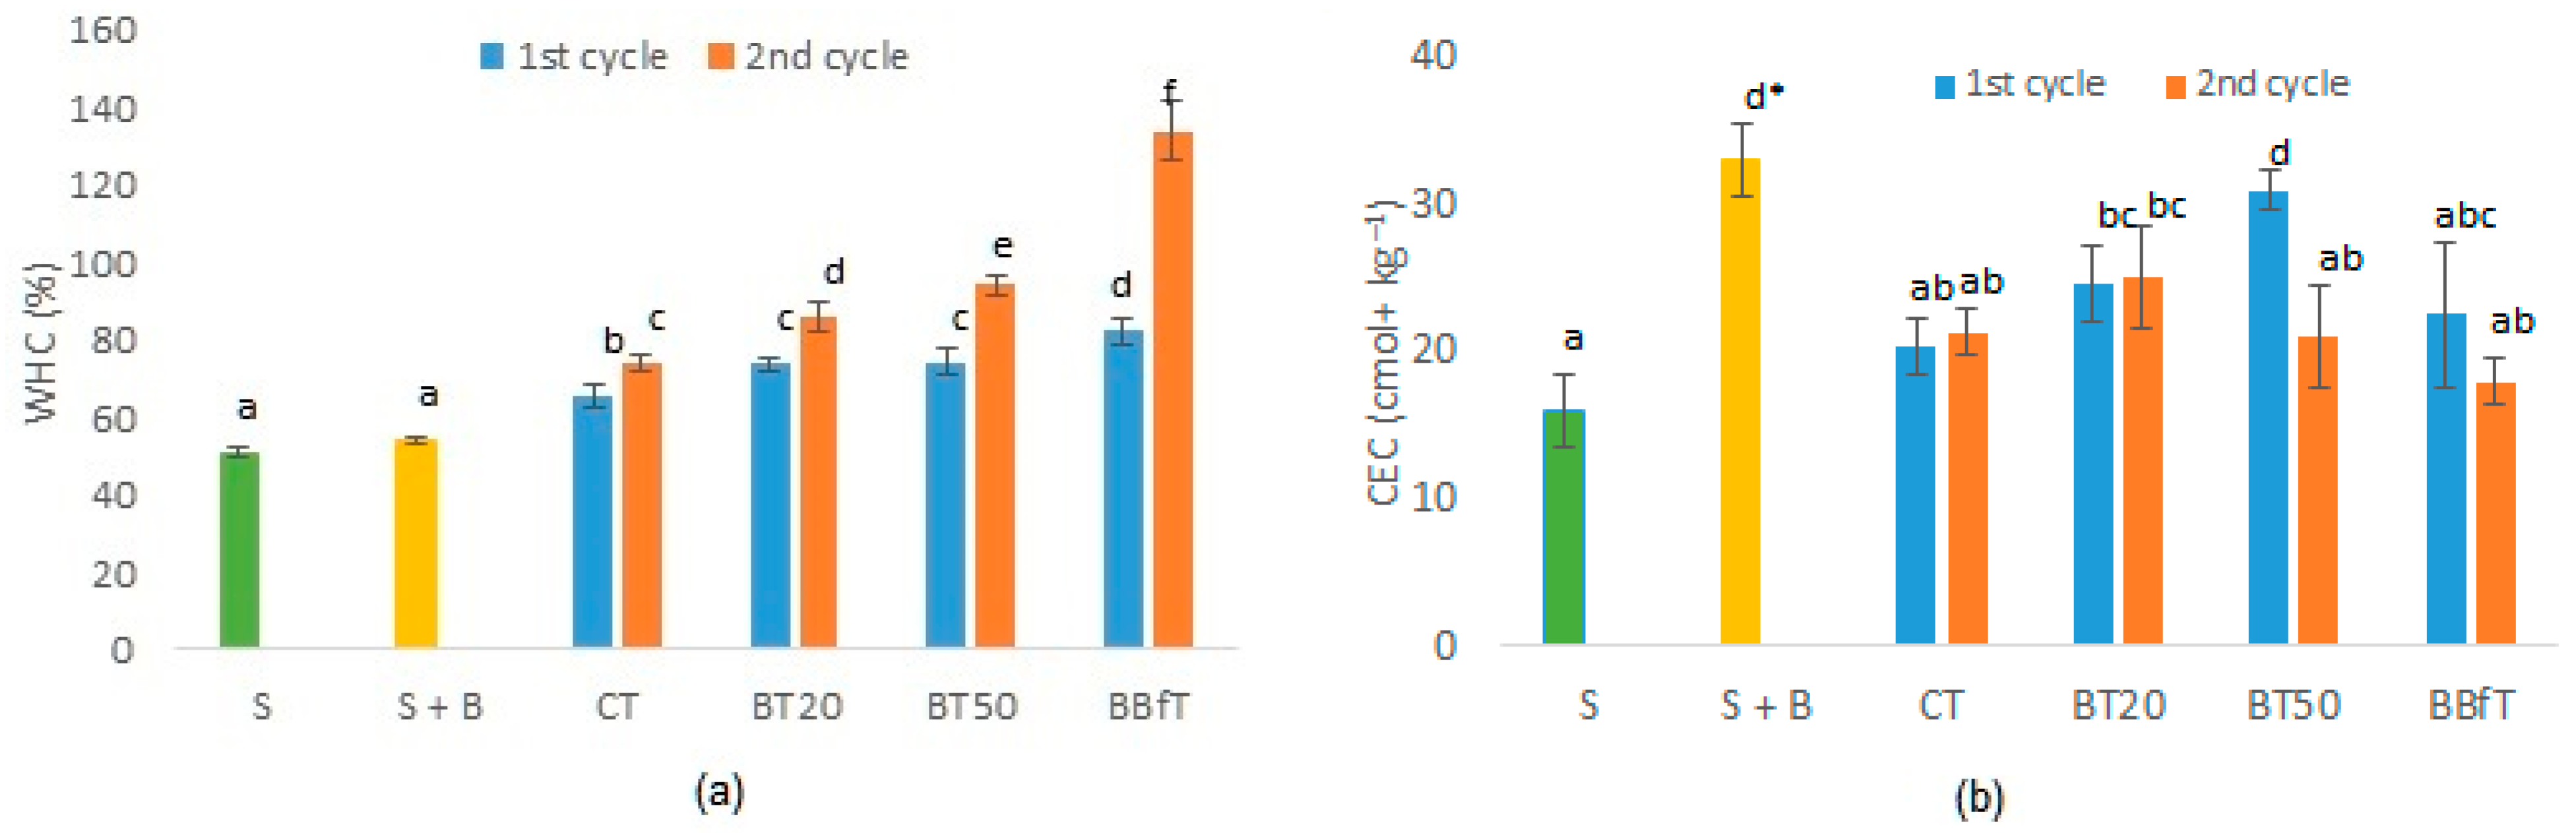
3.3. Short-Term Effects of Biochar and Biofertilizer on Soil Characteristics

After the first cultivation cycle, the soil pH presented important variations among treatments relative to the initial value (Table 3). The low buffer capacity showed by the studied soil was in accordance with its sandy nature and low contents of clay and organic matter. The pH decrease in CT and BT20 could be due to urea oxidation. On the other hand, the biochar saturation with alkaline ions (Ca and K) added by the biofertilizer could explain the pH increase in BBfT. However, at the end of the second cultivation cycle, pH shows a tendency to return to the initial value in all treatments. This could be due to the gradual increase in OM observed with all treatments. Soil pH modification by biochar is an area requiring further investigation since the majority of studies only report the initial change, or follow up for a very short time, or do not consider the effect that the development of a crop in that soil, the addition of fertilizers or other products to the soil will have. In some times, the effect is the opposite of the expected one. For example, Hailegnaw [6] studied 10 acidic and neutral soils to which they added alkaline biochar; in eight soils, pH increased as expected; however, in two acidic soils, pH decreased.
EC varied significantly between cultivation cycles, as shown in Table 3. In the first cycle, it increased with all treatments because of salts addition with fertilization (chemical and biological). In contrast, in the second cycle, a significant diminution was observed due to adjustment fertilization doses. It is important to mention that EC always remained less than 2000 µS·m−1.
In general, the physical characteristics of the soil improved with treatments. On the one hand, BD remained significantly lower than that of the initial soil. Even at the end of the second cycle, all treatments except CT showed lower values than soil + biochar, and of course, lower than calculated bulk density (Table 3). These results showed that in addition to the dilution effect, biochar was acting as a soil conditioner [65]. A frequently asked question is how long-lasting are the changes produced by biochar in the soil. Burrel et al. [30] found that BD of three soils added with different biochars, after 3 years, diminished relative to the initial soil mixed with biochar, except in the cambisol added with woodchip biochar, where BD increased slightly. However, in all cases, biochars avoided soil consolidation observed in control treatments. On the other hand, WHC increased significantly (p < 0.05) with all treatments in each cultivation cycle relative to the initial soil and soil + biochar as follows: BBfT > BT50 > BT20 > CT (Figure 2a).
In CT, the increase in WHC could be explained by the hydration of the added fertilizer salts. In the rest of the treatments, once biochar is combined with soil, it undergoes oxidation and tends to become more hydrophilic as a result of the formation of acidic functional groups on its surface, which explains the gradual WHC increases in each cycle (Figure 2a) [67,68]. Alotaibi et al. [36] observed this same behavior; the hydrophilicity of biochar increases as it ages. They also found that WHC of biochar pyrolyzed at 300 °C was significantly higher than those pyrolyzed at 500 °C and 600 °C. This is important information for future research with this kind of soil.
Regarding exchangeable bases, K increased with biochar and all treatments relative to initial concentration (Table 3). However, only with BBfT was the increment significant, between 24 and 41 times higher than the rest of the treatments. The Opuntia-based biofertilizer used is an important K source. In the case of Ca, it showed significant variations (p < 0.05) between treatments and between cycles; however, the final concentrations were significantly higher than the initial ones (Table 3). On the contrary, Mg tended to decrease significantly (p < 0.05) with all treatments in both cycles, except for BT50 (Table 3). Even with the decrease, the final Mg content is high, although it is necessary to add Mg to reestablish the ratios between Ca, Mg, and K in soil (Ca/Mg: 2–5, Ca/K: 5–25, Mg/K: 2.5–15, (Ca+Mg)/K: 10–40) and thus to avoid possible deficiencies in plants due to the antagonism between them. In this study, the increase in Ca and K caused a deficiency of Mg, which was accentuated with each crop cycle, and to a greater extent with BBfT. Sawdust and waste wood are two biochar feedstocks rich in Mg and locally available to supply this element. Micronutrients Cu, Fe, and Zn increased significantly (p < 0.05) with all treatments with respect to the initial content and soil + biochar (Table 3). Cu and Zn augmented with each crop cycle, whereas Fe decreased between 36–51% in the second cycle with respect to the first one, except BT50, which increased by 26%. These nutrients were provided mainly by biofertilizer (in BBfT), biochar, and in small concentrations by chemical fertilizers, where they are found in trace concentrations. On the contrary, Mn diminished 10–20% with all treatments in the first crop cycle and increased in the second one; however, Mn concentrations for CT, BT20, and BT50 were 5% lower than the initial one.
Pb, Cd, and Ni concentrations remained lower than the detection limit in all treatments (Table 3), which was beneficial in the case of Pb and Cd because of their toxicity for living organisms. The case of Ni is a bit more complex; on the one hand, although it is an essential element for higher plants [69], it is considered a toxic one because its functional role in humans has not been demonstrated, while in animals, it is not clear. On the other hand, the Ni toxic effects on human health are well documented [70]. The Ni content in the soil used in this study was too low (<0.0042 mg·kg−1), but it was not added because it is a common trace element in fertilizers and biofertilizers. Practically any biomass is useful to produce biochar whenever it does not contain toxic elements. In this case, residual bamboo biomass used complies with this requirement.
Biochar had a positive effect on soil CEC; initially it changed from 16 to 33 cmol+·kg−1, and although later this parameter diminished significantly with all treatments with respect to the soil + biochar, after the second cycle, it remained 33, 56, 31, and 12.5% higher for CT, BT20, BT50, and BBfT, respectively, relative to the initial value (Figure 2b). According to Hailegnaw [6], when biochar had higher exchangeable Ca2+ than the soil, CEC increases, as was the case in this study, where biochar increased exchangeable Ca2+ and CEC in soil (Table 3, Figure 2b). Alotaibi et al. [36] confirmed the aforementioned; they found minimal increases in CEC adding 8 Mg·ha−1 of biochars produced at different temperatures to a soil rich in CaCO3. However, contrary to expectations, BBfT, the treatment with the highest pH and OM values showed the lowest increase in CEC.
Despite its recalcitrant nature, biochar contributes organic C, P, and N to soil [7,22]. Figure 3a shows that biochar treatments significantly increased (p < 0.05) soil OM from the first crop cycle compared to CT. After the second cycle, OM was significantly higher in BBfT than in the rest of the treatments due to the OM addition from the biofertilizer. Application of biochar and biofertilizer to the soil raised the OM content to a medium level (4.1–6.0%), while in CT, its OM content continued to be low (>4). Ninorg presented significant variations between cycles and treatments (Figure 3b), which is explained by the multiple transformations that N undergoes in soil. However, with the initial addition of biochar and all treatments, Ninorg increased significantly relative to the initial content, although in CT and BBfT, it continued to be at a very low level (<10 mg·kg−1) while in BT20 and BT50 it reached medium values (10–20 mg·kg−1). The Ninorg increases observed in CT, BT20, and BT50 can be due to higher adsorption of inorganic forms of N (NH4+ and NO2), as opposed to BBfT, where the increase in pH could favor ammonia emission.
Figure 4 shows two important situations; on the one hand, comparing the treatments that received 100% phosphorus fertilization, we observed that the soil with biochar and biofertilizer (BBfT) retained between 40–87% more Pav than the chemically fertilized soil without biochar (CT). On the other, we found that by adding biochar, it is possible to reduce phosphorus fertilizer by 50–80% if we consider BT20 and BT50, with 80% and 50% less phosphorus fertilization, respectively; they retained 22–76% and 35–87%, respectively, more Pav than CT. Although CT was the only treatment in which Pav significantly (p < 0.05) increased in the second cycle relative to the first one; its concentration was much lower than that of the biochar treatments. Sarfraz et al. [22] found that fine particles (≤0.5 mm) of biochar significantly increased Pav in soils, but when 1% of mixed size particles of biochar were added to the same soils, only in one of them, Pav increased. In our study, a mixture of particles containing 33.5% of fines (<0.6 mm) from biochar significantly increased Pav in soil. P retention in the soil is of utmost importance since approximately 85% of P added by chemical fertilization is lost, and reserves of this element are limited [14]. Additionally, biochar could be a P source because if pyrolysis temperature is not higher than 700°C, P from feedstock is retained in biochar [44]. Therefore, the recycling of nutrients through biochar and biofertilizers are helpful strategies to support agricultural sustainability and the circular economy.

3.4. Effect of Biochar and Biofertilizer on the Crop Physalis Ixocarpa

At the beginning of the fruiting stage of the first crop cycle, the greenhouse was flooded due to heavy rains, which caused the plants to be infected by mildew, a fungal foliar pathogen. For this reason, the fruit weight, yield, and height of plants were lower in the first crop cycle than in the second one (Figure 5a,b). CT was the treatment most affected by the infection, which was evident in the weight of fruits and yield, which were lower than those obtained in treatments with biochar (Figure 5a,b). Elad et al. [71] found that biochar induced resistance against two foliar fungal pathogens: grey mold (Botrytis cinerea) and powdery mildew (Leveillula taurica) on plants of pepper and tomato, and a foliar mite pest (Polyphagotarsonemus latus) on pepper plants. They applied 1, 3, and 5% of biochar to sandy soil. According to these authors, biochar induced a defensive systemic response since the suppressive effect against pathogens and pests occurred in the aerial part of the plant while biochar was in the soil. Zwart and Kim [72] observed that 5% of biochar added to growth media reduced the progression and physiological stress caused by Phytophthora canker in seedlings of Quercus rubra and Acer rubrum. Rasool et al. [73] proved that in tomatoes affected by Alternaria solani, the response protection elicited was dependant on the type of biochar, and it involves both induced systemic resistance and acquired systemic resistance mechanisms. In our study, the addition of 0.2% of biochar may have induced a similar systemic response in Physalis ixocarpa since the plants were less affected by mildew infection in the biochar treatments.
The weight of fruits in the second cycle varied from 8.6 to 10.2 g, where CT = BT20 < Bt50 < BBfT. The yields obtained in CT (378 g·plant−1) and BBfT (328 g·plant−1) were lower than that of BT50 (623 g·plant−1) and significantly lower than that of BT20 (730 g·plant−1). A possible explanation for this is that the higher addition of Ca and K in CT and BBfT caused a more pronounced Mg deficiency that largely affected yield in these treatments. Cakmak and Yazici [74] have extensively documented yield impairment due to Mg deficiency. As well, Verbruggen and Hermans [75] commented that on alkaline soils, MgCO3 formation and imbalanced concentration of Ca, K, and Na reduce Mg availability, affecting productivity and quality in agriculture. These results pointed out that the importance of maintaining adequate nutrient ratios, not just sufficient concentrations, and that by adding 0.2% of bamboo biochar, it was possible to save between 50 and 80% of fertilizer.
In both crop cycles, fruit harvesting began in week 8 in all treatments, except in BBfT, which started in week 7, due to the fact that that the phenological stages were advanced approximately 6 days with respect to the plants of the other treatments. In addition, there was also an increase of approximately 15% in flowering in BBfT. These previous effects observed with BBfT could be due to the auxin and gibberellins content of the biofertilizer (Table 2) because these phytohormones stimulate flowering and growing [54].
Cakmak et al. [76] found that root growth inhibition is an early symptom of Mg deficiency; if there is not enough Mg, carbohydrates are not efficiently transported from leaves to root, affecting root development. Mg deficiency could explain the significant diminution in root length in the second cycle, without apparent impairment of aerial growth of plants (Figure 6a,b).
In real practice, the cationic balance of the soil should be corrected by adding Mg and other nutrients such as Mn before the next crop cycle. Additionally, it would be advisable to combine biofertilizer with urea to reduce the amount of biofertilizer added and compensate for its alkalinizing effect. The suitability of an extra addition of biochar should be evaluated annually.
Although the biochar used produced good results, improving some soil characteristics, it would be interesting to try pyrolyzed bamboo biochar at 300 °C to increase the WHC and CEC of the soil and observe its effect on the pH. There are also other locally available residual biomasses that would produce biochars with higher nutrient content and higher CEC, such as cow manure, sawdust, and wood waste. A combination of bamboo, cow manure, and sawdust could also be formulated as feedstock to obtain biochar with characteristics suitable to the needs of the study soil.
Both the Opuntia cladodes for the biofertilizer as biomass proposed for biochar are currently used very little in Hidalgo, so obtaining biofertilizer and biochar would not compete with other uses. On the contrary, some environmental and health issues caused by these wastes would be solved by obtaining bioproducts for soil improvement.

4. Conclusions

This study generated information that did not exist about the effect that biochar can have on alkaline soils with low buffering capacity. We found that the addition of 0.2% of bamboo biochar was effective in improving some physical and chemical soil characteristics, such as reducing bulk density and increasing WHC and CEC as well as OM, Pav, Fe, and Cu contents in the soil. Additionally, biochar induced resistance against a foliar fungal pathogen. Likewise, the combination of bamboo biochar and the nopal-based biofertilizer improved WHC, Pav, and OM significantly comparing to the soil with only biochar added. However, we also observed that biochar and biofertilizer could accentuate nutritional imbalances in the soil. To avoid the above situation and ensure that there is enough quantity of each nutrient, it is necessary to supervise the ratios between them. According to the results, the bamboo biochar and nopal-based fertilizer are suitable improvers for the studied soil.

5. Patents

Patent in process: MX/a/2019/014243 Proceso para la producción de biofertilizante a partir de clododios de Opuntia spp.

Author Contributions

Conceptualization, A.S.C.-M. and R.I.B.-H.; Methodology, A.S.C.-M. and E.O.-R.; Data curation: A.S.C.-M. and E.O.-R.; Validation, R.I.B.-H. and C.A.L.-C.; Formal analysis, A.S.C.-M. and C.A.L.-C.; Investigation, A.S.C.-M. and E.O.-R.; Resources, R.I.B.-H., C.A.L.-C., O.A.-C. and C.C.-O.; Writing—original draft preparation, R.I.B.-H.; Writing—review and editing, C.A.L.-C., O.A.-C., G.A.V.-R. and C.C.-O.; Visualization, A.S.C.-M. and R.I.B.-H.; Supervision, R.I.B.-H. and C.A.L.-C.; Project administration, R.I.B.-H. All authors have read and agreed to the published version of the manuscript.

Funding

This research was partially funded by Bioceres, S.A.P.I. de C.V.

Institutional Review Board Statement

Not applicable.

Informed Consent Statement

Not applicable.

Data Availability Statement

No new data were created or analyzed in this study. Data sharing is not applicable to this article.

Acknowledgments

We are grateful to CONACYT for granting the PhD academic scholarship (858219) to Addi Santiago Cruz Méndez and (823919) to Esaú Ortega Ramírez.

Conflicts of Interest

The authors declare no conflict of interest.

References

  1. Eswaran, H.R.; Lal, R.; Reich, P.F. Land degradation: An overview. In Responses to Land Degradation; Oxford Press: New Delhi, India, 2001. [Google Scholar]
  2. Barakat, H.N. Arid lands: Challeges and hopes. In Earth System: History and Natural Varibility; Cilek, V., Ed.; EOLSS Publications: Singapore, 2009; p. 356. [Google Scholar]
  3. Mirzabaev, A.; Wu, J.; Evans, J.; García-Oliva, F.; Hussein, I.A.G.; Iqbal, M.H.; Kimutai, J.; Knowles, T.; Meza, F.; Nedjraoui, D.; et al. Desertification. In Climate Change and Land: An IPCC Special Report on Climate Change, Desertification, Land Degradation, Sustainable Land Management, Food Security, and Greenhouse Gas Fluxes in Terrestrial Ecosystems; Shukla, J.S.P.R., Buendia, E.C., Masson-Delmotte, V., Pörtner, H.-O., Roberts, D.C., Zhai, P., Slade, R., Connors, S., van Diemen, R., Ferrat, M., et al., Eds.; IPCC: Geneva, Switzerland, 2019; in press. [Google Scholar]
  4. World Atlas Desertification. Aridity Projections—Drier Types. Limits to Sustainability. 2019. Available online: https://wad.jrc.ec.europa.eu/aridityprojections (accessed on 30 April 2021).
  5. Merfield, C.N.; Johnson, M. Understantding Biostimulants, Biofertilisers and On-Farm Trials; The BHU Future Farming Centre: Lincoln, New Zealand, 2016; pp. 1–13. [Google Scholar]
  6. Hailegnaw, N.S.; Mercl, F.; Pračke, K.; Száková, J.; Tlustoš, L. Mutual relationships of biochar and soil pH, CEC, and exchangeable base cations in a model laboratory experiment. J. Soils Sediments 2019, 19, 2405–2416. [Google Scholar] [CrossRef]
  7. Krishnakumar, S.; Rajalakshmi, A.G.; Balaganesh, B.; Manikandan, P.; Vinoth, C.; Rajendran, V. Impact of biochar on soil health. Int. J. Adv. Res. 2014, 2, 933–950. [Google Scholar]
  8. Berg, G. Plant-microbe interactions promoting plant growth and health: Perspectives for controlled use of microorganisms in agriculture. Appl. Microbiol. Biotechnol. 2009, 84, 11–18. [Google Scholar] [CrossRef]
  9. Bowen, G.D.; Rovira, A.D. The rizhosphere and its management to improve plant growth. Adv. Agron. 1999, 66, 1–102. [Google Scholar]
  10. Bashan, Y. El uso de inoculantes microbianos como una importante contribución al futuro de la agricultura mexicana. In La Biofertilización como Tecnología Sostenible; Díaz-Franco, A., Mayek-Perez, N., Eds.; Plaza y Valdéz: Mexico City, Mexico, 2008; pp. 17–24. [Google Scholar]
  11. Abdul, G.K. Mycorrhizoremediation—An enhanced form of phytoremediation. J. Zhejiang Univ. 2006, 7, 503–514. [Google Scholar]
  12. Olalde, P.V.; Serratos, R. Biofertilizantes: Micorrizas y bacterias promotoras de crecimiento. In La Biofertilización como Tecnología Sostenible; Díaz-Franco, A., Mayek-Perez, N., Eds.; Plaza y Valdés/CONACYT: Mexico City, Mexico, 2008. [Google Scholar]
  13. Martínez, M.M. Microbial bioproducts for agriculture. Acta Hortic. 2015, 1076, 71–76. [Google Scholar] [CrossRef]
  14. Aguado-Santacruz, G.A. (Ed.) Introducción al Uso y Manejo de los Biofertilizantes en la Agricultura; INIFAP/SAGARPA: Celaya, Mexico, 2012; p. 316. [Google Scholar]
  15. Caradonia, F.; Battaglia, V.; Righi, L.; Pascali, G.; La Torre, A. Plant biostimulant regulatory framework: Prospects in Europe and current situation at international level. J. Plant Growth Regul. 2018, 38, 438–448. [Google Scholar] [CrossRef]
  16. Kavitha, B.; Reddy, P.V.L.; Kim, B.; Lee, S.S.; Pandey, S.K.; Kim, K.-H. Benefits and limitations of biochar amendment in agricultural soils: A review. J. Environ. Manag. 2018, 227, 146–154. [Google Scholar] [CrossRef] [PubMed]
  17. Tripathi, M.; Sahu, J.N.; Ganesan, P. Effect of process parameters on production of biochar from biomass waste through pyrolysis: A review. Renew. Sustain. Energy Rev. 2016, 55, 467–481. [Google Scholar] [CrossRef]
  18. Peters, J.F.; Iribarren, D.; Dufour, J. Biomass pyrolysis for biochar or energy applications? A life cycle assessment. Environ. Sci. Technol. 2015, 49, 5195–5202. [Google Scholar] [CrossRef]
  19. Li, X.; Li, K.; Geng, C.; El Mashad, H.; Li, H.; Yin, W. Biochar from microwave pyrolysis of Artemisia slengensis: Characterization and methylene blue adsorption capacity. Appl. Sci. 2019, 9, 1813. [Google Scholar] [CrossRef] [Green Version]
  20. Cha, J.S.; Park, S.H.; Jung, S.-C.; Ryu, C.; Jeon, J.-K.; Shin, M.-C.; Park, Y.-K. Production and utilization of biochar: A review. J. Ind. Eng. Chem. 2016, 40, 1–15. [Google Scholar] [CrossRef]
  21. Lehmann, J.; Rillig, M.C.; Thies, J.; Masiello, C.A.; Hockaday, W.C.; Crowley, D. Biochar effects on soil biota—A review. Soil Biol. Biochem. 2011, 43, 1812–1836. [Google Scholar] [CrossRef]
  22. Sarfraz, R.; Yang, W.; Wang, S.; Zhou, B.; Xing, S. Short term effects of biochar with different particle sizes on phosphorous availability and microbial communities. Chemosphere 2020, 256. [Google Scholar] [CrossRef]
  23. Yang, F.; Zhou, Y.; Liw, W.; Tang, W.; Meng, J.; Chen, W.; Li, X. Strain-specific effects of biochar and its water-soluble compounds on bacterial growth. Appl. Sci. 2019, 9. [Google Scholar] [CrossRef] [Green Version]
  24. Ahmad, M.; Rajapaksha, A.U.; Lim, J.E.; Zhang, M.; Bolan, N.; Mohan, D.; Vithanage, M.; Lee, S.S.; Yong, S. Biochar as a sorbent for contaminant management in soil and water: A review. Chemosphere 2014, 99, 19–33. [Google Scholar] [CrossRef]
  25. Man, Y.; Wang, B.; Wang, J.; Slaný, M.; Yan, H.; Li, P.; El-Naggar, A.; Shaheen, S.M.; Rinklebe, J.; Feng, X. Use of biochar to reduce mercury accumulation in Oryza sativa L.: A trial for sustainable management of historically polluted farmlands. Environ. Int. 2021, 153, 106527. [Google Scholar] [CrossRef] [PubMed]
  26. Zhao, J.; Ren, T.; Zhang, Q.; Du, Z.; Wang, Y. Effects of biochar amendment on soil thermal properties in the North China Plain. Soil Sci. Soc. Am. J. 2016, 80, 1157–1166. [Google Scholar] [CrossRef]
  27. Zhu, Q.; Peng, X.; Huang, T. Contrasted effects of biochar on maize growth and N use efficiency depending on soil conditions. Int. Agrophys. 2015, 29, 257–266. [Google Scholar] [CrossRef]
  28. El-Naggar, A.; Lee, S.S.; Rinklebe, J.; Farooq, M.; Song, H.; Samarh, A.K.; Zimmerman, A.R.; Ahmad, M.; Shaheen, S.M.; Ok, Y.S. Biochar application to low fertility soils: A review of current status, and future prospects. Geoderma 2019, 337, 536–554. [Google Scholar] [CrossRef]
  29. Jeffery, S.; Meinders, M.B.; Stoof, C.R.; Bezemer, T.M.; van de Voorde, T.F.; Mommer, L.; Groenigen, J.W. Biochar application does not improve the soil hydrological function of a sandy soil. Geoderma 2015, 251, 47–54. [Google Scholar] [CrossRef]
  30. Burrel, L.D.; Zehetner, F.; Rampazzo, N.; Wimmer, B.; Soja, G. Long-term effects of biochar on soil physical properties. Geoderma 2016, 282, 96–102. [Google Scholar] [CrossRef]
  31. Jeffery, S.; Abalos, D.; Prodana, M.; Bastos, A.C.; van Groenigen, J.W.; Hungate, B.A.; Verheijen, F. Biochar boosts tropical but not temperate crop yields. Environ. Res. Lett. 2017, 12, 05300. [Google Scholar] [CrossRef]
  32. Jeffery, S.; Verheijen, F.G.A.; van der Velde, M.; Bastos, A.C. A quantitative review of the effects of biochar application to soils on crop productivity using meta-analysis. Agric. Ecosyst. Environ. 2011, 144, 175–187. [Google Scholar] [CrossRef]
  33. Hardie, M.; Clothier, B.; Bound, S.; Oliver, G.; Close, D. Does biochar influence soil physical properties and soil water availability? Plant Soil 2014, 376, 347–361. [Google Scholar] [CrossRef]
  34. Hussain, M.; Farooq, M.; Nawaz, A.; Al-Sadi, A.M.; Solaiman, Z.M.; Alghamdi, S.S.; Ammara, U.; Ok, Y.S.; Siddique, K.H.M. Biochar for crop production: Potential benefits and risks. J. Soil Sediments 2017, 17, 685–716. [Google Scholar] [CrossRef]
  35. Laird, D.; Fleming, P.; Wang, B.; Horton, R.; Karlen, D. Biochar impact on nutrient leaching from a Midwestern agricultural soil. Geoderma 2010, 158, 436–442. [Google Scholar] [CrossRef] [Green Version]
  36. Alotaibi, K.D.; Schoenau, J.J. Addition of biochar to a sandy desert soil: Effect on crop growth, water retention and selected properties. Agronomy 2019, 9, 327. [Google Scholar] [CrossRef] [Green Version]
  37. Laghari, M.; Mirjat, M.S.; Zhiquan Hu, Z.; Fazal, S.; Xiao, B.; Hu, M.; Chen, Z.; Guo, D. Effects of biochar application rate on sandy desert soil properties and sorghum growth. Catena 2015, 135, 313–320. [Google Scholar] [CrossRef]
  38. Baiamonte, G.; Crescimanno, G.; Parrino, F.; De Pasquale, C. Effect of biochar on the physical and structural properties of a desert sandy soil. Catena 2019, 175, 294–303. [Google Scholar] [CrossRef]
  39. Khalifa, N.; Yousef, L.F. A short report on changes of quality indicators for a sandy textured soil after treatment with biochar produced from fronds of date palm. Energy Procedia 2015, 74, 960–965. [Google Scholar] [CrossRef] [Green Version]
  40. Ippolito, J.A.; Novak, J.M.; Busscher, W.J.; Ahmedna, M.; Rehrah, D.; Watts, D.W. Switchgrass Biochar Aff ects Two Aridisols. J. Environ. Qual. 2012, 41, 1123–1130. [Google Scholar] [CrossRef] [PubMed]
  41. Ducey, T.F.; Ippolito, J.A.; Cantrell, K.B.; Novak, J.M.; Lentz, R.D. Addition of activated switchgrass biochar to an aridic subsoil increases microbial nitrogen cycling gene abundances. Appl. Soil. Ecol. 2013, 65, 65–72. [Google Scholar] [CrossRef]
  42. INEGI. Hidalgo, Información by State. 2019. Available online: http://cuentame.inegi.org.mx/monografias/informacion/hgo/default.aspx?tema=me&e=13 (accessed on 15 March 2021).
  43. Martínez-Ortiz, J.A.; Lucho-Constantino, C.A.; Montiel-Palma, S.; Coronel-Olivares, C.; López-Pérez, P.A.; Beltrán-Hernández, R.I. Assessment of the Acid-Neutralizing Capacity of Agricultural Soils Affected by Acid Deposition in Hidalgo State, manuscript in preparation.
  44. Ghodake, G.S.; Shinde, S.K.; Kadam, A.S.; Saratale, R.G.; Saratale, G.D.; Kumar, M.; Palem, R.R.; AL-Shwaiman, H.A.; Elgorban, A.M.; Syed, A.; et al. Review on biomass feedstocks, pyrolysis mechanism and physicochemical properties of biochar: State-of-the-art framework to speed up vision of circular bioeconomy. J. Clean. Prod. 2021, 297. [Google Scholar] [CrossRef]
  45. Yiping, L.; Yanxia, L.; Buckingham, K.; Henley, G.; Guomo, Z. Bamboo and Climate Change Mitigation; International Network for Bamboo and Rattan (INBAR): Beijing, China, 2010; p. 126645. [Google Scholar]
  46. IBI. Standardized Product Definition and Product Testing Guidelines for Biochar that Is Used in Soil; International Biochar Initiative: Washington, DC, USA, 2015. [Google Scholar]
  47. SEMARNAT. NOM-021-SEMARNAT-2000 Fertility, Salinity and Soil Classification Specifications, Study, Sampling and Analysis; Diario Oficial de la Federación: Mexico City, Mexico, 2002. [Google Scholar]
  48. Quintanar-Orozco, E.T.; Vázquez-Rodríguez, G.A.; Beltrán-Hernández, R.I.; Lucho-Constantino, C.A.; Coronel-Olivares, C.; González-Montiel, S.; Islas-Valdez, S. Enhancement of the biogas and biofertilizer production from Opuntia heliabravoana Scheinvar. Environ. Sci. Poll. 2018, 25, 28403–28412. [Google Scholar] [CrossRef]
  49. SIAP. Agricultural Production Statistics. 2020. Available online: http://infosiap.siap.gob.mx/gobmx/datosAbiertos_a.php (accessed on 6 June 2021).
  50. Boraste, A.; Vamsi, K.; Jhadav, A.; Khairnar, Y.; Gupta, N.; Trivedi, S.; Patil, P.; Gupta, G.; Gupta, M.; Mujapara, A.K.; et al. Biofertilizers: A novel tool for agriculture. Int. J. Microbiol. Res. 2009, 1, 23–31. [Google Scholar] [CrossRef]
  51. APHA AWWA WEF. Standard Methods for the Examination of Water and Wastewater; APHA AWWA WEF: Washington, DC, USA, 2012. [Google Scholar]
  52. EPA. Chapter Three-Metallic analytes. Method 3051 microwave-assisted acid digestion of sediments, sludges, soils and oils. In Test Methods for Evaluating Solid Waste Physical/Chemical Method, CD-ROM Revision 3; US Environmental Protection Agency: Washington, DC, USA, 1995. [Google Scholar]
  53. Glickmann, E.; Dessaux, Y. A critical examination of the specificity of the salkowsky reagent for indolic compounds produced by phytopathogenic. Appl. Environ. Microbiol. 1995, 61, 793–796. [Google Scholar] [CrossRef] [Green Version]
  54. Graham, H.D.; Henderson, J.H.M. Reaction of gibberellic acid and iberellins with Folin-Wu phosphomolybdic acid reagent and its use or quantitative assay. Plant Physiol. 1961, 36, 405–408. [Google Scholar] [CrossRef] [Green Version]
  55. INEGI. Municipal Geographic Information Directory of the United Mexican States. Zempoala, Hidalgo; INEGI: Mexico City, Mexico, 2009.
  56. Pellicone, G.; Caloiero, T.; Guagliardi, I. The De Martonne aridity index in Calabria (Southern Italy). J. Maps 2019, 15, 788–796. [Google Scholar] [CrossRef]
  57. García-Osuna, H.T.; Escobedo, B.L.; Robledo-Torres, V.; Benavides, M.A.; Ramírez, G.F. Germination and micropropagation of tetraploid husk tomato (Physalis ixocarpa). Rev. Mex. Cienc. Agric. 2015, 12, 2301–2311. [Google Scholar] [CrossRef] [Green Version]
  58. Shenstone, E.; Lippman, Z.; Van Eck, J. A review of nutritional properties and health benefits of Physalis species. Plant Foods Hum. Nutr. 2020, 75, 316–325. [Google Scholar] [CrossRef] [PubMed]
  59. CEDRSSA. Tomate Production and Trade in Mexico; Government of Mexico: Mexico City, Mexico, 2018; p. 13.
  60. Suthar, R.G.; Wang, C.; Nunes, M.C.N.; Chen, J.; Sargent, S.A.; Buckiln, R.A.; Gao, B. Bamboo biochar pyrolyzed at low temperature improves tomato plant growth and fruit quality. Agriculture 2018, 8, 153. [Google Scholar] [CrossRef] [Green Version]
  61. Wang, Y.; Yin, R.; Liu, R. Characterization of biochar from fast pyrolysis and its effect on chemical properties of the tea garden soil. J. Anal. Appl. Pyrolysis 2014, 110, 375–381. [Google Scholar] [CrossRef]
  62. Bagreev, A.; Bandosz, T.J.; Locke, D.C. Pore structure and surface chemistry of adsorbents obtained by pyrolysis of sewage-derived fertiliser. Carbon 2001, 39, 1971–1979. [Google Scholar] [CrossRef]
  63. Islas-Valdez, S.; Lucho-Constantino, C.A.; Beltrán-Hernández, R.I.; Gómez-Mercado, R.; Vázquez-Rodríguez, G.A.; Herrera, J.M.; Jiménez-González, A. Effectiveness of rabbit manure biofertilizer in barely crop yield. Environ. Sci. Poll. Res. 2017, 24, 25731–25740. [Google Scholar] [CrossRef]
  64. Bernal, M.; Alburquerque, J.A.; Bustamante, M.A.; Albiach, R.; Bonnati, A.; Moral, R. Uso Agrícola de Materiales Digeridos: Situación Actual y Perspectivas de Futuro III; Mundi Prensa: Madrid, Spain, 2014. [Google Scholar]
  65. Basso, A.S.; Miguez, F.E.; Laird, D.A.; Horton, R.; Westgate, M. Assessing potential of biochar for increasing water-hold ing capacity od sandy soils. Glob. Chang. Biol. Bioenergy 2013, 5, 132–143. [Google Scholar] [CrossRef] [Green Version]
  66. Moiwo, J.P.; Wahab, A.; Kangoma, E.; Blango, M.M.; Ngegba, M.P.; Suluku, R. Effect of biochar application depth on crop productivity under tropical rainfed conditions. Appl. Sci. 2019, 9, 2602. [Google Scholar] [CrossRef] [Green Version]
  67. Cheng, C.H.; Lehmann, J.; Thies, J.E.; Burton, S.D.; Engelhard, M.H. Oxidation of black carbon by biotic and abiotic processes. Org. Geoch. 2006, 37, 1477–1488. [Google Scholar] [CrossRef]
  68. Lehmann, J.; Joseph, S. (Eds.) Biochar for Environmental Management. Science, Technology and Implementation, 2nd ed.; Earthscan: London, UK, 2015; p. 438. [Google Scholar]
  69. Eskew, D.L.; Welch, R.M.; Cary, E.E. Nickel in higher plants: Further evidence for an essential role. Plant Physiol. 1984, 76, 691–693. [Google Scholar] [CrossRef] [Green Version]
  70. Iyaka, Y.A. Nickel in soils: A review of its distribution and impacts. Sci. Res. Essays 2011, 6, 6774–6777. [Google Scholar] [CrossRef]
  71. Elad, Y.; Rav, D.D.; Meller, H.Y.; Borenshtein, M.; Ben, K.H.; Silber, A.; Graber, E.R. Induction of systemic resistance in plants by biochar, a soil-applied carbon sequestering agent. Phytopathology 2010, 100, 913–921. [Google Scholar] [CrossRef] [PubMed] [Green Version]
  72. Zwart, D.C.; Kim, S.-H. Biochar amendment increases resistance to stem lesions caused by Phytophthora spp. in tree seedlings. Hort. Sci. 2012, 47, 1736–1740. [Google Scholar] [CrossRef] [Green Version]
  73. Rasool, M.; Akhter, A.; Saleem, M. Molecular and biochemical insight into biochar and Bacillus subtilis induced defense in tomatoes against Alternaria solani. Sci. Hort. 2021, 285, 110203. [Google Scholar] [CrossRef]
  74. Cakmak, I.H.; Yazici, A.M. Magnesium: A forgotten element in crop production. Better Crop. 2010, 94, 22–35. [Google Scholar]
  75. Verbruggen, N.; Hermans, C. Physiological and molecular responses to magnesium nutritional imbalance in plants. Plant Soil 2013, 368, 87–99. [Google Scholar] [CrossRef]
  76. Cakmak, I.; Hengeler, C.; Marschner, H. Partitioning of shoot and root dry matter and carbohydrates in bean plants suffering from phosphorus, potassium and magnesium deficiency. J. Exp. Bot. 1994, 45, 1245–1250. [Google Scholar] [CrossRef]
Figure 1. Experimental design for the greenhouse study. BT20 and BT50: soil + biochar + 20% or 50% of chemical fertilization, BBfT: soil + biochar + biofertilization, CT: soil + 100% chemical fertilization.
Applsci 11 06502 g001
Figure 2. (a) Water-holding capacity (WHC) and (b) cation exchange capacity (CEC) of studied soil (S), with biochar (S + B), and with different treatments, CT: soil + 100% chemical fertilization, BT20 and BT50: soil + biochar + 20, or 50% of chemical fertilization, respectively, and BBfT: soil + biochar + biofertilization. Different letters and * indicate significant difference (p < 0.05, Duncan test and one-way ANOVA, respectively).
Applsci 11 06502 g002
Figure 3. (a) Organic matter (OM) and (b) inorganic nitrogen (Ninorg) of the studied soil (S), with biochar (S + B), and with different treatments: CT: soil + 100% chemical fertilization, BT20 and BT50: soil + biochar +, 20, or 50% of chemical fertilization, respectively, and BBfT: soil + biochar + biofertilization. Different letters and * indicate significant difference (p < 0.05, Duncan test and one-way ANOVA, respectively).
Applsci 11 06502 g003
Figure 4. Available phosphorus (Pav) in studied soil (S), with biochar (S + B), and with different treatments: CT: soil + 100% of chemical fertilization, BT20 and BT50: soil + biochar +, 20, or 50% of chemical fertilization, respectively, and BBfT: soil + biochar + biofertilization. Different letters indicate significant difference (p < 0.05, Duncan test and one-way ANOVA, respectively).
Applsci 11 06502 g004
Figure 5. (a) Fruit weight and (b) Yield of Physalis ixocarpa with different treatments: CT: soil + 100% of chemical fertilization, BT20 and BT50: soil + biochar + 100, 20, or 50% of chemical fertilization, respectively, and BBfT: soil + biochar + biofertilization. Different letters indicate significant difference (p < 0.05, Duncan test).
Applsci 11 06502 g005
Figure 6. (a) Plant height and (b) root length of Physalis ixocarpa with different treatments: CT: soil + 100% of chemical fertilization, BT20 and BT50: soil + biochar +, 20, or 50% of chemical fertilization, respectively, and BBfT: soil + biochar + biofertilization. Different letters indicate significant difference (p < 0.05, Duncan test).
Applsci 11 06502 g006
Table 1. Characteristics of biochar added to soil.
CharacteristicValue
pH8.2 ± 0.09
EC (µS·m−1)1021 ± 12
CEC (cmol+·kg−1)37 ± 3.1
Pav (mg·kg−1)250 ± 8.4
NT (mg·kg−1)3500 ± 0.005
Corg (%)67 ± 2.7
Cinorg (%)1.24 ± 0.003
H:Corg (molar ratio)0.38 ± 0.001
C:N191 ± 10
WHC (%)61 ± 4.7
BD (g·cm−3)0.20 ± 0.003
Particle-size33.5% < 0.6 mm
EC: electric conductivity, CEC: cation exchange capacity, Pav: available phosphorus, Corg: organic carbon, Cinorg: inorganic carbon, NT: total nitrogen, WHC: water-holding capacity, BD: bulk density.
Table 2. Characteristics of the nopal-based biofertilizer used in this study.
CharacteristicValue
pH5.9 ± 0.11
EC (µS·m−1)20,800 ± 875
C:N4.5 ± 0.38
(mg·L−1)
COD5723 ± 125
NT1277 ± 35
PT603 ± 27
Ca
K
1241 ± 142
5568 ± 375
Mg
Na
909 ± 48
74 ± 8.9
Cu0.091 ± 0.004
Fe
Zn
2.58 ± 0.002
0.910 ± 0.005
Auxins1158 ± 12.7
Gibberellins22.5 ± 1.76
EC: electric conductivity, COD: chemical oxygen demand, NT: total nitrogen, PT: total phosphorus.
Table 3. Changes in soil by the application of biochar and the treatments.
Soil
Characteristic
before Crop Developmentafter 1st Crop Cycleafter 2nd Crop Cycle
SoilSoil + BiocharCTBT20BT50BBfTCTBT20BT50BBfT
pH7.6 ± 0.15 b7.2 ± 0.05 **a7.1 ± 0.10 a7 ± 0.02 a7.7 ± 0.10 b8.5 ± 0.04 e7.7 ± 0.15 b7.9 ± 0.10 c7.7 ± 0.10 b8.1 ± 0.10 d
EC (µS m−1)933 ± 21 d923 ± 4 d1313 ± 6 d997 ± 23 e527 ± 2 c923 ± 3 d523 ± 40 c453 ± 12 b330 ± 7 a517 ± 7 c
BD (g cm−3)
ρBT (g cm−3)
1.33 ± 0.01 f1.05 ± 0.01 **b
1.22 ± 0.008
1.13 ± 0.03 e1.10 ± 0.06 bd1.07 ± 0.07 bd0.95 ± 0.07 a1.13 ± 0.04 e1.02 ± 0.01 ab1.01 ± 0.02 ab1.00 ± 0.01 ab
TextureSand
(mg kg−1)
K257 ± 9.8 a302 ± 6.0 **bc357 ± 8.7 e289 ± 4.11 b312 ± 7.8 cd12 146 ± 9.7 h415 ± 7.8 f291 ± 5.9 b317 ± 2.7 d9975 ± 7.1 g
Ca176 ± 12 b180 ± 7 b437 ± 6.0 e493 ± 6.0 f144 ± 2 a295 ± 8.5 d297 ± 7.6 d329 ± 10 b506 ± 5 f262 ± 7 c
Mg8 ± 0.6 d7 ± 0.7 c5 ± 0.1 b3 ± 0.6 a3 ± 0.1 a5 ± 0.1 b2 ± 0.07 a2 ± 0.06 a9 ± 1.4 e6 ± 0.7 bc
Mn20 ± 1.1 de21 ± 0.81 e17 ± 0.14 ab18 ± 0.08 bc16 ± 0.14 a16 ± 0.31 a19 ± 0.1 c19 ± 0.8 c19 ± 0.2 c21 ± 0.1 e
Zn1.3 ± 0.003 a1.4 ± 0.008 a6 ± 0.3 b6 ± 0.3 b7 ± 0.02 c11 ± 0.2 d12 ± 0.05 e15 ± 0.1 f13 ± 0.5 g20 ± 0.05 g
Fe5 ± 1.0 a9 ± 1.5 **a50 ± 4 c89 ± 7.5 e61 ± 3.6 d100 ± 6 f32 ± 3 b55 ± 3.1 cd77 ± 2.5 e49 ± 6.4 c
Cu1.7 ± 0.5 a2.1 ± 0.2 a3.6 ± 0.2 b3.6 ± 0.2 b4 ± 0.08 bc4.7 ± 0.02 c15 ± 0.2 d27 ± 0.4 f14 ± 0.1 d22 ± 0.7 e
PbLDLLDLLDLLDLLDLLDLLDLLDLLDLLDL
CdLDLLDLLDLLDLLDLLDLLDLLDLLDLLDL
NiLDLLDLLDLLDLLDLLDLLDLLDLLDLLDL
*, ** Significantly different at p < 0.05 and p < 0.01, respectively, from soil without biochar. Different letters indicate significant difference (Duncan) at p < 0.05. LDL: Lower than detection limit: DL for Pb = 0.015 mg/kg, DL for Cd = 0.008 mg/kg, DL for Ni = 0.0042 mg/kg CT: soil + 100% chemical fertilization, BT20: soil + biochar + 20% chemical fertilization, BT50: soil + biochar + 50% chemical fertilization, BBfT: soil + biochar + biofertilizer, EC: Electric conductivity, BD: Bulk density, ρBT: Theoretical bulk density.
Publisher’s Note: MDPI stays neutral with regard to jurisdictional claims in published maps and institutional affiliations.

