Article

Survey Solutions for 3D Acquisition and Representation of Artificial and Natural Caves

1
Italian National Research Council, Research Institute for Geo-Hydrological Protection (CNR-IRPI), Strada delle Cacce 73, 10135 Torino, Italy
2
Department of Environment, Land and Infrastructure Engineering (DIATI), Politecnico di Torino, Corso Duca Degli Abruzzi, 24, 10129 Torino, Italy
3
Speleo Club Tanaro, Via Carrara, 12075 Garessio, Italy
*
Author to whom correspondence should be addressed.
Appl. Sci. 2021, 11(14), 6482; https://doi.org/10.3390/app11146482
Submission received: 14 May 2021 / Revised: 10 June 2021 / Accepted: 11 July 2021 / Published: 14 July 2021
(This article belongs to the Section Earth Sciences)

Abstract

:
A three-dimensional survey of natural caves is often a difficult task due to the roughness of the investigated area and the problems of accessibility. Traditional adopted techniques allow a simplified acquisition of the topography of caves characterized by an oversimplification of the geometry. Nowadays, the advent of LiDAR and Structure from Motion applications eased three-dimensional surveys in different environments. In this paper, we present a comparison between other three-dimensional survey systems, namely a Terrestrial Laser Scanner, a SLAM-based portable instrument, and a commercial photo camera, to test their possible deployment in natural caves survey. We presented a comparative test carried out in a tunnel stretch to calibrate the instrumentation on a benchmark site. The choice of the site is motivated by its regular geometry and easy accessibility. According to the result obtained in the calibration site, we presented a methodology, based on the Structure from Motion approach that resulted in the best compromise among accuracy, feasibility, and cost-effectiveness, that could be adopted for the three-dimensional survey of complex natural caves using a sequence of images and the structure from motion algorithm. The methods consider two different approaches to obtain a low resolution complete three-dimensional model of the cave and ultra-detailed models of most peculiar cave morphological elements. The proposed system was tested in the Gazzano Cave (Piemonte region, Northwestern Italy). The obtained result is a three-dimensional model of the cave at low resolution due to the site’s extension and the remarkable amount of data. Additionally, a peculiar speleothem, i.e., a stalagmite, in the cave was surveyed at high resolution to test the proposed high-resolution approach on a single object. The benchmark and the cave trials allowed a better definition of the instrumentation choice for underground surveys regarding accuracy and feasibility.

1. Introduction

Cave surveys are a crucial point in cavers’ activity as they allow mapping caves for their exploration [1]. It is helpful as a guide for further exploitation or as a basis for scientific activities carried out in those caves. In particular, 3D digital models of caves are suitable tools for both scientific purposes. They can be used for geological or geomorphological observations [2], for the integration of 3D underground caves cadastral databases [3], and visualization and navigation, especially related to complex access caves, through virtual and augmented reality techniques [4]. In geomatics, several well-established methods are available for the three-dimensional survey of environments. Indoor environments represent a rather critical case, where the GNSS positioning technique fails [5]. Therefore the 3D survey should be carried out by well-established topographical instruments, capable of measuring angles and distances such as the total station. Still, the space complexity limits the use of some instruments for 3D surveying or requires the operator’s great experience. Additionally, the three-dimensional representation of the caves is even more complex. The task is complicated by extreme environmental conditions, such as low/variable illumination, humidity, and limited accessibility [6].
Traditionally, the mapping procedures in underground cave environments were carried out by tracing a three-dimensional polyline by using clinometers and compass to store the different angles featuring the survey; each segment implied the marking of its vertices on cave walls to serve as a reference. The cave outline was then manually plotted by the caver with a remarkable level of subjectivity (Figure 1) [1,7], including systematic and random errors.
Recently, the use of clinometers and compass was substituted by the spread of handheld topographic instruments such as portable laser range finders equipped with digital clinometers and compass [1,7]. The measurements acquired with the laser range finder are stored in the device or, currently, in a phone app (e.g., TopoDroid) linked to the range finder where the caver can visualize the entire survey [8]. Moreover, in every station point, the survey procedure implies a series of circular measures to trace a transverse section of the cave obtaining a discrete three-dimensional representation. The app allows the caver to manually draw the cave outline adding details to the survey (Figure 1). The obtained final result is a subjective representation of the cave done by the caver on a network of measured points. The resolution and accuracy of the three-dimensional model are often highly heterogeneous and rely on the caver’s ability that connects the sequence of dots and creates the representation of the surveyed area.
Thanks to technological advances over the last decade, several 3D surveying techniques for generating full 3D and multi-resolution models of underground cavities are now available. Besides topographical instruments, such as Total Stations (TS), it is possible to get 3D information about the environment in the form of point clouds quickly and easily and with high levels of details thanks to a wide range of passive and active sensors [9]. These sensors are now commonly used in different application fields (e.g., cultural heritage, monitoring, etc.) for the reconstruction of scenes or 3D objects and there are several studies aimed at comparing the use of different techniques to highlight their advantages and criticality and to define the best practice to follow [10,11,12,13,14,15]. To achieve more accurate and complete surveying results, it is crucial to be aware of the properties that certain technique needs to respond and of the requirements of the desired results [16]. Firstly, the selection of the most appropriate survey approach should consider not only the precision and the reliability of the resulting products, but also the size and manageability of the final datasets. Then, from the operational point of view, it is fundamental to evaluate the portability of instruments, especially in underground sites with limited accessibility. Other important elements are the required acquisition time and the autonomy of the power system of selected survey solutions. Finally, the conditions of the survey environment greatly influence the choice of the most appropriate technique, especially in the case of underground caves, where the difficulty of access, humidity, temperature, and lighting conditions strongly reduced the number of effective solutions.
Both active and passive remote sensing techniques are, nowadays, widely exploited in underground environments surveys for 3D modeling purposes. Active remote sensing-based instruments include all the scanning devices, such as Terrestrial Laser Scanners (TLS), emitting laser pulses [17]. A surface or object reflects each pulse, and the instrument is capable of computing the distance and position, in polar coordinates, of the point. The intensity of the echo is registered, too. According to its performance level and its settings, the instrument can repeat this sequence from 10,000 to 500,000 times per second.
Moreover, to acquire a complete survey of the surroundings, laser beams are projected in several directions using rotating and/or oscillating mirrors. The color information can also be recorded thanks to the integration of the system with a digital camera. For each scan station, raw output data is generated in the form of a point cloud. The data registration is carried out by positioning reference targets (natural or artificial), which were previously surveyed by a topographical survey, to georeference the resulting point cloud in a specific reference system [18]. TLS is now a consolidated approach to obtain a 3D measurement. Despite its encumbrance and weight, some tentative approaches to use it in cave surveys were attempted. They were especially tried in caves open to tourists and thus equipped with stairs and footbridges, easing the transport of the instrumentation, as evidenced by several research works [19,20,21,22,23,24,25] or in sites relevant for scientific purposes such as the Naica cave [26]. TLS allows capturing highly accurate data even at long distances but, in indoor environments and complex areas characterized by limited lines of sight and many shadow areas, it often cannot be an efficient method given the need for a high number of station points. Thanks to the high level of detail obtained with this technique, TLS has been used in many studies to detect limited portions of caves, to conduct morphological and structural analysis [27,28,29,30]. Only in some works, as mentioned by [31], TLS were used to make surveys of entire caves, with extensions greater than a few hundred meters. Although these surveys allowed to obtain detailed models, they demonstrated that, due to the huge amount of final data, the point clouds must be divided into parts to be analyzed or sub-sampled, with a consequent loss of resolution.
To overcome these applicability issues, in recent years, a new generation of range-based profilers was pushed on the market. This new generation of instruments is represented by integrated and handheld solutions called Indoor Mobile Mapping Systems (IMMS) [32]. These systems implement multiple sensors, such as profilers, Inertial Measurement Units (IMU), Distance Measuring Instruments (DMI), and, in some cases, camera sensors, in a unique platform. The portability and flexibility of these solutions make them particularly suitable for indoor mapping applications [33,34]. These instruments are generally based on Simultaneous Localization and Mapping (SLAM) technology, including specific algorithms to solve the problem of localization, which allow to, simultaneously, estimate the instrument position and generate a 3D digital model of the environment [35,36]. Consequently, SLAM technology makes IMMS a competitive possibility in terms of time consumption in data acquisition and data processing. Several IMMS solutions are now available on the market. Among the different types, many of them are integrated on vehicles, trolleys, backpacks, or handheld platforms [33,37], and several researchers analyzed their performances [37,38,39]. The maneuverability of these tools makes them particularly suitable for indoor applications and narrow spaces [40,41], even in environments with limited access, which may require a certain speed in the acquisition phase, as could be the case of caves or mines [42,43].
Among passive solutions 3D information can be extracted, thanks to different approaches involving classical photogrammetric technique [44] or Structure from Motion (SfM) algorithms [45,46] from a sequence of images. The SfM approach is based on the capture of multiple shots that portrays the surveyed object or area. The algorithms developed in the computer vision field and widespread in RPAS (Remotely Piloted Aircraft Systems) applications [47] exploit the photogrammetry principles and allow the 3D reconstruction of the surveyed target [48]. The algorithm’s capability allows reconstructing the surveyed object even from pictures taken for other aims (i.e., reconnaissance photos) sufficiently overlapping (70–80% of overlap), allowing to exploit archived dataset and obtain unprecedented datasets [49]. SfM can be considered a valid and low-cost solution for the acquisition of 3D models that can be considered when it is impossible to use other well-known systems like TLS or other topographic solutions [50]. Furthermore, xxx by knowing the internal and external orientation of a digital image, using a dense 3D digital model, it is possible to associate the value of the distance between the center and the object to the same pixel. This procedure allows realizing a solid image, which is, therefore, the result of the integration of the RGB digital image with distance, allowing the restitution of the third dimension [51].
The reconstruction of the photogrammetric point cloud can also be registered with reference points to be plotted in geographical coordinates. The advances in sensors miniaturization and optimization have allowed developing portable instruments that are currently at an experimental level trying to substitute the current ones. Today, image sensors are integrated into commonly used devices, such as action cameras and smartphones, giving, even to non-expert operators, the ability to exploit collected data for the generation of 3D models [6]. Moreover, the increment of RPAS datasets is additionally broadening the potential application of such an approach [52,53]. Although these systems were initially implemented to acquire data in extensive outdoor environments, there are now many recent studies that describe their applicability in indoor spaces [54,55], even in dark caves [56]; in this last case, proposed solutions are mainly employed for the survey of small portions of the natural cave [57] and not for extensive surveys.
The main advantage of the use of passive sensors is that they do not require elaborate data acquisition planning, and data processing is also relatively easy. The resolution of the generated 3D point clouds strictly depends on: the image resolution, the camera characteristics, and the acquisition distance from the studied object, namely by the Ground Sample Distance (GSD), which can be calculated as follows:
G S D = h g · ρ c k ,
where hg is the flying height above ground (or the acquisition distance from the object), ck is the focal length of the camera and ρ is the image’s pixel size [58]. Even if the density of point clouds can be compared to that of the TLS, it may be affected by a certain level of noise in particular with low light conditions, light variations, and reflective or uniform surfaces.
The recent evolution of SfM applications on caves seems to be encouraging for the identification of a methodology that could be used for a massive 3D mapping of caves. To date, only a minimal number of caves are represented in the third dimension and they are often equipped with ladders and walkways, for tourism or archaeological purposes, to ease their access [59,60]. In this paper, we investigated the best compromise between the accuracy and feasibility of different techniques and to define a general methodology to carry out a 3D survey of natural and complex caves. The proposed methodology should be easily replicable and ensure sufficient precision, such as to be able to populate a possible 3D cadastral map of the caves or carry out virtual tours, even for difficult to access environments. In fact, this type of application requires a user-friendly methodology that refers to simple concepts and allows a high diffusion of the technique. The paper is organized as follows: we made an accurate survey of a test site, i.e., a road tunnel segment to compare the proposed techniques with the reference data and assess their accuracy. According to the test site results, we developed and proposed a methodology for the survey of natural caves based on the SfM approach. The proposed survey technique is tested in the Gazzano cave. The final discussion presents an analysis of the different 3D survey methodologies and the best solution for the 3D natural caves survey, showing the general validity of the SfM approach.

2. Material and Methods

The paper presented two different case studies; the first part of the research is focused on the definition of the quality of a 3D point cloud of an underground artificial site. We tested three different measuring systems and we explored, in particular, the quality (in terms of precision) of their results and their limitations in a segment of a tunnel to adopt this approach in an underground structure that can be easily reached even using cars and that have the typical limitations of underground sites like the lack of GNSS signal.
The second presented case study is the Gazzano cave. Gazzano is an interesting cave located in Piemonte (NW of Italy) that has been selected for the application of the methodology developed for the creation of a 3D model of caves.

2.1. Artificial Tunnel Segment

To test the capability of reconstructing an underground structure, we analyzed the survey of the tunnel test site assuming the TLS survey as the reference technique. The considered tunnel segment is 100 m long with 12.5 m diameter, where we placed and measured on walls the position of 56 reference targets. Targets were distributed in groups of 4, 2 for each side, every 10 m along the tunnel. Within the subgroup, the target-target distance ranged from 1.5 to 3 m. Targets position was rigorously surveyed from 6 setup locations using Total Station (TOPCON GPT-7001L) to compute their 3D coordinates. The survey was registered using four benchmarks located in the tunnel. The network coordinates were computed with a precision of ±0.02 m.

2.2. Gazzano Cave

The Gazzano cave (125 Pi/CN—Regional cave cadastre) is located in the Maritime Alps in the municipality of Garessio, Northwestern Italy (44°11′52.18″ N, 8°0′40.74″ E) at 574 m above sea level elevation (Figure 2). The cave was accidentally discovered during the excavation of a quarry and explored in 1898. In the past, several peculiar features were looted and, nowadays, the marks of these actions are still visible. The Gazzano cave is an important natural site for the preservation of biological diversity because it is a bat (Rhinolopus spp.) hibernation site and a natural refuge for European cave salamanders (Speleomantes spp.).
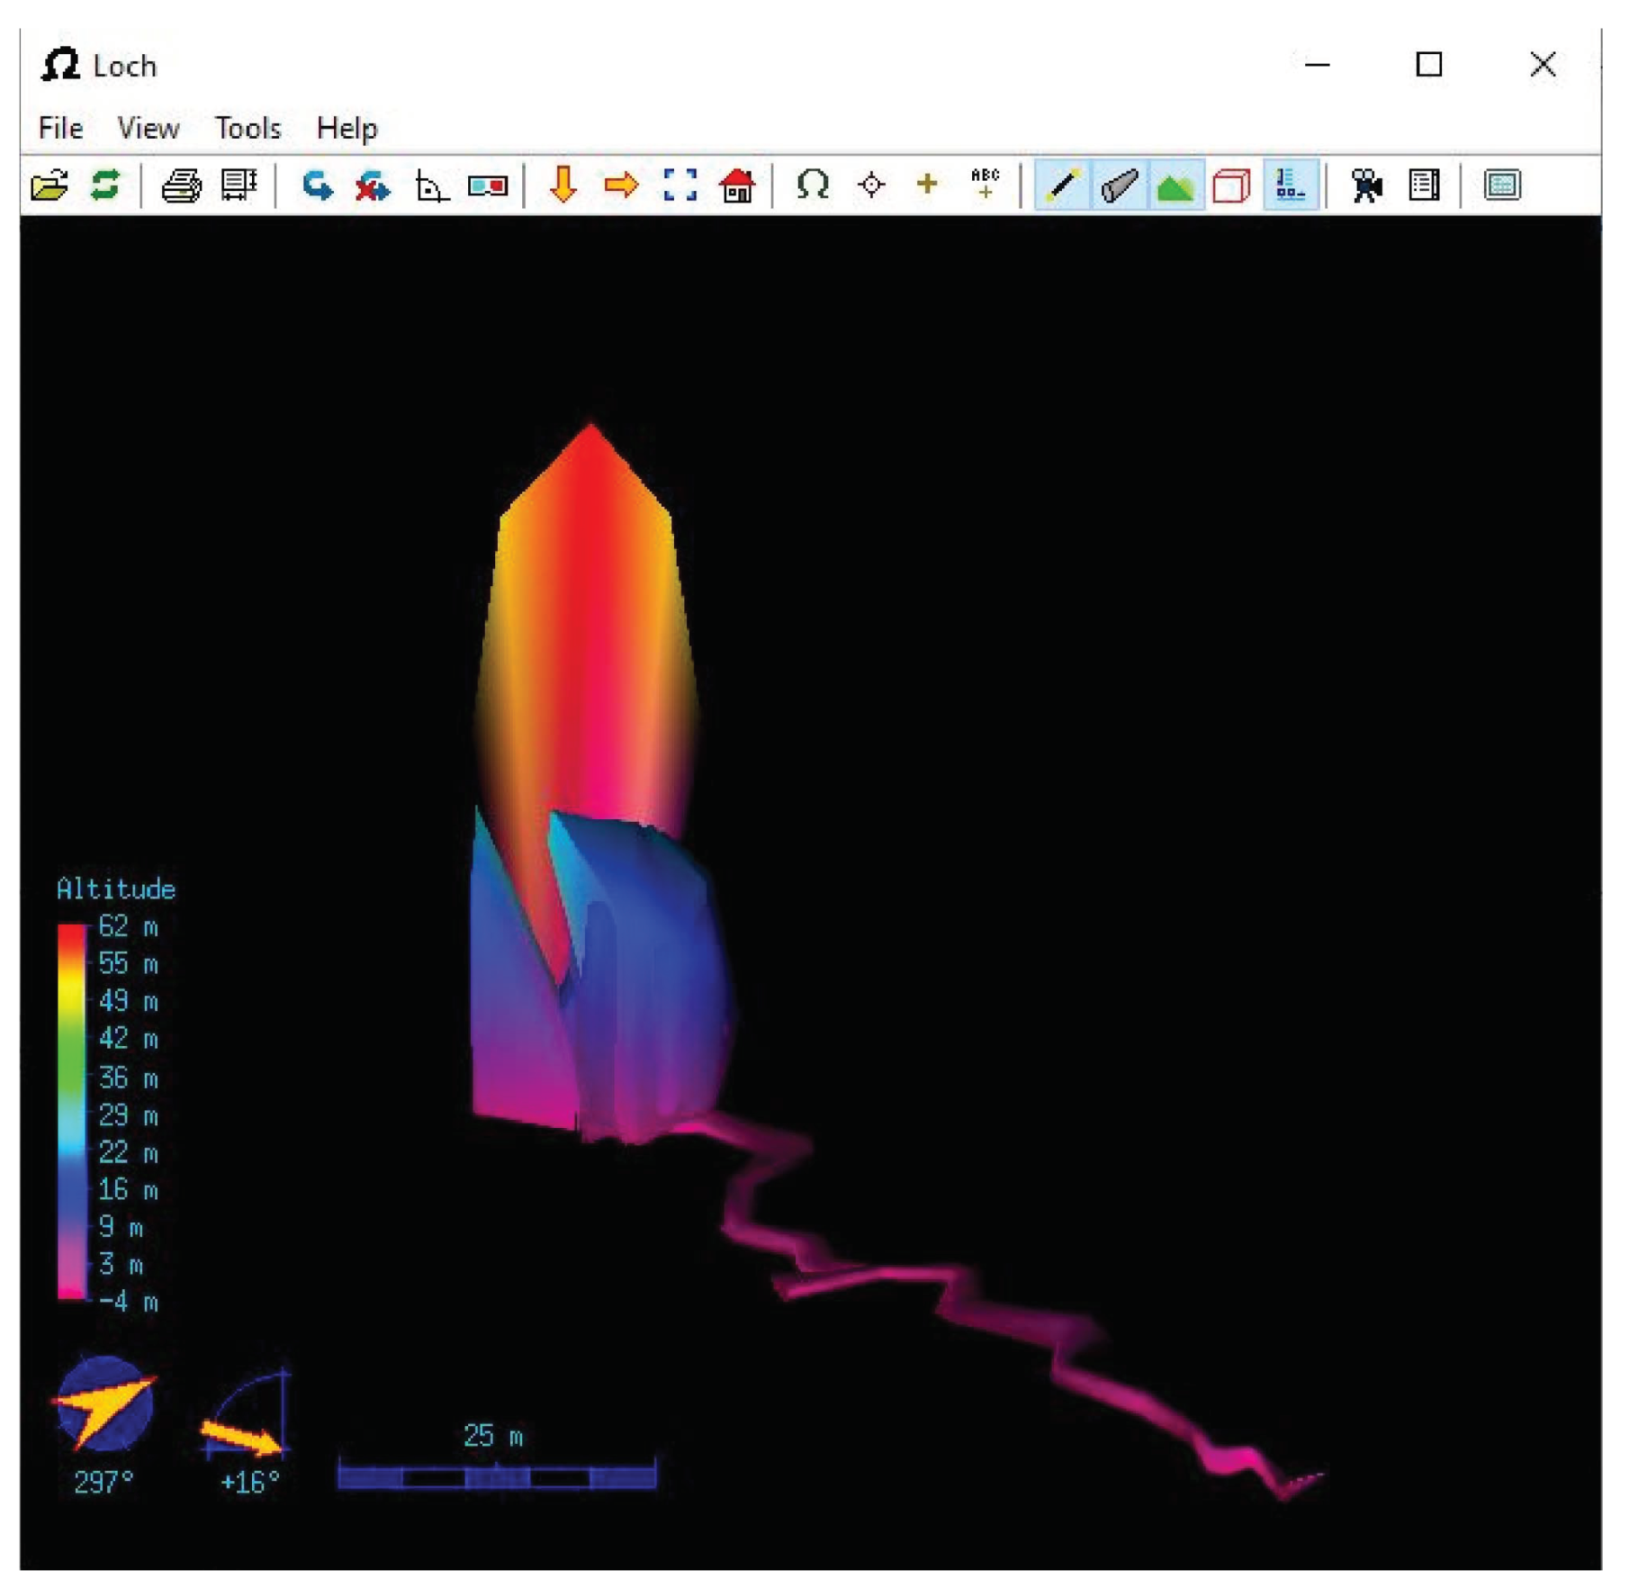
The cave, excavated in dolomitic limestone, is characterized by a unique corridor approximately 105 m long that ends in a chamber 37 m high with a waterfall from its top (Figure 2a); the water forms a small lake in the chamber then streams through the whole cave length until the exit (Figure 2b). The cave is accessible after a short walk. Initially, approximately in the first third of its length, the cave is characterized by a reduced height—minimum ~1 m hampering the accessibility and operation with bulky instrumentation; then the height increases allowing one to walk almost comfortably until the terminal chamber.

2.3. D Survey of the Artificial Tunnel Segment

The survey of the tunnel was done considering three approaches based on the use of active or passive instruments with different costs and characteristics. The first considered system is a terrestrial laser scanner (TLS). It represents the most accurate and expensive solution for the acquisition of a 3D model. Despite these systems allow to obtain products with high resolutions, their size and weight make them difficult to transport in many caves, where the accessibility and movement within them are limited. The second category of the considered instrument is portable LiDAR (PLS). PLS are characterized by an active sensor that works like the TLS, but the system has been designed to be more portable and easier to use. The limited cost and dimension make this category of instruments more adapted to the acquisition of environments characterized by problems of accessibility. The third considered solution is based on the use of a commercial photo camera and Structure from Motion (SfM) for the generation of a 3D point cloud. This is the cheapest solution that adopts a passive sensor. Table 1 shows the instruments exploited for this research work.
We decide to use an artificial tunnel to test the considered methodologies because in several natural caves the transport and use of big instruments with heavy batteries can be very complex or even impossible. For this reason, we identified a segment of a tunnel that has favorable characteristics as the section that allows the use of cars for carrying instruments and its regular geometry that guarantees an easy comparison between results obtained by different instruments. The artificial test site also allows the temporary installation of a series of targets on the walls of the tunnel that has been fundamental for the alignment and comparison of different 3D models.

2.4. Development of a Methodology for the Acquisition of a 3D Model of a Natural Cave

The comparison of the acquired 3D models, as reported in Section 3.1, shows that the solution based on the use of a photo camera and SfM can be adopted for the acquisition of a sufficiently accurate 3D model, making it suitable for the reconstruction of the geometry of the studied area. Furthermore, this solution limits the use of expensive and heavy instruments which can hardly be carried in tight spaces. For this reason, SfM can be considered a good solution for the acquisition of the 3D model of natural caves, where the use of more complex topographic instruments can be complicated (in several cases nearly impossible). Starting from the experience using the SfM approach in different environments (e.g., [6,61,62,63]), we defined and tested a methodology dedicated to the survey of natural caves for their 3D modeling at different scales.
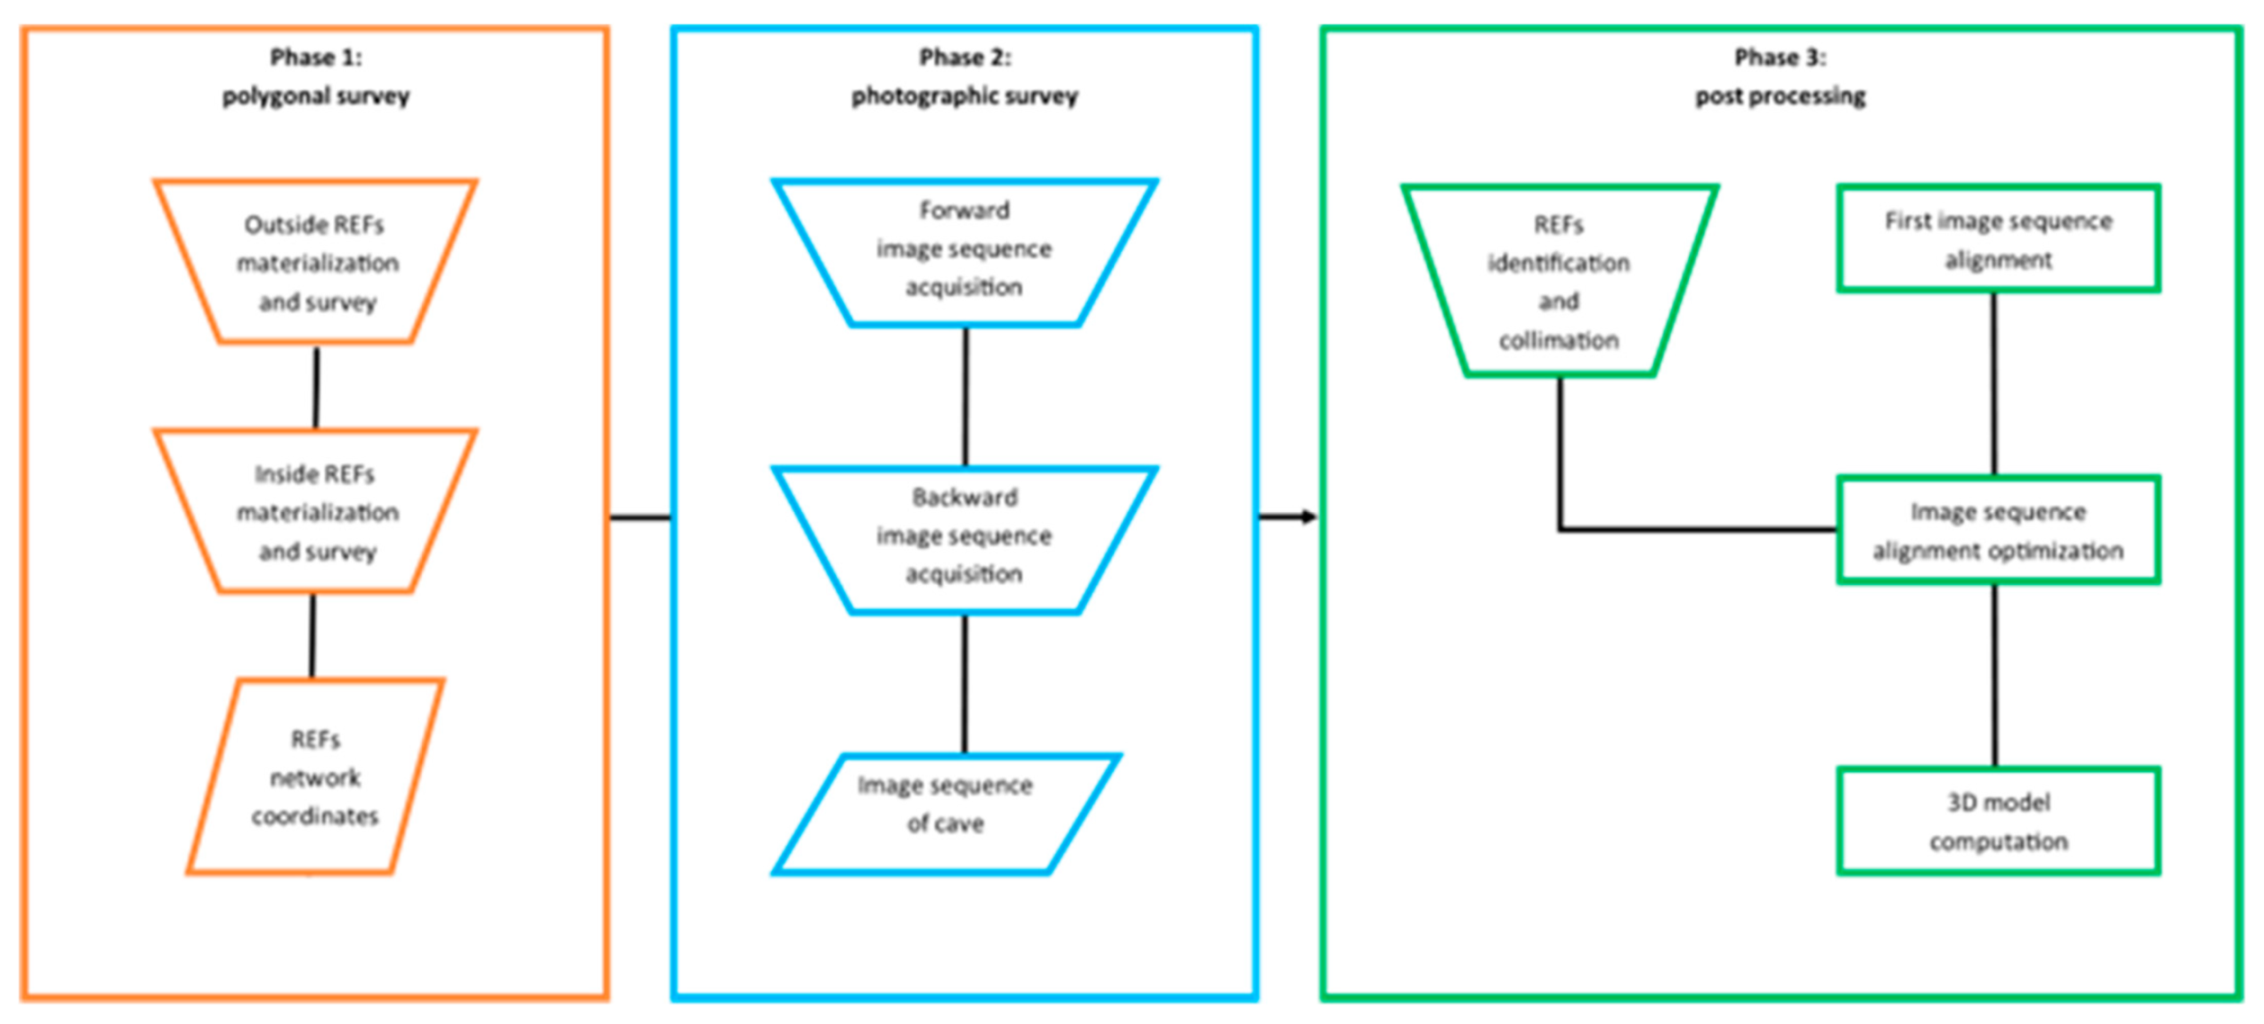
The proposed method is divided into three different phases (Figure 3): (i) REF Polygonal survey; (ii) photographic survey; (iii) post-processing. Firstly, the cave needs to be located and framed by a topographic survey. This step is fundamental for the correct orientation and georeferencing of the photo sequence. The operation starts outside the cave by properly defining two, or more, reference benchmarks to refer the whole survey to a geographical reference system rather than a local one. Subsequently, measurements continue inside the cave by selecting a sequence of reference points on cave walls and features. The materialization of inner benchmarks should be carefully realized without damaging cave features and by minimizing the impact; for these reasons, a small varnish mark with color in contrast with the surroundings (e.g., red or orange) can be sufficient because the distance between the target and the photo camera is always limited. Additionally, to maximize its accuracy, the polygonal survey should be carried on twice in both directions to close the polygon. The survey phase of benchmarks is performed using a portable range finder capable of measuring and storing angles and distances contemporarily. The position of external reference points can be acquired using GNSS systems.
The subsequent phase is dedicated to the capture of the cave by the camera. Images should be captured in accordance with the principles of SfM thus varying the capture position in every picture and, contemporarily, assuring an adequate overlap. As the operation is carried out in a completely manual way, the capture should follow a squiggly path (Figure 4) with the camera framing the cave in direction of the operator path. Due to the extreme variation of the cave’s size and shape, it is impossible to strictly define a priori acquisition parameters. The most critical elements are the required overlap (more than 70%) and the illumination of images; according to our experience, the use of flash is strongly discouraged as it doesn’t assure a diffuse illumination necessary for an adequate rendering of the cave in post-processing. Concerning the camera settings, they should vary according to the lighting conditions and size of the cave. The best way to illuminate the cave is to exploit the light mounted on the ‘caver’s helmet and, when it is possible, to place another operator ahead illuminating in the opposite direction. The device used in the current experiment is a superkikko (kikkolamp.com) set at 200 lumens in the corridors and 1400 lumen in the main chamber. In any case, the illumination should be indirect to avoid blinding effects on the camera sensor. The two presented phases are tightly connected and of high importance for the correct acquisition of the image sequence. Only with a good overlap and complete coverage of the cave, it is possible to obtain an excellent final result. Lastly, in the post-processing phase, all the acquired data (i.e., benchmarks’ coordinates and image sequence) are imported into the processing software where the cave 3D model is computed. The processing, which is subdivided into several stages, starts with recognizing and collimating reference points in every picture manually depicting them. Then, all the images are aligned according to their relative positions and input coordinates. It is essential to point out that, as the acquisition phase is done underground, the images are not provided by a shooting point coordinate. The aligned image set is then used to compute the 3D point cloud and the final model with mosaicked images draped on, resulting in the 3D reconstruction of the cave.
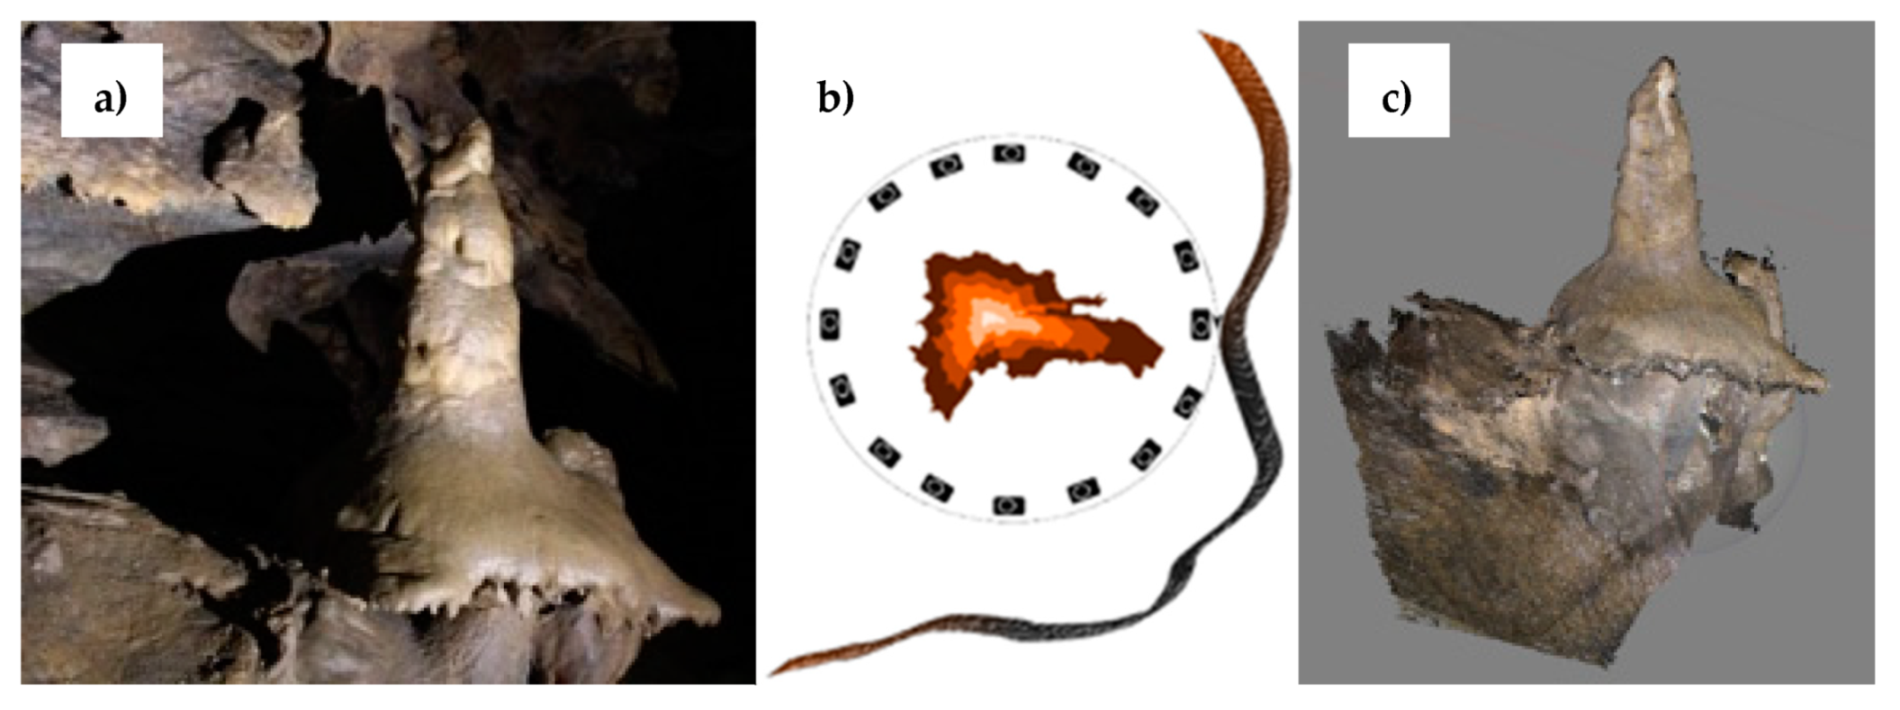
Using the same approach, it is possible to obtain a centimetric-resolution 3D model of the most interesting elements located inside the cave. In this case, the acquisition phase should be done by providing an ultra-high-resolution photo sequence of the target, obtained with a high-end digital camera. Increasing the resolution of the acquired data and processing settings it is possible to create a more detailed 3D model of the interior elements of the caves and provide a double-resolution model: a general medium-scale representation of the caves (1:500–1:1000 scale) with ultra-detailed models of the main elements of the cave at a centimeter resolution.
The medium resolution approach is mainly finalized to the acquisition of a continuous 3D model of the cave. This model’s final resolution is sufficient for a detailed reconstruction of the morphology of the cave but not so clear to obtain a correct visualization of the speleothems or the other essential elements that often enrich caves. The approach adopted for the ultra-high-resolution model acquisition is similar. Still, the number of images should be sufficient to guarantee both the complete description of the object and the capture of its character details. Their Ground Sample Distances (GSD) should be lower (up to millimeters) [64].
These are the principles that must guide the operator in the images capture to assure the correct survey resolution of specific areas or objects within an underground cave: indeed, it is not possible to define a general acquisition scheme for these types of features, given their irregularity and variability in the morphology of the features, but the survey must be adapted from time to time, trying to cover the entire area of the object. To scale the model, as previously stated, it is necessary to know the relative position of some spread materialized REF points on the study area.
In the case of 3D acquisition of natural elements of particular value, it is helpful to exploit removable markers to guarantee the preservation of the surveyed elements or speleothems. Due to the limited space that often characterized the caves, the measurement of these points may be difficult, if not impossible, even with a portable range finder: in these cases, it is appropriate to take advantage of templates of known size to ensure proper scalability of the model to reduce the number of required reference points.

3. Obtained Results

3.1. D Models of the Artificial Tunnel Segment Comparison

The TLS survey, operated by a RIEGL LMS-Z420i, was subdivided into six scan positions evenly distributed along the midline of the tunnel section to maximize the visibility of the surveyed area. In the post-processing phase, each scan was co-registered and roto-translated based on cylindrical targets [18]. Then, the whole point cloud (83,932,625 points) was registered, in Microstation Connect Edition, to the visible targets among the 56 available (Table 2). Each scan was fitted with a multi-station algorithm to improve surface coplanarity in overlapping areas by introducing a scale factor based on the cloning effect of homologous geometries. The overall procedure accuracy results in an RMS of 0.025 m, following the target survey, confirming its reliability as a benchmark for the next phase of the investigation.
Consequent to the TLS survey, PLS and SfM ones were carried out on the same test site. The PLS survey was performed with a Kaarta Stencil 2–16 portable laser scanner, based on the SLAM algorithm [65]. The platform integrates a Velodyne VLP-16 LiDAR system composed of 16 rotating profilers (each with a different orientation with a Field of View (FOV) equal to 360°Hx30°V), a low-cost IMU, and an optical sensor. The Stencil 2 is based on the Visual-LiDAR Odometry and Mapping approach [66]. The main workflow provides, firstly, a visual-inertial odometry algorithm, performing a frame to frame motion estimation, which combines each future to the depth data derived by the LiDAR and optimizes the solution considering the IMU information; then, the LiDAR odometry algorithms exploit speed data measured by the odometer for the point cloud registration. Finally, the identification and matching of geometric features in the point cloud allow optimizing the registration, using the previously estimated pose constraints. Thanks to this approach, Stencil 2 can generate a point cloud of the surveyed environment, registered in a local system, in real-time. Data acquisition was performed following a straight path, which, like SfM, was covered back and forth, adding segments at the beginning and end of the test section to survey its terminal portions better. The raw data acquired were firstly processed using the Adaptive Data Reply tool, provided by Stencil 2. The tool allows to simulate the scanning at a lower speed and possibly change several parameters to optimize the scan matching process. The resulting point cloud was roto-translated in the same reference system of the TLS one by employing the previously surveyed reference targets, and software obtaining the residuals showed in Table 3; the quality of the results allowed to proceed comparison with the reference cloud.
The SfM was performed by acquiring a sequence of images with a Canon EOS 100D camera along a squiggly path, back and forth, in the tunnel’s main direction. The position of each capture and the path were selected arbitrarily during the acquisition. The whole set of 245 images was then imported in Agisoft Metashape to reconstruct the point cloud by the employment of the SfM algorithm. Preliminary, the coordinates of the targets were imported. Their position was collimated on images to co-register the resulting point cloud (Table 4) to the TLS one and allow the comparison. The whole process took approximately 90 min of calculation time.
The comparison between the PLS and TLS clouds was carried out by analyzing three sections (Start, Center, End) of the tunnels by manually measuring distances between homologous features in the two clouds (Figure 5). The residuals are listed in Table 5.
To check the reliability of the SFM point cloud (73,188,930 points), the identical cross-sections (Figure 6) were extracted and compared with the homologous features of the TLS one obtaining the residuals summarized in Table 6.

3.2. D reconstruction of the Gazzano Cave

The cave was surveyed according to the proposed methodology (described in Section 2.4), validated as a result of the surveys in the tunnel. The entire image dataset was captured according to the following camera settings: focal length 18 mm; iso 6400; exposure time 1/13 sec; f-number 3.5 and processed in Agisoft Metashape where the point cloud was reconstructed. Prior to the calculation, the images were registered to the cave survey (Figure 2b) to obtain the final result in geographical coordinates (Figure 7a). The registering was achieved with a decimeter-level accuracy (Table 7).
As the images’ quantity was noteworthy (1597), the survey was processed in four separate groups and then merged into a unique 3D model (Figure 7b). The use of image groups is vital to ease the processing of images and reduce the processing time. This is encouraging as the final output can represent the cave and its features.
Moreover, the SfM capability allows portraying the cave interior, too (Figure 8). This feature can constitute the basis for realizing a low-resolution representation of the cave for virtual exploration and tourism purposes. The only limit of the proposed methodology is the complete representation of the final chamber. The lighting and humidity conditions did not illuminate its upper sector adequately, as it reaches 27 m (Figure 1 and Figure 2a). A possible solution is adopting more acquisition points at different elevations inside the final chamber using cavers techniques to climb the wall and reach the top of the chamber. The final result is a continuous model of the cave with a good resolution and accuracy. For traditional methods, the use of SfM allows the reconstruction of a 3D model without the manual interpretation of cavers that should not connect the different benchmarks with the manual representation of the cave.

3.3. High-Resolution Reconstruction of an Element of Interest for Virtual Tours Implementation

Near the final chamber, an element of interest was noticed and used to focus on the experimentation of a high-resolution survey (Figure 9a). One of the most precious elements of the Gazzano cave is the presence of a big stalagmite that is located in the last part of the cave. It is close to the cave walls but its distance from the cave wall is sufficient to capture it in almost all directions as schematized in Figure 9b. According to the proposed approach, 92 photos of the stalagmite were taken, following a circular path around the stalagmite capturing it from different heights to frame it from different points of view. To scale the model, five distances were measured on the speleothem. Natural marks and recognizable features were selected without marking the object with the purpose of its complete preservation.
The imagery was then processed in Agisoft Metashape as in the previous experiment. The distances were inputted in the processing procedures by collimating the relative features recognized on the photographs. The scaling procedure provided an overall centimeter-level accuracy (0.0135 m). The 3D point cloud was further processed to compute a 3D object (0.51 m high and with a maximum diameter of 0.7 m) with the survey picture mosaicked and draped on it (Figure 9c).

4. Discussion

This paper analyzed and compared the possible methodologies for acquiring a 3D model of an underground structure. The realization of three-dimensional point clouds of indoor and underground structures has been a critical activity that now was facilitated thanks to innovative solutions. In the previous chapter, we presented the compared use of TLS, PLS, and SfM on the same test site. The PLS is a recently available solution, with a lower cost if compared to the TLS. PLS can be adopted for the acquisition of indoor and underground elements, where it can be very useful because it works dynamically [41]. Thanks to the embedded sensors and processing algorithms, these sensors can progressively cover the entire area of interest with a progressive merging of a sequence of surveys that have overlapping sectors. The PLS software uses common sectors to link the different acquisitions. TLS and PLS show how active sensors can be often considered the best solution because they do not have problems with different conditions of illumination that characterize passive sensors like photo cameras. On the contrary, the combined use of photo cameras and structure from motion has had an explosive diffusion in the last years. This use is often supported by the growing deployment of RPAS in the field of engineering geology [47] and natural hazards [53], even if the use of an image sequence for the acquisition of a 3D model based on SfM is not exclusively linked to the use of RPAS. In many cases, this approach can be adopted using different image sequence sources, like historical aerial images or terrestrial photos taken by smartphones or standard photo cameras [6,61]. The use of photo cameras becomes particularly useful if we have to consider the infrastructure’s price and the easiness of use.
Table 8 presents a brief comparison between the three categories of systems able to acquire a 3D point cloud considered in this paper.

4.1. TLS

TLS represents, of course, the most powerful class of instruments. It represents the state-of-the-art for the acquisition of ultra-detailed 3D models [67]. From the commercial point of view, different instruments vary in terms of velocity of acquisition, resolution, and distance of acquisition and these characteristics affect the instrument cost (Table 8). If we consider the static use of TLS, this category of instruments can be adopted, defining e sequence of scan positions that acquire part of the area of interest [9]. Post-processing allows creating a unique model from the union of different single scan position point clouds. As shown in Table 8, in the underground condition, the high weight and the limited manageability of TLS can hamper their use. It becomes often impossible in natural caves, where the diameter of several parts of the cave can be too limited for the transport of heavy and voluminous materials. Long corridors very often characterize caves with a narrow diameter (even less than one meter) that connect wider chambers. In this context, the acquisition of a continuum 3D model based on the union of static scan positions is rarely the best solution. The effort for the setup of a scan position is not rewarded by the limited portion of the cave that the TLS can acquire. That means that having to ensure sufficient overlap between the scans to generate a complete model of the environment [9], the number of scan positions should be incredibly high. The effort for the acquisition of a long cave makes the use of TLS often not the right choice. Besides, the proper functioning of these instruments can also be influenced by the severe conditions of the environment [6]: the presence of high levels of humidity and consequent reflective surfaces can create electric problems to the instruments and reduce the reflectivity of cave faces (as the performance of the device). Under such conditions, the resulting point cloud could be affected by high noise and localized representation errors, which can be easily identified and eliminated, allowing proper scans registration [67].

4.2. PLS

PLS were developed for dynamic use in indoor spaces [37]. This class of instruments evidenced its interesting potential in the survey of the tunnel segment. The limited range of the instruments is compatible with the tunnel section’s size and the acquisition of a sequence of close paths allows the progressive exploration and acquisition of the studied area. The main advantage given by the use of this technology, to the others (Table 8), is the real-time generation of complete point clouds describing the surveyed environment, which takes place using mapping and registration algorithms integrated into the acquisition system. One of the critical points of this system is the continuity of the survey that is required for a good result. This continuity could be guaranteed in a tunnel, but it is challenging to assure in a natural cave, where some corridors are very narrow and difficult to cross. The best practices in the use of PLS highlight the need to retrace at least part of the path several times to optimize the registration, taking advantage of the matching of common features between the clouds [66]. Additionally, it is recommended to start and finish the acquisition at the same point, to exploit loop closure algorithms to correct global drift errors [68]. Again, these operations may not be feasible in these complex natural environments. The operator’s experience in handling and managing the instrument also has a strong influence on the acquisition process’s final result [41]. It is necessary to avoid moving the instrument abruptly or to make specific movements that can negatively affect the attitude estimation and data processing algorithms, such as vertical movements, rotating the instrumental origin or turn, and tilt at the same time [69]. Often, acquisitions too close to surfaces (<30–50 cm) can create problems in the point clouds registration phase, as can happen in tight quarters. The active sensor of PLS is an important feature of this class of instruments that can be vulnerable in natural caves where the level of humidity is very high. As described for TLS, the moisture can hamper the use of PLS because the water on the sides of the cave reduced the reflectivity of the material, and, with intensive use, it can damage the instruments. In general, these environmental conditions are unfavorable for all active sensors. Unlike the individual scans acquired with TLS, it is impossible to manually remove any errors in PLS products. This limitation increases the noise of the final point cloud generation and could also create some registration errors [67]. These critical errors cannot be easily removed even with post-processing software. As demonstrated in this work, the point clouds generated with PLS technology are significantly more noisy and less dense than those obtained with terrestrial laser scanners; several works [37,38,39] show that it would be appropriate to travel the same trajectory at least twice, the first by limiting the tilt of the instrument, to create a reference map, the second with more freedom of movement to densify the data and acquire all the information that was ignored at the first step (such as the high parts of the walls and ceilings).

4.3. SfM

The use of a photo camera is, of course, the cheapest and most straightforward approach as reported in Table 8. In chapter three, we presented the developed methodology to acquire a sequence of images in a cave that can have sufficient overlap to assure the correct use of SfM algorithms. The analysis of results obtained in the tunnel test site pointed out that the structure from motion’s accuracy can be very high and not far from the PLS. The use of an image sequence has a double advantage: it is easy to obtain and it can be adopted not only for the reconstruction of the morphology of the caves but also for the rendering of most precious elements. In the Gazzano case study, we presented two different modalities of use: (i) the acquisition of a photo sequence characterized by the minimum required overlap adopted for the reconstruction of the geometry of the cave; (ii) an ultra-detailed acquisition of a photo sequence of a particular element of the cave (the stalagmite) for the reconstruction of a solid image. These different approaches allow obtaining results with distinct characteristics and final use. The use of a photo camera has another significant added value: its high compatibility with the actual approach adopted by many speleologists for caves survey. As presented initially, the adopted method is based on the reconstruction of a sequence of measures done with a disto-clinometer that creates a polygonal. The series of points of the polygonal allows the description of the cave using a discrete approach. The main limitation of this approach is related to the use of punctual measures that cannot continuously describe the cave’s morphology. The SfM can close this gap: the points acquired by the disto-clinometer can be used as ground control points that are fundamental both for a correct reconstruction of the geometry of the cave with a photo sequence and to scale the model, because, unlike the results obtained with active sensors, the photogrammetric models are not scaled. The impact of the method is minimal. The only sign of the survey is a sequence of small dots (few millimeters) representing the polygonal nodes. That can be identified in the high-resolution images acquired by the camera.
From the point of view of the final product density, the photogrammetric point clouds are comparable with those made with TLS technology, although a bit noisier. The noise effect may be due to some inaccuracy in the images’ alignment or to the instability of passive sensors, especially those at low cost. In the case of underground caves, these problems are related to the environments’ poor lighting or the light variation, with reflective surfaces and shadows, which do not allow to identify the matching points between the images.

5. Conclusions

The establishment of new technologies, instruments, and algorithms for the execution and processing of three-dimensional surveys have expanded the possibility of performing such surveys in underground environments, like caves. The traditional approach was based on a series of reference points along the cave measured by clinometer and compass and led to a discrete representation of the cave. This method is currently improved by using laser portable range finders, which allow faster execution of measures and their storage in built-in memory or in an app. The methodology proposed and tested in the work is aimed to achieve a full three-dimensional reconstruction of the cave while assuring its accuracy in terms of positioning. To test the methodology, before the cave survey, a benchmark site was surveyed. A stretch of a tunnel was surveyed by TLS, PLS, and camera shooting. All the three-point clouds were registered to the reference targets with centimeter-level accuracy, i.e., 0.015, 0.010, and 0.012 m, respectively, allowing the following phases of the research. The tests provided that the point clouds obtained by PLS and by SfM processing of the shooting are in good agreement with the TLS one, selected as the reference data set. PLS-TLS comparison provided an average residual of 0.053 m while SfM-TLS 0.040 m. The tunnel was also selected as a test site thanks to the easy accessibility, which allowed to employ of bulky instrumentation. According to the test site result, we developed a methodology to survey natural caves adopting only a photo camera and SfM processing.
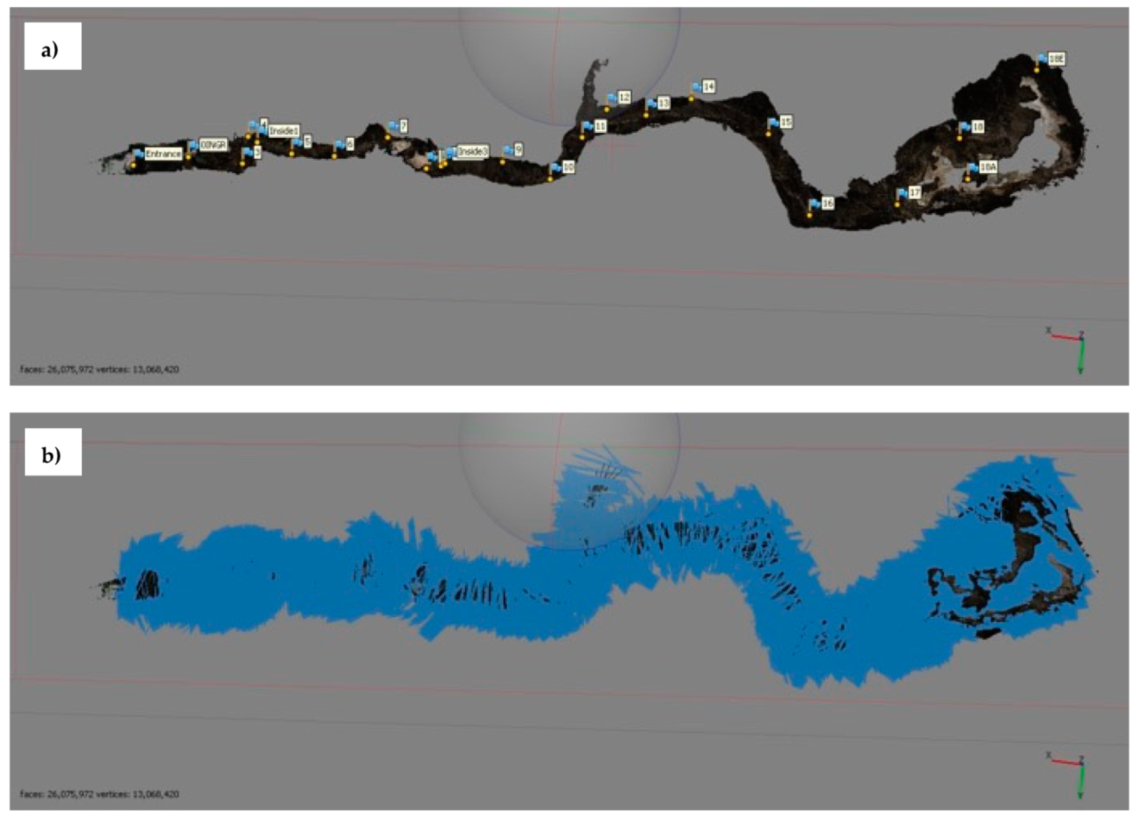
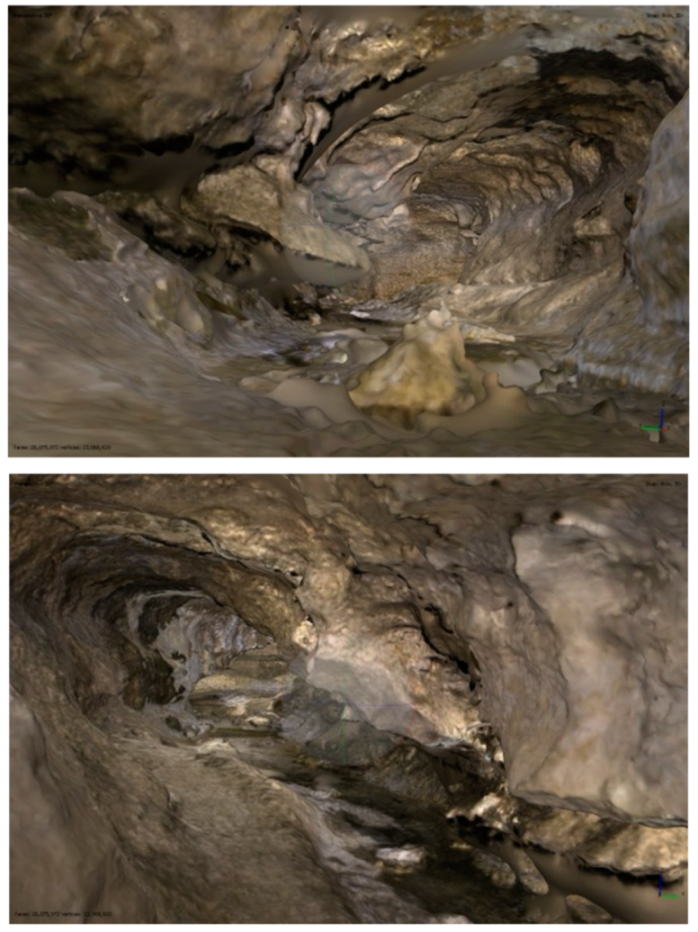
The proposed methodology is tested in the Gazzano cave, located in the Garessio municipality (Piemonte region, northwestern Italy). The cave is 105 m long, and it has several chambers, with a diameter that ranges from 37 m up to less than one meter. The cave was provided with several reference points surveyed by the cavers that were used as ground control points. According to the proposed methodology, the image acquisition was carried out in both directions from the entrance to the end of the cave and backward. The SfM processing provided the point cloud reconstructing the entire cave except for the final chamber whose ceiling was 25-m-high and images were not enough light. During the survey, a peculiar stalagmite was surveyed, too. This survey aimed to reconstruct a single object with a higher resolution if compared to the whole cave model. The reconstruction of this speleothem allowed to confirm the validity of the proposed method. The registering of the whole cave was carried out with an overall accuracy of 0.331 m; the scaling accuracy of the speleothem reached an overall accuracy of 0.0135 m.
By analyzing the benchmark and the cave survey, it was also possible to summarize the different survey methods’ pros and cons in underground contexts. Namely, SfM resulted in the most manageable and affordable, both in terms of equipment and processing software. On the contrary, PLS and, particularly, TLS are expensive and with less maneuverability. A possible solution, for cost reduction, is the use of available open-source alternatives of processing software which can, even if often lacking user-friendly interfaces, provide similar functionalities.

Author Contributions

Conceptualization, D.G. (Daniele Giordan) and M.P.; data curation, N.G.and R.Z.; investigation, D.G. (Danilo Godone), M.B., N.G.and R.Z.; methodology, D.G. (Daniele Giordan), D.G. (Danilo Godone), M.B. and R.Z.; supervision, M.P.; validation, M.B.; writing—original draft, D.G. (Daniele Giordan), D.G. (Danilo Godone) and N.G.; writing—review and editing, M.P. All authors have read and agreed to the published version of the manuscript.

Funding

This research received no external funding.

Institutional Review Board Statement

Not applicable.

Informed Consent Statement

Not applicable.

Data Availability Statement

Not applicable.

Acknowledgments

The authors thank the Speleo Club Tanaro for the logistic support.

Conflicts of Interest

The authors declare no conflict of interest.

References

  1. Mattes, J. Underground fieldwork–A cultural and social history of cave cartography and surveying instruments in the 19th and at the beginning of the 20th century. Int. J. Speleol. 2015, 44, 5. [Google Scholar] [CrossRef] [Green Version]
  2. De Waele, J.; Fabbri, S.; Santagata, T.; Chiarini, V.; Columbu, A.; Pisani, L. Geomorphological and speleogenetical observations using terrestrial laser scanning and 3D photogrammetry in a gypsum cave (Emilia Romagna, N. Italy). Geomorphology 2018, 319, 47–61. [Google Scholar] [CrossRef]
  3. Jouves, J.; Viseur, S.; Arfib, B.; Baudement, C.; Camus, H.; Collon, P.; Guglielmi, Y. Speleogenesis, geometry, and topology of caves: A quantitative study of 3D karst conduits. Geomorphology 2017, 298, 86–106. [Google Scholar] [CrossRef] [Green Version]
  4. Büyüksalih, G.; Kan, T.; Özkan, G.E.; Meriç, M.; Isın, L.; Kersten, T.P. Preserving the knowledge of the past through virtual visits: From 3D laser scanning to virtual reality visualisation at the Istanbul Çatalca İnceğiz Caves. PFG J. Photogramm. Remote Sens. Geoinf. Sci. 2020, 88, 133–146. [Google Scholar] [CrossRef]
  5. Kang, Z.; Yang, J.; Yang, Z.; Cheng, S. A review of techniques for 3d reconstruction of indoor environments. ISPRS Int. J. Geo-Inf. 2020, 9, 330. [Google Scholar] [CrossRef]
  6. Dabove, P.; Grasso, N.; Piras, M. Smartphone-Based Photogrammetry for the 3D Modeling of a Geomorphological Structure. Appl. Sci. 2019, 9, 3884. [Google Scholar] [CrossRef] [Green Version]
  7. Ballesteros, D.; Domínguez-Cuesta, M.J.; Jiménez-Sánchez, M.; González-Pumariega, P. Tape-compass-clinometer, DistoX or total station, what is the best method to elaborate a cave survey? A case study in El Pindal Cave, Spain. In Proceedings of the 8th International Conference on Geomorphology, Paris, France, 27–31 August 2013; pp. 27–31. [Google Scholar]
  8. Trimmis, K.P. Paperless mapping and cave archaeology: A review on the application of DistoX survey method in archaeological cave sites. J. Archaeol. Sci. Rep. 2018, 18, 399–407. [Google Scholar] [CrossRef]
  9. Weinmann, M. Reconstruction and Analysis of 3D Scenes; Springer International Publishing: Cham, Switzerland, 2016. [Google Scholar]
  10. Moyano, J.; Nieto-Julián, J.E.; Antón, D.; Cabrera, E.; Bienvenido-Huertas, D.; Sánchez, N. Suitability Study of Structure-from-Motion for the Digitisation of Architectural (Heritage) Spaces to Apply Divergent Photograph Collection. Symmetry 2020, 12, 1981. [Google Scholar] [CrossRef]
  11. Roşca, S.; Suomalainen, J.; Bartholomeus, H.; Herold, M. Comparing terrestrial laser scanning and unmanned aerial vehicle structure from motion to assess top of canopy structure in tropical forests. Interface Focus 2018, 8, 20170038. [Google Scholar] [CrossRef]
  12. Teza, G.; Pesci, A.; Ninfo, A. Morphological Analysis for Architectural Applications: Comparison between Laser Scanning and Structure-from-Motion Photogrammetry. J. Surv. Eng. 2016, 142, 04016004. [Google Scholar] [CrossRef]
  13. Heathfield, D.; Walker, I.J.; Grilliot, M.J. Comparison of Terrestrial Laser Scanning (TLS) and Structure from Motion (SfM) photogrammetry from unmanned aerial systems (UAS) for geomorphic change detection in beach-dune systems. In AGU Fall Meeting Abstracts; American Geophysical Union: Washington, DC, USA, 2016; Volume 2016, p. EP21D-0915. [Google Scholar]
  14. Wilkinson, M.W.; Jones, R.R.; Woods, C.E.; Gilment, S.R.; McCaffrey, K.J.W.; Kokkalas, S.; Long, J.J. A comparison of terrestrial laser scanning and structure-from-motion photogrammetry as methods for digital outcrop acquisition. Geosphere 2016, 12, 1865–1880. [Google Scholar] [CrossRef] [Green Version]
  15. Verdiani, G.; Braghiroli, A. The Ancient Fragment Collection at the Museo Archeologico in Florence, Italy, a Digital Proposal to Allow Its Acces. In Progress in Cultural Heritage Preservation; Springer: Berlin/Heidelberg, Germany, 2012; pp. 461–468. [Google Scholar]
  16. Remondino, F.; Rizzi, A. Reality-based 3D documentation of natural and cultural heritage sites—techniques, problems, and examples. Appl. Geomat. 2010, 2, 85–100. [Google Scholar] [CrossRef] [Green Version]
  17. Frohlich, C.; Mettenleiter, M. Terrestrial laser scanning—New perspectives in 3D surveying. Int. Arch. Photogramm. Remote Sens. Spat. Inf. Sci. 2004, 36, W2. Available online: http:www.zf-laser.com (accessed on 17 August 2020).
  18. Baldo, M.; Bicocchi, C.; Chiocchini, U.; Giordan, D.; Lollino, G. LIDAR monitoring of mass wasting processes: The Radicofani landslide. Geomorphology 2009, 105, 193–201. [Google Scholar] [CrossRef]
  19. Brown, K.R.; Chalmers, A.; Saigol, T.; Green, C.; D’errico, F. An automated laser scan survey of the Upper Palaeolithic rock shelter of Cap Blanc. J. Archaeol. Sci. 2001, 28, 283–289. [Google Scholar] [CrossRef]
  20. Westerman, A.R.; Pringle, J.K.; Hunter, G. Preliminary lidar survey results from Peak Cavern vestibule, Derbys, UK. Cave Karst Sci. 2003, 30, 129–130. [Google Scholar]
  21. Grussenmeyer, P.; Landes, T.; Alby, E.; Carozza, L. High resolution 3D recording and modelling of the Bronze Age cave “Les Fraux” in Périgord (France). Int. Arch. Photogramm. Remote Sens. Spat. Inf. Sci. 2010, 38, 262–267. [Google Scholar]
  22. Canavese, E.P.; Forti, P.; Naseddu, A.; Ottelli, L.; Tedeschi, R. Laser scanning technology for the hypogean survey: The case of Santa Barbara karst system (Sardinia, Italy). Acta Carsologica 2011, 40. [Google Scholar] [CrossRef]
  23. Puchol, O.G.; McClure, S.B.; Senabre, J.B.; Villa, F.C.; Porcelli, V. Increasing contextual information by merging existing archaeological data with state of the art laser scanning in the prehistoric funerary deposit of Pastora Cave, Eastern Spain. J. Archaeol. Sci. 2013, 40, 1593–1601. [Google Scholar] [CrossRef] [Green Version]
  24. Mohammed Oludare, I.; Pradhan, B. A decade of modern cave surveying with terrestrial laser scanning: A review of sensors, method and application development. Int. J. Speleol. 2016, 45, 8. [Google Scholar] [CrossRef] [Green Version]
  25. Fabbri, S.; Sauro, F.; Santagata, T.; Rossi, G.; De Waele, J. High-resolution 3-D mapping using terrestrial laser scanning as a tool for geomorphological and speleogenetical studies in caves: An example from the Lessini mountains (North Italy). Geomorphology 2017, 280, 16–29. [Google Scholar] [CrossRef]
  26. Canevese, E.P.; Tedeschi, R.; Forti, P. The caves of Naica: Laser scanning in extreme underground environments. Am. Surv. 2009, 6, 8–19. [Google Scholar]
  27. Silvestre, I.; Rodrigues, J.I.; Figueiredo, M.; Veiga-Pires, C. High-resolution digital 3D models of Algar do Penico Chamber: Limitations, challenges, and potential. Int. J. Speleol. 2015, 44, 25–35. [Google Scholar] [CrossRef] [Green Version]
  28. Genuite, K.; Perrette, Y.; Jaillet, S. Flowstone growth in Gournier River (Vercors, France): A diachronic landscape analysis by 3D modelling and photo draping. Int. J. Speleol. 2018, 47, 81–91. [Google Scholar] [CrossRef]
  29. Martin, A.; Lecocq, T.; Hinzen, K.G.; Camelbeeck, T.; Quinif, Y.; Fagel, N. Characterizing Stalagmites’ Eigenfrequencies by Combining In Situ Vibration Measurements and Finite Element Modeling Based on 3D Scans. Geosciences 2020, 10, 418. [Google Scholar] [CrossRef]
  30. Montanari, A.; Adamek, A.; Curatolo, A.; Ferretti, M.P.; Mainiero, M.; Mariani, S.; McGee, D.; Pignocchi, G.; Recanatini, S. An Epigravettian hypogeal site in the Grotta del Fiume Cave at Frasassi (northeastern Apennines, Italy): Environmental and geochronologic assessments. Int. J. Speleol. 2020, 49, 2. [Google Scholar] [CrossRef]
  31. Gallay, M.; Kaňuk, J.; Hochmuth, Z.; Meneely, J.D.; Hofierka, J.; Sedlák, V. Large-scale and high-resolution 3-D cave mapping by terrestrial laser scanning: A case study of the Domica Cave, Slovakia. Int. J. Speleol. 2015, 44, 6. [Google Scholar] [CrossRef] [Green Version]
  32. Keller, F.; Sternberg, H. Multi-sensor platform for indoor mobile mapping: System calibration and using a total station for indoor applications. Remote Sens. 2013, 5, 5805–5824. [Google Scholar] [CrossRef] [Green Version]
  33. Nocerino, E.; Menna, F.; Remondino, F.; Toschi, I.; Rodríguez-Gonzálvez, P. Investigation of indoor and outdoor performance of two portable mobile mapping systems. In Videometrics, Range Imaging, and Applications XIV; International Society for Optics and Photonics: Washington, DC, USA, 2017; Volume 10332. [Google Scholar] [CrossRef]
  34. Lagüela, S.; Dorado, I.; Gesto, M.; Arias, P.; González-Aguilera, D.; Lorenzo, H. Behavior Analysis of Novel Wearable Indoor Mapping System Based on 3D-SLAM. Sensors 2018, 18, 766. [Google Scholar] [CrossRef] [PubMed] [Green Version]
  35. Dissanayake, M.G.; Newman, P.; Clark, S.; Durrant-Whyte, H.F.; Csorba, M. A solution to the simultaneous localization and map building (SLAM) problem. IEEE Trans. Robot. Autom. 2001, 17, 229–241. [Google Scholar] [CrossRef] [Green Version]
  36. Nüchter, A.; Lingemann, K.; Hertzberg, J.; Surmann, H. 6D SLAM—3D mapping outdoor environments. J. Field Robot. 2007, 24, 699–722. [Google Scholar] [CrossRef] [Green Version]
  37. Tucci, G.; Visintini, D.; Bonora, V.; Parisi, E.I. Examination of indoor mobile mapping systems in a diversified internal/external test field. Appl. Sci. 2018, 8, 401. [Google Scholar] [CrossRef] [Green Version]
  38. Lehtola, V.V.; Kaartinen, H.; Nüchter, A.; Kaijaluoto, R.; Kukko, A.; Litkey, P.; Honkavaara, E.; Rosnell, T.; Vaaja, M.T.; Virtanen, J.-P.; et al. Comparison of the selected state-of-the-art 3D indoor scanning and point cloud generation methods. Remote Sens. 2017, 9, 796. [Google Scholar] [CrossRef] [Green Version]
  39. Bronzino, G.P.C.; Grasso, N.; Matrone, F.; Osello, A.; Piras, M. Laser-visual-inertial odometry based solution for 3D heritage modeling: The Sanctuary of the Blessed Virgin of Trompone. International Archives of the Photogrammetry. Remote Sens. Spat. Inf. Sci. 2019. [Google Scholar] [CrossRef] [Green Version]
  40. Mandelli, A.; Fassi, F.; Perfetti, L.; Polari, C. Testing different survey techniques to model architectonic narrow spaces. ISPRS Int. Arch. Photogramm. Remote Sens. Spat. Inf. Sci. 2017, 42, 505–511. [Google Scholar] [CrossRef] [Green Version]
  41. Di Pietra, V.; Grasso, N.; Piras, M.; Dabove, P. Characterization of a Mobile Mapping System for Seamless Navigation. Int. Arch. Photogramm. Remote Sens. Spat. Inf. Sci. 2020, 43, 227–234. [Google Scholar] [CrossRef]
  42. Zlot, R.; Bosse, M. Three-dimensional mobile mapping of caves. J. Cave Karst Stud. 2014, 76, 191–206. [Google Scholar] [CrossRef]
  43. Nocerino, E.; Menna, F.; Farella, E.; Remondino, F. 3D virtualization of an underground semi-submerged cave system. Int. Arch. Photogramm. Remote Sens. Spat. Inf. Sci. ISPRS Arch. 2019, 42, 857–864. [Google Scholar] [CrossRef] [Green Version]
  44. Kraus, K. Photogrammetry. In Advanced Methods and Applications; Dummler: Bonn, Germany, 1997; Volume 2. [Google Scholar]
  45. Ullman, S. The interpretation of structure from motion. Proc. R. Soc. Lond. Ser. B Biol. Sci. 1979, 203, 405–426. [Google Scholar]
  46. Szeliski, R. Computer Vision: Algorithms and Applications; Springer Science & Business Media: Berlin, Germany, 2010. [Google Scholar]
  47. Giordan, D.; Adams, M.S.; Aicardi, I.; Alicandro, M.; Allasia, P.; Baldo, M.; de Berardinis, P.; Dominici, D.; Godone, D.; Hobbs, P.; et al. The use of Unmanned Aerial Vehicles (UAV) for engineering geology applications. Bull. Eng. Geol. Environ. 2020, 79, 3437–3481. [Google Scholar] [CrossRef] [Green Version]
  48. Westoby, M.J.; Brasington, J.; Glasser, N.F.; Hambrey, M.J.; Reynolds, J.M. “Structure-from-Motion” photogrammetry: A low-cost, effective tool for geoscience applications. Geomorphology 2012, 179, 300–314. [Google Scholar] [CrossRef] [Green Version]
  49. Godone, D.; Allasia, P.; Borrelli, L.; Gullà, G. UAV and Structure from Motion Approach to Monitor the Maierato Landslide Evolution. Remote Sens. 2020, 12, 1039. [Google Scholar] [CrossRef] [Green Version]
  50. Menegoni, N.; Giordan, D.; Perotti, C.; Tannant, D. Detection and geometric characterization of rock mass discontinuities using a 3D high-resolution digital outcrop model generated from RPAS imagery—Ormea rock slope, Italy. Eng. Geol. 2019, 252, 145–163. [Google Scholar] [CrossRef]
  51. Chiabrando, F.; Di Pietra, V.; Lingua, A.; Cho, Y.; Jeon, J. An original application of image recognition based location in complex indoor environments. ISPRS Int. J. Geo-Inf. 2017, 6, 56. [Google Scholar] [CrossRef] [Green Version]
  52. Remondino, F.; Barazzetti, L.; Nex, F.; Scaioni, M.; Sarazzi, D. UAV photogrammetry for mapping and 3d modeling—Current status and future perspectives. In Proceedings of the International Archives of the Photogrammetry, Remote Sensing and Spatial Information Sciences, Zurich, Switzerland, 14–16 September 2011; Volume XXXVIII-1/C22, pp. 25–31. [Google Scholar] [CrossRef] [Green Version]
  53. Giordan, D.; Hayakawa, Y.; Nex, F.; Remondino, F.; Tarolli, P. Review article: The use of remotely piloted aircraft systems (RPASs) for natural hazards monitoring and management. Nat. Hazards Earth Syst. Sci. 2018, 18, 1079–1096. [Google Scholar] [CrossRef] [Green Version]
  54. Yan, J.; Grasso, N.; Zlatanova, S.; Braggaar, R.C.; Marx, D.B. Challenges in flying quadrotor unmanned aerial vehicle for 3d indoor reconstruction. In Proceedings of the International Archives of the Photogrammetry, Remote Sensing and Spatial Information Sciences, Wuhan, China, 18–22 September 2017; Volume XLII-2/W7, pp. 423–430. [Google Scholar]
  55. Caroti, G.; Piemonte, A.; Zaragoza, I.M.E.; Brambilla, G. Indoor photogrammetry using UAVs with protective structures: Issues and precision tests. In Proceedings of the International Archives of the Photogrammetry, Remote Sensing and Spatial Information Sciences, Istanbul, Turkey, 18–21 March 2018; Volume XLII-3/W4. [Google Scholar] [CrossRef] [Green Version]
  56. Turner, R.M.; MacLaughlin, M.M.; Iverson, S.R. Identifying and mapping potentially adverse discontinuities in underground excavations using thermal and multispectral UAV imagery. Eng. Geol. 2020, 266, 105470. [Google Scholar] [CrossRef]
  57. Pukanská, K.; Bartoš, K.; Bella, P.; Gašinec, J.; Blistan, P.; Kovanič, Ľ. Surveying and high-resolution topography of the ochtiná aragonite cave based on tls and digital photogrammetry. Appl. Sci. 2020, 10, 4633. [Google Scholar] [CrossRef]
  58. Neumann, K.J. Trends for digital aerial mapping cameras. Int. Arch. Photogram. Rem. Sens. Spatial Inf. Sci. (ISPRS) 2008, 28, 551–554. [Google Scholar]
  59. Konsolaki, A.; Vassilakis, E.; Gouliotis, L.; Kontostavlos, G.; Giannopoulos, V. High resolution digital 3D modelling of subsurface morphological structures of Koutouki Cave, Greece. AC 2020, 49. Available online: https://ojs.zrc-sazu.si/carsologica/article/view/7708 (accessed on 24 March 2021).
  60. Landeschi, G.; Apel, J.; Lundström, V.; Storå, J.; Lindgren, S.; Dell’Unto, N. Re-enacting the sequence: Combined digital methods to study a prehistoric cave. Archaeol. Anthropol. Sci. 2019, 11, 2805–2819. [Google Scholar] [CrossRef] [Green Version]
  61. Cignetti, M.; Godone, D.; Wrzesniak, A.; Giordan, D. Structure from Motion Multisource Application for Landslide Characterization and Monitoring: The Champlas du Col Case Study, Sestriere, North-Western Italy. Sensors 2019, 19, 2364. [Google Scholar] [CrossRef] [PubMed] [Green Version]
  62. Menegoni, N.; Giordan, D.; Perotti, C. Reliability and Uncertainties of the Analysis of an Unstable Rock Slope Performed on RPAS Digital Outcrop Models: The Case of the Gallivaggio Landslide (Western Alps, Italy). Remote Sens. 2020, 12, 1635. [Google Scholar] [CrossRef]
  63. Perrotti, M.; Godone, D.; Allasia, P.; Baldo, M.; Fazio, N.L.; Lollino, P. Investigating the susceptibility to failure of a rock cliff by integrating Structure-from-Motion analysis and 3D geomechanical modelling. Remote Sens. 2020, 12, 3994. [Google Scholar] [CrossRef]
  64. Hartley, R.; Zisserman, A. Multiple View Geometry in Computer Vision; Cambridge University Press: Cambridge, UK, 2003. [Google Scholar]
  65. Zhang, J.; Grabe, V.; Hamner, B.; Duggins, D.; Singh, S. Compact, real-time localization without reliance on infrastructure. In Proceedings of the 3rd Annual Microsoft Indoor Localization Competition, Vienna, Austria, 10–11 April 2016. [Google Scholar]
  66. Zhang, J.; Singh, S. Laser–visual–inertial odometry and mapping with high robustness and low drift. J. Field Robot. 2018, 35, 1242–1264. [Google Scholar] [CrossRef]
  67. Muralikrishnan, B. Performance evaluation of terrestrial laser scanners–A review. Meas. Sci. Technol. 2021, 32, 072001. [Google Scholar] [CrossRef]
  68. Williams, B.; Cummins, M.; Neira, J.; Newman, P.; Reid, I.; Tardós, J. A comparison of loop closing techniques in monocular SLAM. Robot. Auton. Syst. 2009, 57, 1188–1197. [Google Scholar] [CrossRef] [Green Version]
  69. Debeunne, C.; Vivet, D. A review of visual-LiDAR fusion based simultaneous localization and mapping. Sensors 2020, 20, 2068. [Google Scholar] [CrossRef] [PubMed] [Green Version]
Figure 1. Example of a cave survey based on the laser range finder approach; the post-processing software adopted by cavers can be used for a coarse 3D reconstruction of the cave. The model presents the Gazzano cave that is the case study that is described and discussed in this manuscript.
Applsci 11 06482 g001
Figure 2. (a) Gazzano cave cross-section from the traditional survey; (b) map of the cave with the polygonal survey; inset) Gazzano location map.
Applsci 11 06482 g002
Figure 3. Workflow of the proposed methodology.
Applsci 11 06482 g003
Figure 4. Scheme of the cave survey.
Applsci 11 06482 g004
Figure 5. Start section, measurements (orange: TLS cloud; black: PLS cloud).
Applsci 11 06482 g005
Figure 6. Center section measurements (red: TLS cloud; black: SfM cloud).
Applsci 11 06482 g006
Figure 7. 3D model of the cave with the locations of control points (a) and camera shots (b).
Applsci 11 06482 g007
Figure 8. Cave 3D model interior pictures.
Applsci 11 06482 g008
Figure 9. (a) photo of the stalagmite; (b) scheme of the high-resolution survey; (c) stalagmite 3D model.
Applsci 11 06482 g009
Table 1. Adopted instrumentation for the acquisition of the 3D model of the test site.
TLSPLSPhoto Camera (SfM)
RIEGL LMS-Z420iKaarta Stencil 2–16Canon EOS 100D camera
Applsci 11 06482 i001 Applsci 11 06482 i002 Applsci 11 06482 i003
Table 2. TLS scans precision.
ScanpositionTie PointsRMS 3D [m]Distance [m]
180.007-
260.01619.36
380.01117.33
440.01023.68
560.03614.90
680.00723.84
Table 3. PLS co-registering errors.
RMSE X (m)RMSE Y (m)RMSE Z (m)
0.01950.00630.0031
Table 4. SfM co-registering errors.
TargetsRMSE X (m)RMSE Y (m)RMSE Z (m)RMSE XY (m)Total RMSE (m)
120.0090.0120.0110.0150.019
Table 5. PLS/TLS comparison results.
Section\SubcloudΔA [m]ΔB [m]ΔC [m]
Start0.020.040.10
Center0.030.060.01
End0.040.100.08
Table 6. SfM/TLS comparison results.
ΔA [m]ΔB [m]
Start0.070.05
Center0.010.05
End0.020.04
Table 7. SfM co-registering errors.
TargetsRMSE X (m)RMSE Y (m)RMSE Z (m)RMSE XY (m)Total RMSE (m)
200.1650.1470.2460.2210.331
Table 8. Characteristics of the analyzed instrumentations and peculiarities of the employed techniques.
Cost (Instrumentation)Cost (Software)WeightManageability
TLSFrom ~30 k € to ~150 k €From ~3000 € to ~8000 € for annual licenses (1)From ~5 kg to ~13 kgLow
PLSFrom ~30 k € to ~60 k €
(comprehensive of multiple sensors, i.e., LiDAR + MU + DMI + Camera)
Embedded software providing real-time solutionsFrom ~800 g to ~13 kg (e.g., backpack solutions)Medium
SfMFrom less than 100€ (e.g., webcams) to ~3000–4000 € (e.g., professional cameras)From ~2500 € to ~4000 € for annual licenses (1)From ~200 g to ~500 gHigh
Today there are free/open versions of processing software, although they cannot always guarantee the same usability (e.g., graphical interface) of commercial software.
Publisher’s Note: MDPI stays neutral with regard to jurisdictional claims in published maps and institutional affiliations.

