Article

Characterization with X-rays of a Large-Area GEMPix Detector with Optical Readout for QA in Hadron Therapy

by
Andreia Maia Oliveira
1,2,*,
Hylke B. Akkerman
3,
Saverio Braccini
2,
Albert J. J. M. van Breemen
3,
Lucia Gallego Manzano
1,4,
Natalie Heracleous
1,4,
Ilias Katsouras
3,5,
Johannes Leidner
1,
Fabrizio Murtas
1,6,
Bart Peeters
3 and
Marco Silari
1
1
CERN, 1211 Geneva, Switzerland
2
Albert Einstein Center for Fundamental Physics (AEC), Laboratory for High Energy Physics (LHEP), University of Bern, Sidlerstrasse 5, 3012 Bern, Switzerland
3
Holst Centre/TNO, High Tech Campus 31, 5656 AE Eindhoven, The Netherlands
4
Institute of Radiation Physics, Lausanne University Hospital and Lausanne University, 1007 Lausanne, Switzerland
5
ASML Netherlands B.V., 5504 DR Veldhoven, The Netherlands
6
INFN-LNF, 00044 Frascati, Italy
*
Author to whom correspondence should be addressed.
Appl. Sci. 2021, 11(14), 6459; https://doi.org/10.3390/app11146459
Submission received: 10 June 2021 / Revised: 9 July 2021 / Accepted: 9 July 2021 / Published: 13 July 2021
(This article belongs to the Special Issue Detectors for Medical Physics)

Abstract

:

Featured Application

An optical readout GEM-based detector based on a matrix of organic photodiodes with an active area of 60 × 80 mm2, called the LaGEMPix, was assembled and characterized, using low energy X-rays as a preliminary step toward the development of a 200 × 200 mm2 detector for use in Quality Assurance in hadron therapy.

Abstract

Quality Assurance (QA) in hadron therapy is crucial to ensure safe and accurate dose delivery to patients. This can be achieved with fast, reliable and high-resolution detectors. In this paper, we present a novel solution that combines a triple Gas Electron Multiplier (GEM) and a highly pixelated readout based on a matrix of organic photodiodes fabricated on top of an oxide-based thin-film transistor backplane. The first LaGEMPix prototype with an active area of 60 × 80 mm2 was developed and characterized using low energy X-rays. The detector comprises a drift gap of 3.5 mm, a triple-GEM stack for electron amplification, and a readout featuring 480 × 640 pixels at a 126 µm pitch. Here, we describe the measurements and results in terms of spatial resolution for various experimental configurations. A comparison with GAFCHROMIC® films and the GEMPix detector used in the charge readout mode was performed to better understand the contribution to the spatial resolution from both the electron diffusion and the isotropic emission of photons. The measurements were compared to Monte Carlo simulations, using the FLUKA code. The simulation predictions are in good agreement with the GEMPix results. Future plans with respect to applications in hadron therapy are discussed.

1. Introduction

Hadron therapy is an advanced radiation therapy modality for treating cancer, which currently uses protons and carbon ions. As of January 2021, 103 particle therapy facilities are in operation worldwide and more than 30 centers are under construction [1]. Hadrons have the unique feature of increasing energy deposition with penetration depth, with a maximum at the end of their range followed by a sharp decrease (Bragg peak). Thus, hadron therapy offers considerable improvements to conventional radiation therapy treatments by allowing better conformity of the dose to the tumor [2], but also requires very accurate dose planning. A precise verification of the dose delivered to the patient is, therefore, mandatory and has to be guaranteed by appropriate quality assurance (QA) procedures with high spatial resolution.
A proper set of detectors for measuring the beam parameters, in particular, the beam position and the delivered dose, is fundamental to achieve an efficient QA protocol [3]. Nowadays, there is still room for improvement toward a robust and complete solution providing accurate and real-time measurements with high spatial resolution and a uniform response to the beam energy.
The LaGEMPix detector, which is the subject of this paper, is a promising tool for more efficient QA procedures with high spatial resolution. It consists of a triple-GEM (Gas Electron Multiplier) [4] coupled to a highly pixelated readout based on a matrix of organic photodiodes (OPDs). The potential of a triple-GEM detector combined with high pixel granularity for QA in hadron therapy was initially demonstrated with the GEMPix [5,6]. The GEMPix has shown very promising results but its application is limited by the relatively small active area of 28 × 28 mm2. In hadron therapy, typical sensitive areas of 200 × 200 mm2 are required to cover the maximum clinical field size [7,8]. The new readout, based on the detection of the scintillation photons generated in the GEM holes, allows for the development of a compact detector to perform imaging at larger areas, further scalable with an expected high spatial resolution.
In this paper, we report on the development of the first LaGEMPix prototype with an active area of 60 × 80 mm2, which is six times larger than that of the GEMPix. The detector and the experimental set-up are described in Section 2. The results obtained using an X-ray irradiator are reported in Section 3 and discussed in Section 4. Finally, Section 5 draws the conclusions and outlines the next steps of the project.

2. Materials and Methods

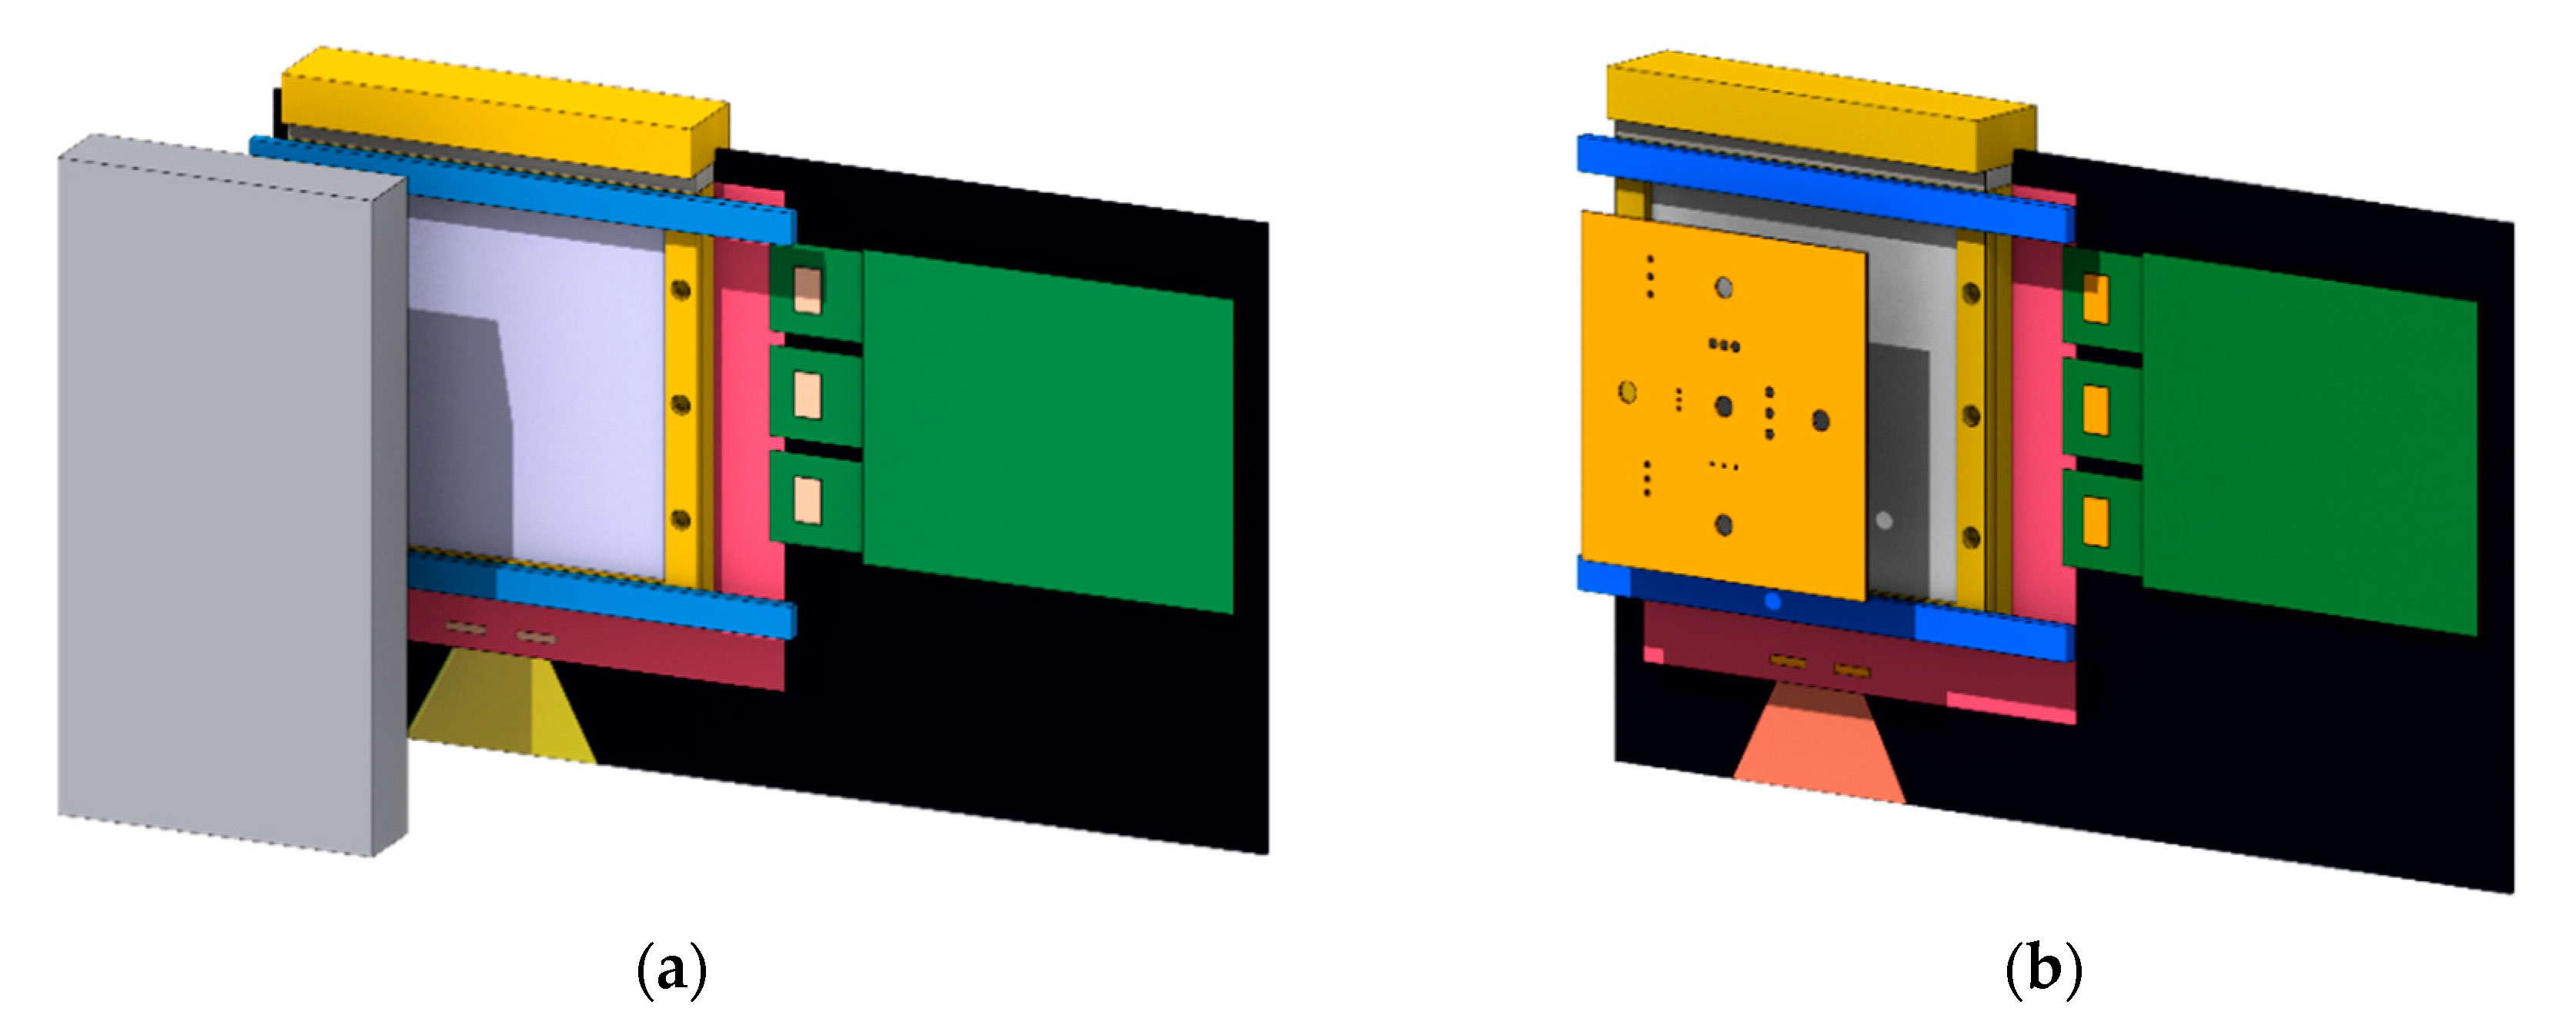
2.1. Detector Design

The current prototype of the LaGEMPix combines a triple-GEM detector with an area of 100 × 100 mm2, and an optical readout by means of a thin-film imager composed of a thin-film transistor (TFT) backplane, an OPD frontplane, and a transparent thin-film encapsulation [9], the latter serving as protection against ambient conditions. The imager consists of a matrix of 480 × 640 pixels at a resolution of 200 ppi. A schematic diagram of the LaGEMPix is depicted in Figure 1.
The triple-GEM detector includes a 3.5 mm drift gap between the top GEM electrode (GEM1) and the cathode, which is a 15 μm thick Mylar window. The drift gap is large enough to minimize inefficiencies in charged particle detection [10] but not large enough to affect the time performance. The transfer gaps between GEM1 and the second GEM foil (GEM2) and between GEM2 and the last GEM foil (GEM3) have a thickness of 1 and 2 mm, respectively. This asymmetrical configuration does not compromise the temporal performance of the detector thanks to a first transfer gap of 1 mm, while reducing the probability of discharge by increasing the second transfer gap by 1 mm [10]. Each GEM foil consists of a 50 μm Kapton layer electroplated with a 5 μm thick copper layer on both sides and pierced with holes of 70 μm diameter and 140 μm pitch. An ITO transparent electrode, coated on a 1.1 mm-thick fused quartz substrate with a resistivity of 100 Ω/sq, is used both as an anode and as an optical window [11,12]. The last gas region between GEM3 and the anode, known as the induction gap, is 1.9 mm thick.
The triple-GEM detector is operated in a continuous flow of Ar/CF4 (90/10) gas mixture supplied at a rate of 5 l/h. We chose Ar/CF4 because it has the highest light yield among the typically used gas mixtures (He/CF4, Ne/CF4, Ar/CO2, Ar-TEA (trimethylamine), Xe-TEA). The reported light yield varies between 0.1 and 0.5 photons per secondary electron [11,13,14]. The addition of CF4 gas acting as quencher allows a stable detector operation. Furthermore, it features other attractive properties, such as high electron drift velocity, low electron diffusion and fast scintillation time (of the order of a few ns) [15]. Additionally, Ar/CF4 has a strong visible emission band of around 630 nm, which is well suited for standard optical readout systems [16,17].
GEM-based detectors coupled to CCD/CMOS cameras were previously studied for particle therapy [11,18,19]. However, the degradation of the camera due to radiation requires placing it outside the beam, leading to a more complex system with, for example, mirrors or lenses. In contrast to CCD/CMOS-based detectors, in the LaGEMPix, the highly pixelated readout is adjacent to the GEM anode. This allows for a more compact, relatively easy-to-build and low material budget set-up. A first LaGEMPix prototype (Figure 2) was successfully assembled as a preliminary step toward the development of a 200 × 200 mm2 detector.
The sensor array of the LaGEMPix has a resolution of 200 pixels per inch (ppi). It comprises 480 × 640 pixels resulting in a total sensor area of 60 × 80 mm2. Each individual pixel has a photodiode with a size of 103 × 103 μm2 (actual active area of 10522 μm2) at a pixel pitch of 126 µm. The OPD frontplane is directly fabricated on top of the TFT backplane, and the organic light-absorbing layer of the OPD is deposited by slot-die coating. The TFT backplane has a self-aligned dual-gate architecture and is based on indium gallium zinc oxide (IGZO) [20]. The sensor shows a dark current density of 10−7 mA/cm2 at −2 V and a linear response in a wide range of light intensities [21].
The OPDs have a maximum external quantum efficiency (EQE) of ca. 60% at 550 nm, as shown in Figure 3. The EQE is approximately constant down to 450 nm and decreases toward longer wavelengths, reaching about 25% at 640 nm. Ar/CF4 shows a broad emission band between 500 and 800 nm with a peak at around 630 nm, which is well suited for this application [11]. In this work, we used an OPD based on a bulk heterojunction (BHJ) structure. It consists of a 280 nm thick blend of poly[N-9′-heptadecanyl-2,7-carbazole-alt-5,5-(4′,7′-di-2-thienyl-2′,1′,3′-benzothiadiazole)], PCDTBT, a p-type (donor) polymer, and [6,6]-phenyl-C61-butyric acid methyl ester, PCBM, (acceptor) fullerene [22]. The EQE of the OPD is dictated by the absorption of the heterojunction components, potentially modified by interference effects derived from the electrodes and encapsulation. The spectral response (SR) curve has a similar response to the EQE with a maximum of ca. 65% at 0.3 A/W as shown by the red curve in Figure 3. Due to the decrease in the LaGEMPix readout efficiency at larger wavelengths, the LaGEMPix readout only partially matches the visible band of the emission spectrum of Ar/CF4. Nevertheless, a sufficient signal was obtained during the measurements.

2.2. Optimization of Electric Fields

As a first step, we tested the triple-GEM detector with a 3 TBq Cs-137 source to optimize the electric fields before coupling it to the optical matrix. The optimal selection of the electric fields is important to maximize the total charge gain (defined as the ratio of the detected charges in the anode plane per incident primary charge), and consequently achieve a high signal-to-noise ratio [23]. The ratio of the number of emitted scintillation photons to the number of secondary electrons produced during the avalanche is called the light yield. As mentioned above, the Ar/CF4 (90/10) gas mixture offers a high secondary scintillation light yield of up to 0.5 photons per secondary electron. Hence, it is expected that the number of photons that reaches the photodiode layer is proportional to the induced current in the anode [24]. Based on this consideration, the electric field selection performed by maximizing the anode current is also optimal to maximize the number of detected photons.
The measurements were performed at the Calibration Laboratory of CERN Radiation Protection group [25]. The detector was placed on a support table at 0.82 cm from the source. A 6157 Keithley electrometer [26] was connected to the ITO anode to measure the induced current. The transfer, drift and induction fields were optimized to maximize the absolute value of the current at the anode. On the other hand, based on the well-known exponential dependence of the effective gain on the GEM voltages, the electric fields between the top and bottom copper layers in each GEM foil were kept constant for a total voltage of 960 V [27]. The fields were optimized one after the other by keeping all but the field under investigation constant.

2.3. Spatial Resolution

A QA procedure in hadron therapy requires not only an accurate dose calculation, but also a high spatial resolution. A high spatial resolution of the 2D dose distribution is important because most of the treatment plans in Pencil Beam Scanning (PBS) are characterized by very high “in-field” dose gradients. Distal falloff values defined as the distance between the distal position of the 80% and 20% dose levels, z80-20, at intensity-modulated proton therapy can reach 4 mm, which corresponds to a gradient of 15%/mm [28,29]. Therefore, it is critical to validate that the required dose is delivered exactly where needed to spare the healthy tissue.
The resolution of the LaGEMPix can be compared with that of commercially available 2D detectors, using the appropriate definitions applied by manufacturers and medical physicists. For example, the company PTW (PTW-Freiburg, Lörracher Strasse 7, 79115 Freiburg, Germany, Web: https://www.ptwdosimetry.com/, accessed on 21 February 2021) uses the distance between the ionization chambers to define the spatial resolution of their two-dimensional arrays [30]. On the other hand, the spatial resolution of IBA (IBA Dosimetry, Bahnhofstraße 5, 90592 Schwarzenbruck, Germany, Web: https://www.iba-dosimetry.com/, accessed on 21 February 2021) detectors is stated as the pixel size for the myQA® SRS* and Lynx, or as the pixel pitch for the Giraffe [31]. The spatial resolution of dosimetry equipment used at hadron therapy facilities is often given as the value provided by the manufacturer [32,33,34].
The pixel size or pixel pitch limit the system’s spatial resolution. Moreover, they are not the only factors that contribute to its true or effective measured value. ISO 12233:2017 raises awareness to the various connotations of the term “spatial resolution”, stating that “the term resolution is often incorrectly interpreted as the number of addressable photoelements” [35]. The spatial resolution can be defined, on the other hand, as the ability to differentiate objects that are found within a certain distance from each other. ISO 1233:2017 states that the visual resolution is the maximum value of the spatial frequency at which the individual black and white lines of a test pattern can no longer be distinguished by the human eye. This observation is also called vanishing resolution and corresponds to a modulation transfer function (MTF) of roughly 10–20% [36].
To estimate the effective spatial resolution of the LaGEMPix, we used three methods. The first method is based on the evaluation of the Edge Spread Function (ESF), which describes the response of the system to a sharp edge (discontinuity). The second method determines the Line Spread Function (LSF) of the system in one dimension. The goal is to evaluate the capability of the LaGEMPix to resolve the adjacent points. For that, two copper masks with holes separated by different distances were imaged. Finally, a lead test pattern mask was used to evaluate the MTF of the system.
A typical method consists of estimating the spatial resolution using the ESF [37]. According to the ESF method, a high-resolution system will exhibit a well-defined edge with minimum blurring. We applied this approach by measuring the projection of the straight edge of a 2.5 cm thick lead block, as explained in more detail in Section 3.2.1. Ideally, the intensity distribution should be a step-like function, where the maximum intensity corresponds to the illuminated area and zero intensity to the non-irradiated region blocked by the lead.
The typical value quoted for the edge response is the full width at half maximum (FWHM) [38,39,40]. A region of interest (ROI) perpendicular to the edge is selected. The FWHM can be obtained analytically by fitting the ESF by a logistic (Fermi) function [41] given by the following:
ESF = a + b 1 + e c ( d x )
where a is the offset, b is the contrast, c is the steepness and d is the centroid of the edge. The FWHM can be calculated from the fit parameters, using the relation FWHM = 3.53 / c [42].
The other two methods (LSF and MTF) were also applied for the characterization of imaging sensors. In this case, we used dedicated radiation-opaque plates with several absorbent structures to assess the capacity of the system under study to resolve adjacent holes or lines. In particular, the MTF measurement was acquired from a lead mask with a bar pattern [43] with groups of slits with variable separation (in line pairs (LP) per mm) using the following equation:
MTF ( f ) = C ( f ) C ( 0 ) ; C ( f ) = I m a x ( f ) I m i n ( f ) I m a x ( f ) + I m i n ( f )
where I m a x   ( f ) and I m i n   ( f ) are the maximum and minimum pixel value for a pattern with spatial frequency f respectively. C(0) is the normalization factor at zero frequency, which has to be approximated in practice by using pixel intensities of a large bar and of adjacent background. For the LSF, we used two types of copper plates of various thicknesses and hole patterns, as explained in Section 3.2.2 and Section 3.3.2. The results are discussed in Section 3.2.1, Section 3.2.2, and Section 3.2.3 for the ESF, LSF and MTF methods, respectively.

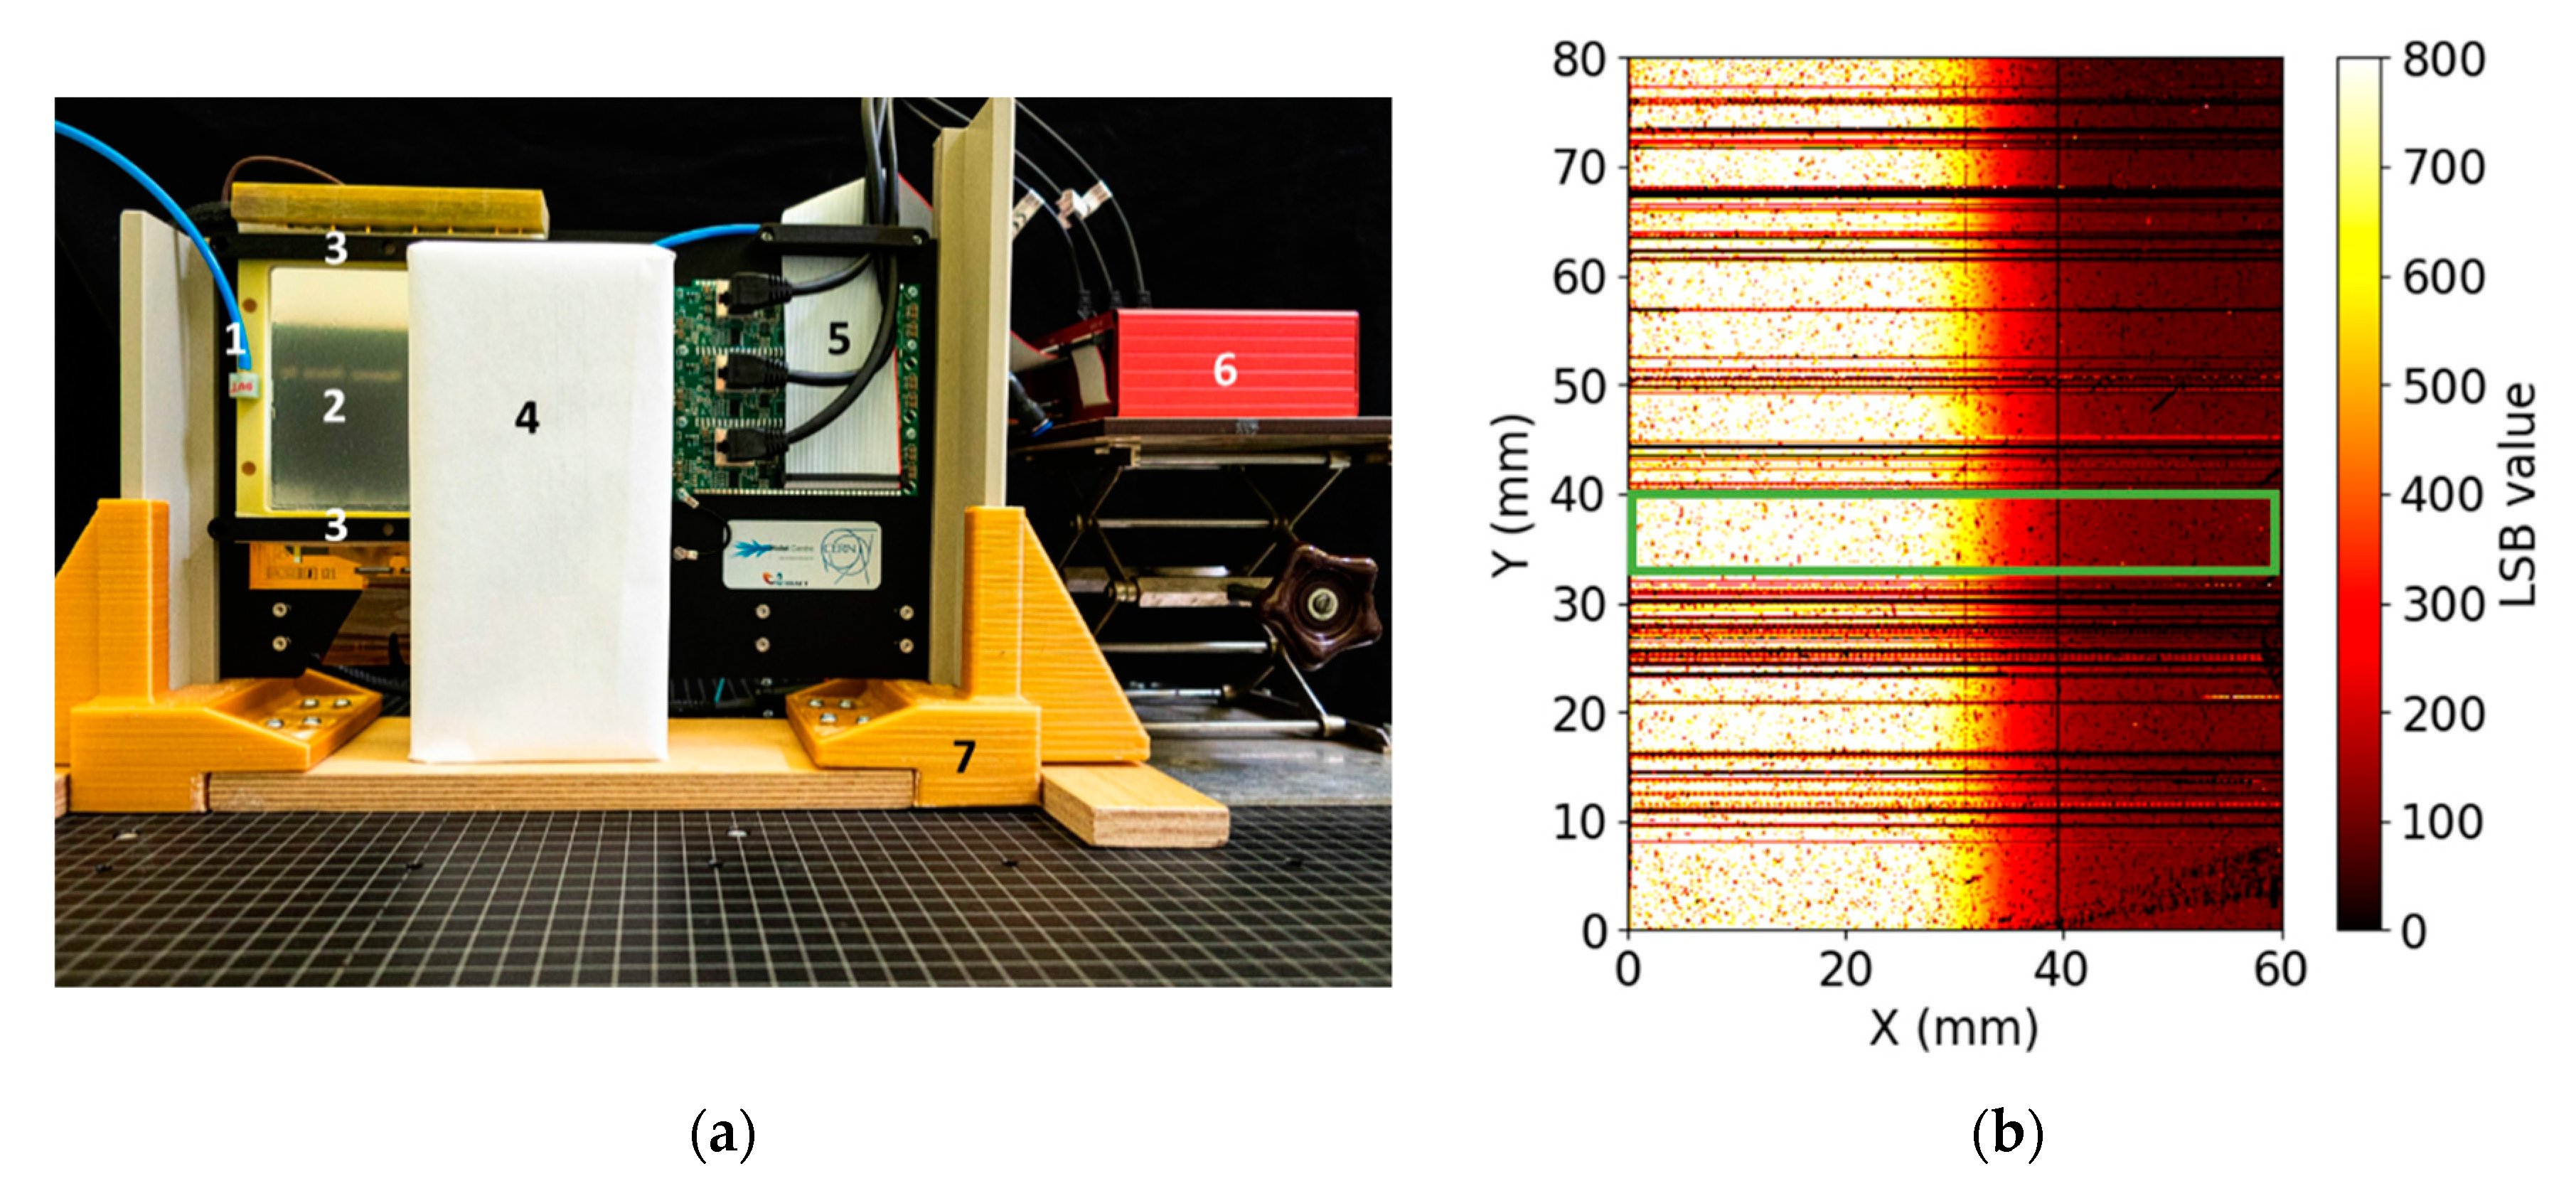
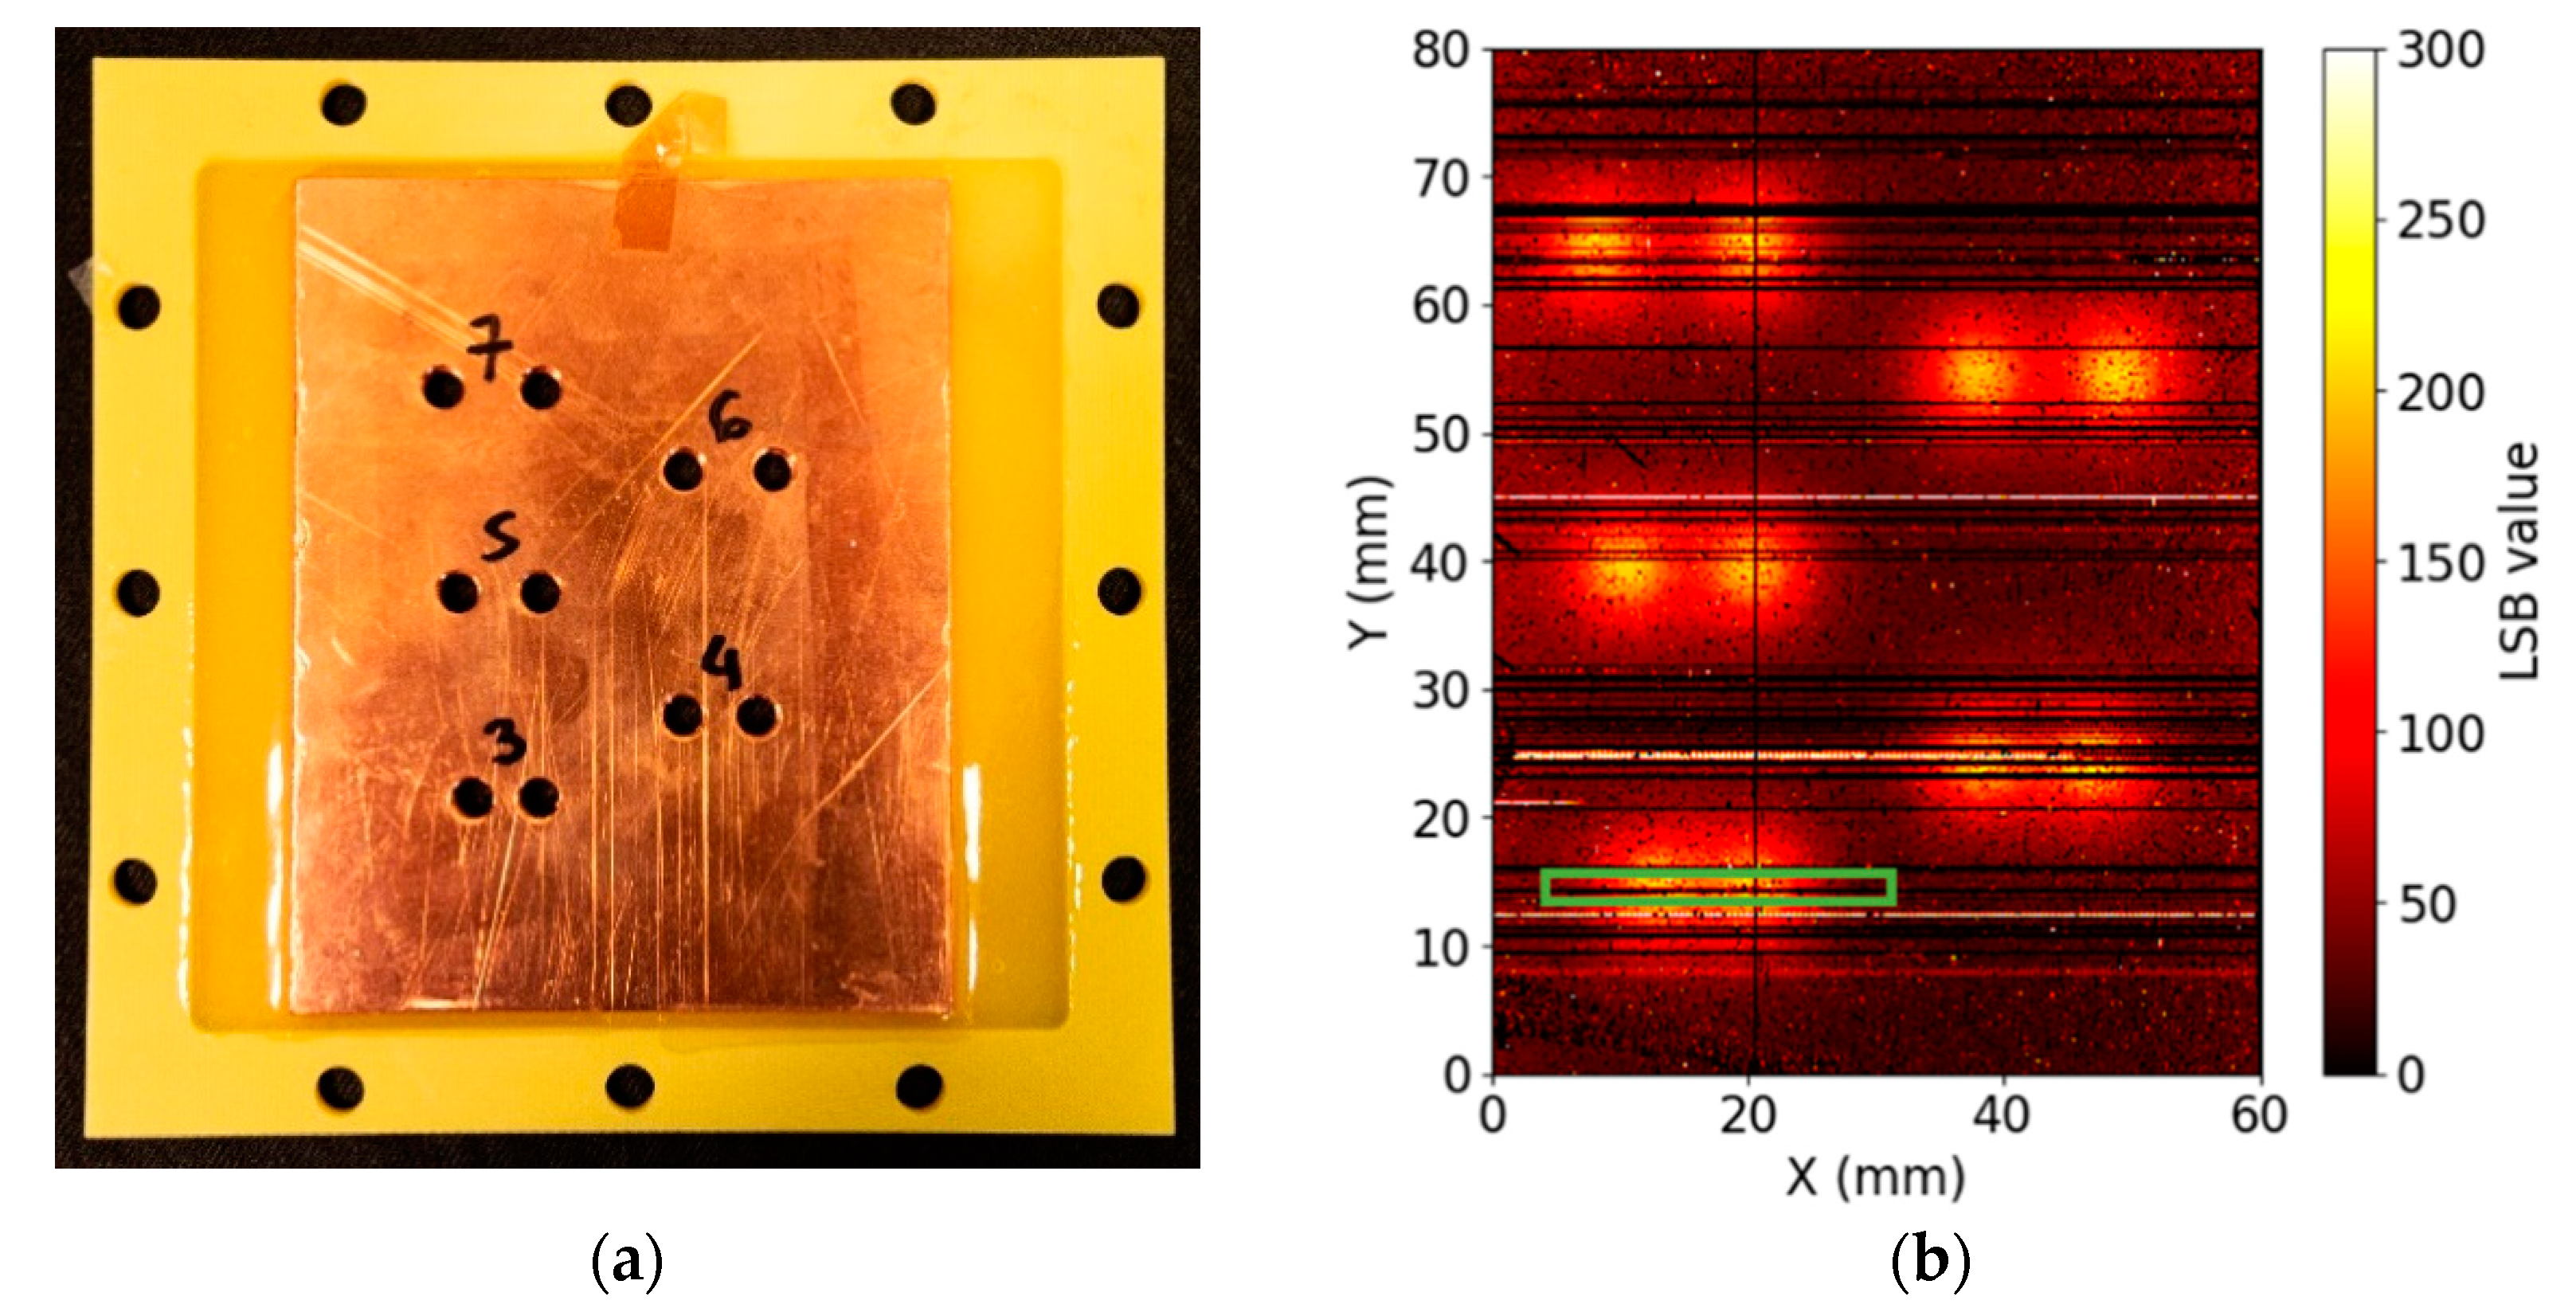
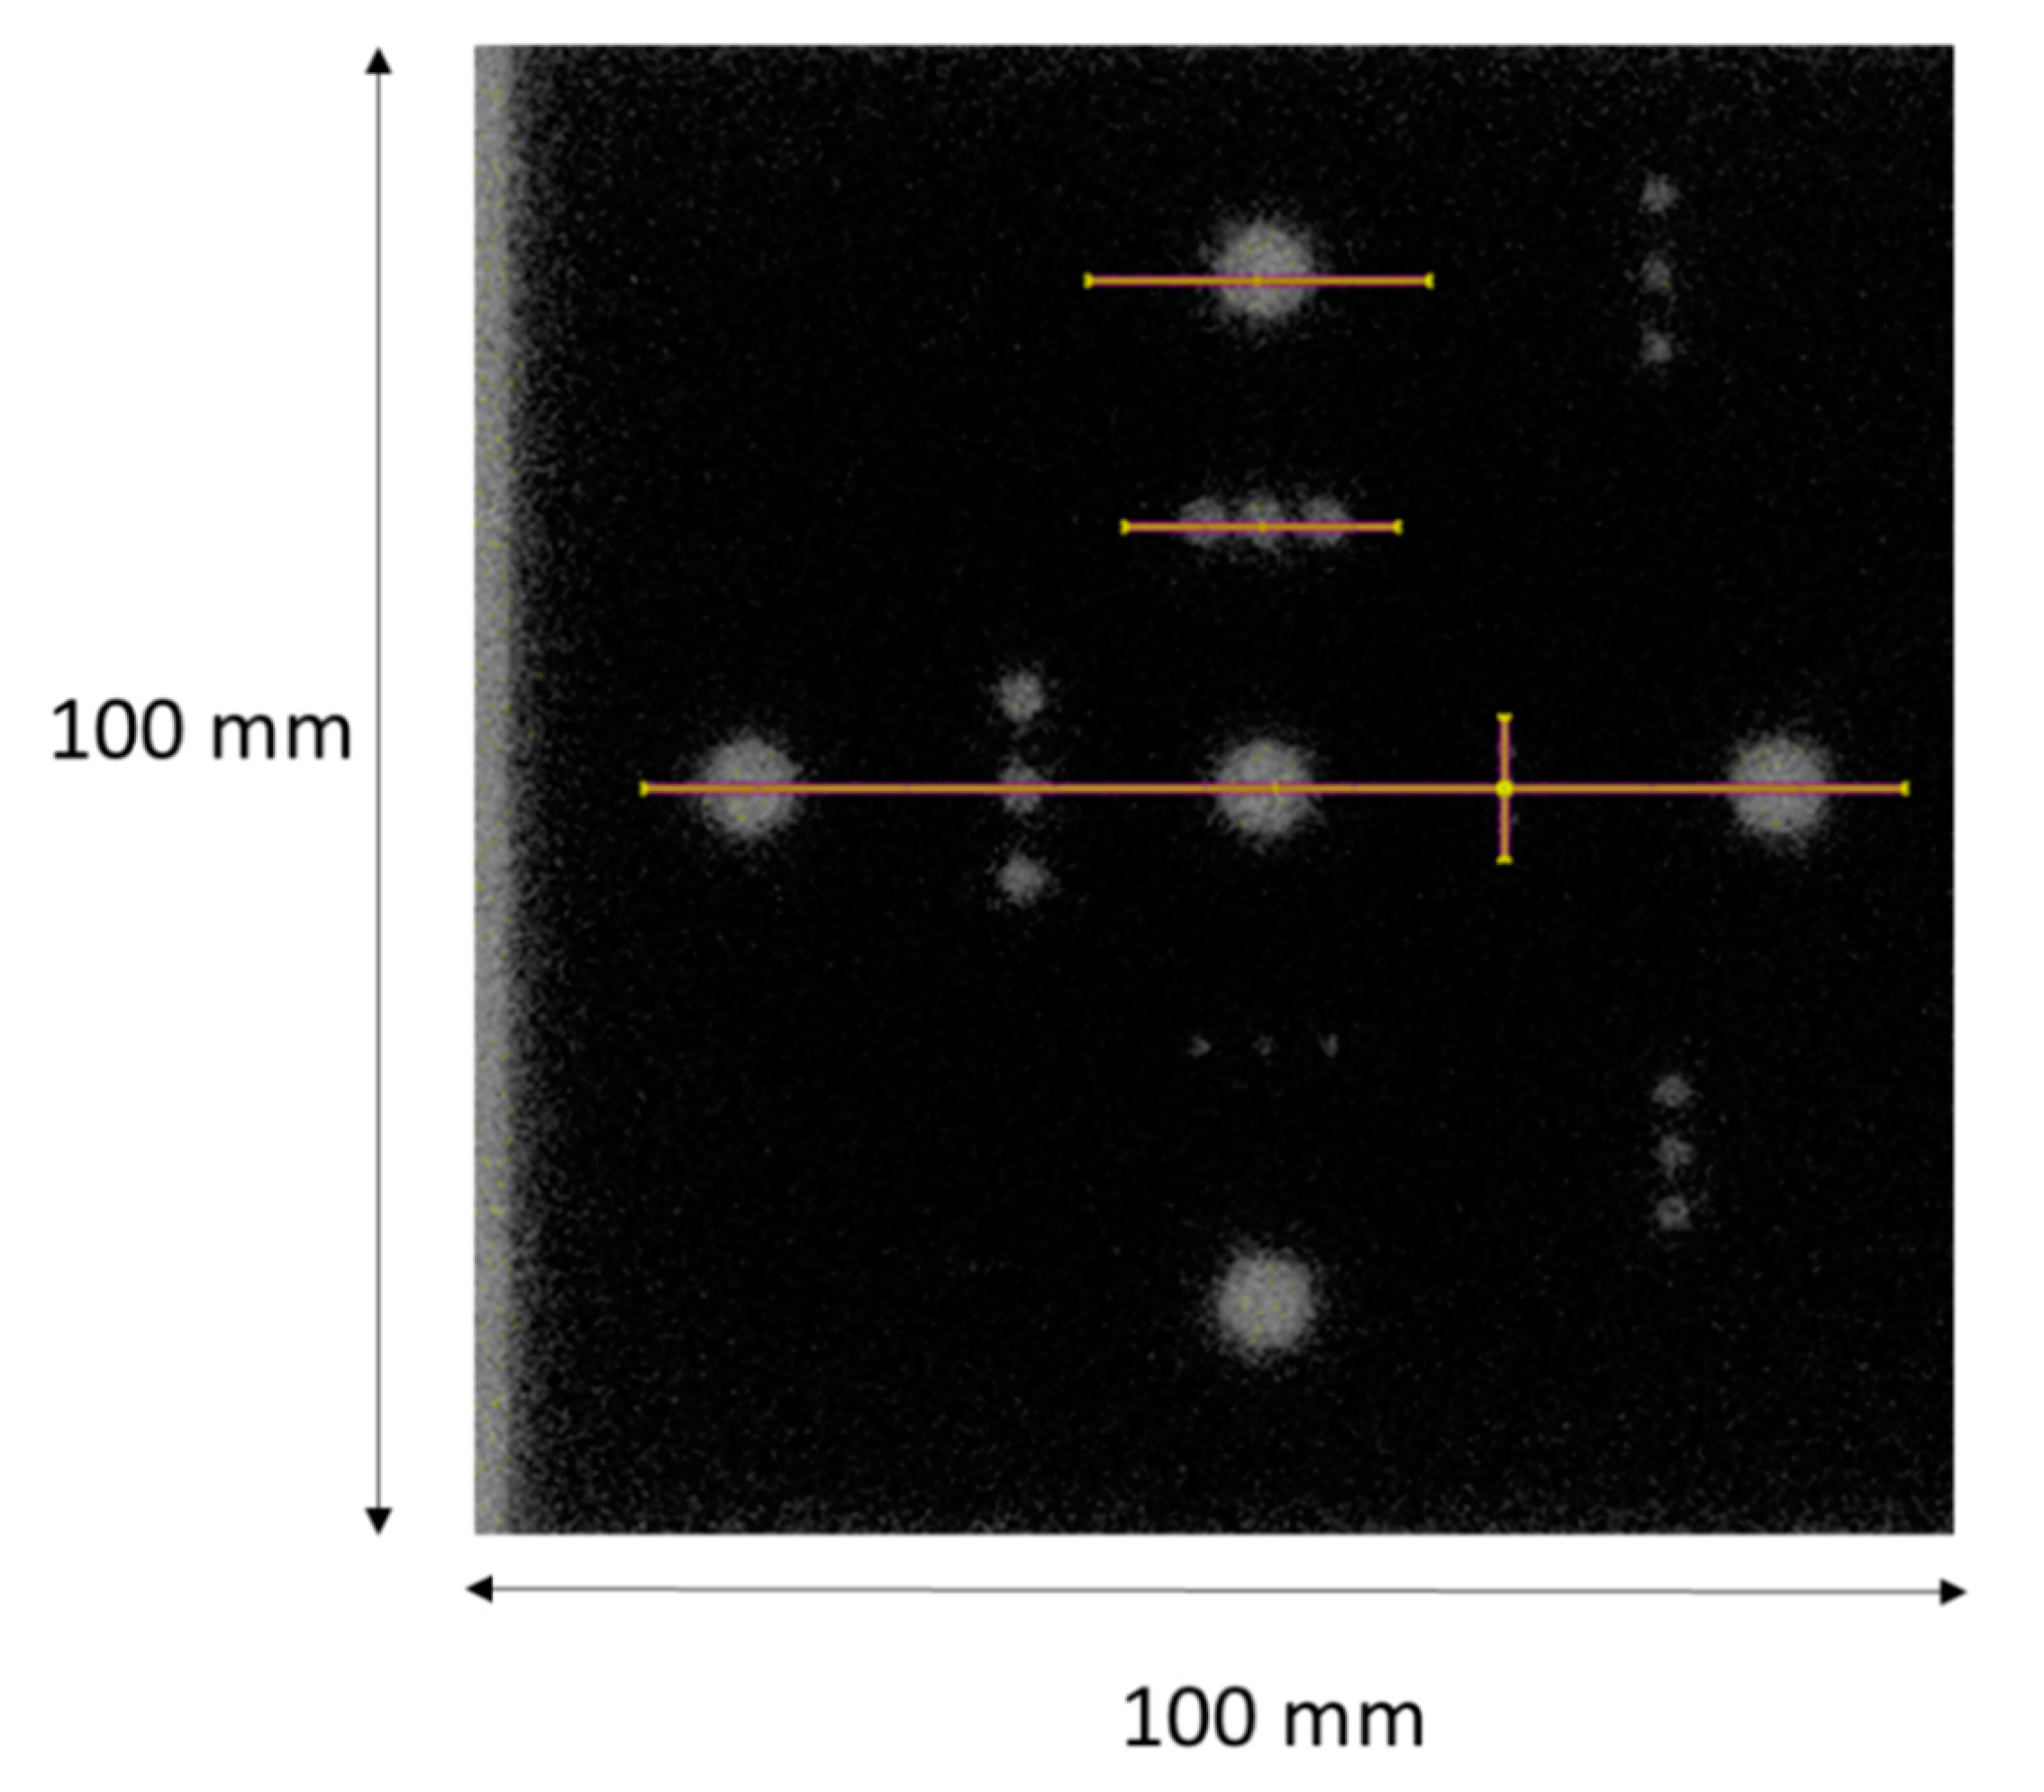
2.4. Experimental Set-Up to Determine the Spatial Resolution

The spatial resolution of the LaGEMPix was evaluated with 40 kV X-rays from an X-ray generator, type X80-320kV from Hopewell Designs, Inc. A system equipped with 10 Narrow Spectra Filters (N-series) was used in order to provide X-rays conforming to the ISO 4037 standard [44]. In particular, the Hopewell N-6 filter, corresponding to the N-40 ISO 4037, was selected.
The X-ray generator has a collimation system that consists of a wheel mounted outside the shielding enclosure to provide beam apertures with diameters of 1 cm to 7 cm. It is also equipped with an irradiation bench provided with a movable platform, which allows automated positioning and exposure control. The LaGEMPix was placed perpendicular to the X-ray beam in a vertical custom-made structure, providing a well-aligned set-up on top of the platform (see Section 3.2), and covered by a black tissue to shield it from ambient light. The assembly was positioned on the irradiation bench and Y (horizontal and perpendicular to the beam) and Z (vertical and perpendicular to the beam) positions were chosen in such a way that the center of the imager was aligned with the center of the beam. In order to obtain a nearly parallel X-ray beam, the irradiations were performed at a distance of 230 cm, using a 1 cm aperture.
The readout was set to the highest sensitivity level of 0.5 pC so that the least significant bit (LSB) of the 16-bit readout corresponded to a charge of approximately 50 electrons. The frame rate, which is the frequency at which consecutive images are recorded, was 1 frame per second (fps).
To ensure that undesirable effects, such as readout inhomogeneities or noise, did not affect the results, a threshold per pixel was applied and dead pixels were removed. A background image was obtained by averaging each pixel value over 200 background frames. Next, each image was processed offline, and the background was subtracted. The final image was obtained by averaging each pixel over 200 background-corrected images. A ROI was defined for further analysis as presented in the Results section (Section 3).

2.5. FLUKA Simulations

A simulation of the LaGEMPix was carried out using the FLUKA Monte Carlo code version 4-0.1 [45,46,47] with the default settings PRECISIO. The goal of the simulation was to study the energy deposition in the active area of the detector, and to evaluate its spatial resolution using the ESF and LSF methods. Transport and production energy cuts for electrons, positrons and photons were set to 1 keV in all regions. To overcome most of the limitations arising from low energy primary photons and enhance the transport precision for the energy deposition in the very thin layers of both gaseous and heavy materials present in the LaGEMPix geometry, the single-scattering algorithm was activated everywhere for all charged particles by adding the MULSOPT card.
The simulation comprises a realistic implementation of the detector geometry, which includes the triple-GEM stack, the image sensor and peripheral electronics, as shown in Section 3.5. Due to the lack of information on the X-ray tube head, we implemented a user-defined source routine, using the reference radiation fields for the ISO N-40 for the simulation of the spectral distribution of the X-ray beam. Other contributions due to scattered photons in the target or in any surrounding material that are inherently present in the beam were not simulated, due to the lack of information.
It should be noted that the simulation did not intend to reproduce the experimental results, but rather help in evaluating the contributions to the spatial resolution associated with the detector and the experimental conditions. Therefore, neither the electron diffusion in the gas volume nor the electron recombination with positive ions, impurity absorption, electron amplification in the GEM holes and scintillation light emission were taken into consideration. Nonetheless, as explained in Section 2.1, the number of photons detected by the LaGEMPix matrix of OPDs is proportional to the number of secondary electrons produced in the GEMs, which is in turn proportional to the energy deposited in the gas during the primary ionization process. Therefore, we can assume that the energy deposited by the X-ray photons in the gas volume of the detector is a rough approximation of the image produced by the scintillation photons detected by the image sensor. To account for the contribution of primary ionizations in the different gas regions and the effective gain per GEM foil to the image, we used the image obtained as the average deposited energy in the drift and transfer gas layers weighted by the corresponding effective gains. Interactions in the induction gap will not generate secondary scintillation photons and therefore, will not contribute to the final image. A FLUKA USRBIN scoring was superimposed in the entire detector volume. The statistical uncertainties were estimated by calculating the standard deviation of the results from independent runs.

3. Results

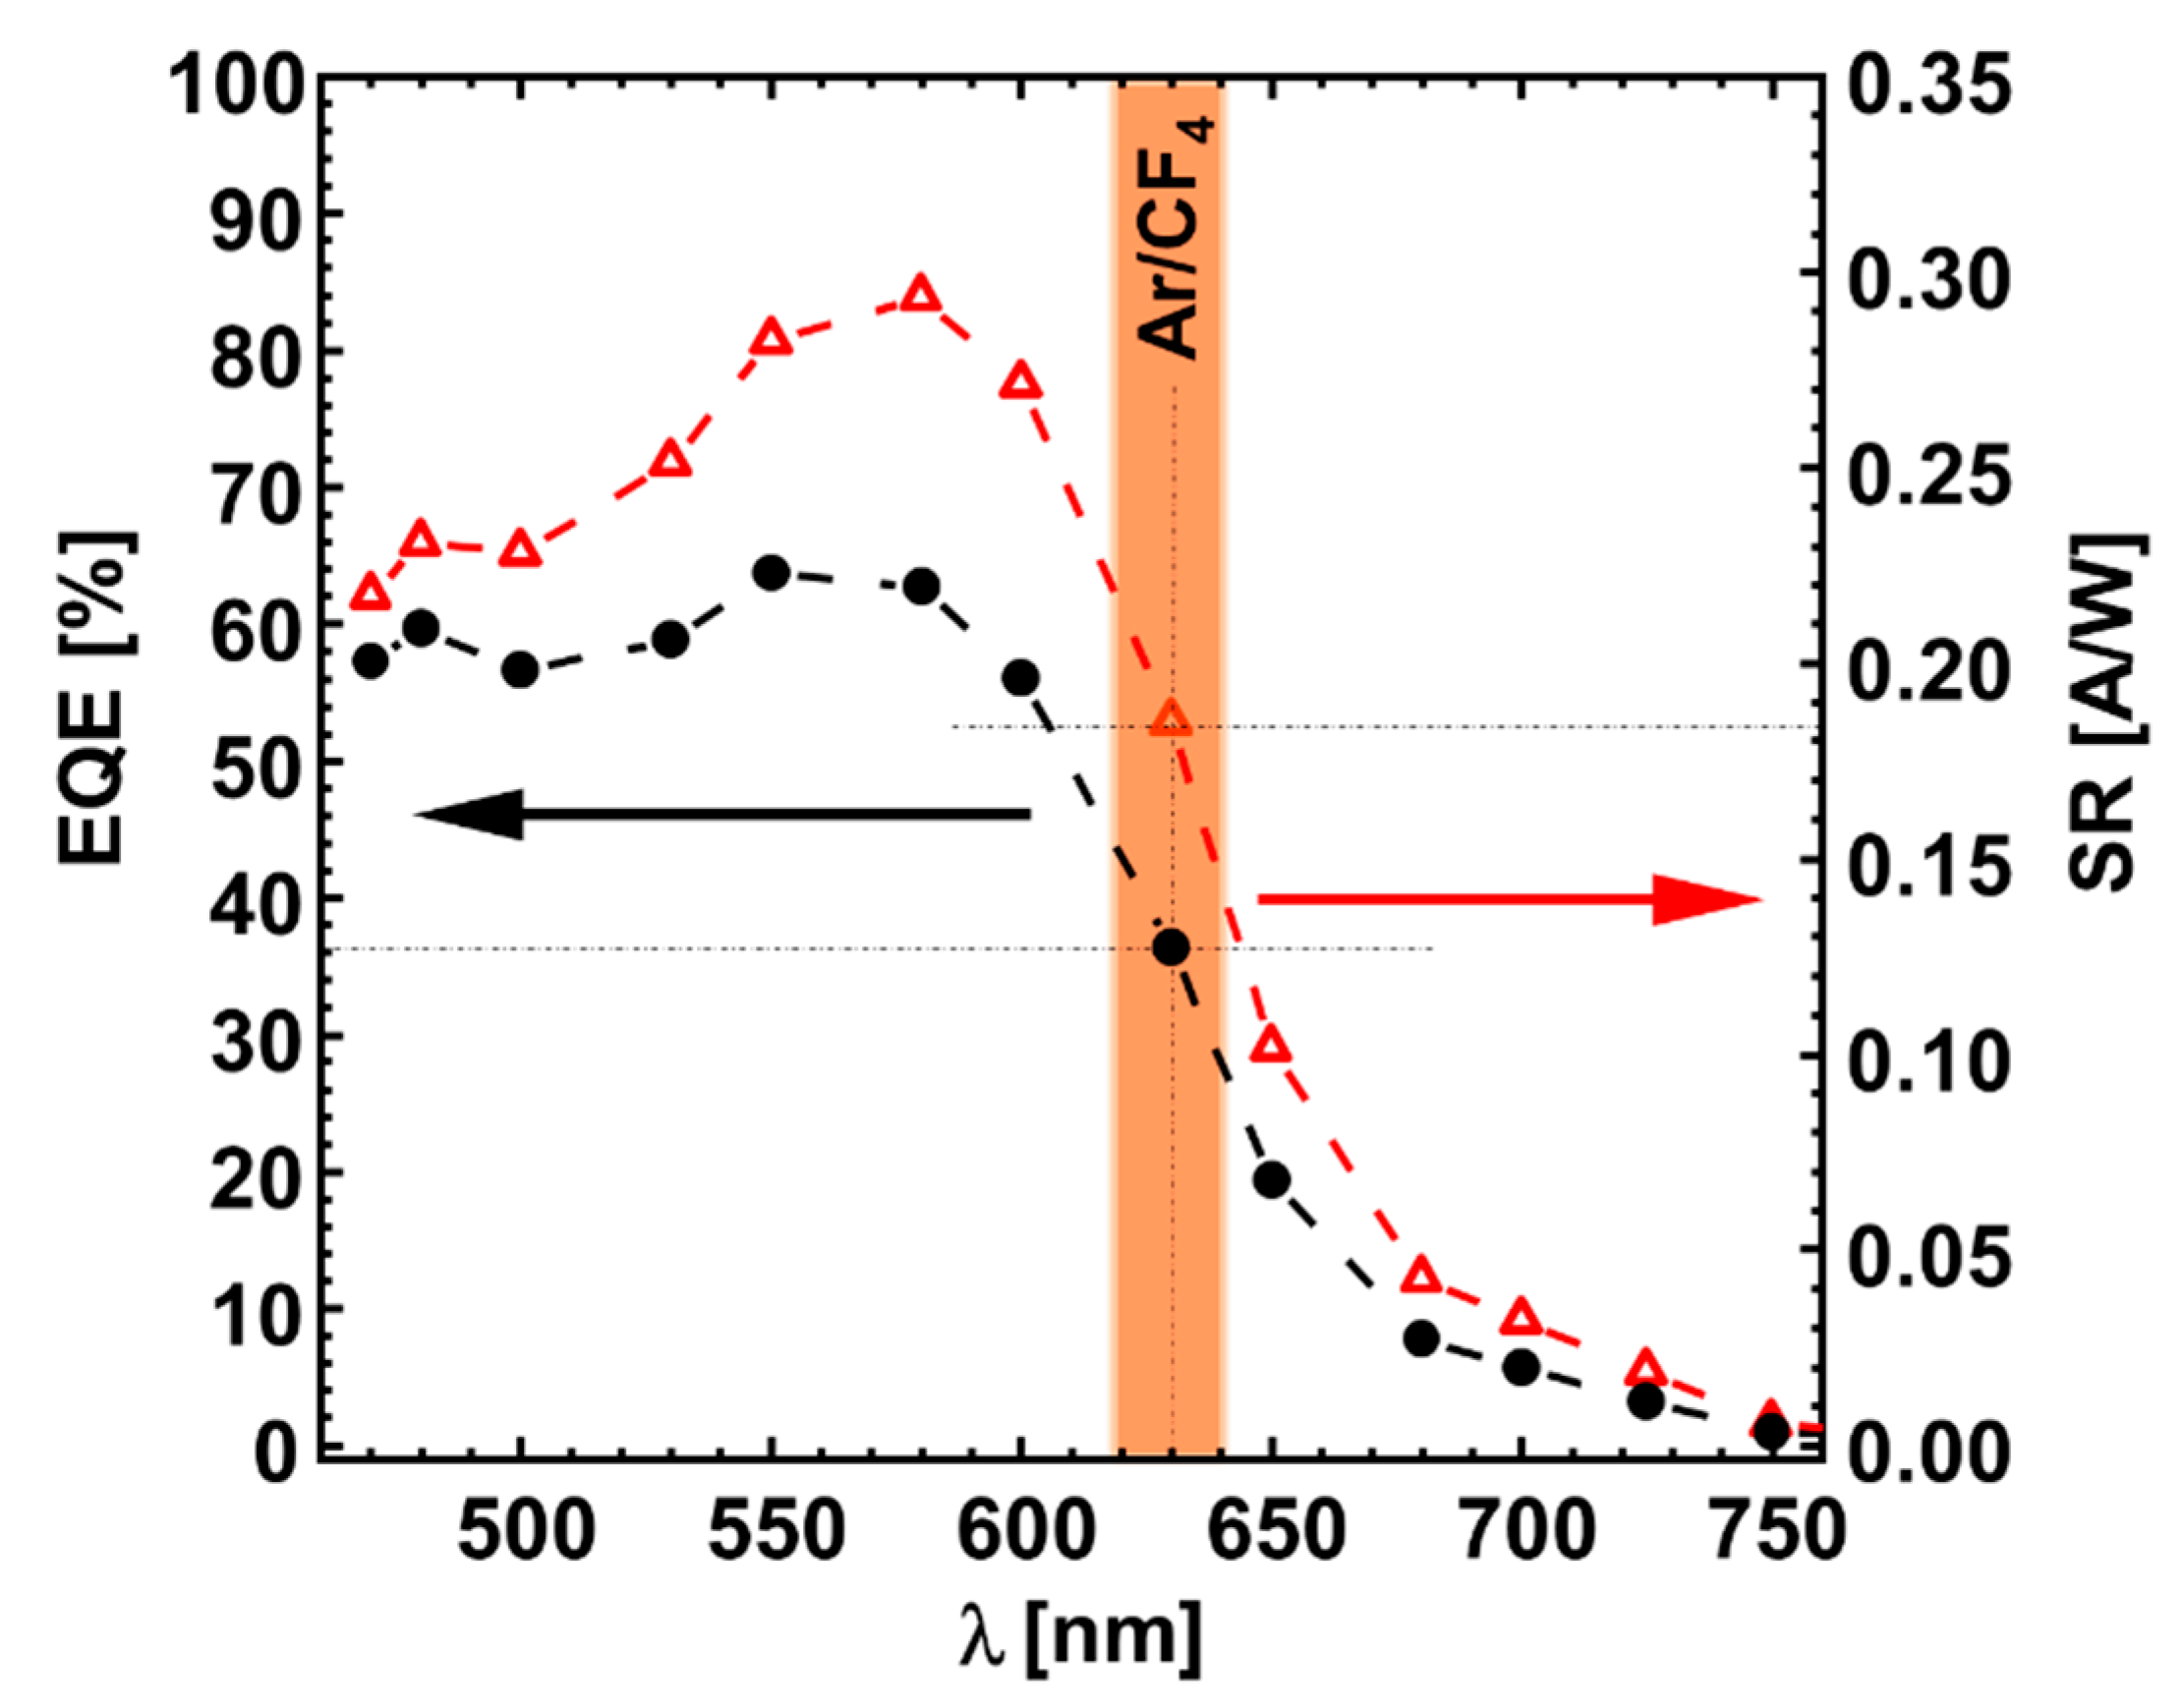
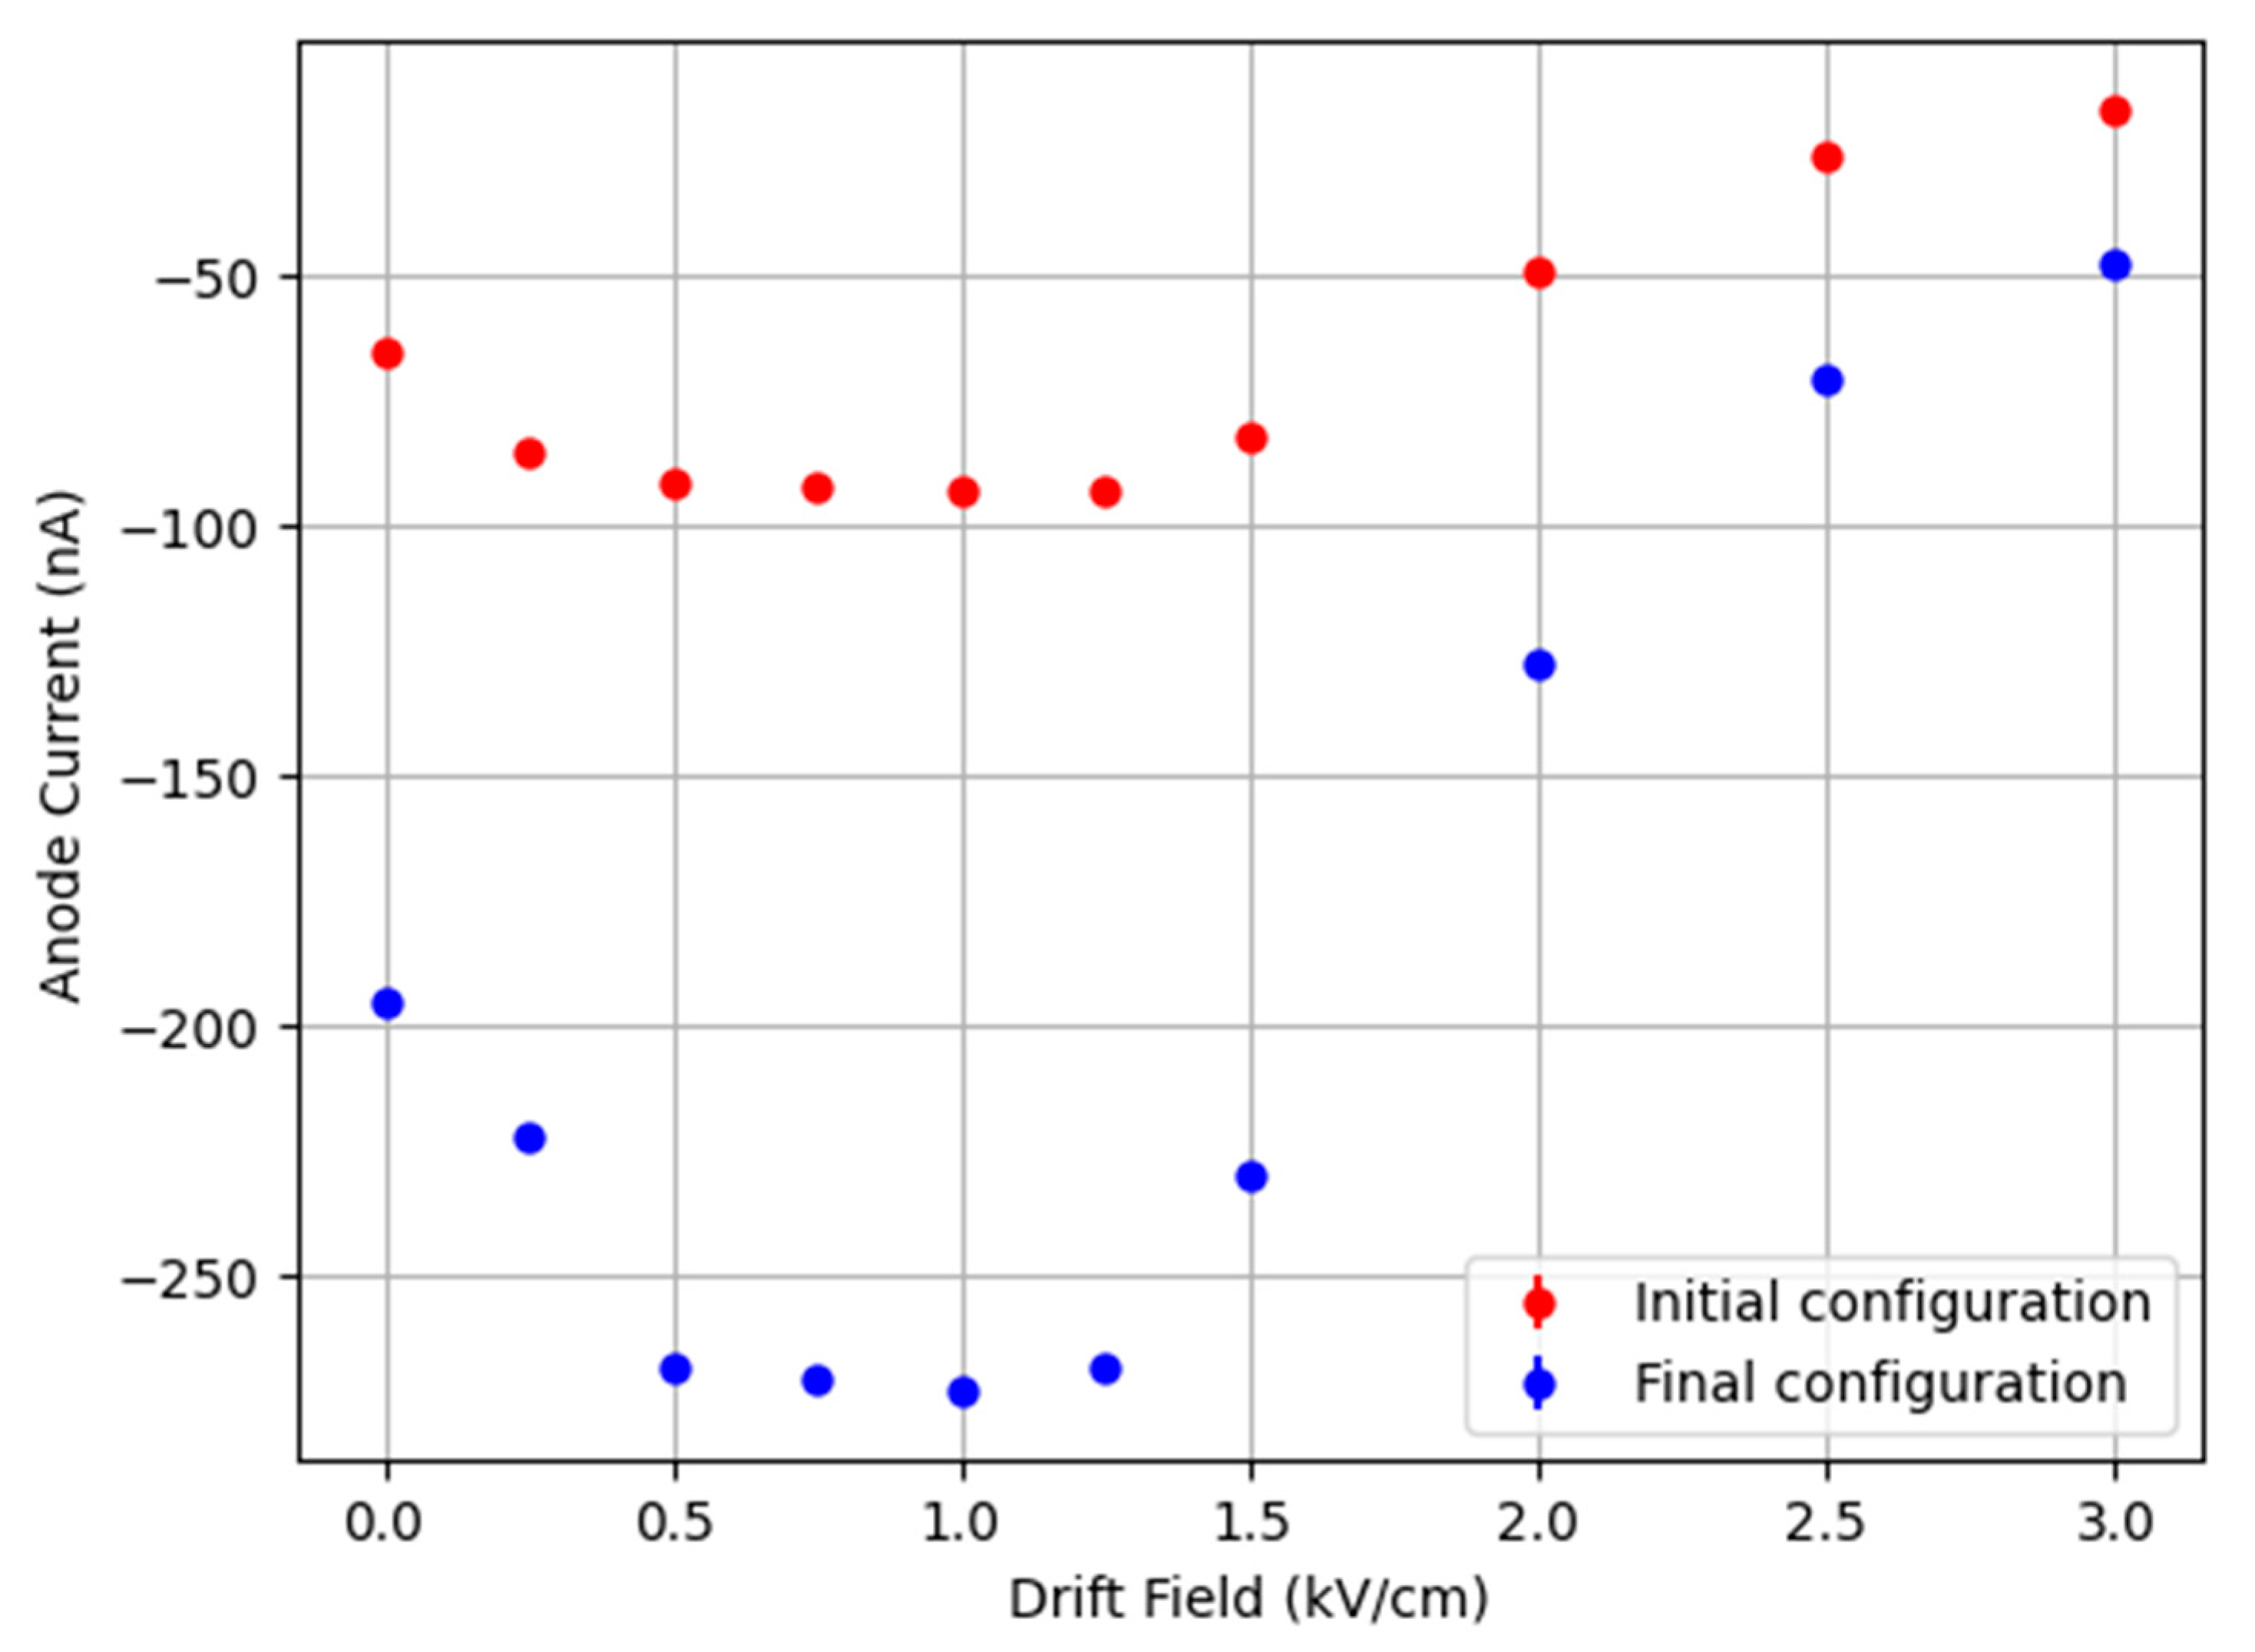
3.1. Optimization of the Electric Fields of the LaGEMPix

The transfer, drift and induction fields were optimized to maximize the absolute value of the anode current. Initially, only the value of the drift field was modified, keeping the other fields fixed. The current was measured to be almost stable for drift field strengths in the range 0.5–1.25 kV/cm (Figure 4). The measurements were repeated, in turn varying one of the electric fields while keeping the others constant. A drift field of 1 kV/cm was selected. The optimization procedure showed a dependence of the anode current on the applied voltages. The optimal values are as follows: a transfer field between GEM1 and GEM2 of 2.0 kV/cm and a transfer field between GEM2 and GEM3 of 1.75 kV/cm. It was established that the absolute value of the current increases as a function of the induction field. In order to achieve an efficient and safe operation of the detector, the initial value of the induction field was not changed, keeping it at 5 kV/cm.
We repeated the drift field intensity scan with the final configuration. Figure 4 shows a comparison of the anode current before and after the optimization of the fields. For a drift field of 1 kV/cm, the maximum value of the current is 273 nA (absolute value), 180 nA higher than the absolute value measured with the initial settings of the fields.
The observed behavior of the drift and transfer field scans is in agreement with the results published by Marafini et al. [48]. The difference in the values of the two transfer fields can be explained by the asymmetry of the transfer gaps (1 mm and 2 mm). By applying the optimized configuration to the drift and transfer fields, we measured a 180 nA higher signal compared to the approach with non-optimized fields, representing an increase of the detectable signal by around 150%.

3.2. Spatial Resolution with the LaGEMPix

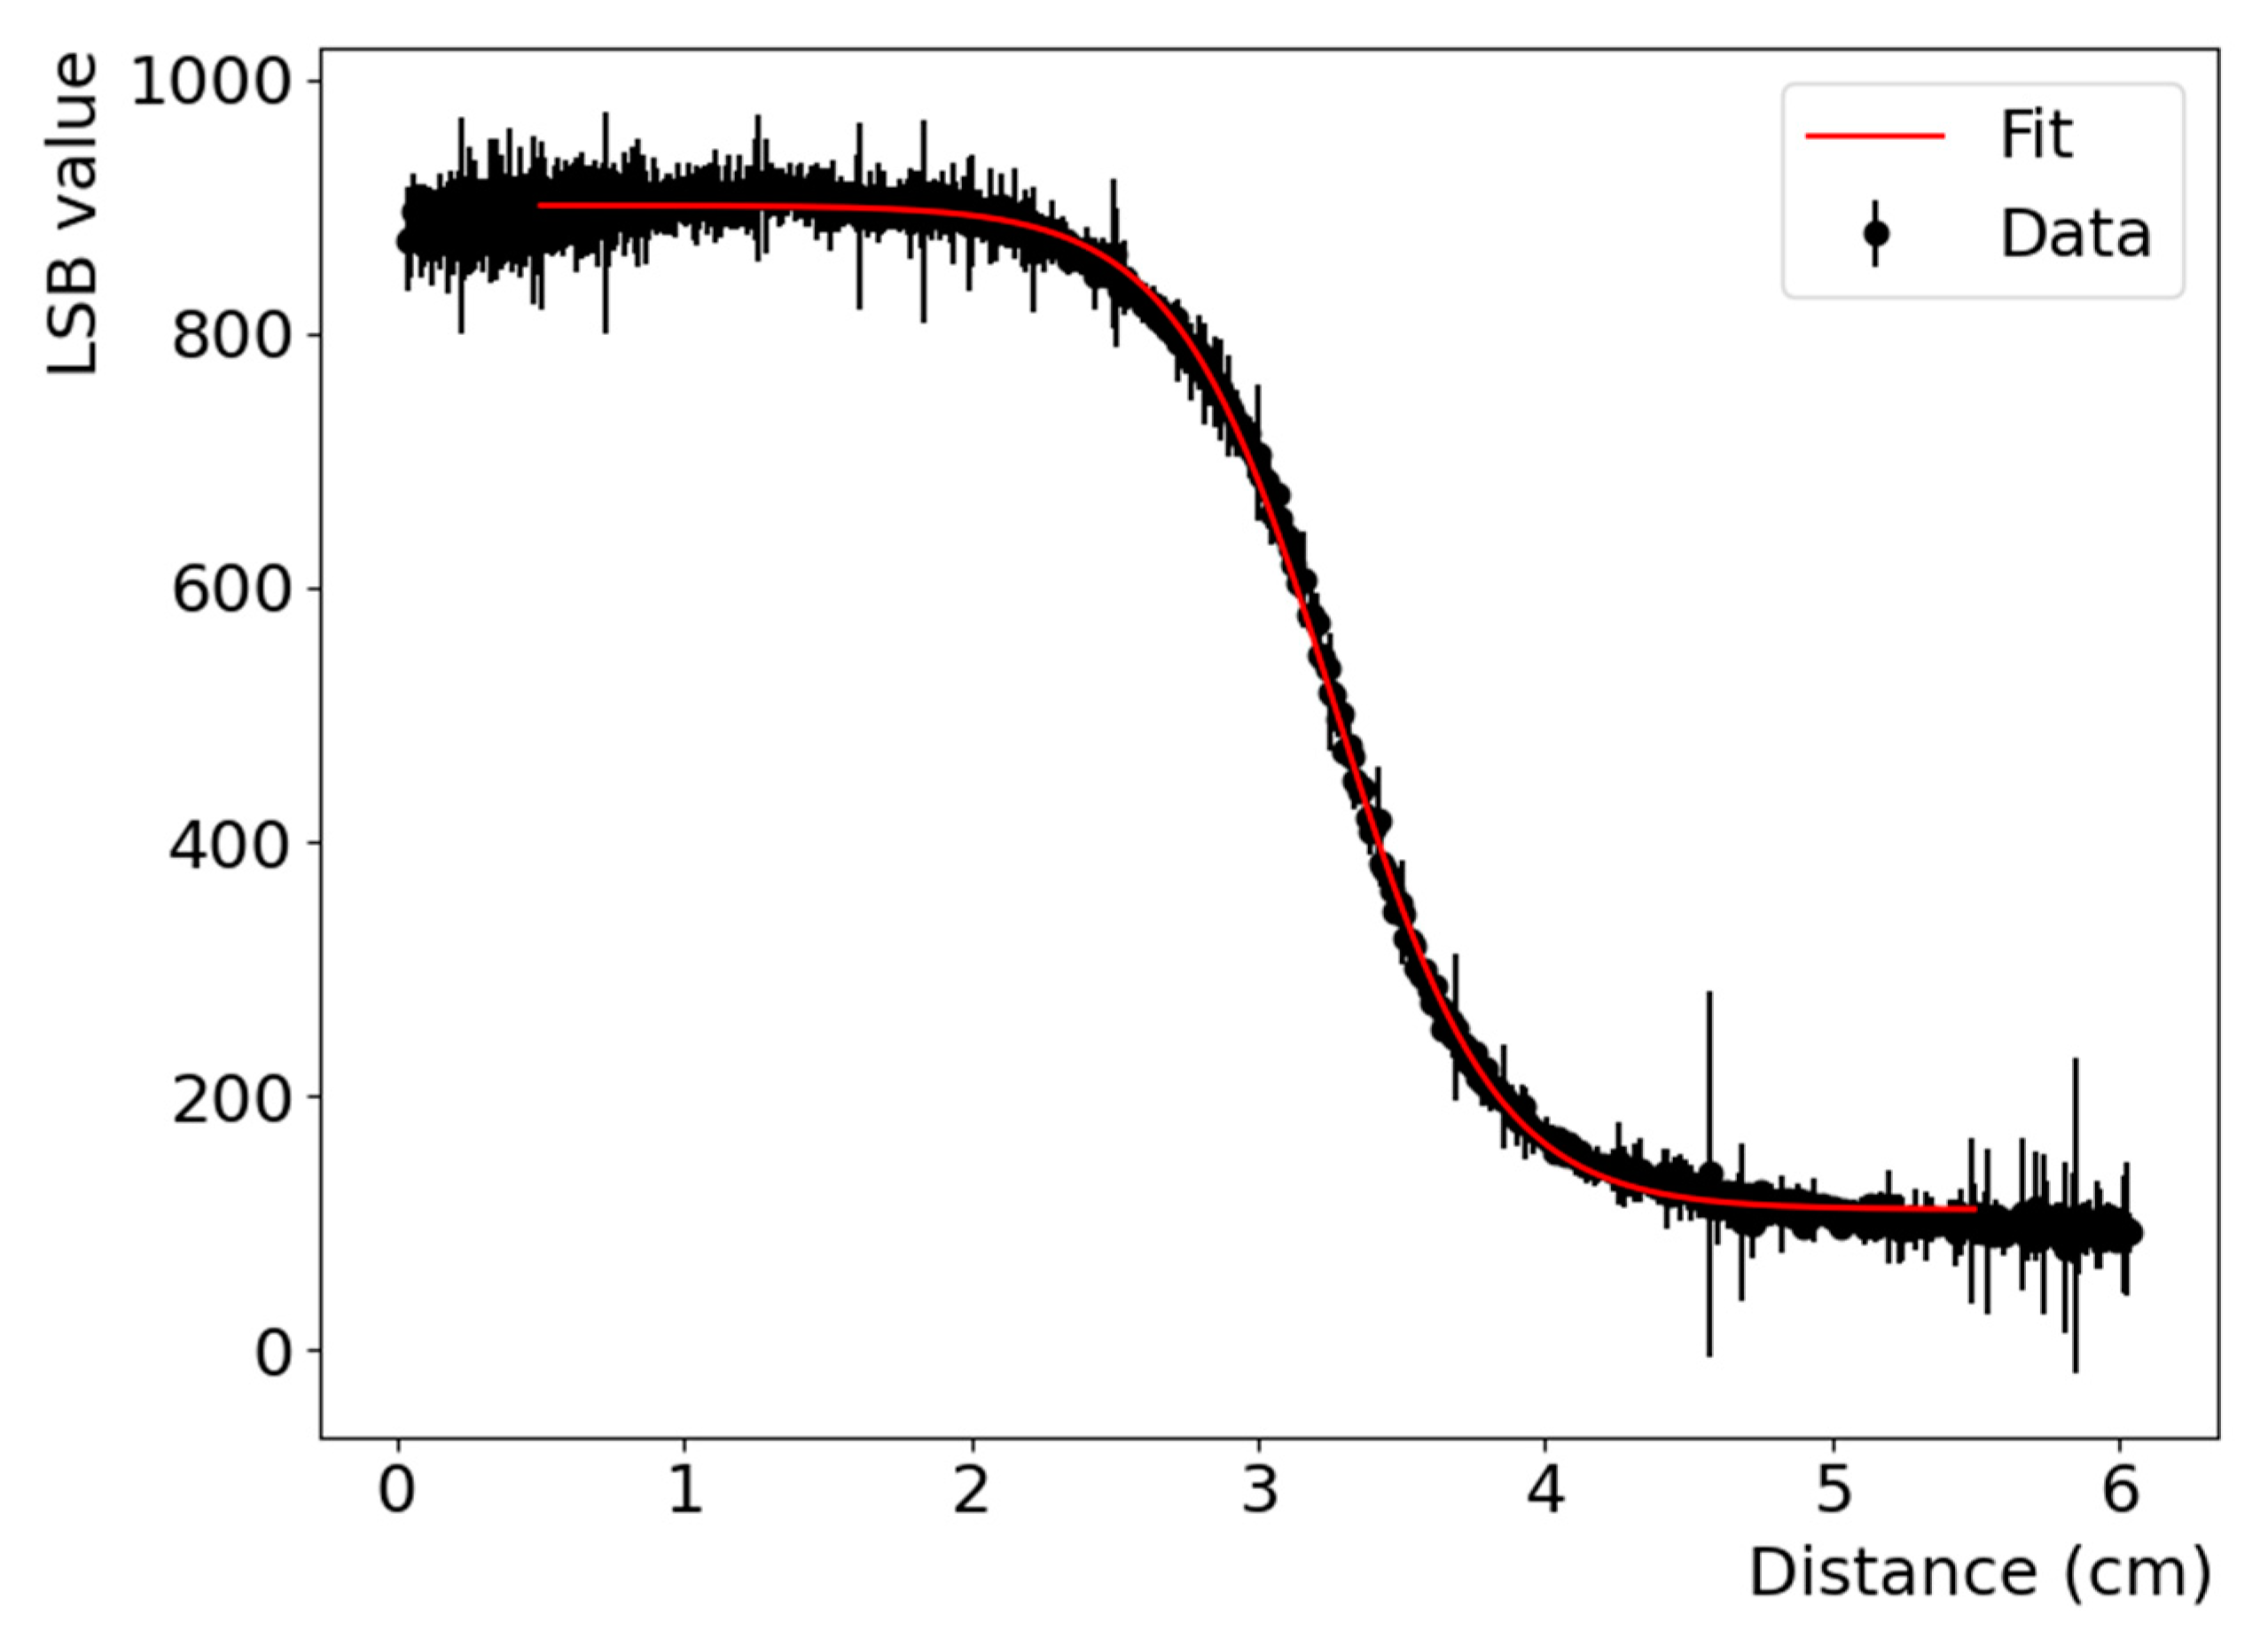
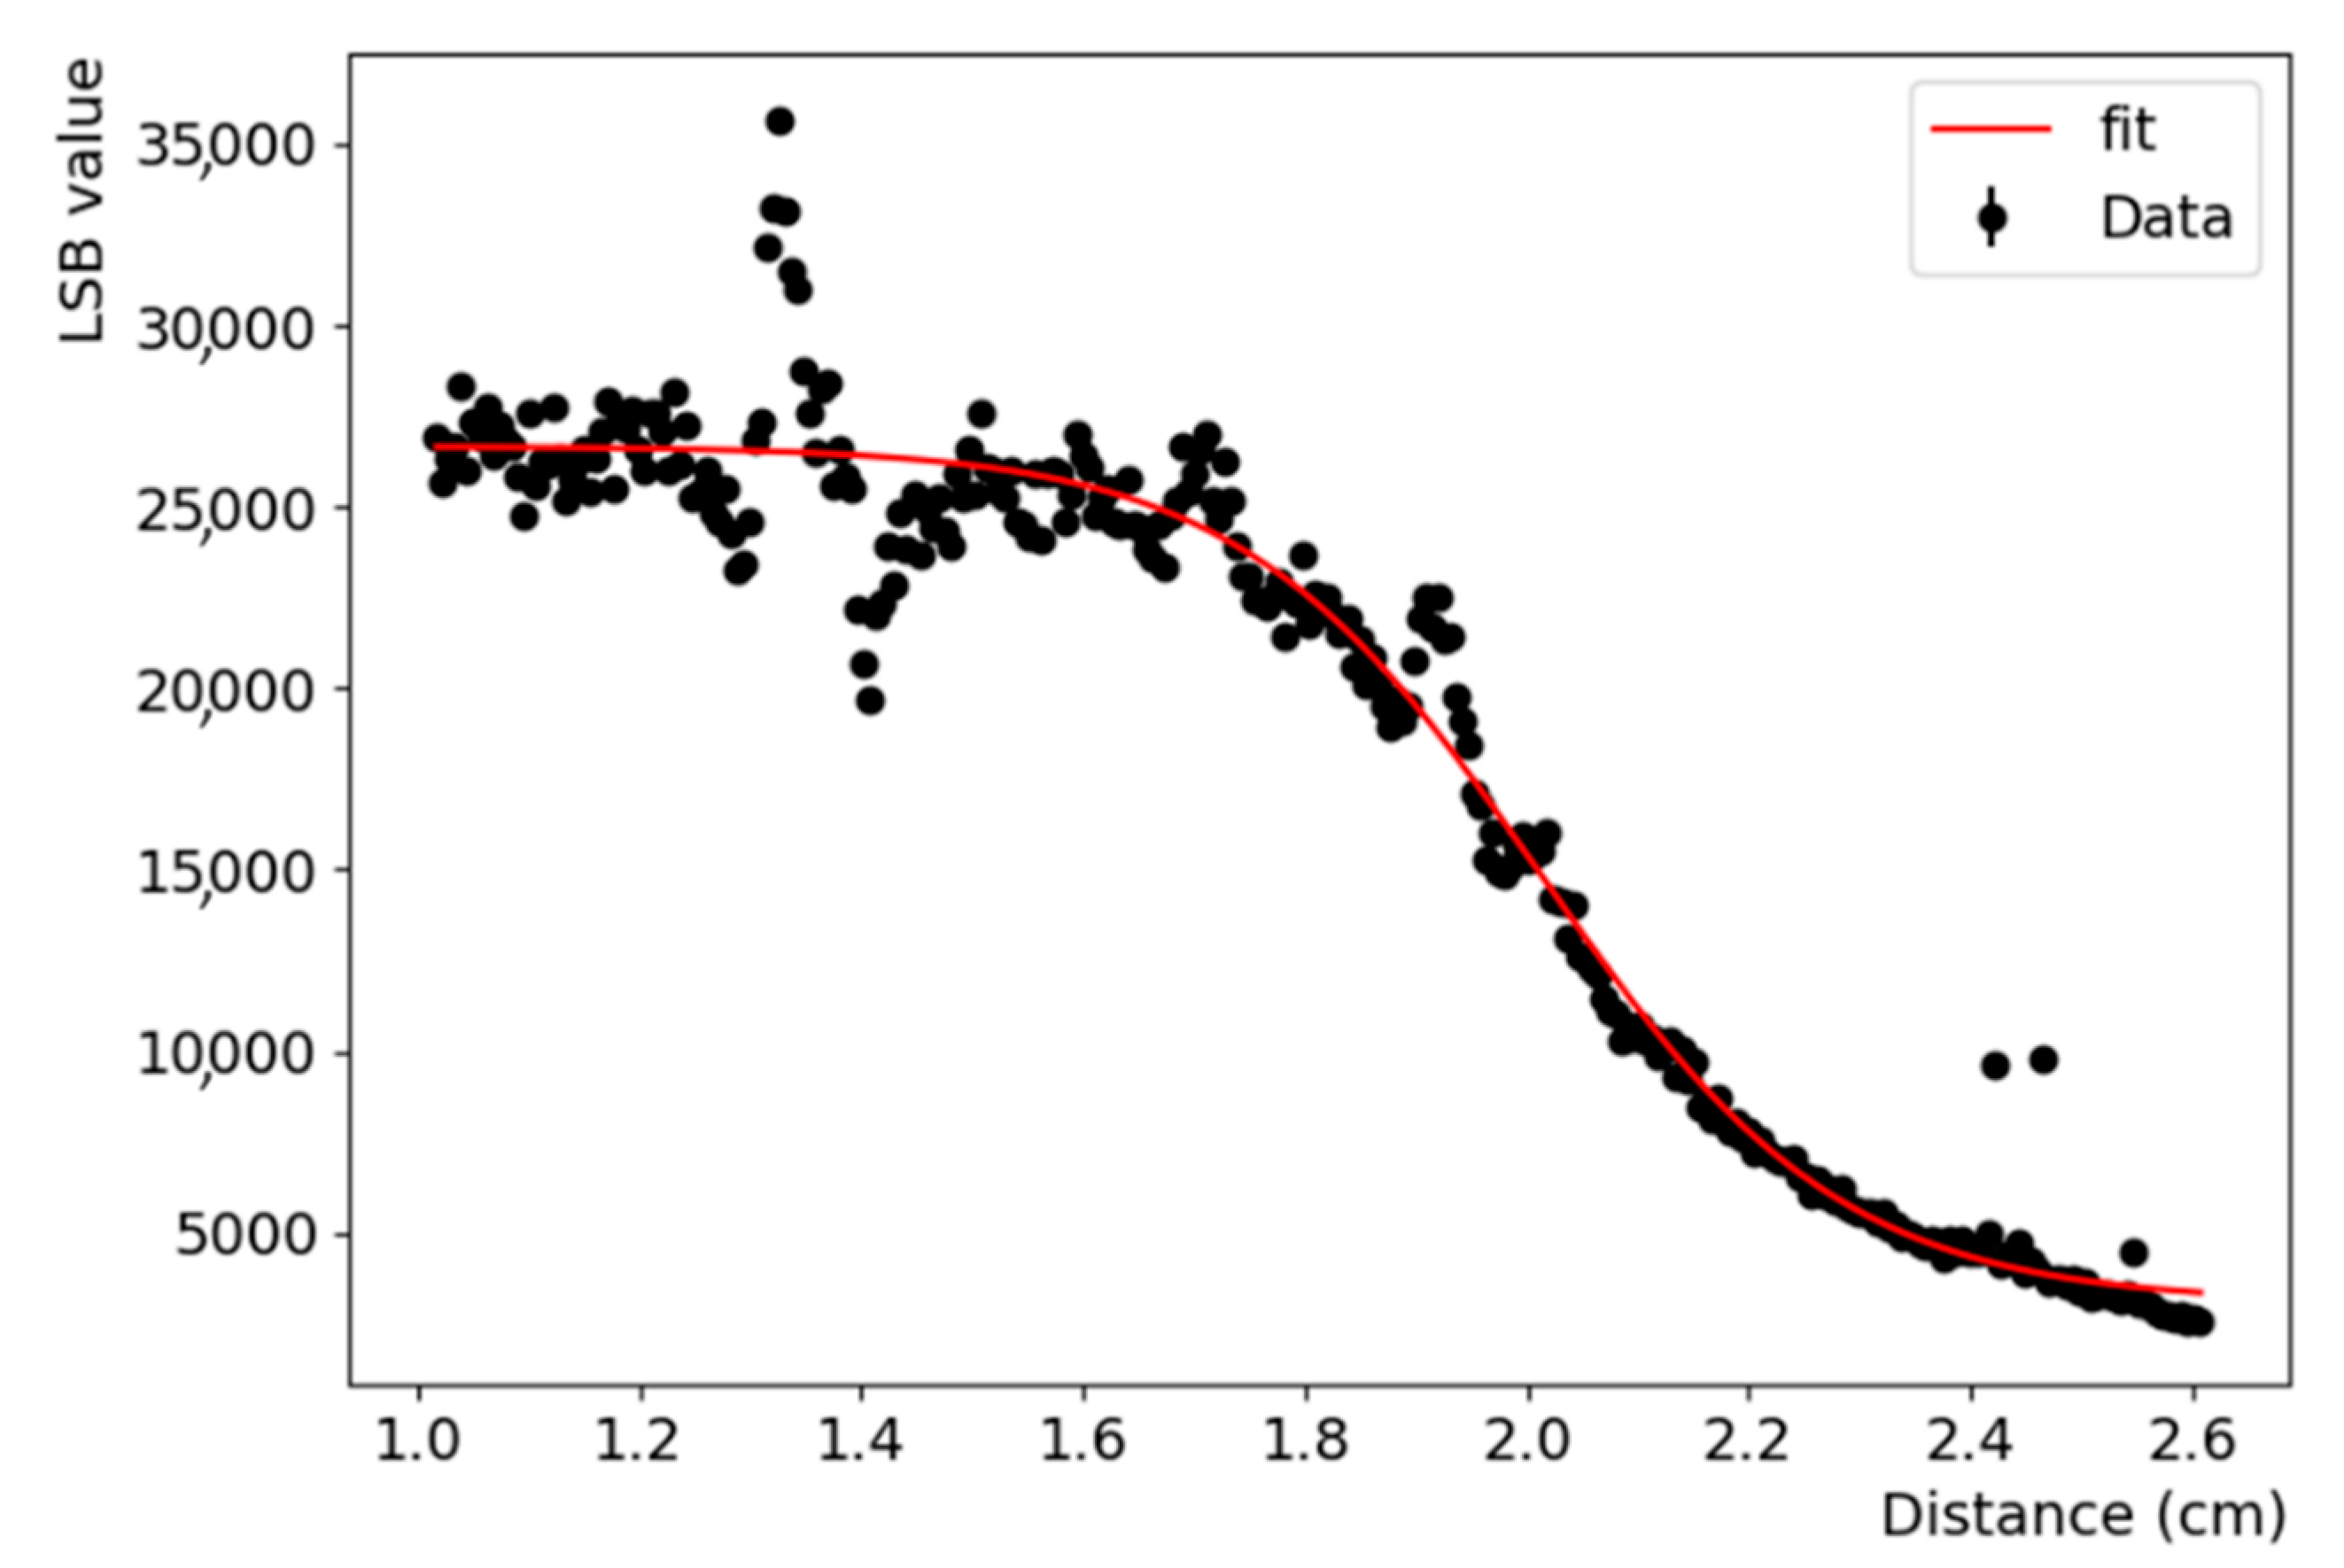
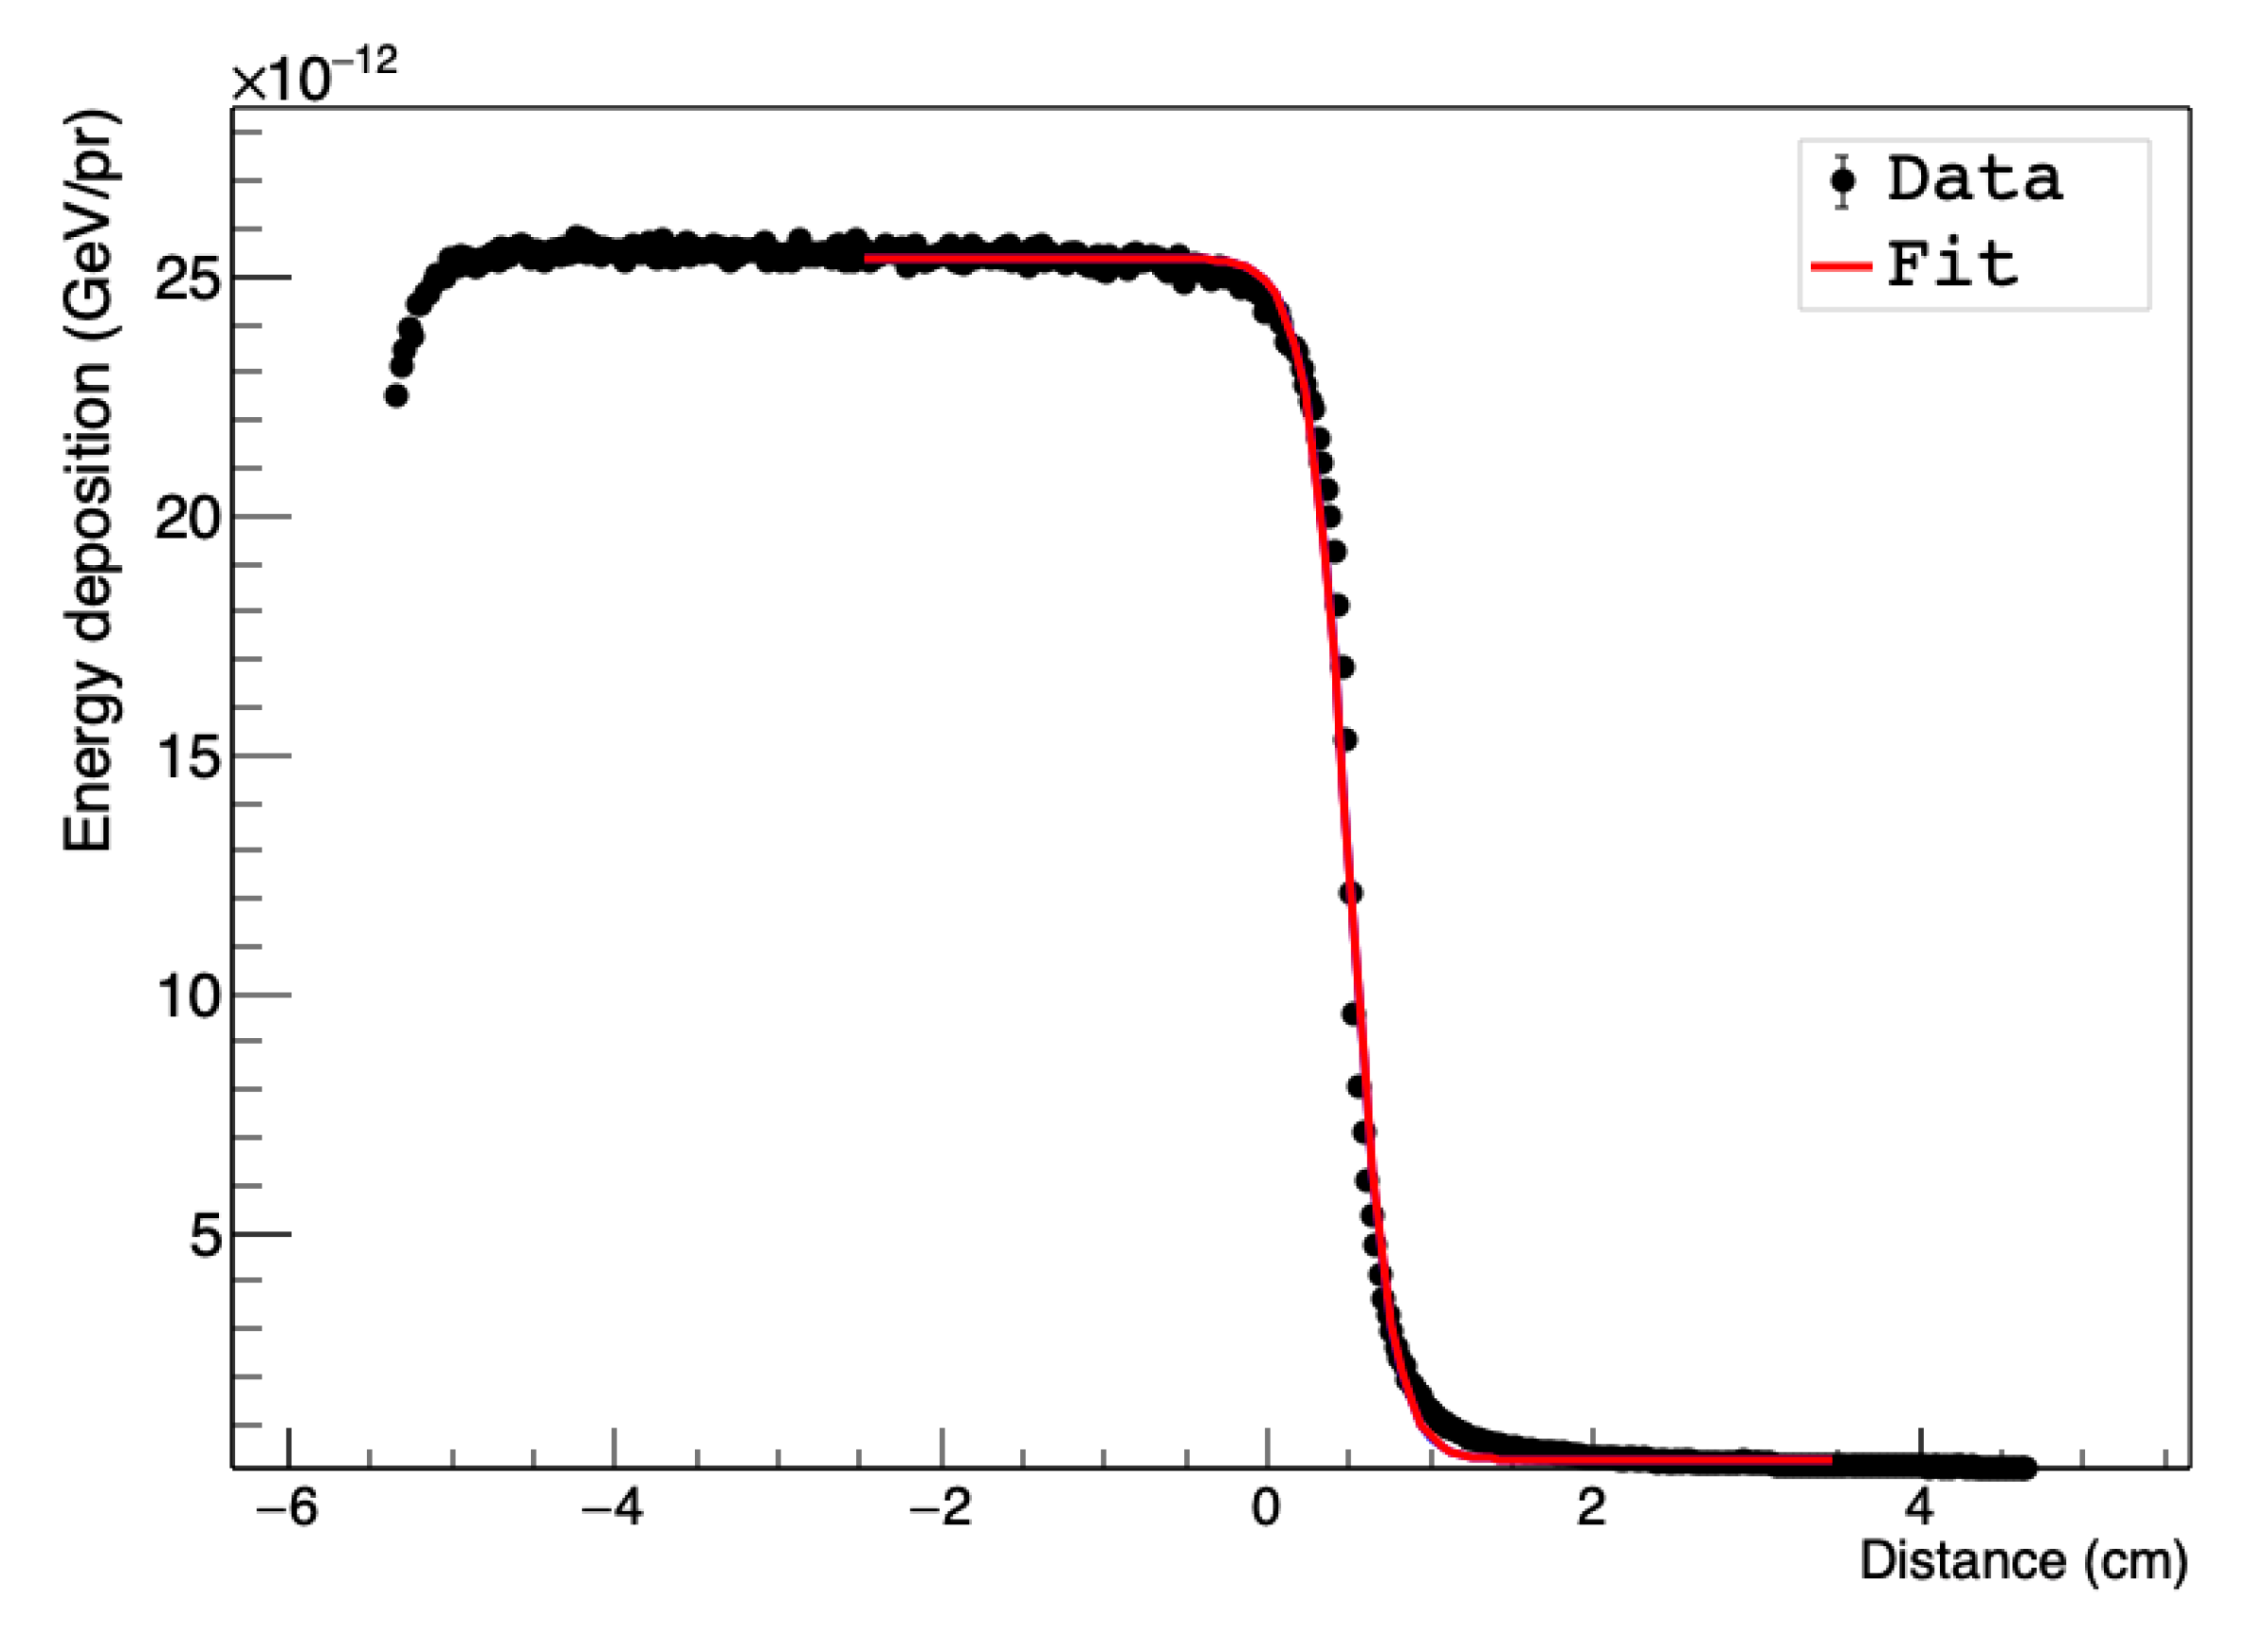
3.2.1. Edge Spread Function (ESF)

To evaluate the spatial resolution using the edge response method, we placed a lead block of 10 × 20 × 2.5 cm3 size in front of the detector covering a portion of its active area, as shown in Figure 5a. This detector prototype was developed as a proof of concept; the readout matrix has some defects, resulting from a yield issue in the fan-out area toward the active area of the detector. In particular, some lines in the backplane are disconnected and can therefore not be read out. These appear as horizontal and vertical non-functional black lines in the readout image in Figure 5b.
A ROI indicated by a green rectangle was defined around an area of the readout with a minimum number of defects. Figure 6 shows the edge response obtained by averaging all pixel values in the same column from the averaged background-subtracted image. This figure also shows a fit with a logistic function according to Equation (1). The FWHM obtained by this method is 9.70 ± 0.09 mm.

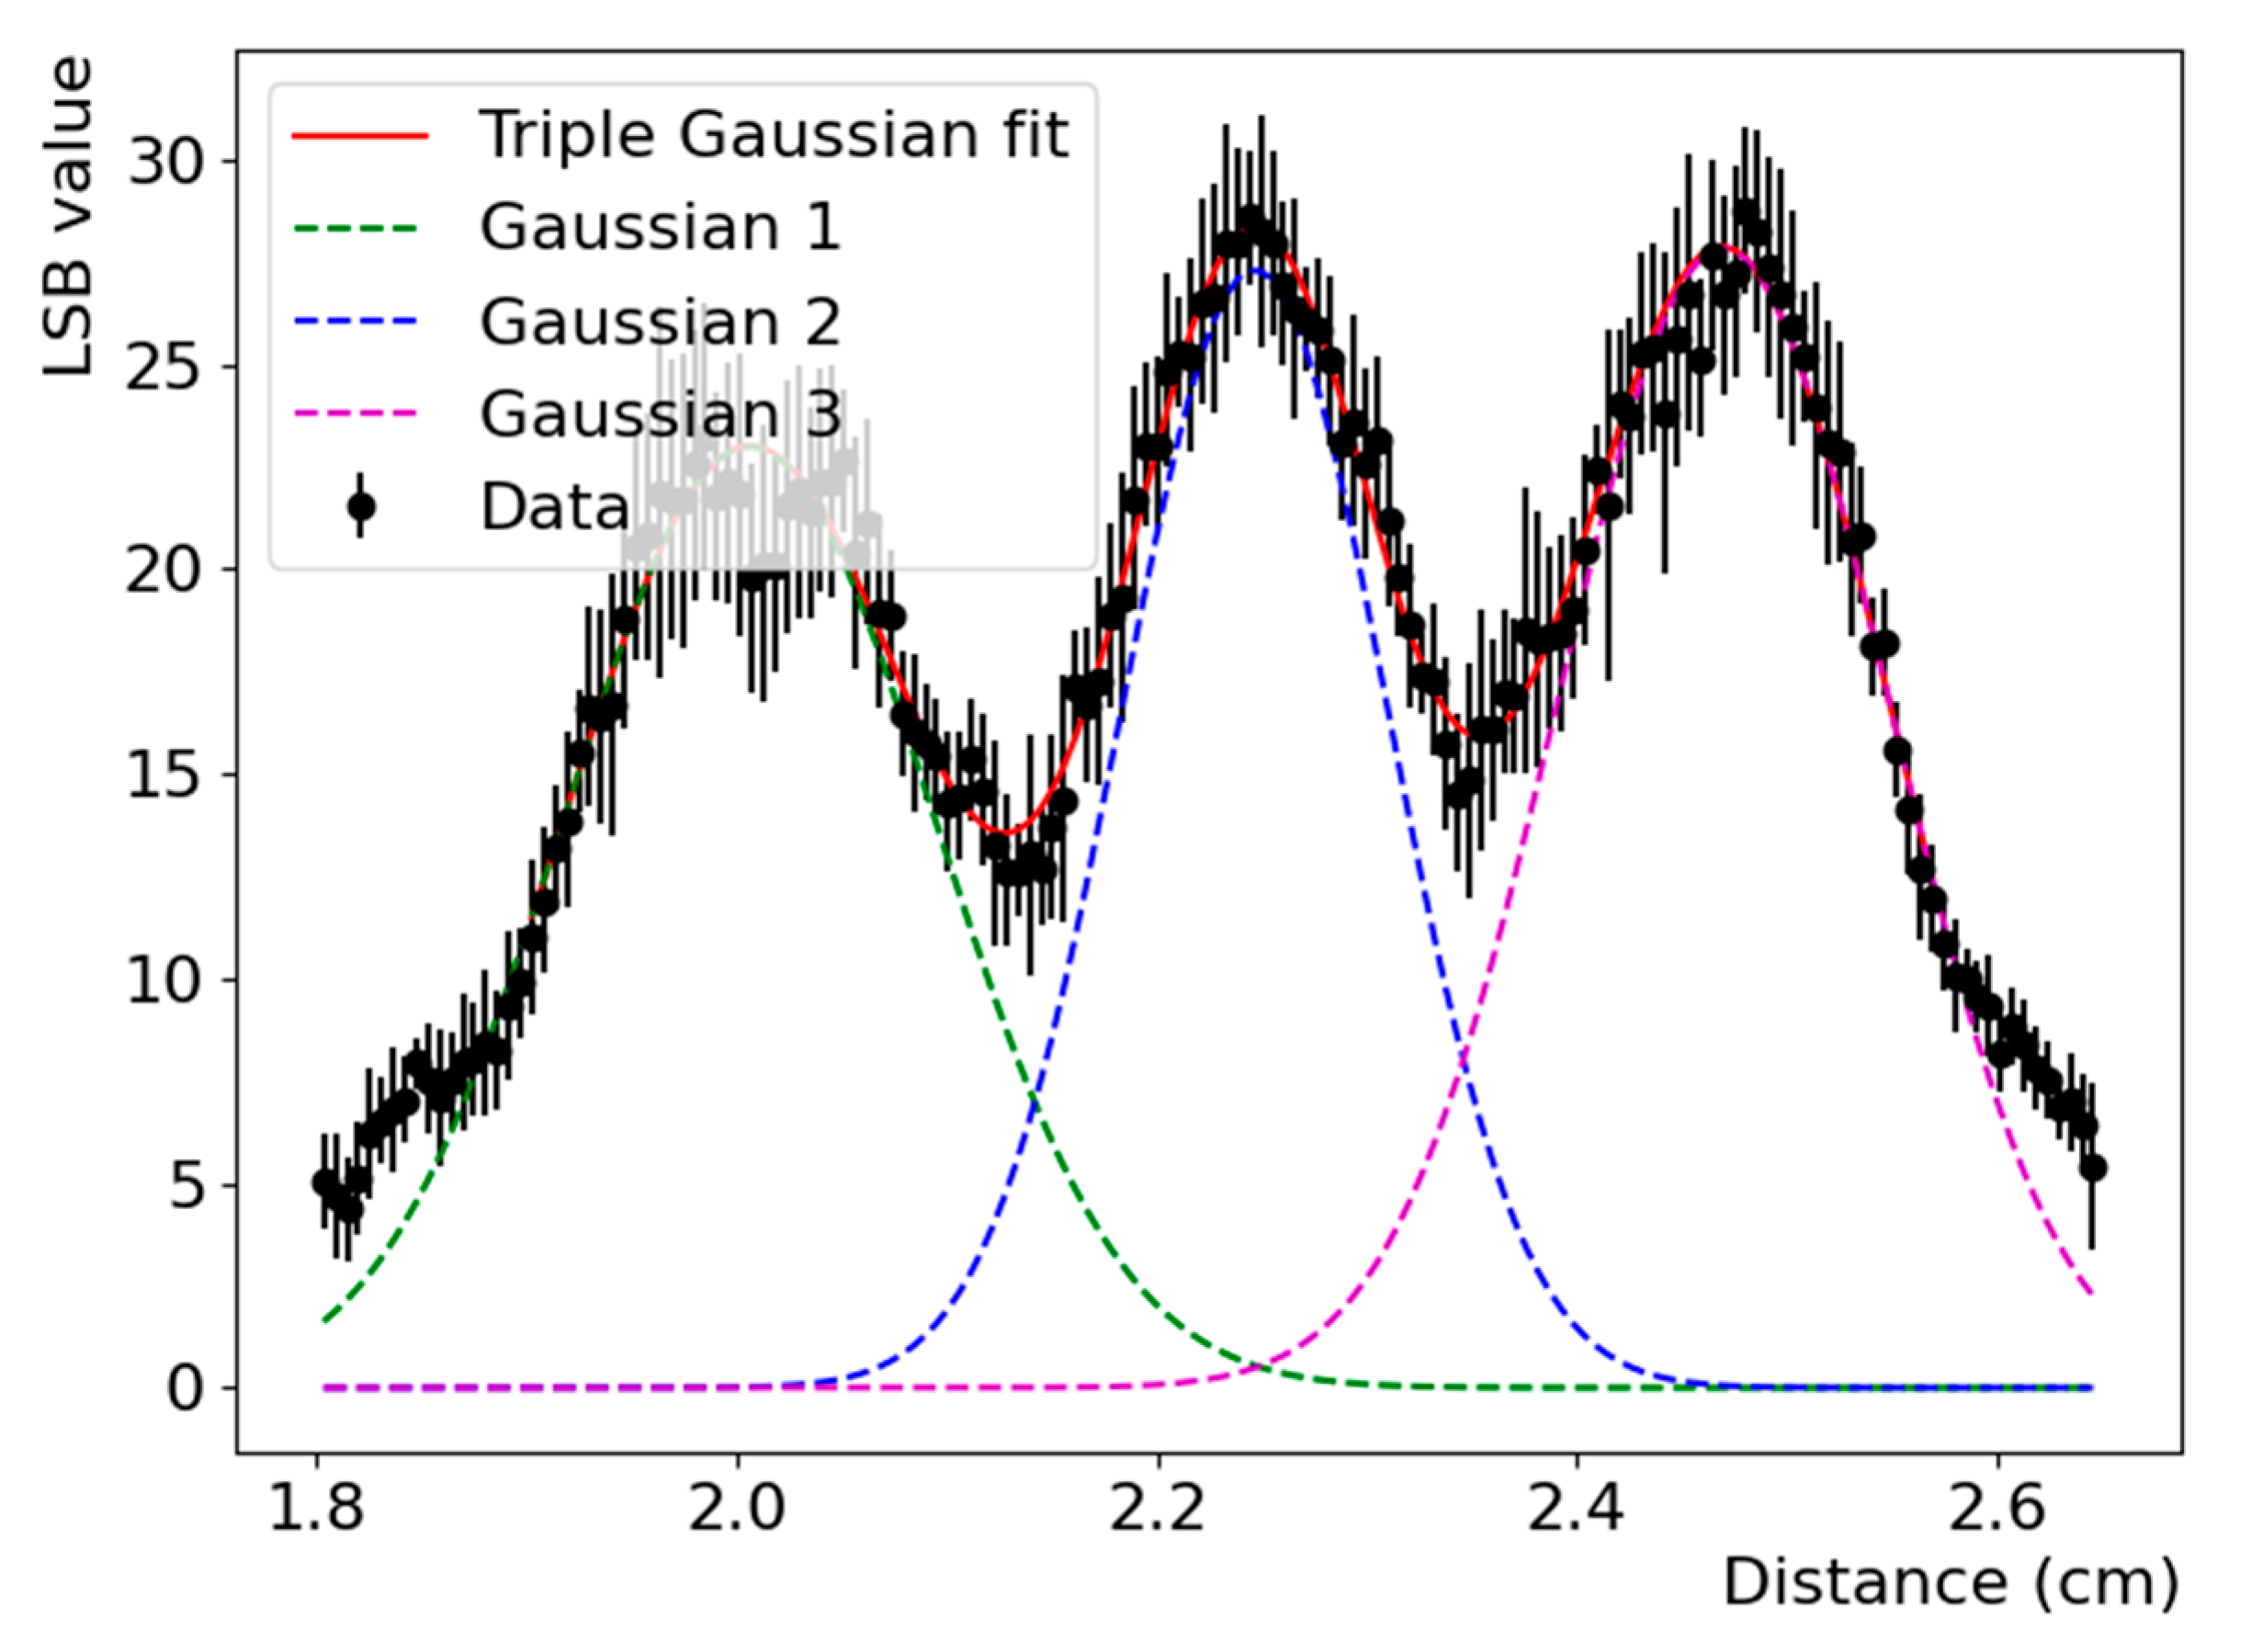
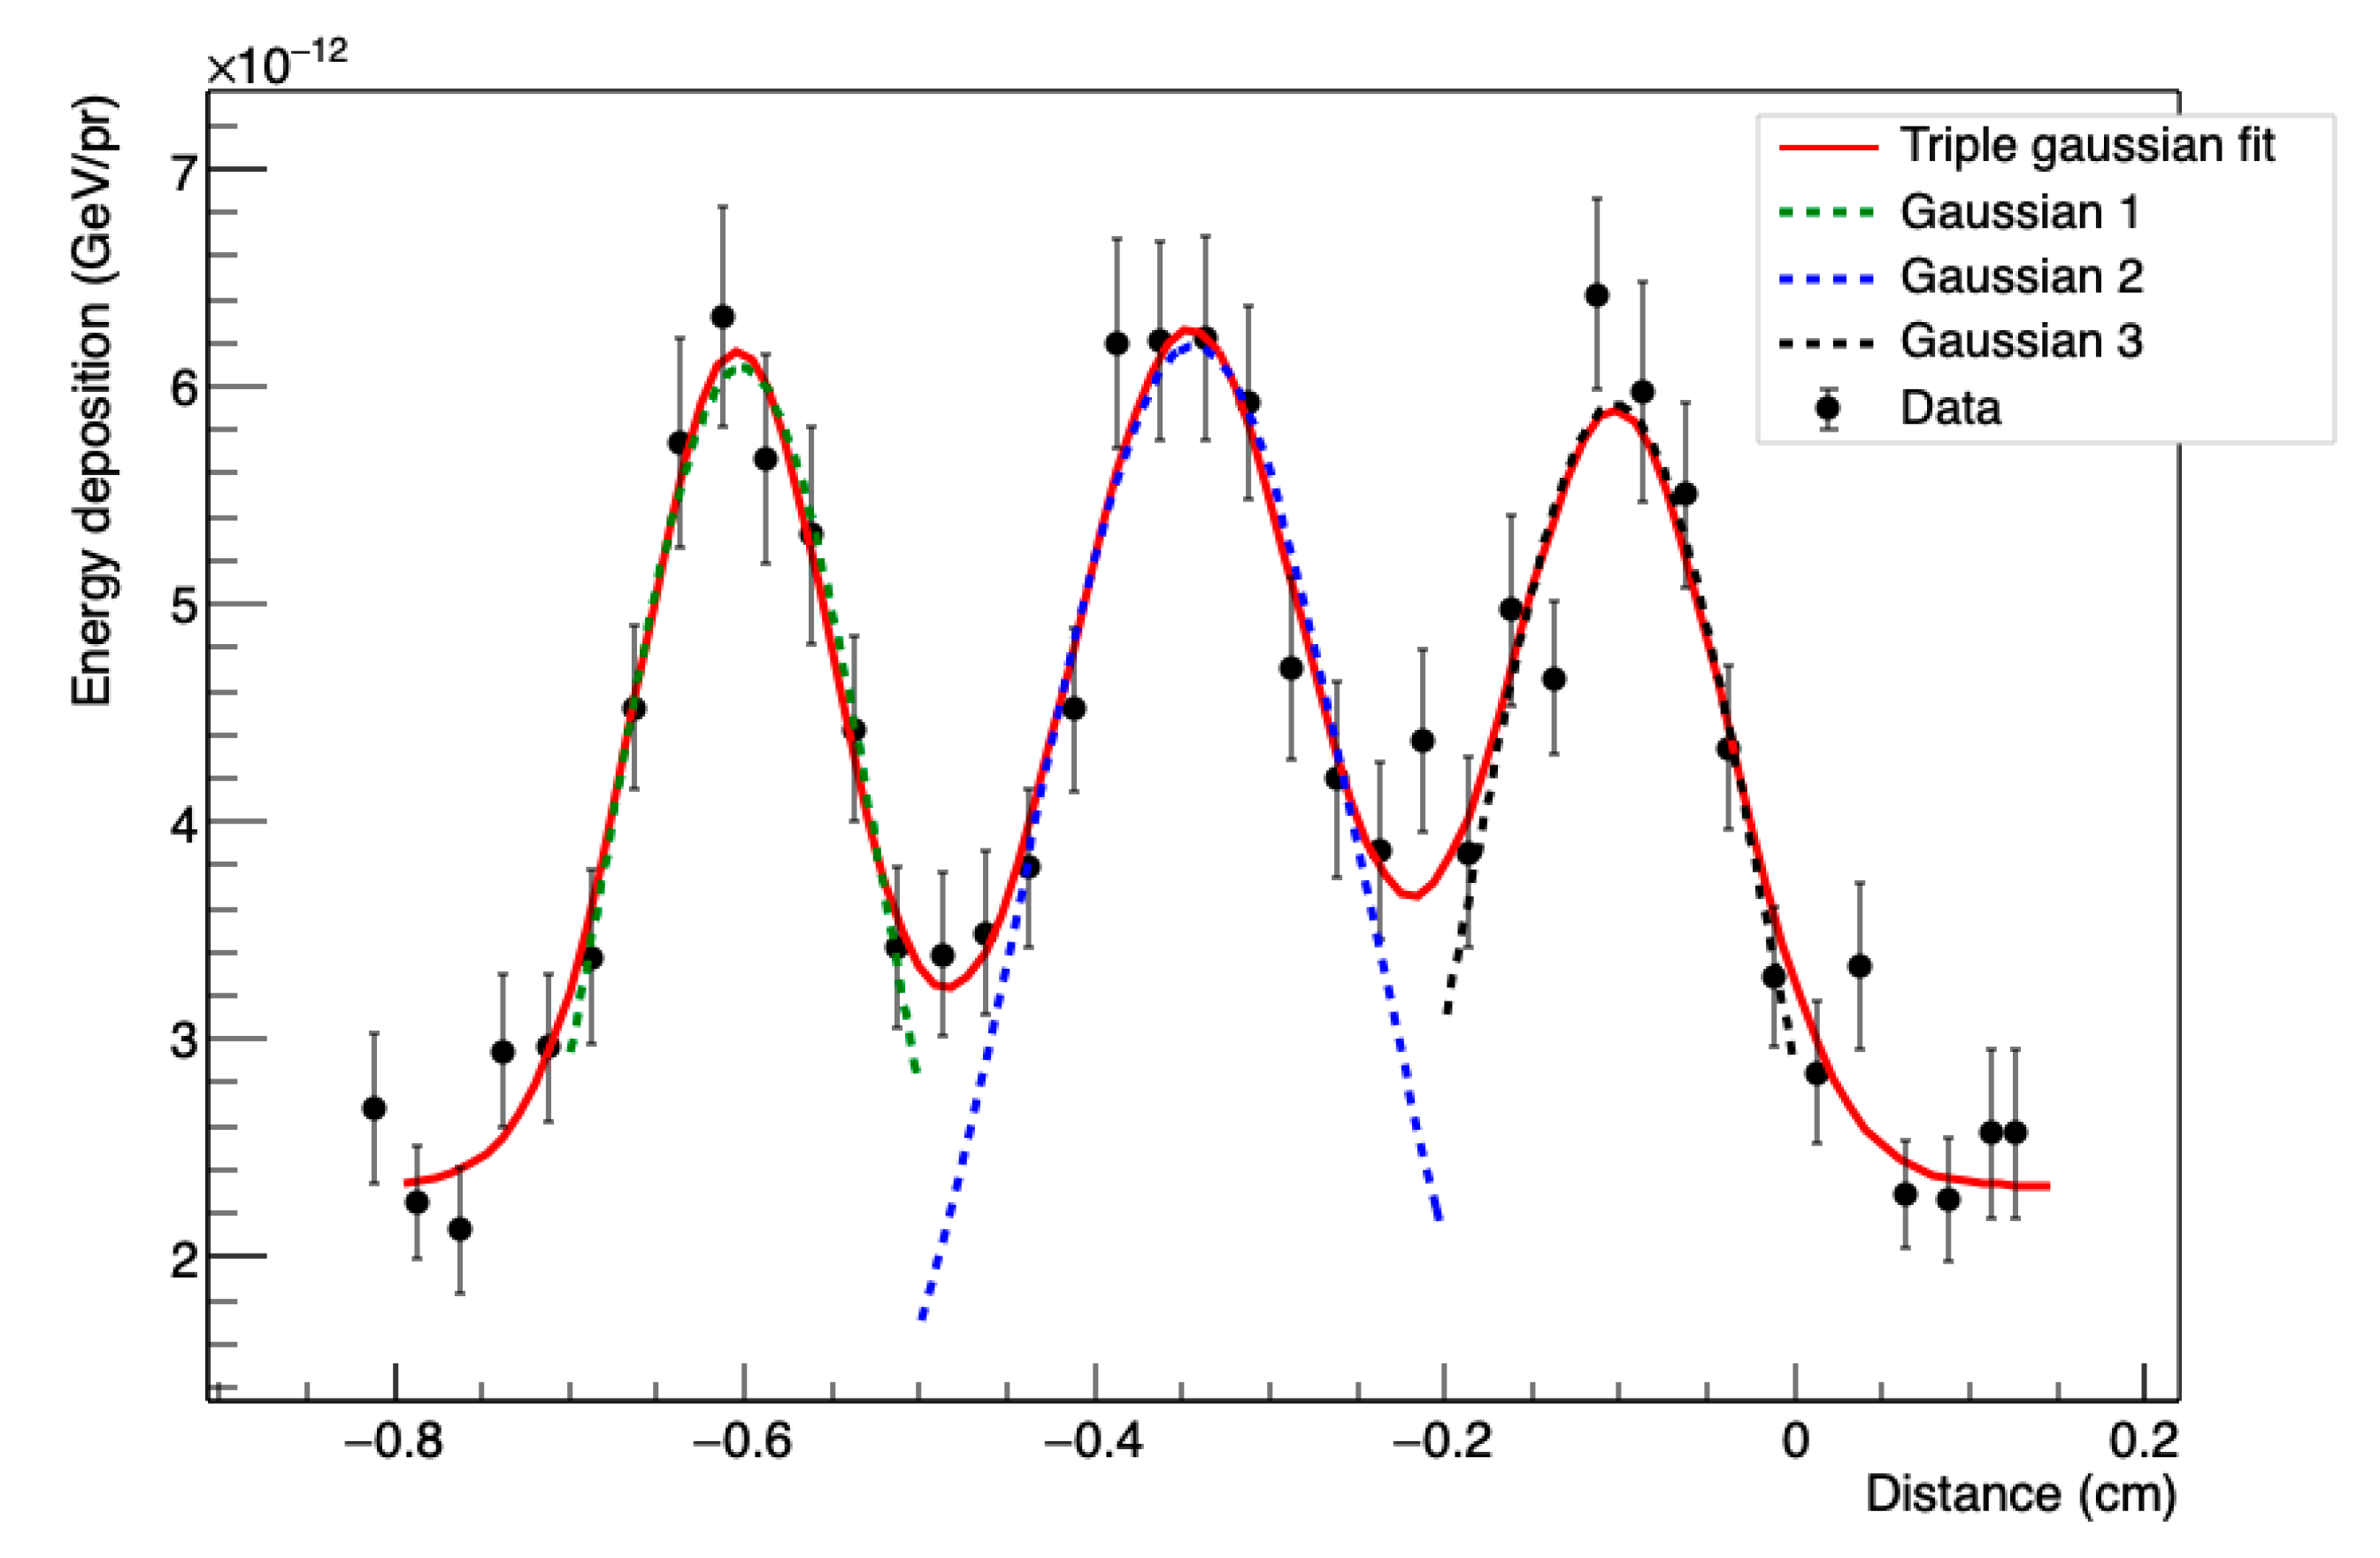
3.2.2. Line Spread Function (LSF)

For the LSF response, we used a 3 mm thick copper plate placed at 7 mm from the Mylar window (see Figure 7a). Various holes of 5 mm diameter spaced by 3 to 20 mm, edge to edge were drilled in the plate. The average image profile on a single hole is Gaussian. The spatial resolution was, therefore, estimated by fitting the distribution by a Gaussian function. The obtained FWHM for a 5 mm diameter hole is 6.73 ± 0.08 mm.
An additional measurement was made by selecting a ROI (green region in Figure 7b) at the center of the 5 mm holes spaced by 3 mm. Figure 8 shows the response of two holes spaced by 3 mm (edge to edge), featuring two peaks with a dip in the intensity. The response was again obtained by averaging all pixel values in the same column from the averaged background-subtracted image. The so-called FWHM criterion states that the minimum distance that any detector is able to resolve is equal to the FWHM value of the Gaussian distribution. The relevant values in this case are the center-to-center distance between the holes, 8 mm, and the FWHM, 7.10 ± 0.30 mm. Following this criterion, the two holes can be resolved.

3.2.3. Modulation Transfer Function (MTF)

The MTF characterizes how faithfully the spatial frequency content of the object is transferred to the image [49]. According to ISO 1233:2017, the results of the MTF analysis is reported using a graph plot. Nevertheless, the summary resolution metrics may also be used; the limiting spatial resolution is defined as the frequency at which the MTF drops below a certain percent value. Several values can be used; however, the 10% level is the most common one [50,51,52].
A line pair mask type 53 [53] was placed in front of the Mylar window to evaluate the MTF of the LaGEMPix as shown in Figure 9. This X-ray test pattern is made of 0.05 mm thick lead and the resolution range is from 0.5 up to 10 LP/mm. For this particular mask, 0.5 LP/mm means that one black and one white line within 4 mm are projected on the image sensor.
This test was carried out using 30 kV X-rays (instead of 40 kV) with the N-5 filter, in order to increase the contrast of the output image. The image in Figure 9 shows that it is not possible to measure the MTF of the LaGEMPix with this mask. We can conclude that the current version of the LaGEMPix is not able to distinguish 0.5 LP/mm, which corresponds to two slits separated by 2 mm.

3.3. Spatial Resolution with the GEMPix

In order to evaluate the contribution of the isotropic emission of the scintillation light to the spatial resolution in the LaGEMPix, we carried out comparative measurements with the GEMPix, a 2.8 × 2.8 cm2 triple-GEM detector that uses a Timepix quad ASIC to readout charges directly [6,54]. The experimental conditions were identical: 40 kV X-rays (N-6 series filter), minimum aperture 1 cm, 230 cm source-detector distance and same electric fields in the GEM structure.

3.3.1. Edge Spread Function

For the edge response, the 2.5 cm thick lead block was placed in the same position as for the measurement with the LaGEMPix (see Figure 5). A ROI (green region) was set perpendicularly to the edge. Figure 10 shows the edge response profile calculated from the average of 200 equalized images as explained earlier. The spatial resolution was estimated by fitting the edge profile by the logistic function of Equation (1). The FWHM obtained with the GEMPix is 5.20 ± 0.10 mm.

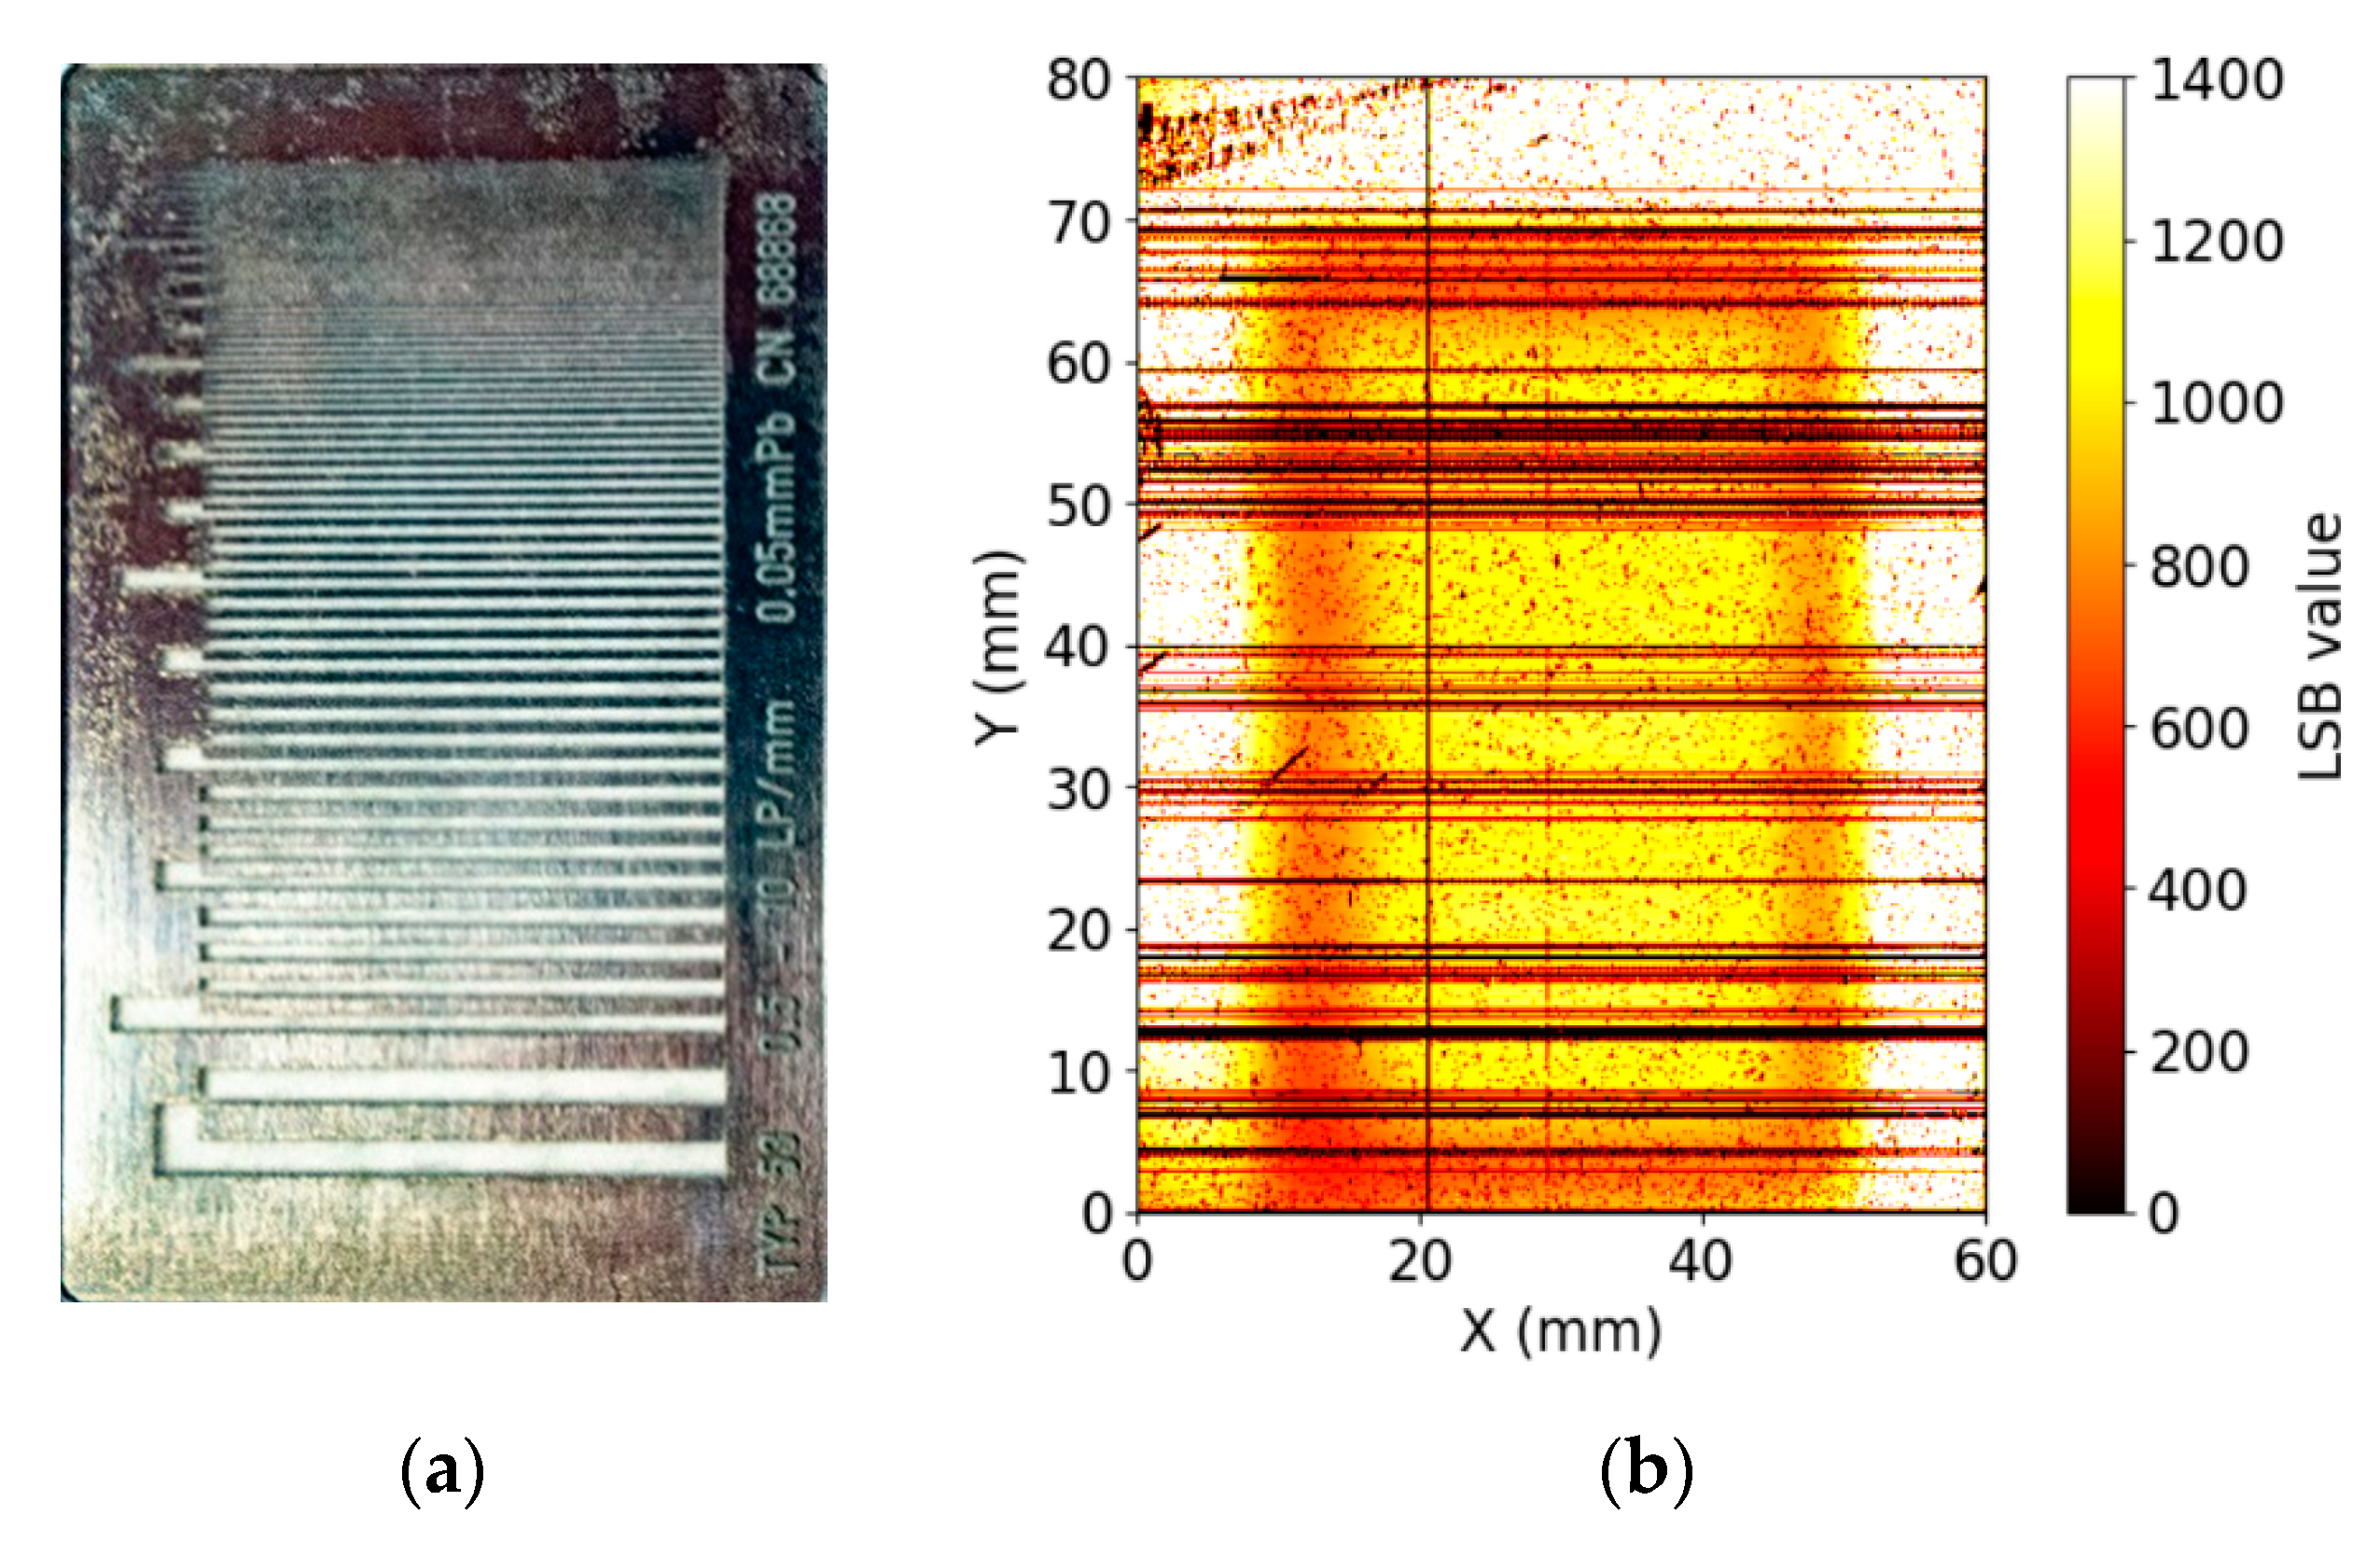
3.3.2. Line Spread Function

The study of the spatial resolution using the LSF method and the GEMPix was carried out using two copper plates of different thicknesses and hole patterns. Holes with a diameter smaller than 5 mm were imaged using a 1 mm thick plate placed in front of the GEMPix. Results with this mask and the LaGEMPix are not reported in this paper, as they do not provide additional information. This mask had 23 holes of several sizes and spacing. The results for three 1.3 mm holes spaced by 1 mm (edge to edge) are depicted in Figure 11. Following the FWHM criterion introduced in Section 3.2.2, we can conclude that two holes of 1.3 mm diameter at a distance of 1 mm (edge to edge) can be resolved. Measurements with the 3 mm thick copper plate and 5 mm diameter holes showed a spatial resolution of 5.23 ± 0.05 mm (FWHM). The results from the LSF method are summarized in Table 1.

3.3.3. Modulation Transfer Function

As for the LaGEMPix, we carried out a set of measurements using the lead mask model 53 (see Figure 9 and Figure 12). Contrary to the LaGEMPix, the GEMPix yielded an MTF below 10% at 1.4 LP/mm which corresponds to 0.71 mm, achieving the targeted submillimeter spatial resolution. The normalized MTF obtained by using Equation (2) is shown in Figure 13.

3.4. Spatial Resolution with GAFCHROMIC® Films

Effects not related to the detector itself can be studied with an “ideal” system of known spatial resolution, such as high resolution GAFCHROMIC® films. Film dosimetry is frequently classified as the gold standard for 2D dosimetry [33]. We selected GAFCHROMIC® XR-SP2 films that are appropriate for X-ray energies from 20 kV to 200 kV, and dose range from 0.5 mSv to 100 mSv. The film calibration was performed at the Institute of Radiation Physics (IRA) in Lausanne, Switzerland [55].
The experimental conditions were identical to those of the LaGEMPix measurements. For the edge response method (Section 3.2.1), we placed the lead block of 10 × 20 × 2.5 cm3 size covering a portion of the film. For the LSF response, the 3 mm thick copper plate with 5 mm diameter holes was also placed in front of the film (see Section 3.2.2 for details). The films were digitalized with an EPSON V800 scanner. The FWHM obtained by the edge response method is 0.86 ± 0.07 mm and the FWHM of a single 5 mm diameter hole is 5.09 ± 0.03 mm. The results and the comparison between the films and the GEM-based detectors are summarized and discussed in Section 4.

3.5. Spatial Resolution with the FLUKA Simulation

We performed three sets of simulations to compare the experimental values for both the ESF and LSF methods. The study includes the simulation of the 2.5 cm thick lead block described in Section 3.2.1, the 3 mm thick copper plate with 5 mm diameter holes (Section 3.2.2), and the 1 mm thick copper plate (Section 3.3.2). The latter had 23 holes of several sizes and spacing, simulated in such a way that the central hole was aligned to the center of the active area of the image sensor. The 3 mm thick plate was simulated at 7 mm from the Mylar window. The lead block and the 1 mm thick copper plate were simulated at 4 cm and 3.3 cm from the Mylar window, respectively. Figure 14 shows two of the simulated set-ups. In all cases, the source-detector distance was fixed at 230 cm with the minimum collimator aperture of 1 cm.

3.5.1. Edge Spread Function

Figure 15 shows the ESF for 40 kV X-rays. The ESF was determined by projecting the edge profile in the direction perpendicular to the edge. The spatial resolution was then estimated by fitting the measured ESF by the logistic function of Equation (1). The data points were shifted to center the distribution at the center of the image sensor; the bin size is 0.25 μm (twice the pixel size). When limiting the fit to the full active area of the sensor (6 cm along the x-axis), the estimated value of the FWHM is 4.53 ± 0.01 mm (statistical errors only).

3.5.2. Line Spread Function

The results from the LSF method and the 1 mm thick copper plate are summarized in Table 2. The number of primaries was chosen such that the statistical uncertainties were smaller than 5%. The spatial resolution was estimated by fitting the LSF by a Gaussian function and measuring the FWHM of the central 6 mm diameter holes, the 6 mm hole at the top of the plate, the three 3 mm holes separated by 4 mm pitch and the 1.3 mm holes separated by 2.5 mm pitch (see Figure 16).
The profiles obtained for the three 1.3 mm holes separated by 1 mm (distance calculated from edge to edge) are shown in Figure 17. The three holes are perfectly resolvable following the FWHM criterion; the calculated hole diameter is smaller than or of the order of the hole. This implies that the spatial resolution is better than the hole size. Similar results were obtained with 3 mm thick copper plate and 5 mm diameter holes, which showed a spatial resolution of 4.87 ± 0.03 mm (FWHM).

4. Discussion on the Spatial Resolution

The spatial resolution of the LaGEMPix was evaluated, using different methods and experimental configurations. The results are summarized in Table 3. The measurements with the lead block (ESF) yielded a spatial resolution of 9.70 ± 0.09 mm for 40 kV X-rays. On the other hand, the LSF method showed that the detector can resolve two 5 mm holes separated by 3 mm. This suggests that the ESF method reported here underestimates the spatial resolution of the LaGEMPix, whose intrinsic spatial resolution is better than 9.70 ± 0.09 mm. It also means that the results obtained from the different methods cannot be directly compared. Additionally, the MTF measurements only allow to conclude that slits at 2 mm distance cannot be distinguished. These results show that the spatial resolution of the current LaGEMPix does not fulfil the criterion of sub-millimeter resolution for hadron therapy and that the exact value depends on the method applied to evaluate the spatial resolution.
In order to disentangle the effects on the spatial resolution from different sources, such as the experimental setup, electron diffusion in the gas, and isotropic emission of photons in the detector, measurements were performed with the GEMPix and GAFCHROMIC® XR-SP2 films. Table 3 summarizes the values of spatial resolution obtained for the various detectors and experimental configurations. As expected, the GAFCHROMIC® films show the best spatial resolution. The edge response worsens from 0.86 mm with the film to 5.20 mm with the GEMPix, while slight differences are observed with the LSF method. In both cases, holes separated by a distance of 1 mm can still be resolved. The GEMPix yielded an MTF below 10% at 1.4 LP/mm. The ESF of the LaGEMPix and the FWHM of a 5 mm hole are higher than with the GEMPix. A further decrease in the spatial resolution is observed with the LaGEMPix, associated to the isotropic emission of scintillation photons. The results show that with the current design of the LaGEMPix, holes at a distance of 1 mm can no longer be resolved; the MTF method also shows that slits spaced by 2 mm cannot be resolved.
Finally, the results of a FLUKA Monte Carlo simulation of the LaGEMPix were compared with the experimental results. Unsurprisingly, the resolution obtained from the simulation is much better than the experimental one. This can be explained by the fact that the simulation does not take into account some phenomena associated with the detector working principle, such as the isotropic emission of the scintillation photons. On the other hand, the simulation predictions agree with the GEMPix results. This implies that (1) the simulation is able to reproduce the experimental results where only electrons are involved in the final image, (2) the isotropic emission of the scintillation light introduces an additional blurring in the image, and (3) other effects not included in the simulation, such as electron diffusion and recombination, seem to have a little effect on the spatial resolution. It can also be concluded that even for an ideal triple-GEM detector, where only primary energy depositions are taken into consideration, a sub-millimeter spatial resolution is not reachable. Similar results were obtained for 30 kV X-rays. The edge response method underestimates the resolution of the detector as compared to the other methods. This effect can be caused by the electron mean free path in the gas that introduces an additional blur to the image.

5. Conclusions

In this paper, we present for the first time the characterization of a GEM-based detector with optical readout based on a matrix of OPDs fabricated on top of a TFT backplane using low energy X-rays. The results presented in this paper show that the current LaGEMPix prototype achieves a spatial resolution of a few millimeters. The value obtained from the ESF using a 2.5 cm lead block underestimates the intrinsic spatial resolution when comparing it to the ability of the detector to resolve features such as two holes spaced by 3 mm. Similar conclusions can be extracted from the GEMPix measurements and the FLUKA simulation.
Several avenues of investigation are being explored to improve the spatial resolution and reach the desired target for QA in hadron therapy. Considering the better spatial resolution obtained with the GEMPix, the major limitation to the spatial resolution stems from the isotropic emission of the photons, and its effect on the spatial resolution depends on the distance between the places of production and detection of the photons. Therefore, a new detector prototype is under design in which the distance between GEM3 and the readout is reduced from 3 to 1.5 mm. To further improve on spatial resolution, an optical collimator film could be placed between the ITO on quartz and the thin-film imager, such that emitted photons under larger off-normal angles to the imaging plane are prevented to reach the optical imager frontplane.
Another general improvement is to employ a different type of OPD to increase the signal strength by providing a better match between the emission spectrum in the gas and the acceptance spectrum of the OPD. The ITO transparent anode with the fused quartz substrate will be replaced by the ITO coated fused silica glass following results of recent measurements [57]. Measurements with clinical hadron beams are also planned in the future.
An alternative solution currently being assessed is to eliminate the OPD frontplane, leaving a TFT-only electronic readout. With this approach, secondary electrons produced in the avalanche would be directly measured by the readout, yielding an even more compact and possibly more efficient device with a higher signal-to-noise ratio. In this case, a sub-millimeter resolution can be expected based on the MTF results obtained with the GEMPix.

Author Contributions

All the authors conceptualized the system, A.J.J.M.v.B.; H.B.A.; I.K.; B.P. and F.M. contributed to the design and construction of the prototype with the help of A.M.O., L.G.M. and J.L. for the merging. A.M.O., N.H., L.G.M. and J.L. developed the methodology; A.M.O., N.H. and B.P. developed the software, A.M.O. collected the data and was responsible for the data curation, A.M.O. and N.H. contributed to the formal data analysis, A.M.O., N.H. and L.G.M. validated the data; L.G.M. performed the FLUKA Monte Carlo simulations; A.M.O., J.L., L.G.M. and N.H. conducted the investigation process, specifically performing the experiments. A.M.O. prepared the original draft and L.G.M. wrote Section 2.5 and Section 3.5.; M.S. and S.B. supervised the research activities. M.S. and N.H. acquired the financial support for the project leading to this publication. All the authors revised the paper. All authors have read and agreed to the published version of the manuscript.

Funding

This project has received funding from the ATTRACT project funded by the EC under Grant Agreement 777222. The project has also been supported by CERN’s Budget for Knowledge Transfer to Medical Applications. Andreia Maia Oliveira was co-supported by a grant from FCT with reference SFRH/BEST/142965/2018.

Acknowledgments

The authors wish to thank: Rui de Oliveira for the special design of the GEM foils; Pierre Carbonez and Alix Chantelauze for granting us access to the Calibration Laboratory of CERN Radiation Protection Group; Pierre Carbonez, Thierry Buchillier, Claude Bailat and Jerome Damet for the calibration measurements with GAFCHROMIC® films performed at the Institute of Radiation Physics (IRA) in Lausanne, Switzerland; Florian Brunbauer for providing the MTF mask and for the useful discussions; the people from Holst Centre’s Gen1 R&D TFT pilot line and Santhosh Shanmugam for their contributions in thin-film imager fabrication.

Conflicts of Interest

The authors declare no conflict of interest. The funders had no role in the design of the study; in the collection, analyses, or interpretation of data; in the writing of the manuscript, or in the decision to publish the results.

References

  1. Particle Therapy Facilities in Clinical Operation. Available online: https://www.ptcog.ch/index.php/facilities-in-operation (accessed on 17 January 2021).
  2. Ishikawa, H.; Nakai, K.; Nonaka, T.; Sakurai, H. Particle Therapy in Cancer Treatment-Current and Future Perspective. Gan to kagaku ryoho. Cancer Chemother. 2019, 46, 1219–1225. [Google Scholar]
  3. Rana, S.; Bennouna, J.; Samuel, E.J.J.; Gutierrez, A.N. Development and Long-Term Stability of a Comprehensive Daily QA Program for a Modern Pencil Beam Scanning (PBS) Proton Therapy Delivery System. J. Appl. Clin. Med Phys. 2019, 20, 29–44. [Google Scholar] [CrossRef] [Green Version]
  4. Sauli, F. The Gas Electron Multiplier (GEM): Operating Principles and Applications. Nucl. Instrum. Methods Phys. Res. Sect. A Accel. Spectrometers Detect. Assoc. Equip. 2016, 805, 2–24. [Google Scholar] [CrossRef]
  5. Leidner, J.; Ciocca, M.; Mairani, A.; Murtas, F.; Silari, M. A GEMPix-Based Integrated System for Measurements of 3D Dose Distributions in Water for Carbon Ion Scanning Beam Radiotherapy. Med. Phys. 2020, 47, 2516–2525. [Google Scholar] [CrossRef] [PubMed] [Green Version]
  6. Leidner, J.; Murtas, F.; Silari, M. Medical Applications of the GEMPix. Appl. Sci. 2021, 11, 440. [Google Scholar] [CrossRef]
  7. Mirandola, A.; Molinelli, S.; Vilches Freixas, G.; Mairani, A.; Gallio, E.; Panizza, D.; Russo, S.; Ciocca, M.; Donetti, M.; Magro, G.; et al. Dosimetric Commissioning and Quality Assurance of Scanned Ion Beams at the Italian National Center for Oncological Hadrontherapy. Med. Phys. 2015, 42, 5287–5300. [Google Scholar] [CrossRef] [PubMed]
  8. Grevillot, L.; Osorio Moreno, J.; Letellier, V.; Dreindl, R.; Elia, A.; Fuchs, H.; Carlino, A.; Kragl, G.; Palmans, H.; Vatnitsky, S.; et al. Clinical Implementation and Commissioning of the MedAustron Particle Therapy Accelerator for Non-Isocentric Scanned Proton Beam Treatments. Med. Phys. 2020, 47, 380–392. [Google Scholar] [CrossRef] [PubMed]
  9. Van de Weijer, P.; Akkerman, H.B. Spotless Hybrid Thin-Film Encapsulation Stack for Organic Light-Emitting Diodes on Organic Foils. Org. Electron. 2019, 66, 43–46. [Google Scholar] [CrossRef]
  10. Bencivenni, G.; Felici, G.; Murtas, F.; Valente, P.; Bonivento, W.; Cardini, A.; Lai, A.; Pinci, D.; Saitta, B.; Bosio, C. A Triple GEM Detector with Pad Readout for High Rate Charged Particle Triggering. Nucl. Instrum. Methods Phys. Res. Sect. A Accel. Spectrometers Detect. Assoc. Equip. 2002, 488, 493–502. [Google Scholar] [CrossRef]
  11. Brunbauer, F.M. Applications of Gas Scintillation Properties in Optically Read out GEM-Based Detectors; Technical University of Vienna: Vienna, Austria, 2018. [Google Scholar]
  12. Indium Tin Oxide Glass. Available online: http://www.visionteksystems.co.uk/ito_glass_datasheet.htm (accessed on 21 February 2021).
  13. Fraga, M.; Fraga, F.; Fetal, S.T.G.; Margato, L.; Marques, R.; Policarpo, A. The GEM Scintillation in He-CF 4, Ar-CF 4, Ar-TEA and Xe-TEA Mixtures. Nucl. Instrum. Methods Phys. Res. A 2003, 504, 88–92. [Google Scholar] [CrossRef]
  14. Timmer, J.; Van Vuure, T.; Bom, V.; Eijk, C.W.E.; de Haas, J.; Schippers, J. A Scintillating GEM for 2D-Dosimetry in Radiation Therapy. Nucl. Instrum. Methods Phys. Res. A 2002, 478, 98–103. [Google Scholar] [CrossRef]
  15. Pansky, A.; Breskin, A.; Buzulutskov, A.; Chechik, R.; Elkind, V.; Va’vra, J. The Scintillation of CF4 and Its Relevance to Detection Science. Nucl. Instrum. Methods Phys. Res. A 1995, 354, 262–269. [Google Scholar] [CrossRef] [Green Version]
  16. Hamamatsu. Image Sensors. Available online: https://www.hamamatsu.com/resources/pdf/ssd/image_sensor_kmpd0002e.pdf (accessed on 4 July 2021).
  17. Hamamatsu. Handbook Image Sensors—Chapter 5. Available online: https://www.hamamatsu.com/resources/pdf/ssd/e05_handbook_image_sensors.pdf (accessed on 3 July 2021).
  18. Seravalli, E.; de Boer, M.R.; Geurink, F.; Huizenga, J.; Kreuger, R.; Schippers, J.M.; van Eijk, C.W.E. 2D Dosimetry in a Proton Beam with a Scintillating GEM Detector. Phys. Med. Biol. 2009, 54, 3755–3771. [Google Scholar] [CrossRef]
  19. Klyachko, A.V.; Moskvin, V.; Nichiporov, D.F.; Solberg, K.A. A GEM-Based Dose Imaging Detector with Optical Readout for Proton Radiotherapy. Nucl. Instrum. Methods Phys. Res. A 2012, 694, 271–279. [Google Scholar] [CrossRef]
  20. Kronemeijer, A.J.; Akkerman, H.; van der Steen, J.-L.; Steudel, S.; Pendyala, R.; Panditha, P.; Bel, T.; van Diesen, K.; de Haas, G.; Maas, J.; et al. P-127: Dual-Gate Self-Aligned IGZO TFTs Monolithically Integrated with High-Temperature Bottom Moisture Barrier for Flexible AMOLED. In SID Symposium Digest of Technical Papers; SID: Los Angeles, CA, USA, 2018; pp. 1577–1580. Volume 49. [Google Scholar] [CrossRef]
  21. Tordera, D.; Peeters, B.; Akkerman, H.B.; van Breemen, A.J.J.M.; Maas, J.; Shanmugam, S.; Kronemeijer, A.J.; Gelinck, G.H. A High-Resolution Thin-Film Fingerprint Sensor Using a Printed Organic Photodetector. Adv. Mater. Technol. 2019, 4, 1900651. [Google Scholar] [CrossRef]
  22. Kielar, M.; Dhez, O.; Pecastaings, G.; Curutchet, A.; Hirsch, L. Long-Term Stable Organic Photodetectors with Ultra Low Dark Currents for High Detectivity Applications. Sci. Rep. 2016, 6, 39201. [Google Scholar] [CrossRef] [Green Version]
  23. Sauli, F. GEM: A New Concept for Electron Amplification in Gas Detectors. Nucl. Instrum. Methods Phys. Res. A 1997, 386, 531–534. [Google Scholar] [CrossRef]
  24. Brunbauer, F.M.; Garcia, F.; Korkalainen, T.; Lugstein, A.; Lupberger, M.; Oliveri, E.; Pfeiffer, D.; Ropelewski, L.; Thuiner, P.; Schinnerl, M. Combined Optical and Electronic Readout for Event Reconstruction in a GEM-Based TPC. IEEE Trans. Nucl. Sci. 2018, 65, 913–918. [Google Scholar] [CrossRef]
  25. Brugger, M.; Carbonez, P.; Pozzi, F.; Silari, M.; Vincke, H. New Radiation Protection Calibration Facility at CERN. Radiat. Prot. Dosim. 2014, 161, 181–184. [Google Scholar] [CrossRef] [Green Version]
  26. Tektronix. Model 6517A Electrometer User’s Manual Rev. C. Available online: https://www.tek.com/manual/model-6517a-electrometer-users-manual-rev-d-manual (accessed on 23 February 2021).
  27. Curioni, A.; Dinar, N.; La Torre, F.P.; Leidner, J.; Murtas, F.; Puddu, S.; Silari, M. Measurements of 55Fe Activity in Activated Steel Samples with GEMPix. Nucl. Instrum. Methods Phys. Res. 2017, 849, 60–71. [Google Scholar] [CrossRef]
  28. Molinelli, S.; Mairani, A.; Mirandola, A.; Vilches Freixas, G.; Tessonnier, T.; Giordanengo, S.; Parodi, K.; Ciocca, M.; Orecchia, R. Dosimetric Accuracy Assessment of a Treatment Plan Verification System for Scanned Proton Beam Radiotherapy: One-Year Experimental Results and Monte Carlo Analysis of the Involved Uncertainties. Phys. Med. Biol. 2013, 58, 3837–3847. [Google Scholar] [CrossRef] [PubMed]
  29. Winter, J.; Ellerbrock, M.; Jäkel, O.; Greilich, S.; Bangert, M. Analytical Modeling of Depth-Dose Degradation in Heterogeneous Lung Tissue for Intensity-Modulated Proton Therapy Planning. Phys. Imaging Radiat. Oncol. 2020, 14, 32–38. [Google Scholar] [CrossRef] [PubMed]
  30. PTW Freiburg GmbH. Radiation Therapy. Available online: https://www.ptwdosimetry.com/en/solutions/radiation-therapy/ (accessed on 21 February 2021).
  31. GmbH. IBA Dosimetry. Available online: https://www.iba-dosimetry.com/ (accessed on 21 February 2021).
  32. Giordanengo, S.; Palmans, H. Dose Detectors, Sensors, and Their Applications. Med Phys. 2018, 45, e1051–e1072. [Google Scholar] [CrossRef] [PubMed] [Green Version]
  33. Grevillot, L.; Stock, M.; Palmans, H.; Osorio Moreno, J.; Letellier, V.; Dreindl, R.; Elia, A.; Fuchs, H.; Carlino, A.; Vatnitsky, S. Implementation of Dosimetry Equipment and Phantoms at the MedAustron Light Ion Beam Therapy Facility. Med. Phys. 2018, 45, 352–369. [Google Scholar] [CrossRef]
  34. Russo, S.; Mirandola, A.; Molinelli, S.; Mastella, E.; Vai, A.; Magro, G.; Mairani, A.; Boi, D.; Donetti, M.; Ciocca, M. Characterization of a Commercial Scintillation Detector for 2-D Dosimetry in Scanned Proton and Carbon Ion Beams. Phys. Med. 2017, 34, 48–54. [Google Scholar] [CrossRef]
  35. ISO. ISO 12233:2017, Photography—Electronic Still Picture Imaging—Resolution and Spatial Frequency Responses; ISO: Geneva, Switzerland, 2017. [Google Scholar]
  36. Gopal, A.; Samant, S.S. Validity of the Line-Pair Bar-Pattern Method in the Measurement of the Modulation Transfer Function (MTF) in Megavoltage Imaging. Med Phys. 2008, 35, 270–279. [Google Scholar] [CrossRef]
  37. Smith, S.W. The Scientist and Engineer’s Guide to Digital Signal Processing; California Technical Pub.: San Diego, CA, USA, 1999; pp. 423–432. ISBN 9780966017649. [Google Scholar]
  38. Roque, R.; Carramate, L.; Amaro, F.; Natal da Luz, H.; Mir, J.A.; Azevedo, C.D.R. Spatial Resolution Properties of Krypton-Based Mixtures Using a 100 Μm Thick Gas Electron Multiplier. In Proceedings of the XRS 2018, Ljubljana, Slovenia, 26–29 June 2018. [Google Scholar]
  39. Jakubek, J.; Holy, T.; Lehmann, E.; Pospisil, S.; Uher, J.; Vacik, J.; Vavrik, D.; Andrikos, I.O. Properties of Neutron Pixel Detector Based on Medipix-2 Device. In Proceedings of the IEEE Symposium Conference Record Nuclear Science 2004, Rome, Italy, 16–22 October 2004; Volume 2, p. 949. [Google Scholar]
  40. Fujiwara, T.; Mitsuya, Y.; Fushie, T.; Murata, K.; Kawamura, A.; Koishikawa, A.; Toyokawa, H.; Takahashi, H. Gas Scintillation Glass GEM Detector for High-Resolution X-Ray Imaging and CT. Nucl. Instrum. Methods Phys. Res. A 2017, 850, 7–11. [Google Scholar] [CrossRef]
  41. Li, T.; Feng, H.; Xu, Z.; Li, X.; Cen, Z.; Li, Q. Comparison of Different Analytical Edge Spread Function Models for MTF Calculation Using Curve-Fitting. Proc. SPIE 2009, 7498. [Google Scholar] [CrossRef]
  42. Energy Resolution Due to Thermal Broadening (STM). Available online: https://shunchi100.wordpress.com/physics-research/energy-resolution-thermal-broadening/ (accessed on 23 February 2021).
  43. Alvarez, M.; Alves, A.; Neto, F.B.; Pavan, A.L.; Rosa, M.; Miranda, J.R.D.A.; de Pina, D.R. Comparison of Bar Pattern and Edge Method for MTF Measurement in Radiology Quality Control. Rev. Bras. Fis. Med. 2015, 9, 2–5. [Google Scholar] [CrossRef]
  44. ISO. ISO 4037-2:2019. Radiological Protection—X and Gamma Reference Radiation for Calibrating Dosemeters and Doserate Meters and for Determining Their Response as a Function of Photon Energy—Part 2: Dosimetry for Radiation Protection over the Energy Ranges from 8 keV to 1,3 MeV and 4 MeV to 9 MeV; ISO: Geneva, Switzerland, 2019. [Google Scholar]
  45. The Official CERN FLUKA Website. Available online: https://fluka.cern/ (accessed on 23 February 2021).
  46. Battistoni, G.; Boehlen, T.; Cerutti, F.; Chin, P.W.; Esposito, L.S.; Fassò, A.; Ferrari, A.; Lechner, A.; Empl, A.; Mairani, A.; et al. Overview of the FLUKA Code. Ann. Nucl. Energy 2015, 82, 10–18. [Google Scholar] [CrossRef] [Green Version]
  47. Bohlen, T.T.; Cerutti, F.; Chin, M.P.W.; Fassò, A.; Ferrari, A.; Ortega, P.G.; Mairani, A.; Sala, P.R.; Smirnov, G.; Vlachoudis, V. The FLUKA Code: Developments and Challenges for High Energy and Medical Applications. Nucl. Data Sheets 2014, 120, 211–214. [Google Scholar]
  48. Marafini, M.; Patera, V.; Pinci, D.; Sarti, A.; Sciubba, A.; Spiriti, E. Optical Readout of a Triple-GEM Detector by Means of a CMOS Sensor. Nucl. Instrum. Methods Phys. Res. A 2016, 824, 562–564. [Google Scholar] [CrossRef]
  49. Ahmed, S.N. Position-sensitive detection and imaging. In Physics and Engineering of Radiation Detection, 1st ed.; Academic Press: Amsterdam, The Netherlands, 2007; pp. 423–463. ISBN 9780120455812. [Google Scholar]
  50. Seco, J.; Oumano, M.; Depauw, N.; Dias, M.F.; Teixeira, R.P.; Spadea, M.F. Characterizing the Modulation Transfer Function (MTF) of Proton/Carbon Radiography Using Monte Carlo Simulations. Med. Phys. 2013, 40, 091717. [Google Scholar] [CrossRef]
  51. Ghani, M.U.; Zhou, Z.; Ren, L.; Li, Y.; Zheng, B.; Yang, K.; Liu, H. Investigation of Spatial Resolution Characteristics of an in Vivo Micro Computed Tomography System. Nucl. Instrum. Methods Phys. Res. A 2016, 807, 129–136. [Google Scholar] [CrossRef] [PubMed]
  52. Mahesh, M. Image Quality. In The Essential Physics of Medical Imaging, 3rd ed.; LWW: Philadelphia, PA, USA, 2013; pp. 60–101. Volume 40. [Google Scholar]
  53. QUART X-ray QA QC Solutions. Line Pair Patterns—Test Phantoms. Available online: https://quart.de/en/products/test-phantoms/resolution-patterns/line-pair-patterns (accessed on 6 June 2021).
  54. Murtas, F. The GEMPix Detector. Radiat. Meas. 2020, 138, 106421. [Google Scholar] [CrossRef]
  55. Jaccard, M.; Petersson, K.; Buchillier, T.; Bailat, C.; Germond, J.F.; Moeckli, R.; Bourhis, J.; Vozenin, M.C.; Bochud, F. EP-1494: Absolute Dosimetry with EBT3 Gafchromic Films in a Pulsed Electron Beam at High Dose-Rate. Radiother. Oncol. 2016, 119, S690. [Google Scholar] [CrossRef] [Green Version]
  56. Vlachoudis, V. Flair: A Powerful but User Friendly Graphical Interface for FLUKA. In Proceedings of the Conference on Mathematics, Computational Methods & Reactor Physics (M&C 2009), Saratoga Springs, NY, USA, 3–7 May 2009. [Google Scholar]
  57. Maia Oliveira, A.; Braccini, S.; Casolaro, P.; Heracleous, N.; Leidner, J.; Mateu, I.; Murtas, F.; Silari, M. Radiation-Induced Effects in Glass Windows for Optical Readout GEM-Based Detectors. arXiv 2021, arXiv:2106.04645. Available online: https://arxiv.org/abs/2106.04645 (accessed on 9 June 2021).
Figure 1. Schematic drawing of the LaGEMPix (to scale). Electrons produced in the drift gap between the Mylar window and the top GEM (GEM1) are multiplied in the triple-GEM stack and collected on the transparent indium tin oxide (ITO) glass anode. Scintillation photons of certain wavelengths pass through the ITO glass and are detected by the image sensor.
Applsci 11 06459 g001
Figure 2. The first LaGEMPix prototype: (1) flex gate driver integrated circuit; (2) flex Read-out Integrated Circuits (ROICs); (3) the triple-GEM 100 × 100 mm2 stack coupled to the optical readout with the thin Mylar window on top; (4) 3D-printed braces to hold together the triple-GEM detector and the image sensor; and (5) cables to connect the detector to the readout system.
Applsci 11 06459 g002
Figure 3. External Quantum Efficiency (EQE) (black curve and left axis) and Spectral Response (SR) (red curve and right axis) of the OPD layer deposited on the readout matrix. The broad emission band of Ar/CF4 with a peak at around 630 nm is represented by the orange region.
Applsci 11 06459 g003
Figure 4. Current at the anode as a function of the drift field strength. Initial configuration (red): transfer field 1 = 3.0 kV/cm; transfer field 2 = 3.0 kV/cm; induction field = 5.0 kV/cm. Final configuration (blue): transfer field 1 = 2.0 kV/cm; transfer field 2 = 1.75 kV/cm; induction field = 5.0 kV/cm. A drift field of 1 kV/cm was selected as it yielded the maximum signal. The uncertainties are smaller than the data points.
Applsci 11 06459 g004
Figure 5. (a) The LaGEMPix with a 2.5 cm thick lead block placed in front of the detector: (1) gas outlet; (2) the 100 × 100 mm2 triple-GEM stack coupled to the optical readout with the thin Mylar window on top; (3) 3D-printed braces to hold together the triple-GEM detector and the image sensor; (4) lead block; (5) cables to connect the detector to the readout system; (6) FPGA module; (7) custom-made support. (b) Heat map of the imager after irradiation with 40 kV X-rays.
Applsci 11 06459 g005
Figure 6. Edge response profile for 40 kV X-rays using a 2.5 cm thick lead block. The red line represents a logistic function fit to the data.
Applsci 11 06459 g006
Figure 7. (a) The 3 mm-thick copper plate used for the evaluation of the spatial resolution using the LSF method. The numbers written on the plate represent the space between the holes in millimeters. (b) Heat map of the copper mask for 40 kV X-rays. A ROI (green rectangle) was set on the holes separated by 3 mm. The spatial resolution was estimated by fitting the profile in the ROI by a Gaussian function.
Applsci 11 06459 g007
Figure 8. The line-average response profile of the 5 mm diameter holes spaced by 3 mm (edge to edge). The FWHM obtained by the Gaussian distribution is 7.10 ± 0.30 mm for the left hole and 6.80 ± 0.20 mm for the right hole. The distance (center-to-center fit) = 7.98 ± 0.23 mm was obtained by fitting the profile by a double Gaussian function.
Applsci 11 06459 g008
Figure 9. (a) Line pair mask type 53 made of 0.05 mm thick lead used as an imaging target. (b) Heat map of the MTF mask after irradiation with 30 kV X-rays.
Applsci 11 06459 g009
Figure 10. Edge response profile with the GEMPix for 40 kV X-rays obtained using a 2.5 cm-thick lead block. The red line represents a logistic function fit to the data. The signal fluctuations at around 1.4 cm are caused by the physical gap between the Timepix chips, which may lead to distortions of the electric field close to the edge. Other features, such as those around 1.7 and 1.9 cm, are due to imperfections in the detector that the equalization procedure cannot compensate for. These artefacts are most likely the result of radiation effects, as the detector was already used in several experiments with ionizing radiation.
Applsci 11 06459 g010
Figure 11. The line-average response profile of 1.3 mm diameter holes spaced by 1 mm (edge to edge). The FWHM of the Gaussian distribution of the three holes (Table 1) were obtained by fitting the profile by a triple Gaussian function.
Applsci 11 06459 g011
Figure 12. Heat map for 30 kV X-rays using a line pair mask type 53 as an imaging target in front of the GEMPix. For the normalization factor C0 in Equation (2), two regions were selected: the green rectangle on top of the first bar for the maximum pixel intensities and a black rectangle on the bottom part of the mask for the minimum.
Applsci 11 06459 g012
Figure 13. Measured MTF with mask type 53 by using Equation (2) for the GEMPix detector.
Applsci 11 06459 g013
Figure 14. The simulated LaGEMPix with the 2.5 cm thick lead block in front, at 4 cm distance from the Mylar window (a) and a 1 mm-thick copper plate placed at 3.3 cm from the Mylar window (b). The figures were produced using FLAIR [56] version 3.1-8, the FLUKA graphical user-interface.
Applsci 11 06459 g014
Figure 15. Simulated ESF for the edge projection fitted by a logistic function. The results were obtained for a detector-source distance of 230 cm, a beam aperture of 1 cm and 40 kV X-rays. The error bars are smaller than the data points.
Applsci 11 06459 g015
Figure 16. Image of the simulated energy deposition density in the drift gap. The solid yellow lines represent the selected regions for data analysis.
Applsci 11 06459 g016
Figure 17. One-dimensional projection of the 1.3 mm holes with 2.5 mm pitch. The LSF of the selected area gives a distribution with an average hole diameter of 1.47 mm.
Applsci 11 06459 g017
Table 1. Calculated FWHM of the 1D profiles for three regions of interest of the images obtained by the GEMPix and the 1 mm-thick copper plate.
FWHM (mm)
Ø HoleHole 1Hole 2Hole 3
6 mm6.60 ± 0.10--
3 mm3.08 ± 0.063.04 ± 0.093.46 ± 0.09
1.3 mm2.07 ± 0.051.49 ± 0.031.85 ± 0.03
Table 2. Calculated FWHM of the 1D profiles for the different regions of interest depicted in Figure 16.
FWHM (mm)
Ø HoleHole 1Hole 2Hole 3
6 mm5.70 ± 0.205.45 ± 0.115.26 ± 0.12
6 mm5.82 ± 0.13--
3 mm2.96 ± 0.172.99 ± 0.242.82 ± 0.16
1.3 mm1.32 ± 0.121.61 ± 0.161.48 ± 0.17
Table 3. Summary of the spatial resolution obtained for different experimental configurations and by different detectors. Results from the FLUKA Monte Carlo simulation are also included for comparison.
Spatial Resolution (mm)
DetectorEdge Response5 mm Cu HoleMinimum Resolvable Hole Spacing
LaGEMPix9.70 ± 0.096.73 ± 0.083 mm (edge to edge)
GEMPix5.20 ± 0.105.23 ± 0.051 mm 1 (edge to edge)
GAFCHROMIC®0.86 ± 0.075.09 ± 0.031 mm 1 (edge to edge)
FLUKA simulation of LaGEMPix4.53 ± 0.014.87 ± 0.031 mm 1 (edge to edge)
1 minimum distance between holes in the Cu plate.
Publisher’s Note: MDPI stays neutral with regard to jurisdictional claims in published maps and institutional affiliations.

