Article

Few-Cycle, μJ-Class, Deep-UV Source from Gas Media

1
Department of Physics and Center for Attosecond Science and Technology, POSTECH, Pohang 37673, Korea
2
Max Planck POSTECH/KOREA Research Initiative, Pohang 37673, Korea
*
Author to whom correspondence should be addressed.
These authors contributed equally to this work.
Appl. Sci. 2021, 11(14), 6440; https://doi.org/10.3390/app11146440
Submission received: 14 June 2021 / Revised: 7 July 2021 / Accepted: 9 July 2021 / Published: 13 July 2021

Abstract

:
Energetic, few-fs pulses in the deep-UV region are highly desirable for exploring ultrafast processes on their natural time scales, especially in molecules. The deep-UV source can be generated from gas media irradiated with few-cycle near-infrared laser pulses via a third-order frequency conversion process, which is a perturbative mechanism in a relatively weak field regime. In this work, we demonstrate that the deep-UV generation process is significantly affected by also even higher nonlinear processes, such as the ionization depletion of gas and plasma-induced spatiotemporal distortion of propagating light. In the experiment, by optimizing the deep-UV (3.6–5.7 eV) generation efficiency, the highest deep-UV energy of 1 μJ was observed from a moderately ionized 0.8-bar Ar gas target. The observed UV spectra exhibited frequency shifts depending on the experimental conditions—gas type, gas pressure, and the gas cell location—supporting the importance of the highly nonlinear mechanisms. The experimental observations were well corroborated by numerical simulations.

1. Introduction

When molecules are exposed to UV light, they become electronically excited or ionized, triggering a complex chain of events [1,2]. To study these complex interactions and obtain a comprehensive picture of the dynamic behavior of electronically excited states in molecules, ultrashort UV sources in the deep-UV regime are required. Over the last few decades, advances in laser technology have enabled us to produce table-top ultrashort sources that cover a broad spectral range, including visible (1.5 eV∼4 eV), deep- and vacuum-UV (4 eV∼9 eV), extreme-UV (10 eV∼100 eV), and the soft X-ray region (100 eV∼1 keV) [3,4,5,6,7,8]. Various techniques have been used to generate deep- and vacuum-UV sources [9,10,11,12,13,14,15,16]. Among them, UV generation methods from gas materials have been pursued over the previous few years, which include a method using four-wave mixing in a gas-filled kagomé-style photonic crystal fiber [17], methods exploiting extreme spectral broadening via soliton dynamics in gas-filled hollow capillary fibers [18,19], and third-harmonic generation (THG) methods [4,14,15]. In the THG experiments, μJ-class deep-UV generation using Ne gas at 7 bar has been demonstrated [4,14,15]. Recently, a sub-2-fs deep-UV source was realized by using Ar gas as a target [16].
The third-order polarizability P3, and the resultant THG can be understood to be a perturbative phenomenon with a simple analytic formulation, P3 χ ( 3 ) E 3 , where χ ( 3 ) and E are the third-order susceptibility of a material and a driving electric field, respectively. In contrast, the high-order harmonic generation (HHG) is a literally, highly non-perturbative process in which freed electrons influence the propagation of the driving NIR field, affecting its spatiotemporal properties and the coherent properties of the generated XUV via a phase-matching effect. Due to the highly nonlinear nature, it is sensitive to experimental conditions, especially to the target position with respect to the laser focus [20,21,22]. It has been reported that the short-trajectory components are well phase-matched in the beam center, when the gas target is located slightly after the focus [22,23]. While THG is a perturbative process in principle, relevant studies have shown that highly non-perturbative processes, such as field ionization and plasma effects, play essential roles [4]. In THG, the properties of the generated UV pulse, such as the pulse duration, spectrum, and beam shape, are influenced by highly nonlinear processes. Despite the importance of nonlinear dynamics, however, the cell position dependence, which has been intensively studied for HHG, has not been reported in studies on THG thus far. Previous studies on THG have discussed the underlying optical mechanisms when the gas cell is placed near/at the laser focus [4,14,15,16].
In this work, we measured the deep-UV (DUV) yields and the spectra in various conditions—the gas type, gas pressure, and gas cell location—clarifying not only the optimum conditions for the highest DUV yield, but also the role of highly nonlinear optical processes on the DUV generation efficiencies and spectra. In particular, depending on the cell position with respect to the laser focus, different energy yields and spectra were observed, which was not reported in the previous studies. In our experimental conditions, the highest DUV yield of 1 μJ was observed from Ar gas at a low pressure of 0.8 bar. The underlying physical mechanisms are explained by numerical simulations.

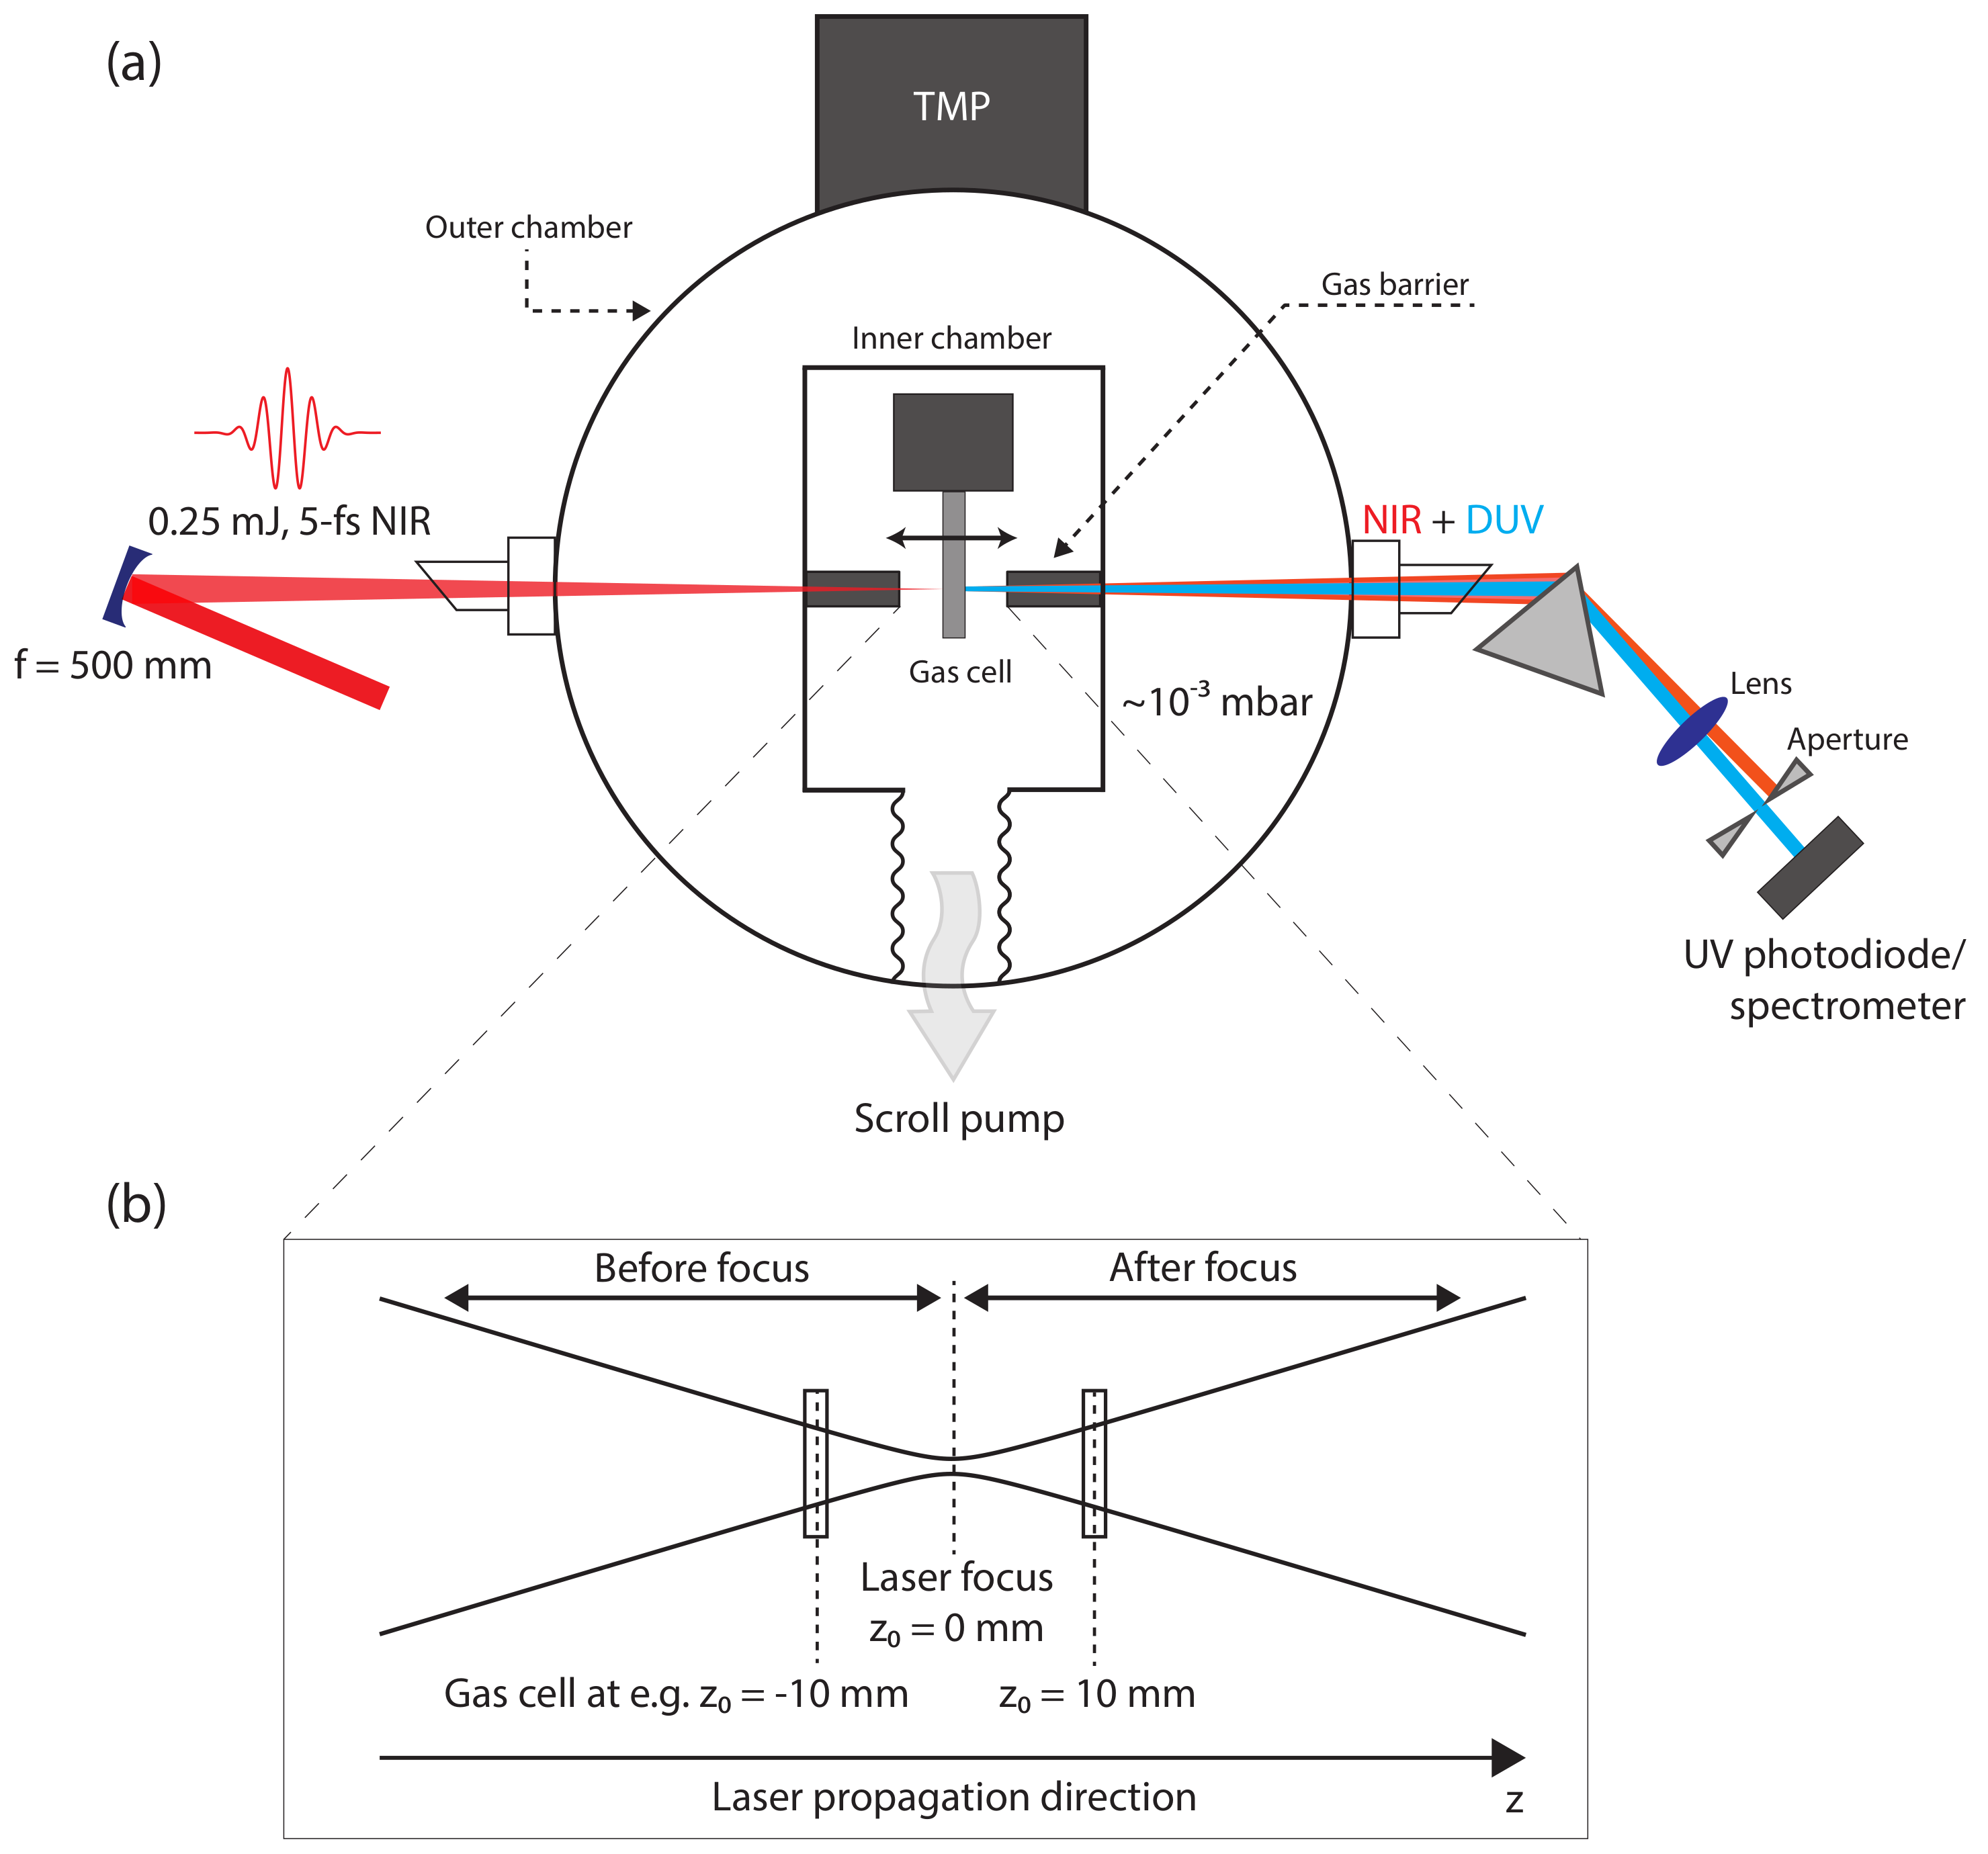
2. Experimental Setup and Methods

A 30 fs, 780 nm NIR laser was loosely focused to a 1 m-long hollow-core fiber (HCF) with 400 μm of the inner diameter, which was filled with 3 bar Ne gas. The generated supercontinuum laser was temporally compressed by a set of chirped mirrors and a fused silica wedge pair. Consequently, a 5 fs, 0.25 mJ NIR laser with a mean photon energy of 1.7 eV was obtained. The laser was operated with a 3 kHz repetition. The mean photon energy was defined by the median of the spectral intensity distribution. The dispersion scan (Dscan) method was used to measure the pulse duration [24].
An f = 500 mm spherical mirror was used to focus the few-cycle laser into the quasi-static gas cell (3 mm thick inner diameter, 300 μm hole diameter), as shown schematically in Figure 1. The beam size at the focus was measured to be ∼100 μm in diameter (full width at 1/e2 maximum). The estimated peak intensity at the focus was on the order of ∼ 1.2 × 10 15 W/cm2. The gas cell was placed on a motorized XYZ stage so that the central location of the gas cell with respect to the laser focus could be controlled in vacuum. Using a UV-grade fused silica prism and an aperture, the generated third-order harmonics were separated from the fundamental NIR laser and collected by a lens to an absolutely calibrated UV photodiode for energy measurements, or to a UV-NIR (200–1100 nm) spectrometer for spectrum measurements. The tightest focus position ( z 0 = 0 mm) was determined by measuring the transmitted NIR spectra as a function of the cell position when 0.2 bar Ar gas was supplied to the cell (Figure 2a). The gas cell position in the laser propagation direction was changed by the motorized linear stage on which the entire gas cell unit was mounted. The absolute focus position ( z 0 = 0) was judged as 18.25 mm (Figure 2b) at which the largest spectral blue-shift was observed. Then, the generated DUV energies were measured by changing the cell position ( z 0 ). We note again that the gas cell at z0 = 0 mm means that the gas cell is positioned at the laser focus, and a negative z 0 value indicates the gas cell location being in front of the laser focus.

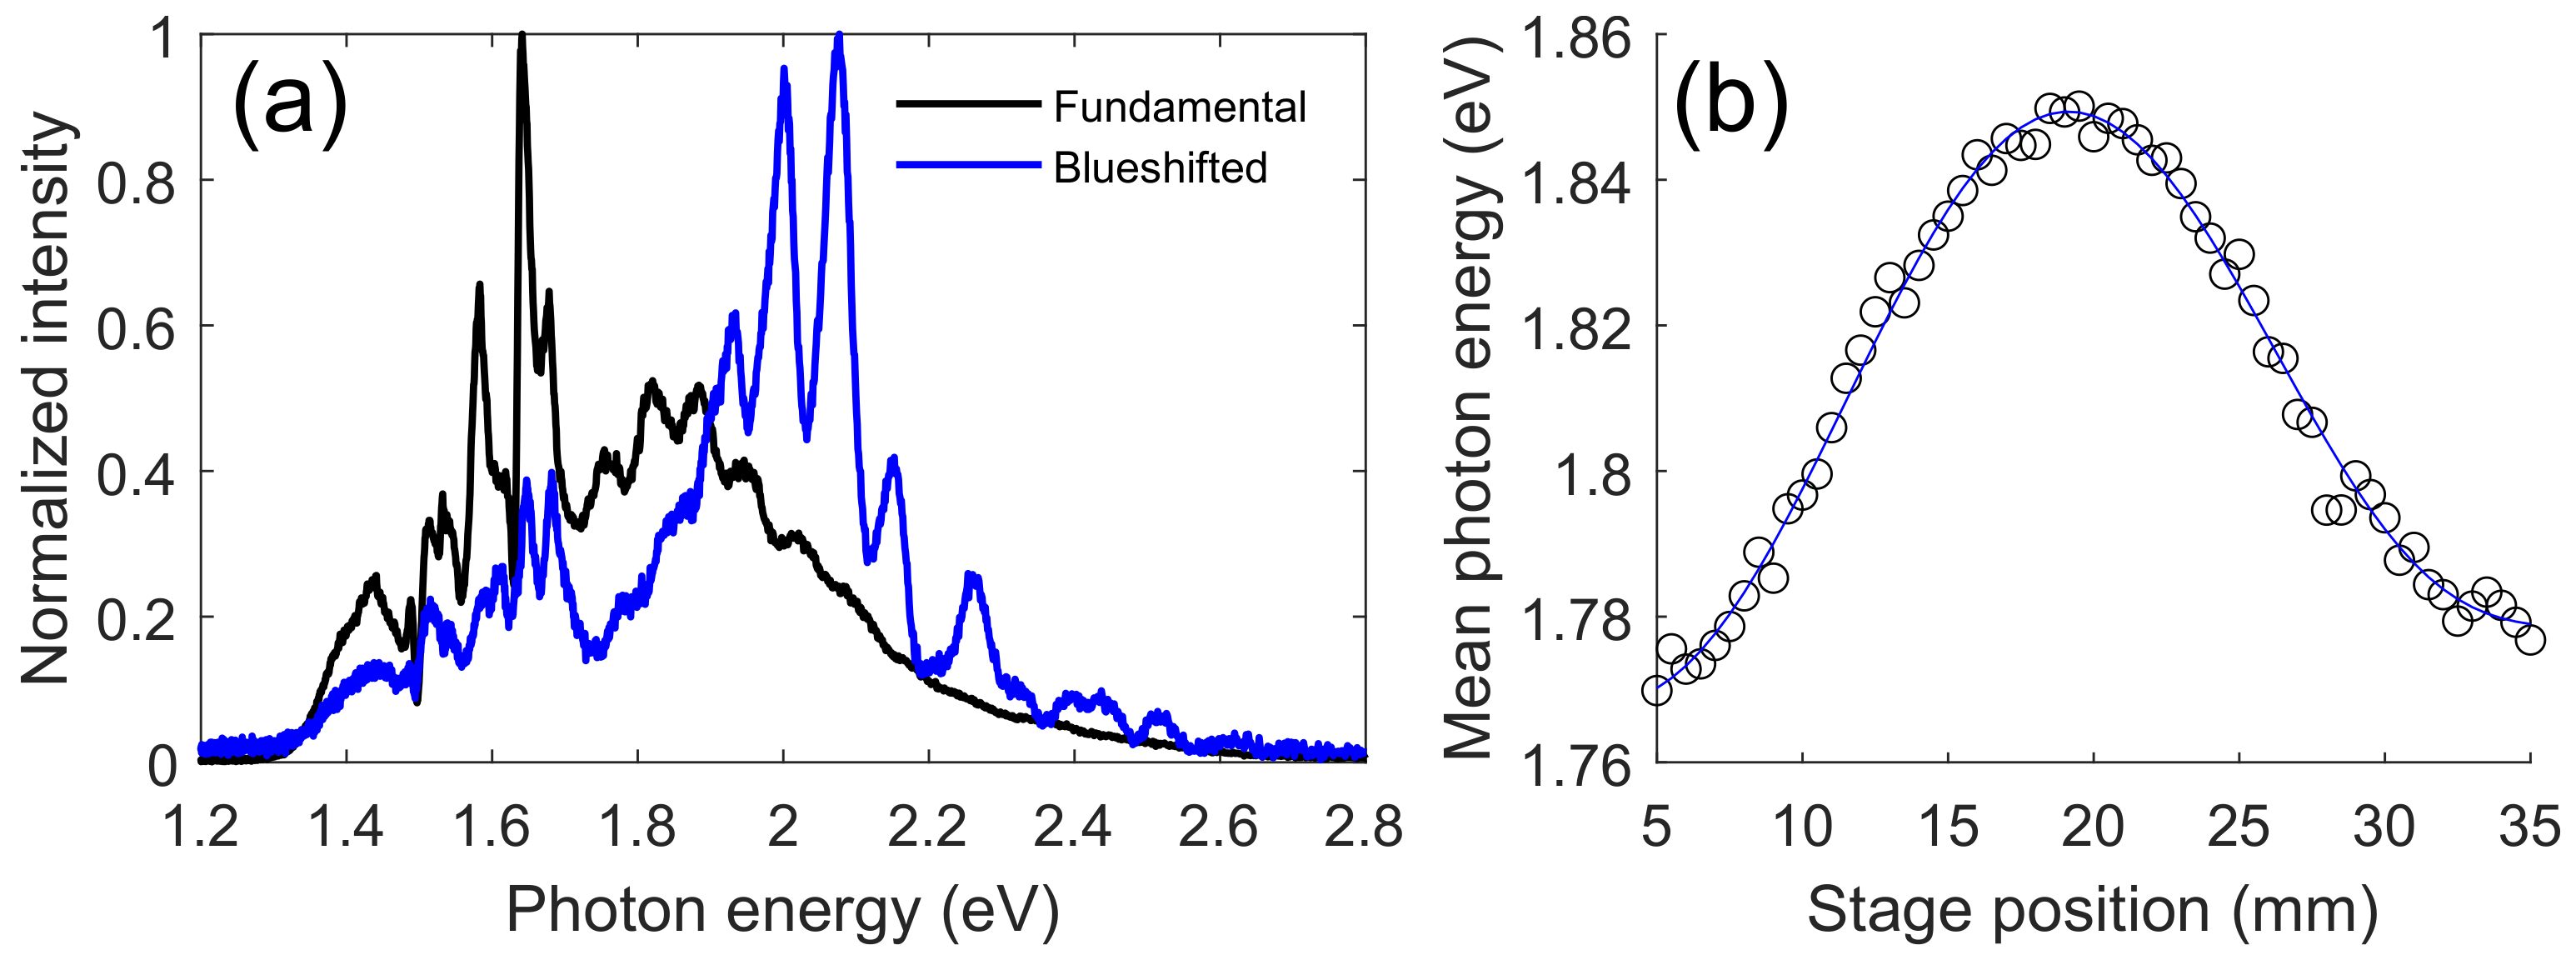
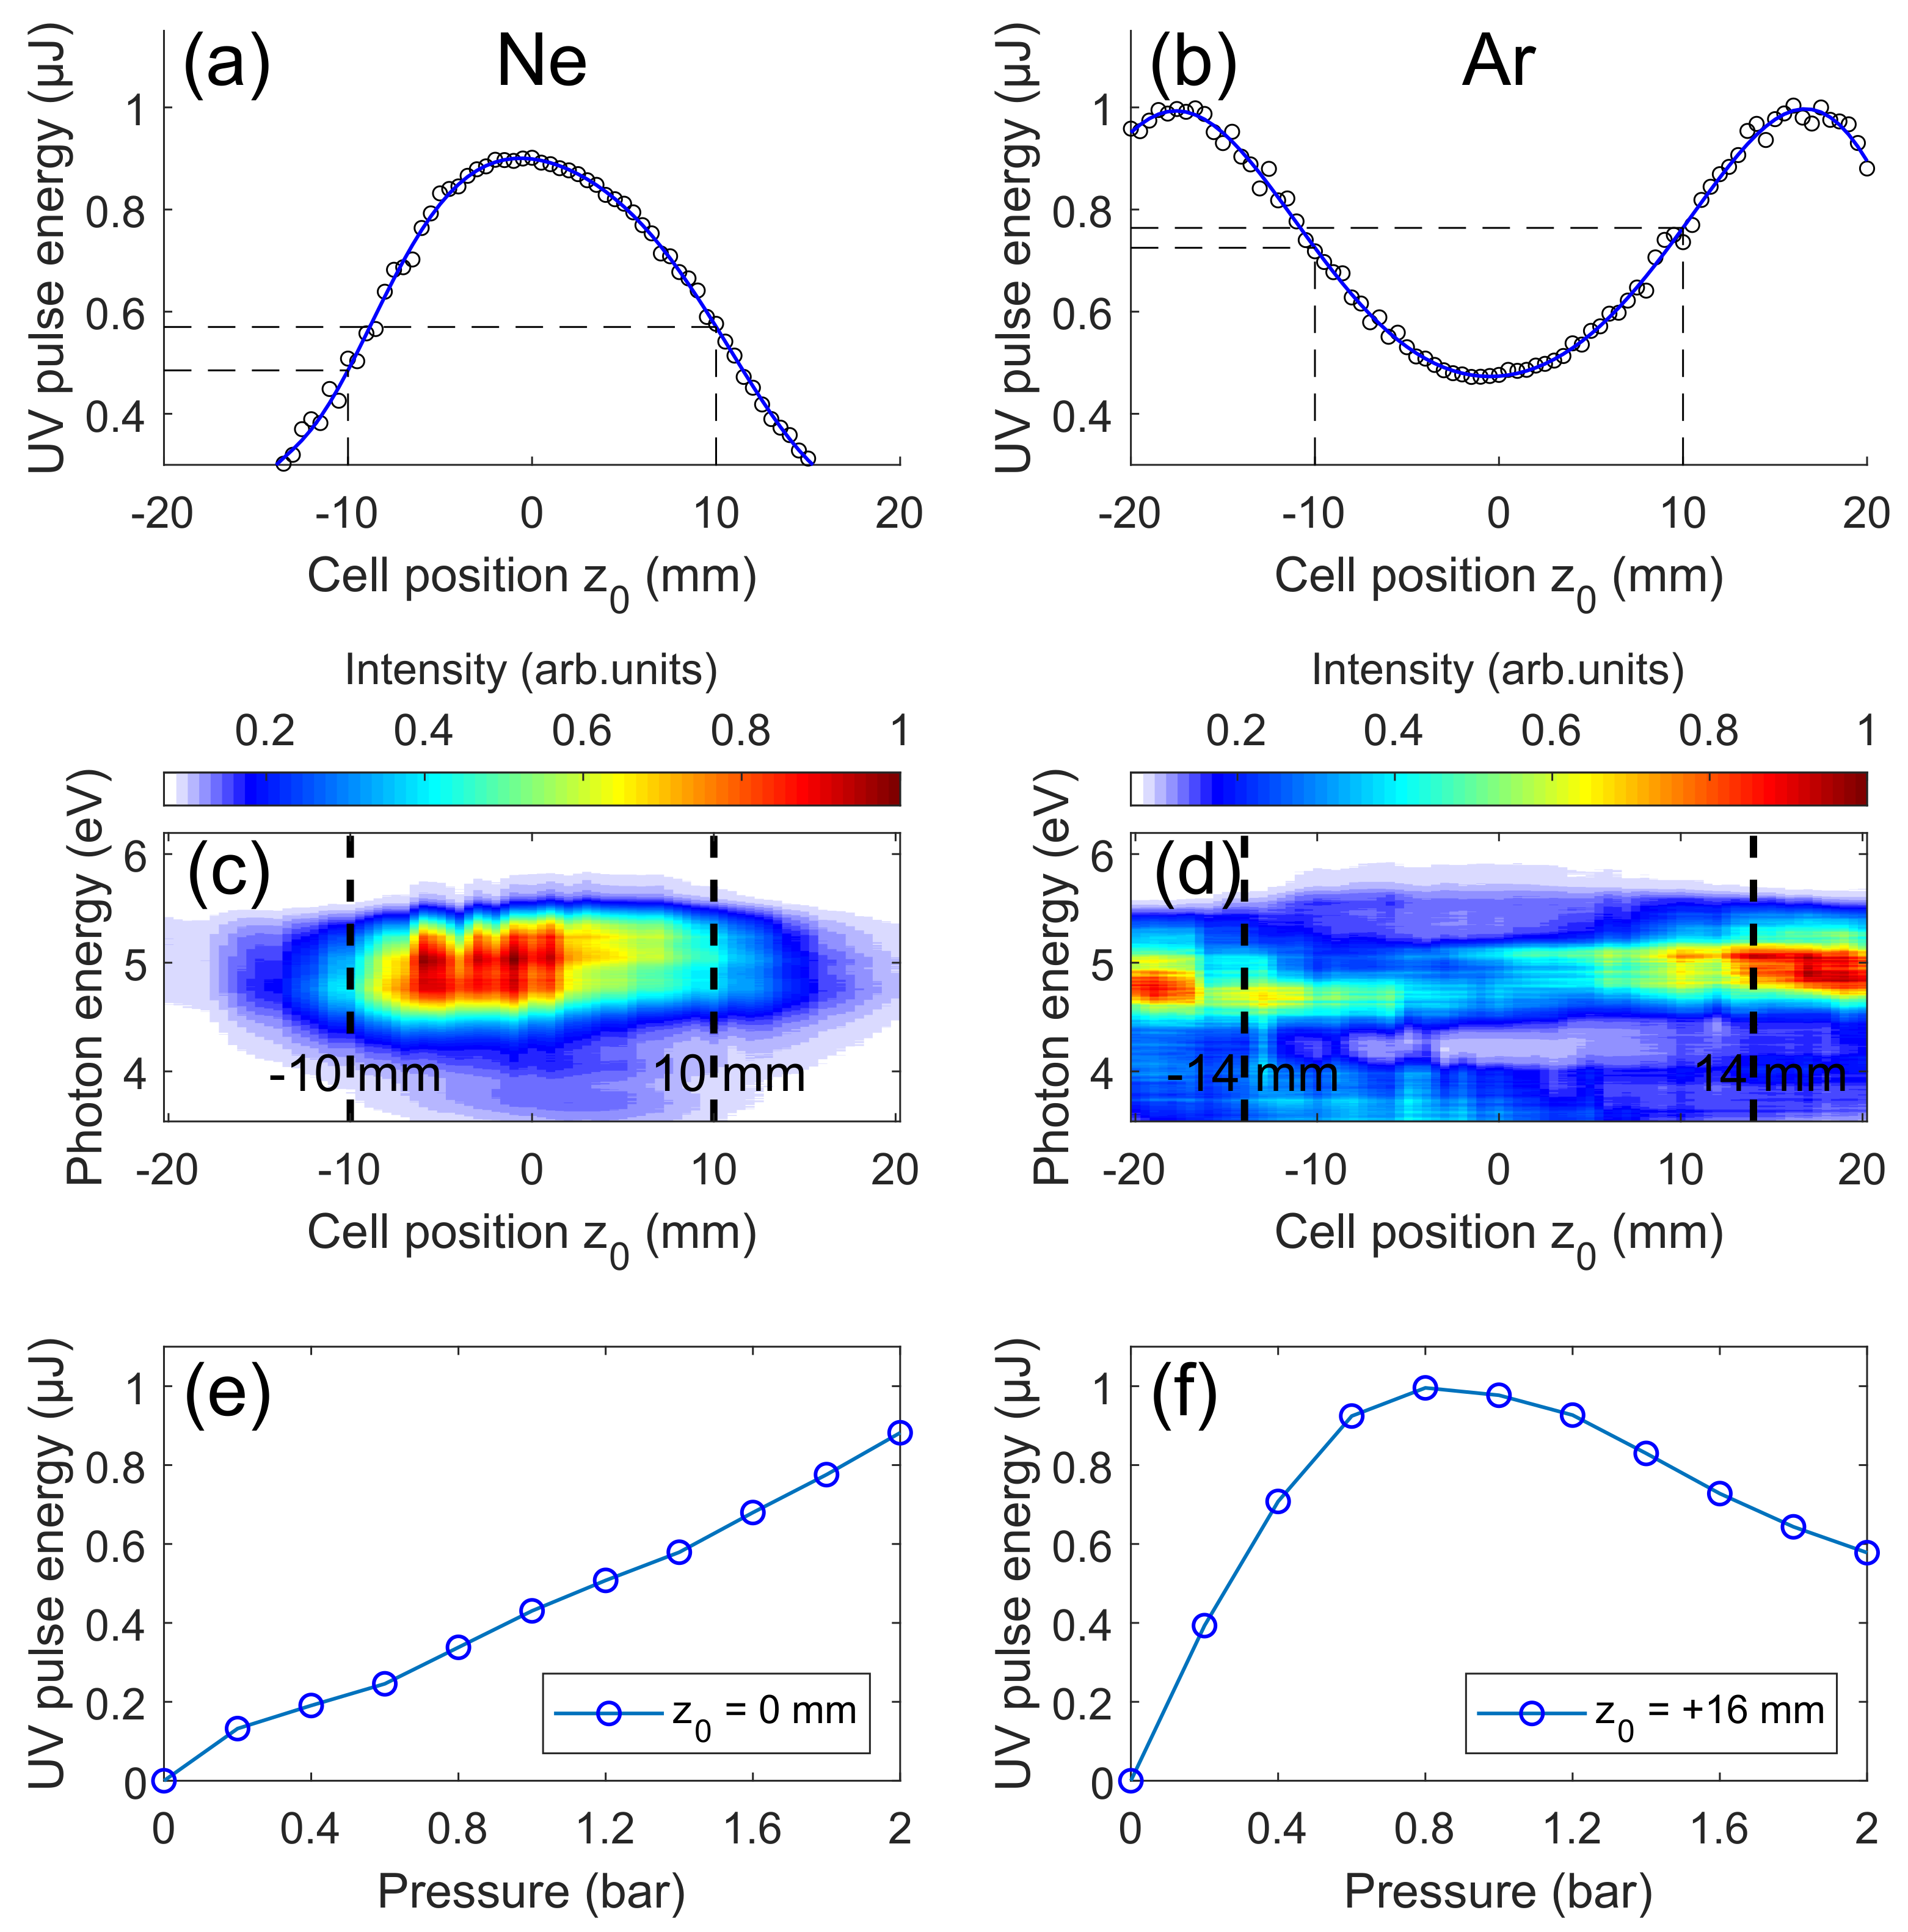
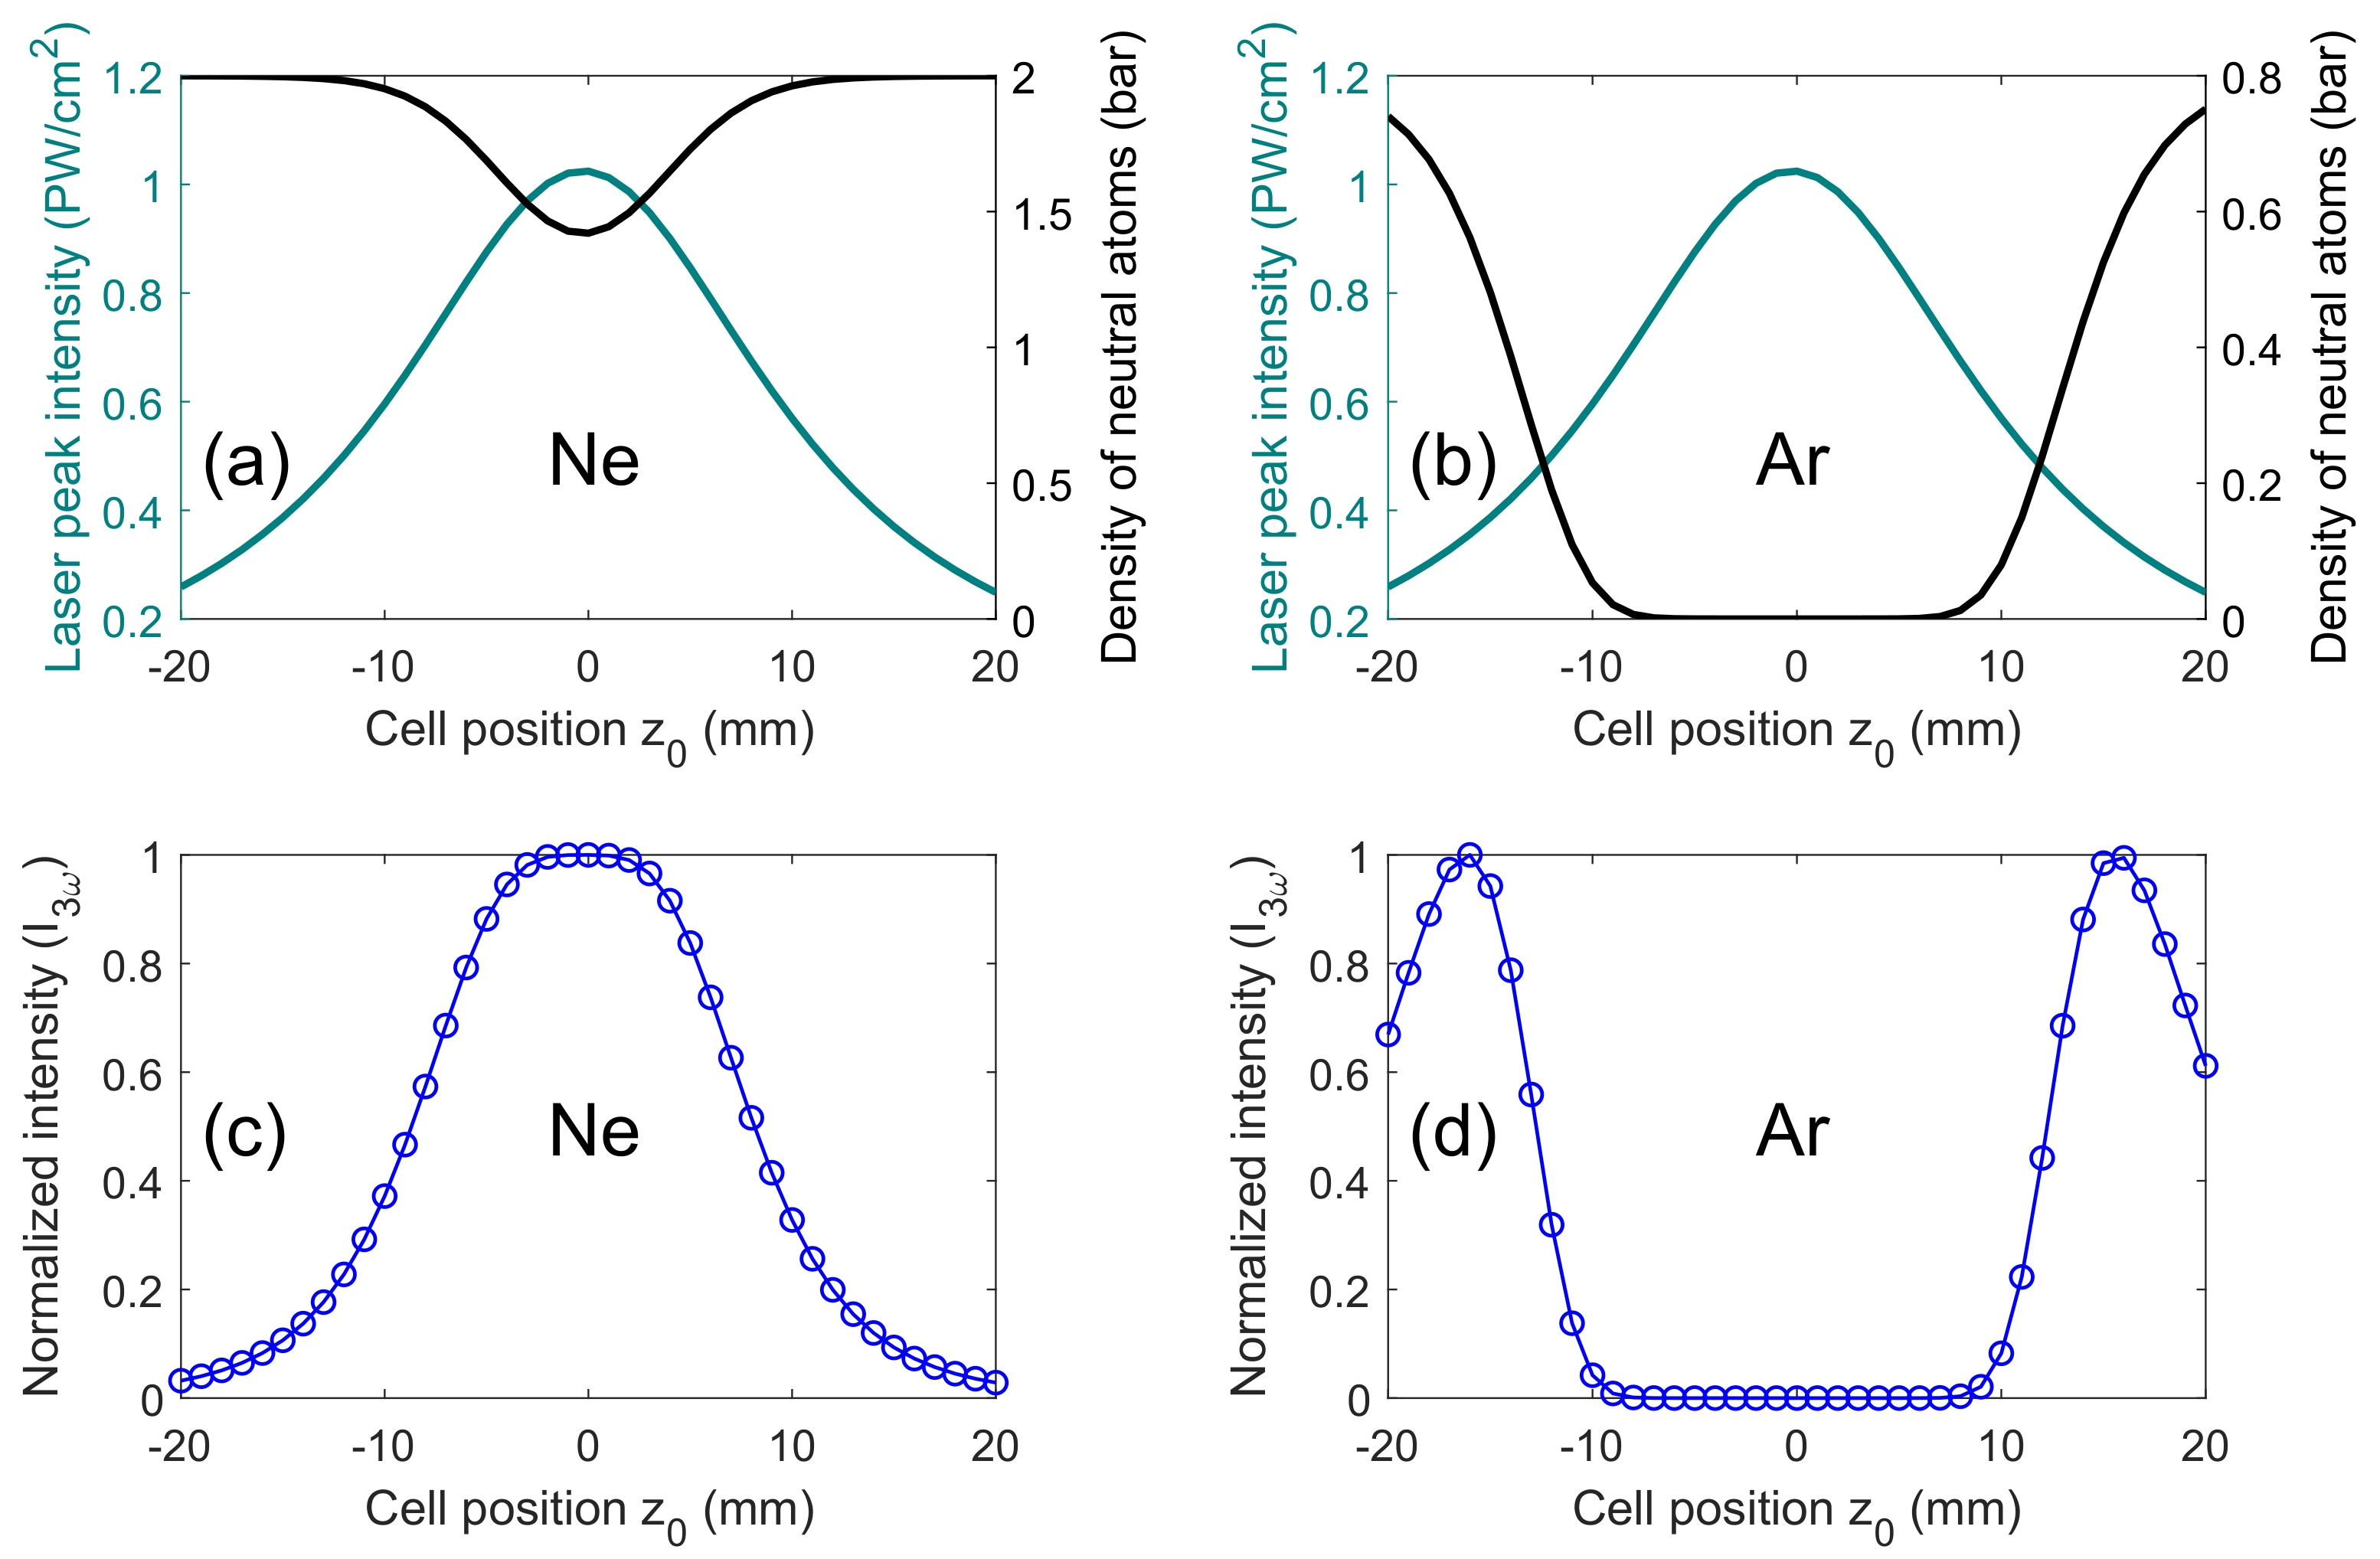
3. Results and Discussion

Figure 3 shows the measured DUV energy (a,b) and the spectra (c,d) as functions of the gas cell position, for 2 bar Ne (a,c) and 0.8 bar Ar (b,d) gas targets. Figure 3e,f shows the measured DUV energies when the supplied gas pressures are changed at fixed cell locations. In the data shown in Figure 3a,b, reflection losses from the window, prism, and lens, were considered. In the case of Ne gas, the highest DUV energy was generated at the laser focus, as shown in Figure 3a,c. In contrast, the results from Ar gas in Figure 3b,d show that the DUV yield is lowest at the laser focus, while two maxima are located on either side of the laser focus. For a qualitative explanation of this cell position dependence, we numerically estimated the THG yield (Figure 4c,d) based on a zeroth-order approximation, which is proportional to the product of neutral atomic density, the cube of the electric field strength, and the χ ( 3 ) of the corresponding atom. The ADK tunneling ionization rate is used to estimate the depletion of the neutral atoms [25]. The experimental result is consistent with the numerical estimation shown in Figure 4, in which the ionization of Ne atoms is not significant (Figure 4a,c) in comparison to the Ar case (Figure 4b,d). As estimated by the numerical simulation shown in Figure 4b, a strong depletion of Ar atoms constitutes the low DUV yield at the focus.
Based on this result, we fixed the cell position at z 0 = 16 mm in the case of Ar gas, where a maximum DUV yield was observed. Afterward, the gas pressure was changed from 0 to 2 bar. The highest DUV yield was observed at 0.8 bar. When a much higher pressure was applied, the DUV yield was reduced due to the increased plasma density and, hence, the increased nonlinearity. For Ne, with the cell located at the focus position ( z 0 = 0 mm), a gradual increase in the DUV yield was observed by supplying higher gas pressure as shown in Figure 3e, which is in agreement with other experimental results [14].
Ar has a larger third-order susceptibility ( χ ( 3 ) = 0.0441 (a.u.)) and a lower ionization energy ( I P = 15.7 eV) in comparison to Ne ( χ ( 3 ) = 0.00312 (a.u.), I P = 21.5 eV) [26]. Therefore, the results from Ar show relatively high DUV yields, even in the low gas pressure (below 1 bar). As a trade-off, the neutral Ar atoms are significantly depleted at the focus as shown in Figure 4b. In general, an ionized atom has a lower susceptibility than the neutral atom [27], meaning inferior production of UV photons. Therefore, when Ar is used as a THG medium, it is not recommended to place the gas target at the laser focus. The cell position scanning is an essential task to find an optimal condition for THG.
Asymmetry in the DUV yield (dashed lines in Figure 3a,b) with respect to the gas cell location is noted, which cannot be reproduced with the zeroth-order approximation shown in Figure 4c,d. When the gas cell is placed in front of the laser focus, the DUV yield is slightly smaller than when the gas cell is placed behind the focus regardless of the gas type. Furthermore, the DUV spectra are noticeably different depending on the cell position. To examine the variations in the generated DUV spectra more closely, we take cross sections (or spectra) at several gas cell positions (dashed lines in Figure 3c,d). In Figure 5a, a notable difference in the DUV spectrum depending on the gas cell location is observed. The DUV spectrum taken from the gas cell condition at z0 = +14 mm exhibits a spectral blue-shift compared to the spectrum from the condition at z0 = −14 mm. The same tendency is observed from the Ne result (Figure 5c).
To understand these experimental observations, we have simulated the propagation of an ultrashort optical pulse in a gas medium by numerically solving the nonlinear envelope equation under the slowly evolving wave approximation (SEWA) [28]. In the simulation, nonlinear effects, such as nonlinear absorption, plasma dispersion, and the third-order susceptibility of the medium are included. While a focused laser beam has a symmetric intensity distribution with respect to the laser focus, nonlinear laser–matter interaction mechanisms can be asymmetric between the gas cell positions, being placed before and after the laser focus. In HHG, it has been studied already that there are plentiful cell-position-dependent mechanisms [20,21,22]. In the present THG results, the asymmetric blue-shifting tendency was reproduced by simulation, which is shown in Figure 5b,d. The simulated spectral shape deviates from the experimental observations, due to the reduced detection efficiency of the near vacuum-UV components (above 5.7 eV), compared to the DUV components.
Figure 6 shows more details of the simulation result for the Ar target, when the cell is located at z 0 = ±14 mm. Figure 6a–d shows the results for z 0 = −14 mm, i.e., when the gas cell is placed 14 mm before the laser focus. The simulation results for z 0 = +14 mm are displayed in Figure 6e–h. For both z 0 = ±14 mm, the laser is strong enough to ionize the atoms at the leading edge (z − z0 ≈ −5 mm) of the initial gas profile (dashed lines in Figure 6a,e) as can be seen in Figure 6a,b or Figure 6e,f. In Figure 5, the experimental and numerical results show that the blue-shift is less significant when the cell is located at z 0 = −14 mm compared to when z 0 = +14 mm. This is because the laser beam interacts with the leading edge of the gas profile before the laser is tightly focused. The generated electron density is an order of magnitude smaller than in the case of z0 = +14 mm, as shown in Figure 6a,b. In Figure 6c,d, the on-axis spectral intensities of the NIR (c) and DUV (d) lights are shown. Although the laser beam becomes naturally stronger by the focusing geometry, the relatively low-density plasma makes the beam diverge so that the on-axis NIR intensity is reduced over the first half of the propagation; the beam then becomes stronger again in the next half of the propagation. The mean photon energy of the NIR light is blue-shifted and then returns to its initial spectral shape, because low-frequency light diverges further in the plasma. On the other hand, when the gas cell is at z0 = +14 mm, the atoms are irradiated with a diverging laser beam. The approximately 10 times higher 0.07 bar of the atoms can be ionized at the leading edge of the gas profile. The beam divergence is augmented by plasma-induced refraction at the leading edge of the target profile. The plasma formation is more localized (Figure 6e) compared to when the gas cell is at z 0 = −14 mm (Figure 6a). The overall on-axis NIR intensity is reduced by a factor of four, as can be seen in Figure 6g. Due to the significant ionization at z z 0 ≈ −5 mm and the localized plasma, the NIR fundamental spectrum becomes significantly blue-shifted at this point already, as indicated by the dashed line in Figure 6g. The frequency-shifted laser then propagates through the gas medium and generates DUV light through the third-order nonlinear process. Therefore, the blue-shifted DUV yield increases gradually after z z 0 ≈ −5 mm (Figure 6h).
In both cases of z 0 = ±14 mm, the DUV yield gradually increases as the beam propagates through the medium. The presence of plasma generated in the gas cell has a notable impact on the DUV efficiency through the phase mismatch. As discussed above, the dashed lines in Figure 3a,b indicate the higher yield for z 0 > 0. When the cell is located before the laser focus ( z 0 < 0), the plasma is distributed over the entire interaction region (Figure 6a,b), which makes the phase mismatching dominant. In the case of z 0 > 0, as can be seen in Figure 6e,f, the plasma is localized at around z z 0 ≈ −5 mm, with a relatively high electron density . The plasma-induced phase mismatching occurs only at the localized position.

4. Conclusions

In conclusion, we have demonstrated, by experiment and simulation, that DUV production via third-order harmonics is critically dependent on the gas cell position with respect to the laser focus. The careful optimization of DUV by considering nonlinear features has allowed us to achieve ∼1 μJ class DUV pulses in the 3.6–5.7 eV range (at the −20 dB intensity level), which supports a transform-limited sub-2.5-fs pulse, from Ar gas at a sub-atmosphere (0.8 bar) pressure. From an engineering point of view, the achievement of 1 μJ class DUV using sub-atmospheric pressure is significant, especially for experiments that require a high-vacuum level. The pulse duration can be estimated in a perturbative regime of a moderate intensity condition, as in our case, by using an analytic solution P3 χ ( 3 ) E 3 . It was evaluated to be 2.6 fs. Refs. [15,16] have reported the pulse measurement, giving approximately consistent results to the analytic evaluations. Furthermore, it was reported that, when the laser intensity becomes non-perturbative, the plasma effects make the pulse duration even shorter [4]. From these considerations, we judge that the DUV source has a pulse duration of 2.6 fs or so.
It was revealed that, despite the symmetric intensity distribution of the laser beam near the laser focus, the DUV generation efficiency and the amount of blue-shifts are adjusted by the cell location, either before or after laser focus. This tendency was explained by the results of numerical simulation. Careful simultaneous optimizations of the gas type, gas pressure, laser intensity, and the location of the cell can lead to highly efficient UV generation by striking a balance between the third-order response of gas materials and highly nonlinear processes.

Author Contributions

Conceptualization, T.K., J.-H.M. and D.-E.K.; Data curation, T.K. and J.-H.M.; Formal analysis, T.K. and J.-H.M.; Funding acquisition, J.-H.M. and D.-E.K.; Investigation, T.K., J.H. and Y.L.; Methodology, T.K., J.-H.M., J.H. and Y.L.; Project administration, J.-H.M. and D.-E.K.; Resources, J.H. and Y.L.; Software, T.K. and J.-H.M.; Supervision, D.-E.K.; Validation, T.K. and J.-H.M.; Visualization, T.K. and J.-H.M.; Writing—original draft, T.K., J.-H.M. and D.-E.K.; Writing—review and editing, T.K., J.-H.M. and D.-E.K. All authors have read and agreed to the published version of the manuscript.

Funding

This work was supported by Max Planck POSTECH/KOREA Research Initiative Program (No. 2016K1A4A4A01922028) through the National Research Foundation of Korea (NRF) funded by Ministry of Science, ICT and Future Planning and in part by the National Research Foundation of Korea (NRF) grant funded by the Korea government (MSIT) [Grant No. 2020R1C1C1012953].

Institutional Review Board Statement

Not applicable.

Informed Consent Statement

Not applicable.

Data Availability Statement

The data presented in this study are available on request from the corresponding author. The data are not publicly available due to ethical restrictions.

Conflicts of Interest

The authors declare no conflict of interest.

Abbreviations

The following abbreviations are used in this manuscript:
HHGHigh-order harmonic generation
THGThird-order harmonic generation
NIRNear infrared
DscanDispersion scan
SEWASlowly evolving wave approximation

References

  1. Crespo-Hernández, C.E.; Cohen, B.; Hare, P.M.; Kohler, B. Ultrafast Excited-State Dynamics in Nucleic Acids. Chem. Rev. 2004, 104, 1977–2020. [Google Scholar] [CrossRef]
  2. Gustavsson, T.; Improta, R.; Markovitsi, D. DNA/RNA: Building Blocks of Life Under UV Irradiation. J. Phys. Chem. Lett. 2010, 1, 2025–2030. [Google Scholar] [CrossRef] [Green Version]
  3. Wirth, A.; Hassan, M.T.; Grguraš, I.; Gagnon, J.; Moulet, A.; Luu, T.T.; Pabst, S.; Santra, R.; Alahmed, Z.A.; Azzeer, A.M.; et al. Synthesized Light Transients. Science 2011, 334, 195–200. [Google Scholar] [CrossRef] [Green Version]
  4. Reiter, F.; Graf, U.; Serebryannikov, E.E.; Schweinberger, W.; Fiess, M.; Schultze, M.; Azzeer, A.M.; Kienberger, R.; Krausz, F.; Zheltikov, A.M.; et al. Route to Attosecond Nonlinear Spectroscopy. Phys. Rev. Lett. 2010, 105, 243902. [Google Scholar] [CrossRef]
  5. Paul, P.M.; Toma, E.S.; Breger, P.; Mullot, G.; Augé, F.; Balcou, P.; Muller, H.G.; Agostini, P. Observation of a Train of Attosecond Pulses from High Harmonic Generation. Science 2001, 292, 1689–1692. [Google Scholar] [CrossRef]
  6. Chini, M.; Zhao, K.; Chang, Z. The generation, characterization and applications of broadband isolated attosecond pulses. Nat. Photonics 2014, 8, 178–186. [Google Scholar] [CrossRef]
  7. Popmintchev, T.; Chen, M.C.; Popmintchev, D.; Arpin, P.; Brown, S.; Ališauskas, S.; Andriukaitis, G.; Balčiunas, T.; Mücke, O.D.; Pugzlys, A.; et al. Bright Coherent Ultrahigh Harmonics in the keV X-ray Regime from Mid-Infrared Femtosecond Lasers. Science 2012, 336, 1287–1291. [Google Scholar] [CrossRef]
  8. Teichmann, S.M.; Silva, F.; Cousin, S.L.; Hemmer, M.; Biegert, J. 0.5-keV Soft X-ray attosecond continua. Nat. Commun. 2016, 7, 11493. [Google Scholar] [CrossRef] [Green Version]
  9. Fuji, T.; Suzuki, T. Generation of sub-two-cycle mid-infrared pulses by four-wave mixing through filamentation in air. Opt. Lett. 2007, 32, 3330–3332. [Google Scholar] [CrossRef]
  10. Ghotbi, M.; Beutler, M.; Noack, F. Generation of 2.5 μJ vacuum ultraviolet pulses with sub-50 fs duration by noncollinear four-wave mixing in argon. Opt. Lett. 2010, 35, 3492–3494. [Google Scholar] [CrossRef]
  11. Aközbek, N.; Iwasaki, A.; Becker, A.; Scalora, M.; Chin, S.L.; Bowden, C.M. Third-Harmonic Generation and Self-Channeling in Air Using High-Power Femtosecond Laser Pulses. Phys. Rev. Lett. 2002, 89, 143901. [Google Scholar] [CrossRef]
  12. Durfee, C.G.; Backus, S.; Kapteyn, H.C.; Murnane, M.M. Intense 8-fs pulse generation in the deep ultraviolet. Opt. Lett. 1999, 24, 697–699. [Google Scholar] [CrossRef]
  13. Baum, P.; Lochbrunner, S.; Riedle, E. Tunable sub-10-fs ultraviolet pulses generated by achromatic frequency doubling. Opt. Lett. 2004, 29, 1686–1688. [Google Scholar] [CrossRef]
  14. Graf, U.; Fieß, M.; Schultze, M.; Kienberger, R.; Krausz, F.; Goulielmakis, E. Intense few-cycle light pulses in the deep ultraviolet. Opt. Express 2008, 16, 18956–18963. [Google Scholar] [CrossRef]
  15. Reiter, F.; Graf, U.; Schultze, M.; Schweinberger, W.; Schröder, H.; Karpowicz, N.; Azzeer, A.M.; Kienberger, R.; Krausz, F.; Goulielmakis, E. Generation of sub-3 fs pulses in the deep ultraviolet. Opt. Lett. 2010, 35, 2248–2250. [Google Scholar] [CrossRef] [Green Version]
  16. Galli, M.; Wanie, V.; Lopes, D.P.; Månsson, E.P.; Trabattoni, A.; Colaizzi, L.; Saraswathula, K.; Cartella, A.; Frassetto, F.; Poletto, L.; et al. Generation of deep ultraviolet sub-2-fs pulses. Opt. Lett. 2019, 44, 1308–1311. [Google Scholar] [CrossRef] [Green Version]
  17. Belli, F.; Belli, F.; Abdolvand, A.; Abdolvand, A.; Travers, J.C.; Travers, J.C.; Russell, P.S.J.; Russell, P.S.J. Highly efficient deep UV generation by four-wave mixing in gas-filled hollow-core photonic crystal fiber. Opti. Lett. 2019, 44, 5509–5512. [Google Scholar] [CrossRef] [PubMed] [Green Version]
  18. Travers, J.C.; Grigorova, T.F.; Brahms, C.; Belli, F. High-energy pulse self-compression and ultraviolet generation through soliton dynamics in hollow capillary fibres. Nat. Photonics 2019, 13, 547–554. [Google Scholar] [CrossRef] [Green Version]
  19. Brahms, C.; Belli, F.; Travers, J.C. Infrared attosecond field transients and UV to IR few-femtosecond pulses generated by high-energy soliton self-compression. Phys. Rev. Res. 2020, 2, 043037. [Google Scholar] [CrossRef]
  20. L’Huillier, A.; Balcou, P.; Lompré, L.A. Coherence and resonance effects in high-order harmonic generation. Phys. Rev. Lett. 1992, 68, 166–169. [Google Scholar] [CrossRef] [PubMed]
  21. Balcou, P.; L’Huillier, A. Phase-matching effects in strong-field harmonic generation. Phys. Rev. A 1993, 47, 1447–1459. [Google Scholar] [CrossRef]
  22. Salières, P.; L’Huillier, A.; Lewenstein, M. Coherence Control of High-Order Harmonics. Phys. Rev. Lett. 1995, 74, 3776–3779. [Google Scholar] [CrossRef] [Green Version]
  23. Gaarde, M.B.; Tate, J.L.; Schafer, K.J. Macroscopic aspects of attosecond pulse generation. J. Phys. B At. Mol. Opt. Phys. 2008, 41, 132001. [Google Scholar] [CrossRef]
  24. Miranda, M.; Arnold, C.L.; Fordell, T.; Silva, F.; Alonso, B.; Weigand, R.; L’Huillier, A.; Crespo, H. Characterization of broadband few-cycle laser pulses with the d-scan technique. Opt. Express 2012, 20, 18732. [Google Scholar] [CrossRef]
  25. Larochelle, S.F.J.; Talebpour, A.; Chin, S.L. Coulomb effect in multiphoton ionization of rare-gas atoms. J. Phys. B At. Mol. Opt. Phys. 1998, 31, 1215–1224. [Google Scholar] [CrossRef]
  26. Weber, M.J. Handbook of Optical Materials; CRC Press: Boca Raton, FL, USA, 2002. [Google Scholar]
  27. Brée, C.; Demircan, A.; Steinmeyer, G. Saturation of the All-Optical Kerr Effect. Phys. Rev. Lett. 2011, 106, 183902. [Google Scholar] [CrossRef] [Green Version]
  28. Couairon, A.; Brambilla, E.; Corti, T.; Majus, D.; Ramírez-Góngora, O.D.J.; Kolesik, M. Practitioner’s guide to laser pulse propagation models and simulation. Eur. Phys. J. Spec. Top. 2011, 199, 5–76. [Google Scholar] [CrossRef]
Figure 1. (a) Schematic experimental setup. A gas cell for THG is housed in a small chamber, nested inside a larger main chamber. (b) Geometry of the laser beam near the focus. z0 represents the gas cell position. A negative z0 value means the gas cell is positioned before the laser focus and vice versa. The laser focus is at z0 = 0 mm.
Applsci 11 06440 g001
Figure 2. (a) Spectra of the NIR laser before and after transmission through the gas cell, measured when the gas cell was positioned at the tightest focus position. The transmitted NIR spectrum was blue-shifted (higher photon energy). (b) Mean photon energies of the transmitted NIR laser as a function of the cell position. The amount of blue-shift was used to determine the best focus position z 0 = 0 mm, which is 18.25 mm in (b).
Applsci 11 06440 g002
Figure 3. DUV pulse energies and spectra are plotted by the cell position when 2 bar Ne (a,c), and 0.8 bar Ar (b,d) targets are used. (e,f) show the DUV pulse energies at fixed cell positions, measured by changing the gas pressure: (e) Ne and (f) Ar.
Applsci 11 06440 g003
Figure 4. Atomic neutral densities and THG yields. (a,b) show the variation of neutral-atomic densities and laser intensity for different cell positions. (c,d) are estimated THG yields, indicating that the maximum DUV yield is expected when the cell is placed off the laser focus in the case of Ar. For Ne (a), 25% of the neutral atoms are expected to be ionized when the cell is positioned at the laser focus. For Ar (b), the neutral atoms are totally depleted near the focus.
Applsci 11 06440 g004
Figure 5. (a,c) The experimental spectra taken at the dashed lines in Figure 3c,d, respectively. (b,d) DUV spectra obtained from simulation performed using the experimentally observed laser parameters. More details on the simulation results are discussed in Figure 6. Dashed lines in (b,d) show an analytic solution of the third-harmonic spectrum obtained by Fourier transforming the cube of the fundamental laser E ( t ) in the temporal domain.
Applsci 11 06440 g005
Figure 6. Simulated nonlinear DUV generation dynamics in Ar. The left column (ad) and the right column (eh) panels are the results for the two different cell positions: z 0 = −14 mm and +14 mm, respectively. (a,e) shows the z-dependent on-axis ( r = 0 ) electron densities after the laser has passed. (b,f) are the two-dimensional (r and z) electron density profiles. The spectra of propagating fundamental (c,g) and the third-order harmonic (d,h) were taken from the on-axis ( r = 0 ). In (c,g), the mean photon energies of the fundamental laser are indicated by the dashed lines to visualize the blue-shift.
Applsci 11 06440 g006
Publisher’s Note: MDPI stays neutral with regard to jurisdictional claims in published maps and institutional affiliations.

