1. Introduction
Coeliac disease or gluten-related disorders including, wheat allergy and non-celiac gluten sensitivity cause major health problems for people when ingesting small amount of gluten [
1]. In addition to people who are forced to consume gluten-free products, the demand for these products has also increased for people who want to follow a healthy diet. In this sense, it is necessary to expand and diversify the food industry both in terms of progress in ingredients and formulations, and in the production of functional foods [
2]. Because coeliac people have various nutrient deficiencies, there are many challenges in the development of gluten-free products [
3,
4]. In addition to nutrient deficiencies, other issues make gluten products difficult to replace. For example, gluten-free dough is more difficult to handle due to a lack of cohesiveness, elasticity, and baking quality [
5,
6]. In general, gluten-free products are characterized by high starch content, low fiber content, short shelf life or texture issues, like increased bread crumb hardness [
7]. Within this aim, more and more researches are being conducted to find formulations between different gluten-free flours and ingredients to obtain products that are similar to wheat-containing products.
Rice is the most used cereal flour for gluten-free products development [
8]. Rice has unique nutritional, hypoallergenic, colorless, and bland taste properties and a low level of prolamin. An alternative to rice is brown rice (unpolished rice), which contains many nutritional and bioactive components, including fiber, amino acids, minerals, and phenolic compounds [
9]. Despite the many qualities of rice flour, it was necessary to expand the raw materials used for the development of gluten-free products to diversify the product range and to enrich the nutrient content. Thus, a long list of raw materials was used in various studies to develop the gluten-free sector as much as possible. Among them are cereals (maize, sorghum), whole grains (brown rice, millet, teff, oatmeal), pseudo-cereals (amaranth, quinoa, buckwheat), legumes (pea, lentils, soybean, chickpea, gram), seeds (flax seeds, pumpkin seeds), nuts (almond, walnut, peanuts), tuberous rhizomes (tiger nut, jerusalem artichokes), and other types of raw materials (plantain, coconut) [
3,
10].
Hager et al. [
11] showed that whole grains flours had higher fiber content compared to wheat flour. In addition, the protein content is higher in case of teff flour and lower for oat flour, but oat protein is superior to wheat protein due to its higher lysine content.
Pseudo-cereals are a good alternative to wheat flour too because they are an important source of minerals (calcium, iron, and zinc), vitamins, and phytochemicals (saponins, polyphenols, phytosterols, phytosteroids and betalains), which present a real potential health benefit [
12].
Legumes flours are usually used in gluten-free products due to their nutritionally properties. All of them are an important source of nutrients such as proteins, complex carbohydrates, fibers, micronutrients, and antioxidant compounds [
13]. Chickpea is a legume rich in protein and has good emulsifying properties bringing an improvement in the gluten-free bread volume [
14]. Chickpea flour was used in combination with tiger nut flour as an alternative to emulsifier and shortening in gluten-free bread. The effect of reducing or eliminating the shortening or emulsifier was due to the interaction between chickpea protein and tiger nut fat [
14]. Tiger nut is a tuber rich in carbohydrates, lipids, and fiber; therefore, tiger nut flour was used in bakery products as well as for gluten-free bread with good baking and nutritional characteristics [
15]. Another legume category is represented by Bengal gram, which is a pulse crop that contains approximately 17–22% protein, 6.48% fat, 3.82% crude fiber, and 50% carbohydrates [
16].
Over the last few years, the use of plantain and other varieties of banana has increased around the world. Plantain flour contains large amounts of starch, cellulose, hemicellulose, and lignin in the pulp and shows high resistance to hydrolysis by digestive enzymes [
17]. Some studies have used plantain flour in gluten-free products [
17,
18,
19,
20].
The aim of this study was to have an overall view of different sources of gluten-free flours. Within this aim, 13 gluten-free flours (rice, brown rice, maize, oat, millet, teff, amaranth, buckwheat, quinoa, chickpea, gram, tiger nut, and plantain) were compared in terms of their nutritional and functional properties in order to identify the most suitable ones for gluten-free products’ development.
2. Materials and Methods
2.1. Gluten-Free Flour Samples
Thirteen different commercially available gluten-free (GF) flours were evaluated. Maize, oat, buckwheat, chickpea, tiger nut, and plantain flours were from Biorganik (Budapest, Hungary), while rice, millet, and amaranth flours were provided by Biosviat (Sofia, Bulgaria). Brown rice, wholemeal teff, quinoa, and gram flours were acquired from different suppliers, namely: Biopont Ltd. (Ercsi, Hungary), 3Pauly (Detmold, Germany), Infinity Foods Co-operative Limited (Brighton, UK), and Doves Farm (Berkshire, UK), respectively. The flours were stored in airtight brown glass jars at room temperature.
2.2. Proximate Composition
Moisture, protein, fat, and ash content of GF flours were determined according to the AOAC methods 925.10, 920.152, 922.06, and 923.03. Briefly, moisture content was analyzed by the drying method, protein content through Kjeldahl method using a nitrogen-to-protein conversion factor of 6.25, fat content by Soxhlet extraction with petroleum ether, and ash content through the gravimetric method by sample burning at 550 °C in a furnace. Dietary fiber, starch, and amylose levels were determined using enzymatic kits (K-TDFR, K-TSTA, and K-AMYL) and following the procedures recommended by the supplier (Megazyme International Ltd., Bray, Ireland). Ridascreen® Gliadin Kit (R-Biopharm AG, Darmstad, Germany) was used for analyzing gluten content.
2.3. Minerals Analysis
One gram of flour was microwave digested (EthosEasy Advanced microwave system, Milestone, Italy) at 550 °C with 5 mL HNO3 and 1 mL H2O2. After digestion, the sample were transferred to volumetric flasks (100 mL), filled with deionized water, and analyzed by inductively coupled plasma mass spectrometry (NexION 300Q ICP-MS, Perkin Elmer, Waltham, MA, USA). An external standard (multi-element solution for ICP, SPEX CertiPrep, Metuchen, NJ, USA) was used for calibration.
2.4. Determination of Fatty Acid Profile
Fatty acid profile was determined according to ISO 12966-2 [
21]. A volume of 1 µL of the resulting fatty acid methyl esters samples was injected into a Perkin Elmer-Clarus 500 gas chromatograph with flame ionization detector (Perkin Elmer, Waltham, MA, USA) in a split mode (1:100). Operating parameters were as follows: detector temperature: 250 °C; injector temperature: 260 °C; oven temperature: 180 °C to 220 °C (5 °C/min). A BPX70 column (60 m–0.25 mm–0.25 µm; SGE Analytical Science, Victoria, Australia) was used and carrier gas was hydrogen 1 mL/min. Individual fatty acid methyl esters were identified by comparison to the standard mixture of Supelco 37 Component FAME Mix (Sigma-Aldrich, Bellefonte, PA, USA) and expressed as g of fatty acids/100 g fat.
2.5. Amino Acid Analysis
Amino acid composition was determined using Agilent 1260 Series HPLC (Agilent Technologies, Waldbronn, Germany) with diode array detector following a previous methodology [
22]. The samples were hydrolyzed with 6 M HCl at 110 °C for 24 h and the protein hydrolysates were treated with phenyl isothiocyanate to form phenylthiocarbamyl derivatives of the amino acids.
The amino acid score (AAS) was calculated by dividing the amino acid content of the sample by its reference value established by FAO [
23]. The reference value for adults expressed as g/100 g protein were: 1.5 for histidine, 3 for isoleucine, 5.9 for leucine, 4.5 for lysine, 2.2 for the sulphur amino acids (methionine and cysteine), 3.8 for the aromatic amino acids (phenylalanine and tyrosine), 2.3 for threonine, and 3.9 for valine [
23]. The protein digestibility corrected amino acid score (PDCAAS) was obtained by multiplying the lowest value of the AAS by the percentage of the protein digestibility of the respective sample with the aim to assess how well dietary protein can match the demand for amino acids, and to allow the prediction of dietary protein utilization [
23].
Other protein quality indexes such as Protein Score, Essential Amino Acid Index (EAAI), Biological Value (BV), Protein Efficiency Ratio (PER), and Nutritional Index (NI) were calculated from the content of essential amino acids, as described in a previous paper [
24].
2.6. Determination of Protein Digestibility
The method proposed by Hsu et al. [
25] was used for the analysis of the in vitro digestion of proteins. Briefly, flour samples were suspended in distilled water to achieve an amount of 6.25 mg protein/mL, followed by pH setting to 8.0. After the suspensions were incubated at 37 °C, trypsin (1.6 mg/mL; type IX-S, Sigma-Aldrich, Saint Louis, USA) was added and the decrease in pH was measured after 10 min. The percentage of the protein digestibility was determined as: % = 210.46 − 18.10 · pH [
25].
2.7. Determination of Total Polyphenolic Content and Antioxidant Capacity
For extract preparation, 1 g of flour was extracted with 6 mL of 80% methanol for 3 h on a vortex. The extract obtained was centrifuged at 11,000 rpm for 30 min and the collected supernatant was used for determination of the total polyphenolic content (TPC) and the antioxidant capacity, following the methods proposed by Horszwald and Andlauer [
26] with some modifications. For TPC, 500 µL extract was mixed with 5 mL freshly prepared Folin-Ciocalteu reagent (15-fold diluted), incubated for 10 min in dark, and then 500 µL of 20% Na
2CO
3 was added. After 20 min reacting in the dark, the absorbance of the mixture was measured at 755 nm (Specord 200 Spectrophotometer, Analytik Jena AG, Jena, Germany). Gallic acid was used for calibration. Results were expressed as mg of gallic acid equivalents (GAE) per g of gluten-free flour on dry matter basis. For the antioxidant capacity, 400 µL extract was mixed with 6 mL of 0.04 mg/mL DPPH (1,1-diphenyl-2-picrylhydrazyl) solution in methanol. The mixture was kept in the dark for 30 min and the absorbance of the solution was measured at 517 nm. Trolox (6-hydroxy-2,5,7,8-tetramethylchroman-2-carboxylic acid) was used as the standard. Results were expressed as mg of Trolox per g of gluten-free flour on a dry matter basis.
2.8. Thermal Properties
A differential scanning calorimeter (DSC8000, Perkin Elmer, Waltham, MA, USA) was used to evaluate the thermal properties of the GF flours. The instrument was calibrated with indium (Indium Calibration Standard, Perkin Elmer) with melting temperature and enthalpy of 156.6 °C and 28.5 J/g. Distilled water was added into the flours at a ratio of 3:1 directly into 60 µL DSC stainless steel pans that were sealed and equilibrated at room temperature for 24 h before determination. The scanning conditions were: heating temperature from 20 to 120 °C, heating rate of 10 °C/min, nitrogen flow rate of 20 mL/min, and an empty pan as the reference. After the first run (which reflects the gelatinization thermal properties), the pans were stored at 4 °C for 7 days to enable starch retrogradation and rescanned under the same heating conditions. Endothermic transitions consisting of Tp (peak temperature), ΔHg (gelatinization enthalpy), and ΔHr (retrogradation enthalpy) were obtained through Pyris Manager software (Perkin Elmer). The degree of retrogradation (DR) was calculated as: DR (%) = (ΔHr/ΔHg) × 100. All the measurements were performed in triplicate.
2.9. Functional Properties
The functional properties of the GF flours were determined according to the methods described by Klunklin and Savage [
27]. Briefly, water and oil absorption were determined using 1 g of flour and 10 mL of distilled water or soybean oil. For the swelling power, 1 g of flour was mixed with 10 mL of distilled water and heated to form a paste. To determine foam capacity, 2 g of flour were added to 50 mL water in a cylinder and homogenized by Ultra-Turrax to allow foam formation. For the bulk density, 50 g flour was weight in a graduated cylinder and its volume was measured.
2.10. Statistical Analysis
The results of the gluten-free flour analysis were presented as the mean values of three replicates together with the standard deviation. Data were analyzed by one-way analysis of variance (ANOVA) supported by Tukey’s test (p < 0.05). Pearson correlations analysis was done to calculate the correlations among data. Furthermore, the data were subjected to principal component analysis (PCA). The statistical analysis was performed using Minitab®20 Statistical Software (Minitab Ltd., Coventry, UK).
3. Results
3.1. Proximate Composition of GF Flours
The gluten content (expressed in ppm) for the flours under investigation was as follows: 14.15 (rice), 8.63 (brown rice), 7.22 (maize), 6.14 (oat), 8.75 (millet), 8.42 (teff), 5.3 (amaranth), 3.94 (buckwheat), 8.04 (quinoa), 4.66 (chickpea), 2.02 (gram), 4.78 (tiger nut), and 3.68 (plantain). All the flours had a gluten content lower than 20 ppm, which confirms their claim as gluten-free.
The proximate composition of the analyzed gluten-free flour is presented in
Table 1. Among the different GF flours, protein content was significantly higher (
p < 0.05) in both chickpea samples and decreased in the order: gram > chickpea > amaranth > buckwheat > quinoa > teff > oat > millet > brown rice > rice > maize > tiger nut > plantain. Protein content of gram flour was about 1.27 times the chickpea level. Compared to the rice flour—the most used GF flour—the protein content in gram was 8.2-fold higher. The protein content varies between varieties. For example, millet recorded different protein values depending on the type: 11.9% for common millet flour, 8% for pearl millet flour, and 7.3% for finger millet flour [
28,
29]. In addition, the protein content varies from 5.7–14.2% for buckwheat, 9.1–16.7% for quinoa, and 13.1–21.5% for amaranth [
30,
31,
32].
The fat content was relatively high in tiger nut flour (25.1%) when compared to the other flours, which might have a negative impact on the shelf-life and quality characteristics of the foods. Further, it varied from 6.11% for gram flour to 0.34% for plantain flour. The higher fat content of the flours leads to their ability to absorb and retain oil, improves the structure and mouth feel, and helps to enhance the flavor retention, also reducing moisture and fat losses of food products [
33].
The ash content varied from about 0.6% (rice and maize flours) to 3.5% (chickpea flour). The high ash content (>2%) for chickpea, teff, amaranth, quinoa, tiger nut, buckwheat, and plantain flours denoted that these types of GF flours are an important source of minerals.
The highest levels of dietary fiber (
p < 0.05) were found for tiger nut, chickpea, and buckwheat flours, while the rice flour had the lowest content (0.88%). The fiber content of tiger nut flour (35.4%) was much higher compared to the values reported in other studies, which varied between 5.6–22.3% [
34,
35,
36]. This variance comes from the difference in varieties along with the milling procedure or environmental factors.
Rice, plantain, and brown rice had higher starch content (76.2–82.6%) than those of amaranth, gram, chickpea, and tiger nut flours (<60%) (p < 0.05).
Amylose content ranged between 6.5–8.4% and 30.1% starch corresponding to amaranth and quinoa flour for the lowest content and tiger nut for the highest content, respectively. Brown rice had a lower amylose content than rice flour (
p < 0.05). As shown in
Table 1, the percentage of amylose from the total starch was relatively similar with no significant difference (
p > 0.05) between several groups of GF flours, mainly: (1) teff, buckwheat, and chickpea (28–28.7%); (2) millet, rice, and maize (24–25.3%); and (3) maize, gram, plantain, and oat (22.1–24%). The ratio between amylose and amylopectin has an impact on the starch digestion and, accordingly, to the glycemic index. Di Cairano et al. [
37] showed a slight negative correlation (r = −0.368) between amylose content and predicted glycemic index in gluten-free cereals, pseudo-cereal, and legumes flours. Regarding the bread products, a much higher negative correlation was obtained (r = −0.964) [
38]. Thus, the lower amylose content in quinoa (5.3%) led to a high glycemic index of quinoa bread, while a lower glycemic index was obtained when flours with higher amylose content (20.5–22.8%), such as oat and teff were used in the bread manufacture.
Even if there was variability on the chemical composition values of the selected GF flours with those obtained by other researchers [
11,
39,
40] mainly because of the different varieties or technology for flour processing, the GF flours order for a specific parameter was similar.
3.2. Mineral Composition of GF Flours
The mineral composition of the flours is presented in
Table 2. In general, calcium, magnesium, and iron are scarce in the gluten-free diet [
40]. The authors underlined the importance of calcium intake and bone metabolism in people with coeliac disease. From the studied flours, calcium levels were high in amaranth (189.7 mg/100 g), teff (166.7 mg/100 g), and gram (150.1 mg/100 g), compared with the other flours with much lower values ranging from 2.2 to 64.3 mg/100 g. The lowest content was for maize and rice flours. Moreover, calcium content in brown rice was six-fold higher than in rice because dehulling process decreases the calcium levels as stated previously [
41]. Gram contained 2.3 times more calcium than chickpea.
Similar to the calcium content, magnesium levels were high in amaranth (270.8 mg/100 g) and teff (226.5 mg/100 g), as well as quinoa flours (229.5 mg/100 g), followed by buckwheat (221.8 mg/100 g) and gram (181.1 mg/100 g).
High content of iron was found in teff (8.7 mg/100 g) and amaranth (7.4 mg/100 g) followed by chickpea, gram, and quinoa (5.6–6 mg/100 g). On the other side, tiger nut, rice, and brown rice flours were deficient in iron (<1 mg/100 g). The teff and gram flours were a good source of zinc (around 4 mg/100 g). From a nutritional point of view, zinc and iron are essential elements in human nutrition, especially for diabetic patients, enhancing insulin production [
42,
43].
Potassium content ranged from 113.5 mg/100 g (rice flour) to 1175.4 mg/100 g (plantain flour), being the highest element. Other flours with high potassium content were the chickpea flours between 1127.7–1144.1 mg/100 g (with higher value for gram than chickpea) and tiger nut (717.6 mg/100 g). Sodium content was between 0.52 mg/100 g (maize flour) and 16.1 mg/100 g (teff flour). Gram had a lower sodium content than chickpea. It is widely known that a diet low in sodium and high in potassium helps in lowering the blood pressure and reducing the risk of cardiovascular disease [
44].
The phosphorus content (p < 0.05) decreased in the following order: gram > amaranth > quinoa > chickpea > teff > brown rice > buckwheat > millet > oat > tiger nut > rice > maize > plantain.
According to Hager et al. [
11], flours with high mineral composition (such as teff and quinoa) had also higher content of phytic acid that has the ability to bind minerals and hinder their absorption. To overcome this drawback, technologies like the sourdough fermentation can be applied to reduce the phytate content [
45].
Based on the dietary reference intake established by the USDA [
46], 100 g gram flour provides 92%, 43–57%, 36–49%, and 71–31% of the daily required phosphorous (male/female), magnesium (male–female), zinc (male–female), and iron (male–female), respectively. In addition, 100 g brown rice, millet, teff, amaranth, buckwheat quinoa, or chickpea flours provided more than 40% of the daily-recommended allowance of magnesium for female population. Hager et al. [
11] noted the same observation for quinoa, teff and buckwheat flour. A good contribution to the daily-required amount of iron can be provided by 100 g of teff, amaranth, millet, quinoa, or chickpea flour. The calculation for the dietary intakes for minerals for each type of GF flour is detailed in
Supplementary Materials Table S1.
Several studies have analyzed the mineral content of GF flour. For example, Rybicka et al. [
47] considered buckwheat, corn, oat, rice, amaranth, chickpea, chestnut, millet, teff, and acorn flours, while Hager et al. [
11] focused on rice, oat, quinoa, buckwheat, sorghum, maize, and teff. Their results were in line with the present study with some differences coming from the original raw material and its processing. The mineral content of tiger nut and plantain flours were in contrast with those presented by Adegunwa et al. [
35]. The type of cultivar and soil characteristics (type, mineral content) contributed to this difference [
48].
3.3. Fatty Acid Profile
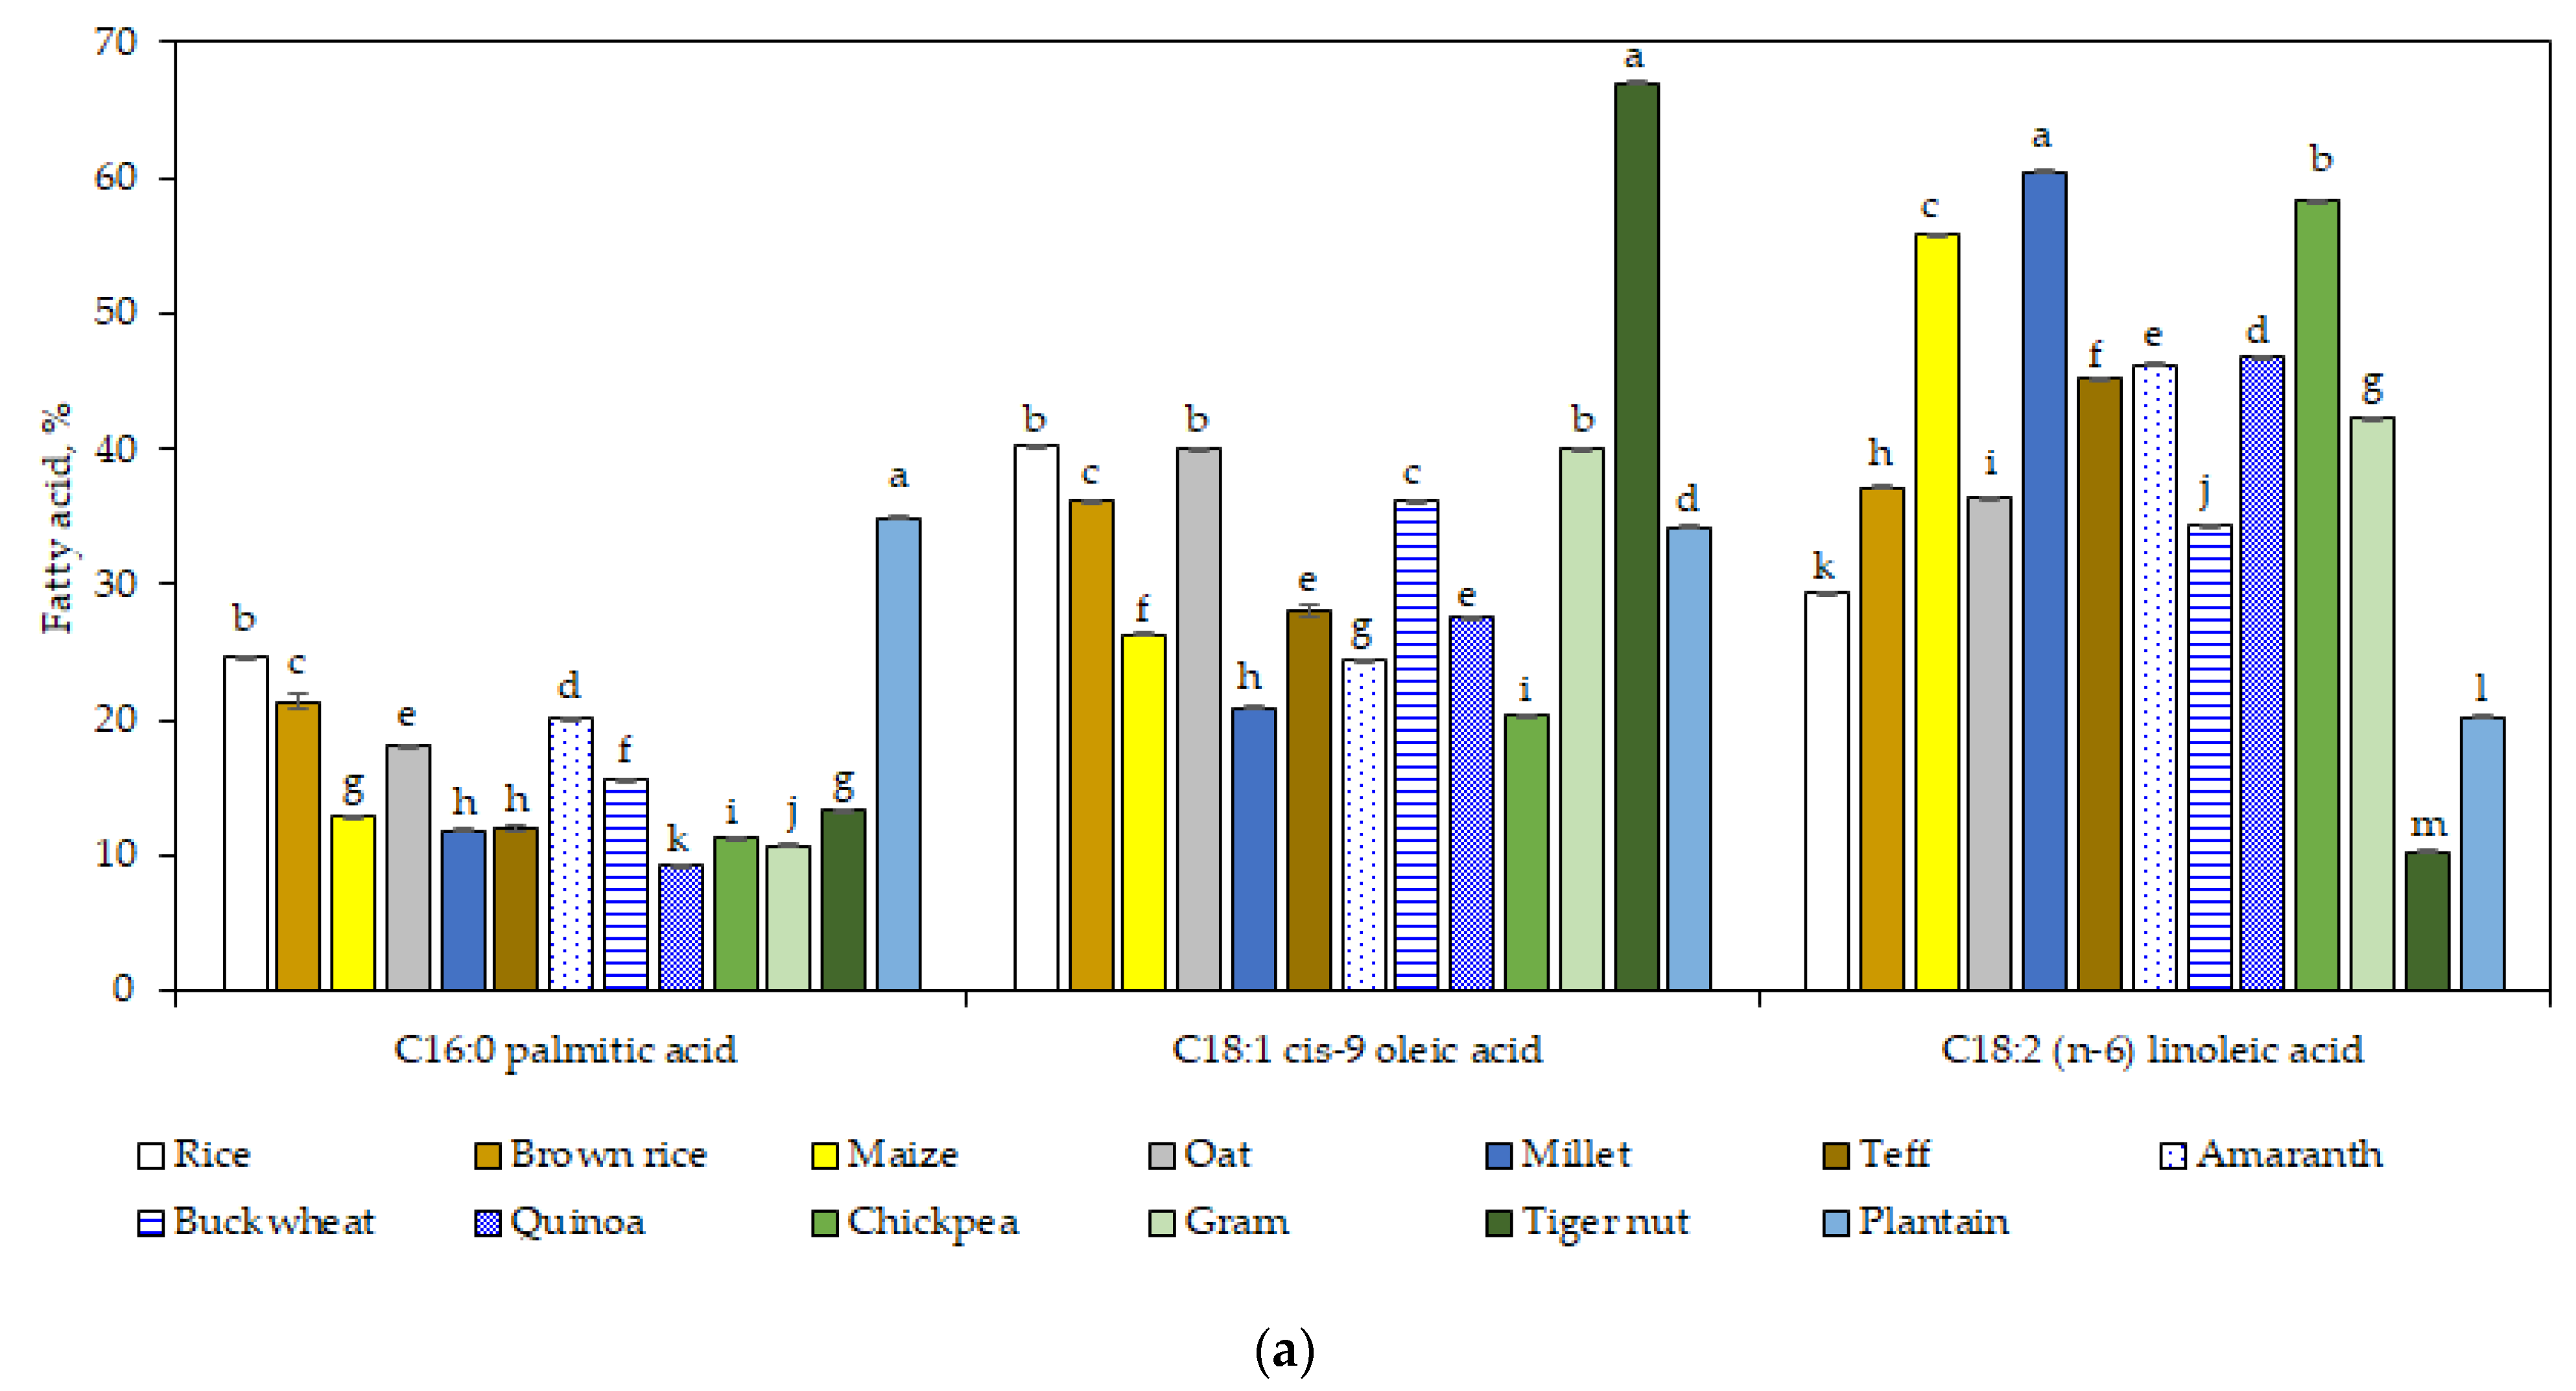
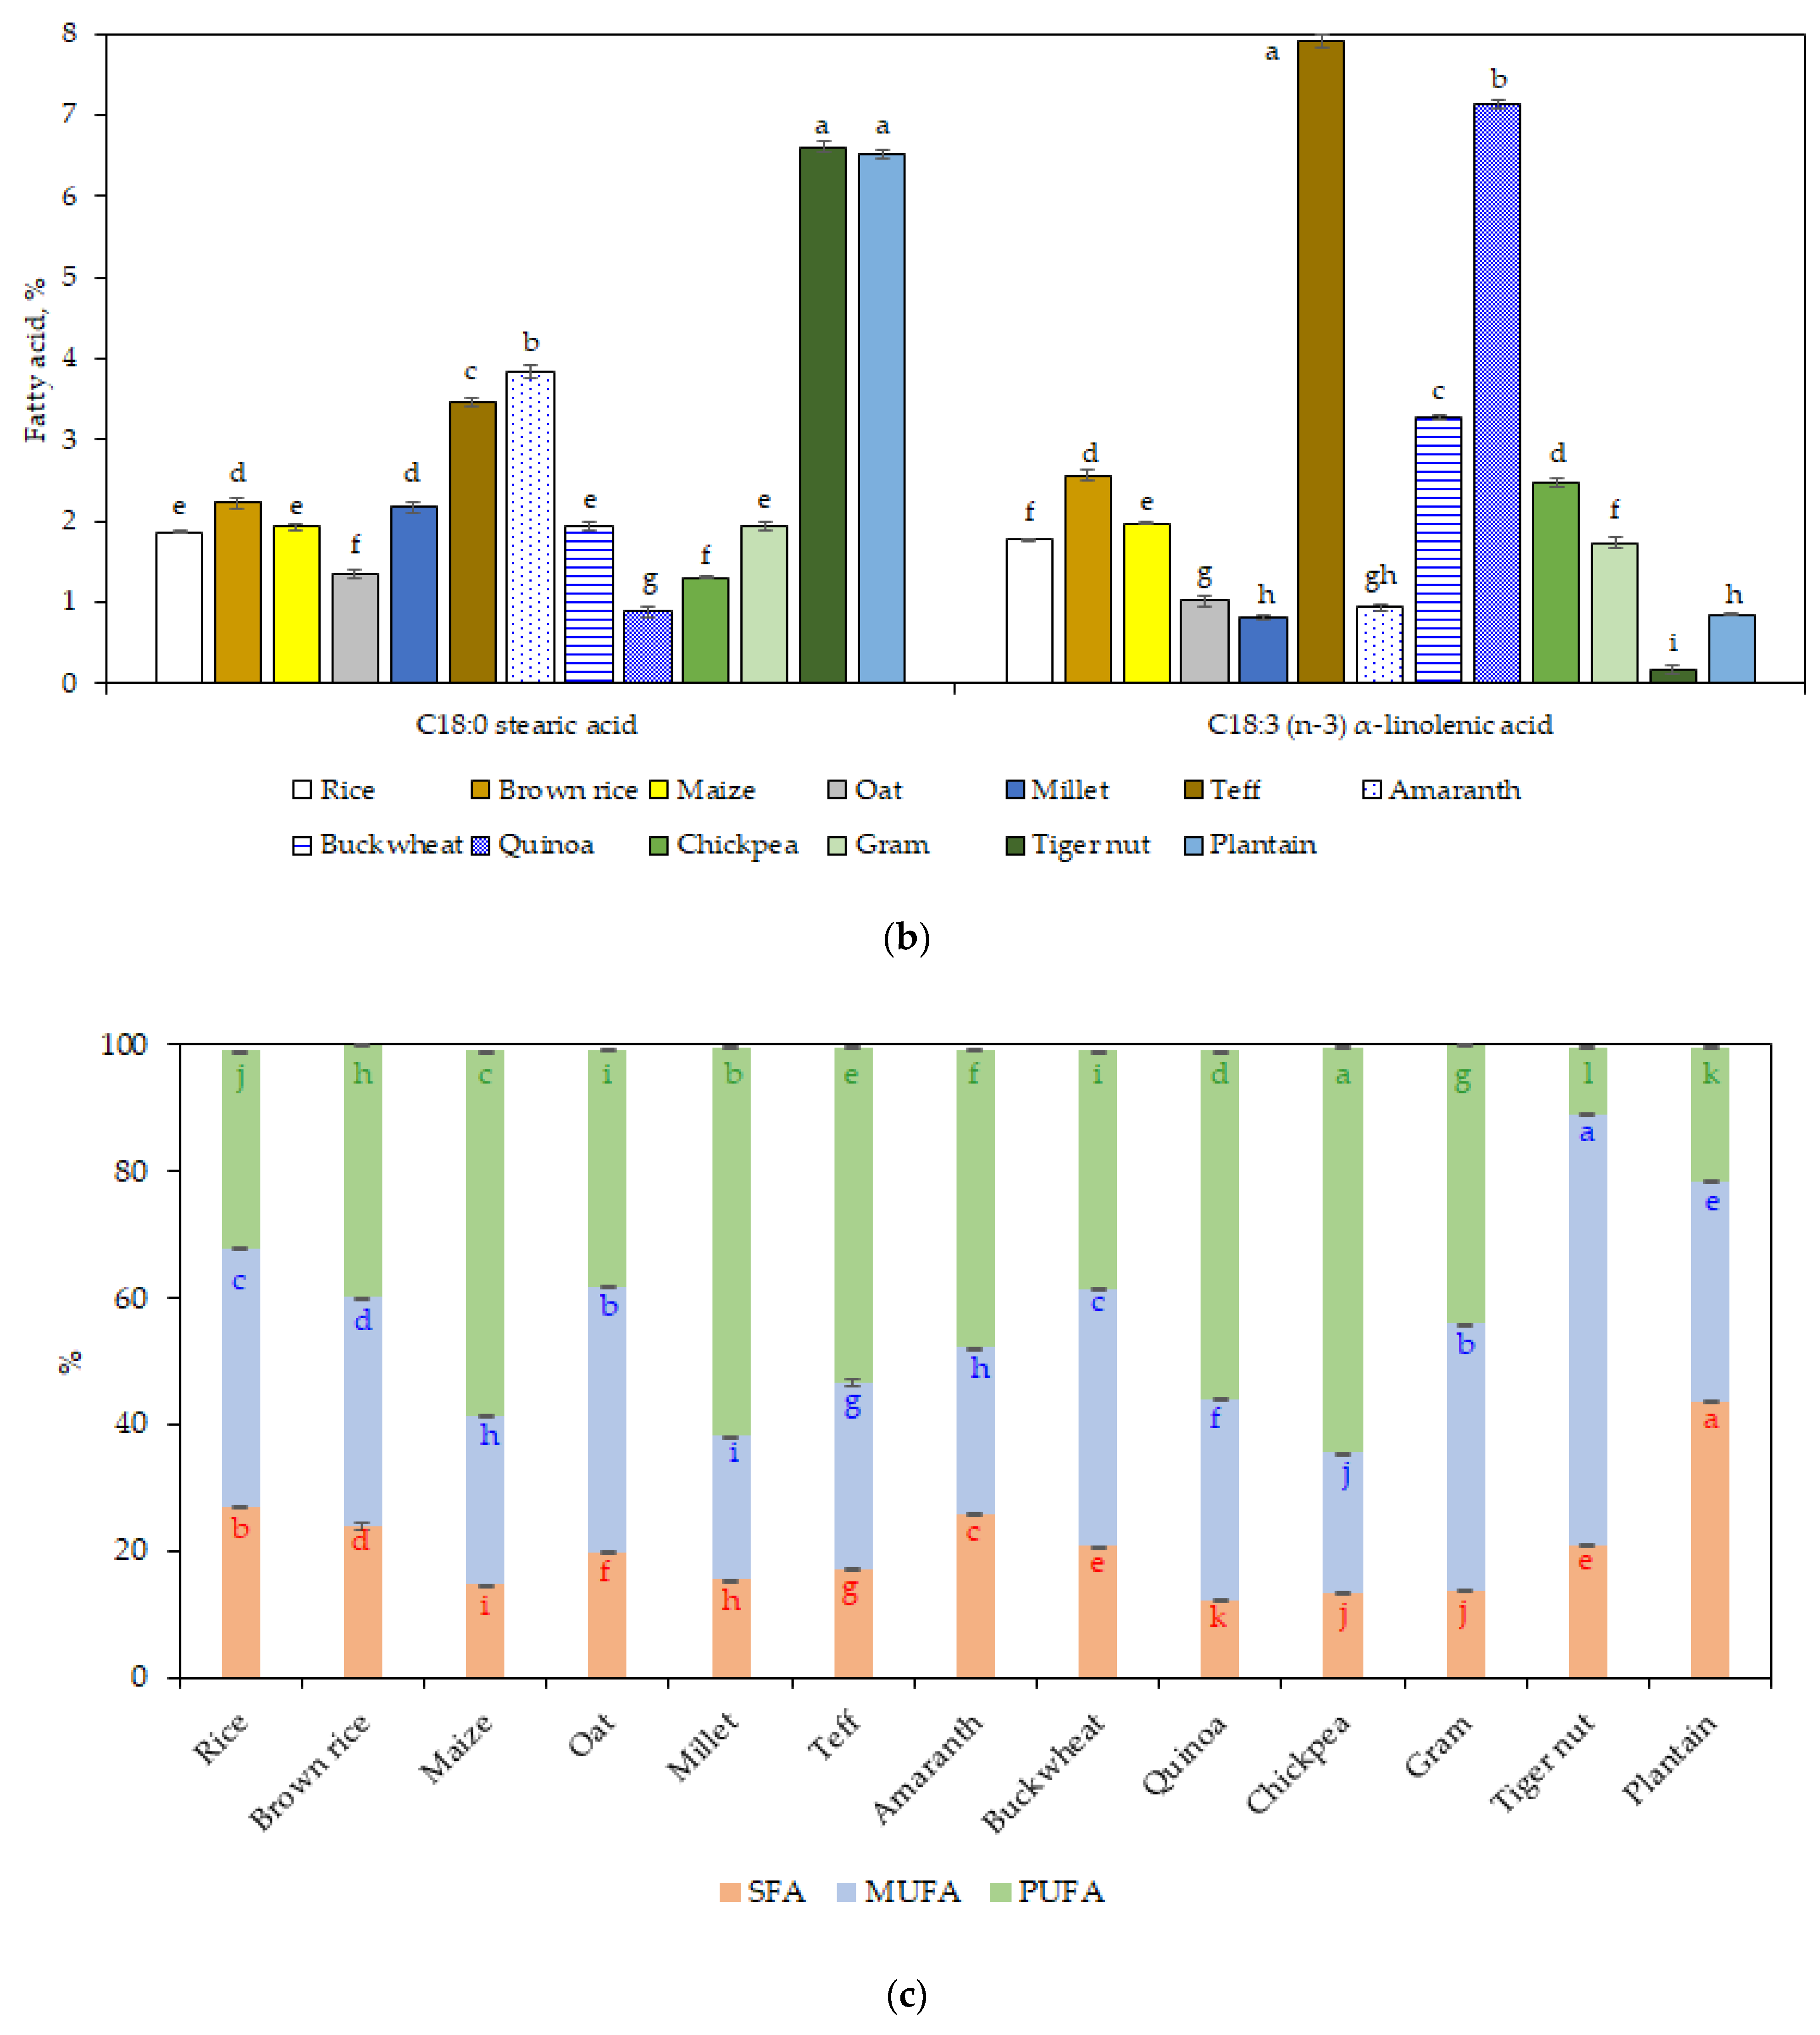
The most abundant fatty acids were oleic, linoleic, and palmitic acid (
Figure 1a), while stearic and α-linolenic acid were in lower amounts (<8% of the total fat) (
Figure 1b). The content of palmitic acid in plantain flour (34.9%) was significantly higher (
p < 0.05) compared to the other GF sources. In addition, the content of stearic acid was significantly higher (
p < 0.05) for plantain and tiger nut flours.
Tiger nut flour had the highest oleic acid content (67%), whereas the lowest was in the chickpea sample (20.4%) (
p < 0.05). Gram, oat, and rice flours did not reveal significant differences in oleic acid content (
p > 0.05); the values were around 40% (
Figure 1a).
In contrast with the highest content in the oleic acid, tiger nut flour showed the lowest level in linoleic acid (10.2%) and α-linolenic acid (0.2%). Thus, tiger nut flour was the highest in MUFA and lowest in PUFA (
p < 0.05) (
Figure 1c). It was stated that tiger nut oil has a MUFA profile similar to olive oil [
49]. Moreover, it was reported that tiger nut oil reduced low-density lipoprotein cholesterol and increased high-density lipoprotein cholesterol as well as stimulated the absorption of calcium in bones mainly attributed to the short and medium chain fatty acids, oleic acid, and essential fatty acids [
50].
Teff flour showed a high amount of α-linolenic acid (7.9%;
p < 0.05), followed by quinoa flour (7.1%). The high value found in teff flour is in line with a recent study [
51], which stated also that α-linolenic acid level in teff was higher than other cereals: sorghum, millet, wheat rice, maize, or oat.
Summing up, the range for the two essential fatty acids varied as following: millet > chickpea > maize > quinoa > amaranth > teff > gram > brown rice > oat > buckwheat > rice > plantain > tiger nut (for linoleic acid) and teff > quinoa > buckwheat > brown rice ≈ chickpea > maize > gram ≈ rice > oat > amaranth ≈ plantain > tiger nut (for α-linolenic acid).
Comparing PUFA/SFA, the most favorable ratio was for chickpea (4.7) and quinoa (4.5), followed by millet and maize (3.9), gram (3.2), and teff (3.1) flours. The others flours had lower values (<2). The higher PUFA/SFA ratio, the more positive effect on cardiovascular health [
52]. Regarding the ratio between omega 6 to omega 3, the values for millet (74.3), tiger nut (61.4), and amaranth (49) flours were higher than for the other GF sources analyzed i.e., chickpea, plantain, gram and maize flours with ratio in the range of 23.6 to 28.3 and rice, quinoa, buckwheat, and brown rice flours with the lowest ratios (6.1–14.5).
A recent study investigating the fatty acid profile of gluten-free bakery products showed that MUFA represent the majority fatty acid group, followed by SFA (30%) and PUFA (13%) [
53]. Another study involving celiac children from Sweden remarked a high intake of SFA and low intake of PUFA in their diet [
54].
The values of fatty acid composition were calculated also to g/100 g d.m. flour and are presented in
Table S2.
3.4. Amino Acid Compositions
The amino acid composition of the GF flours studied is presented in
Table 3 (expressed as g/100 g protein) and
Table S3 (as g/100 g d.m. flour). There was a great variability in the amino acid content between the flours analyzed. Glutamic acid, aspartic acid, and arginine had the highest non-essential amino acids in GF flours, while leucine was the highest essential amino acid. Overall, tiger nut and plantain flours had the lower content in amino acid.
It is well known that lysine is a nutritionally limiting amino acid in cereals. Regarding its content, chickpea (8.5%) and gram (6.6%) flours, followed by the pseudo-cereals (quinoa, buckwheat, and amaranth, between 5.2–5.9%) and oat (5.2%) flours were found to be high in lysine. Srichuwong et al. [
55] also confirmed that the pseudo-cereals amaranth and quinoa contained higher amount of lysine than cereals. It was showed that high levels of globulins and albumins was responsible for high lysine content [
56]. Maize and millet flours showed a high content of leucine (12.3% and 11.8%, respectively), while the lowest content was for plantain and amaranth flours (5.9% and 5.6%, respectively). The percentage of methionine in the GF flours was significantly much higher in millet and teff flours (3.4–3.7%) than the others flours.
Glutamic acid was the most abundant amino acid, ranging from 12.9 to 23.3 g/100 g protein, except for plantain flour with significantly lower value (9.8%). In general, plantain flour had lower level of amino acids, except for threonine and histidine.
The higher arginine content (12%;
p < 0.05) in chickpea and tiger nut will lead to a higher contribution of these flours to the Maillard reaction [
57].
According to
Table 4, gram, chickpea, quinoa, buckwheat, and oat flours did not contain any limiting amino acids as AAS value were higher than 1. Millet flour showed a lack of lysine. In addition, maize, teff, rice, brown rice, and plantain flours were lacking in lysine. Conversely, chickpea and gram flours recorded the highest scores for lysine. PDCAAS ranged between 0.27 and 0.97 (
Table 4). A value of 1 is considered an optimum value. Accordingly, chickpea followed by oat, quinoa, gram, and buckwheat flours can be considered as GF sources with a good protein quality compared to the other flours investigated.
Other indexes which are used to estimate the protein quality are presented in
Table 5. The protein score indicates the chemical score of the most limiting EAA that is present in the sample. The greater the EAAI, the more balanced amino acid composition and the higher quality and efficiency of the protein. EAAI, an indicator of the ratio of essential amino acids of the sample compared to the reference (hen’s egg) and BV (which estimates the nitrogen potentially retained by the human body after consumption) were the highest for chickpea flour, followed by oat, brown rice, maize, and gram flours. The PER index, which describes the ability of a protein to support the body weight increase, was higher for maize and millet flours. Among all the indexes calculated, NI is the only one which considers both qualitative and quantitative factors and it is a global predictor of the quality of a protein source. Accordingly, gram and chickpea flours showed the higher nutritional index, followed by the pseudo-cereals flours, while plantain flour had the lowest NI.
3.5. Protein Digestibility
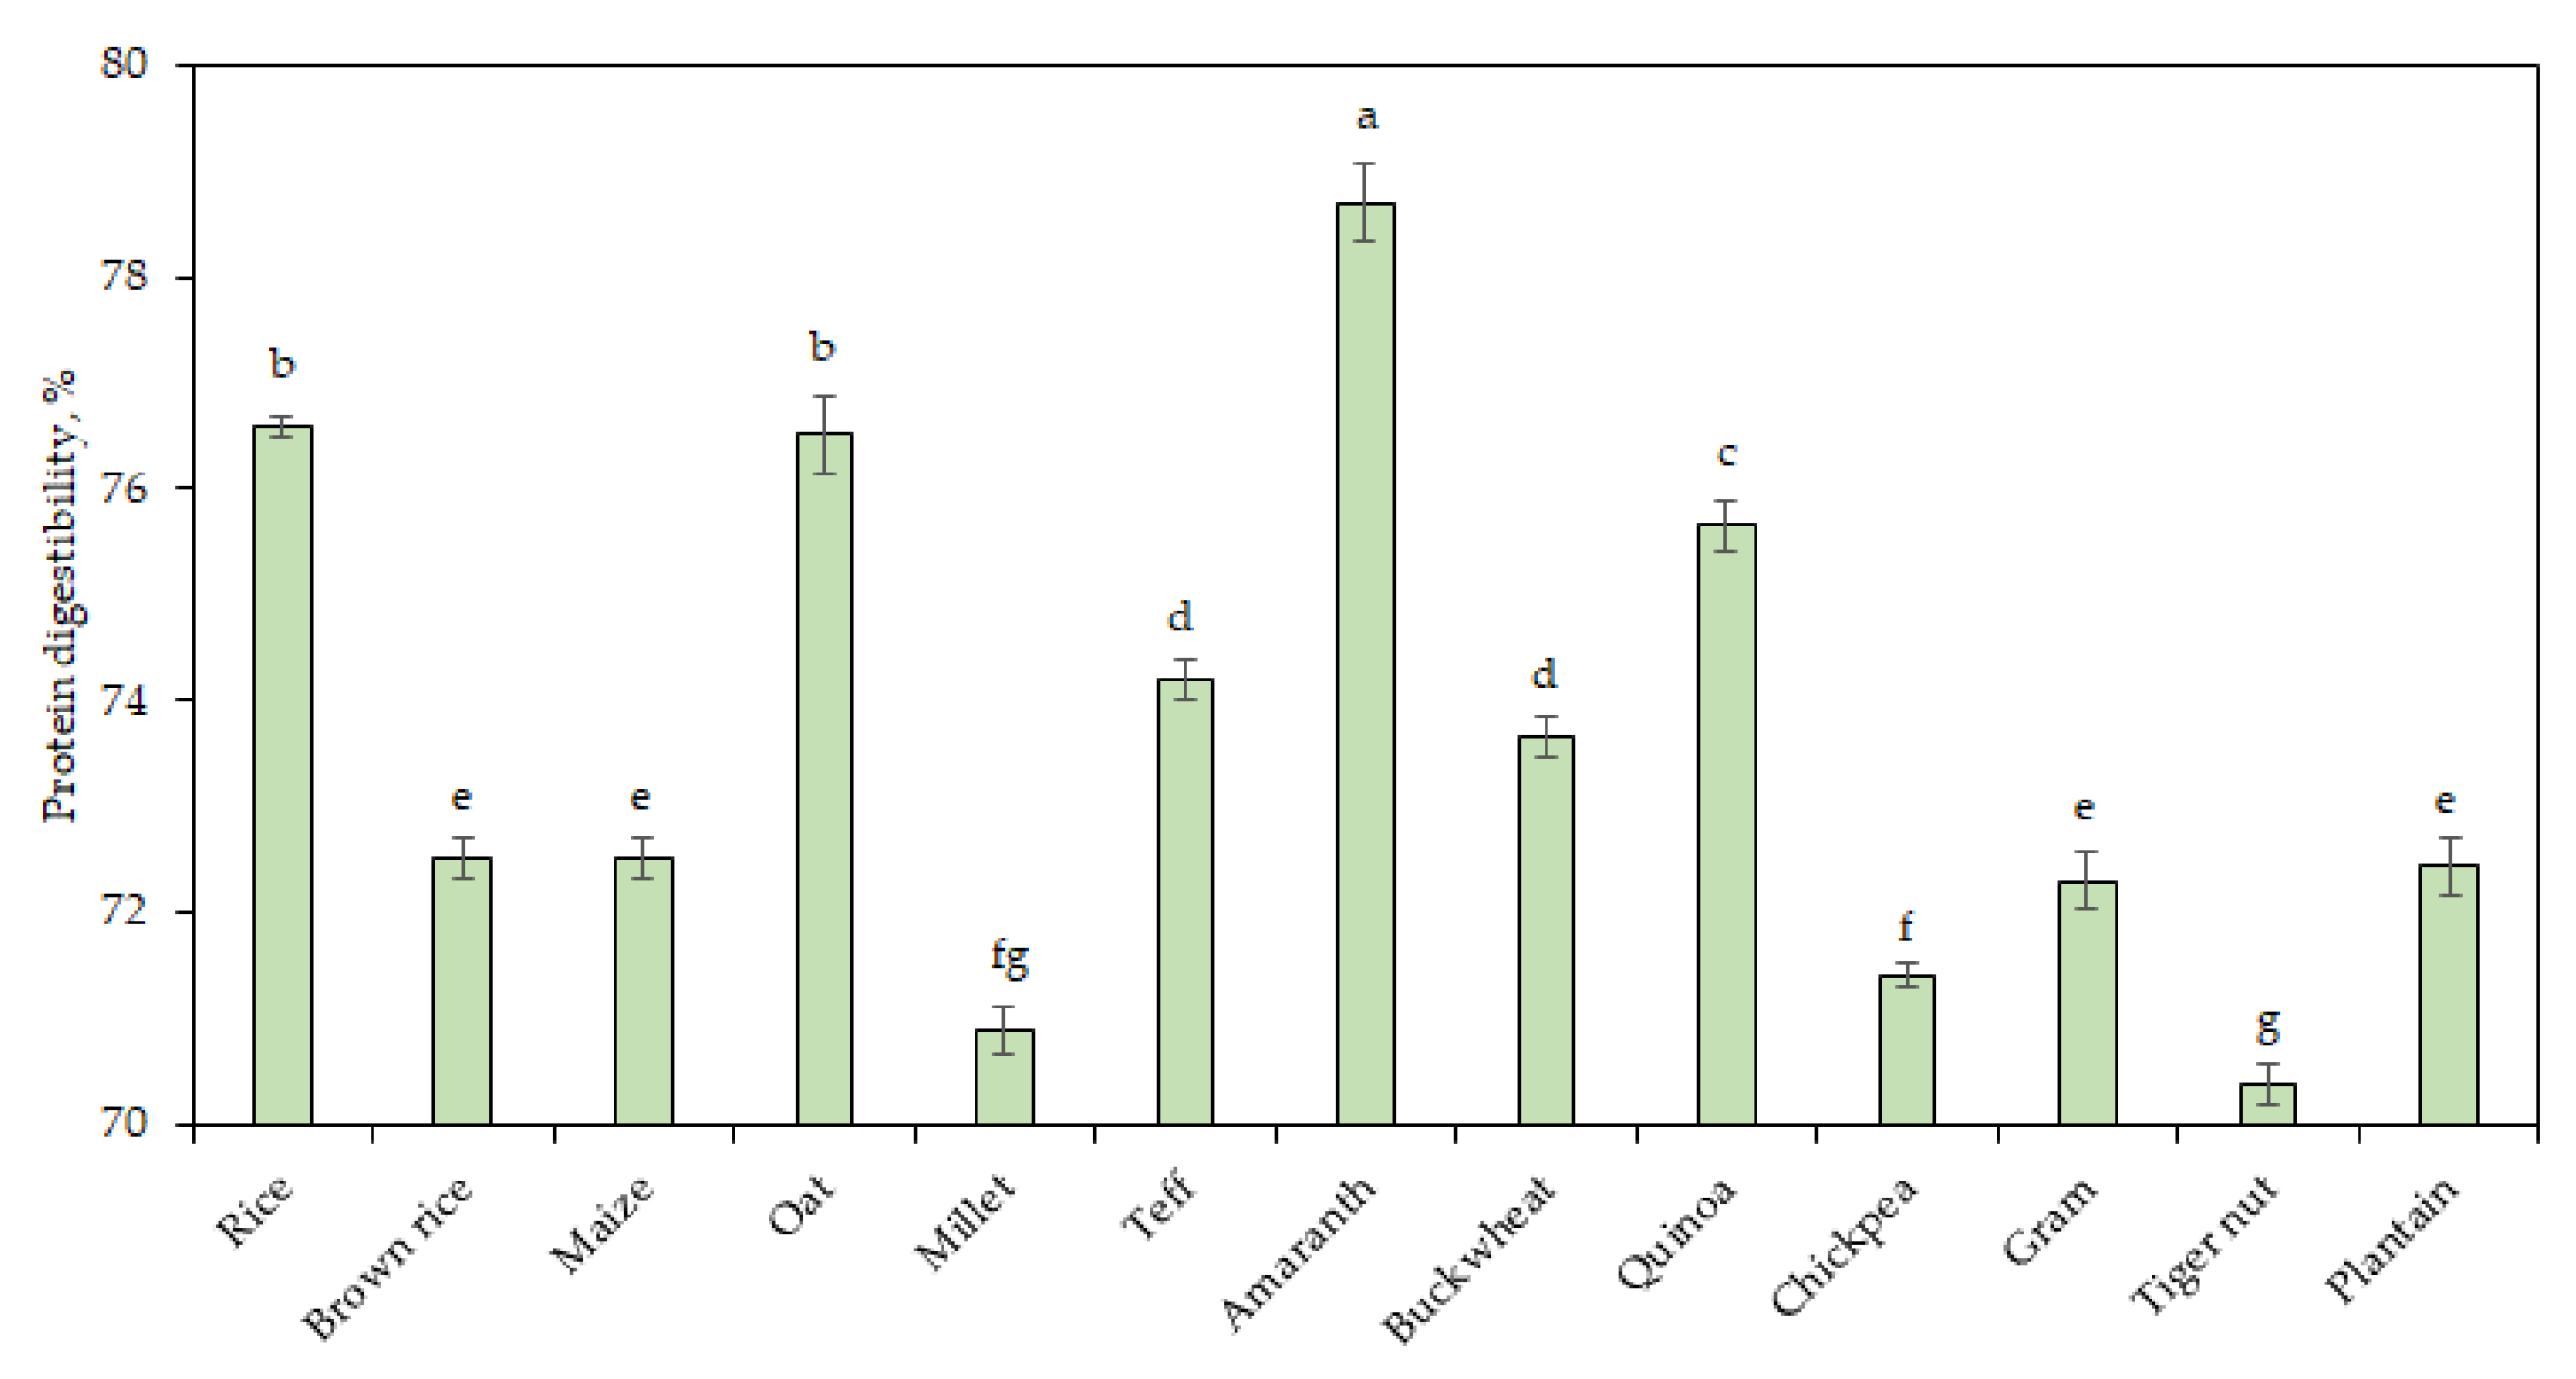
Figure 2 shows the values of the in vitro protein digestibility of the GF flours. Protein digestibility refers to the ability of the protein to be enzymatically hydrolyzed into amino acids. Amaranth flour had the highest digestibility (78.7%;
p < 0.05) among all the flours studied. Tiger nut samples with the lowest protein and highest fiber content had the lowest protein digestibility (70.4%). A previous report stated that lower digestibility is correlated with increasing contents of fiber [
58]. Plantain, brown rice, maize, and gram are a good source of protein as their protein digestibility (72.3–72.5%) were higher than chickpea, millet, and tiger nut (70.4–71.4%). In general, variations in protein digestibility take place after baking and Abdel-Aal [
59] showed that the baking process resulted in significant improvement in protein digestion of spelt bread.
3.6. Total Polyphenolic Content and Antioxidant Capacity
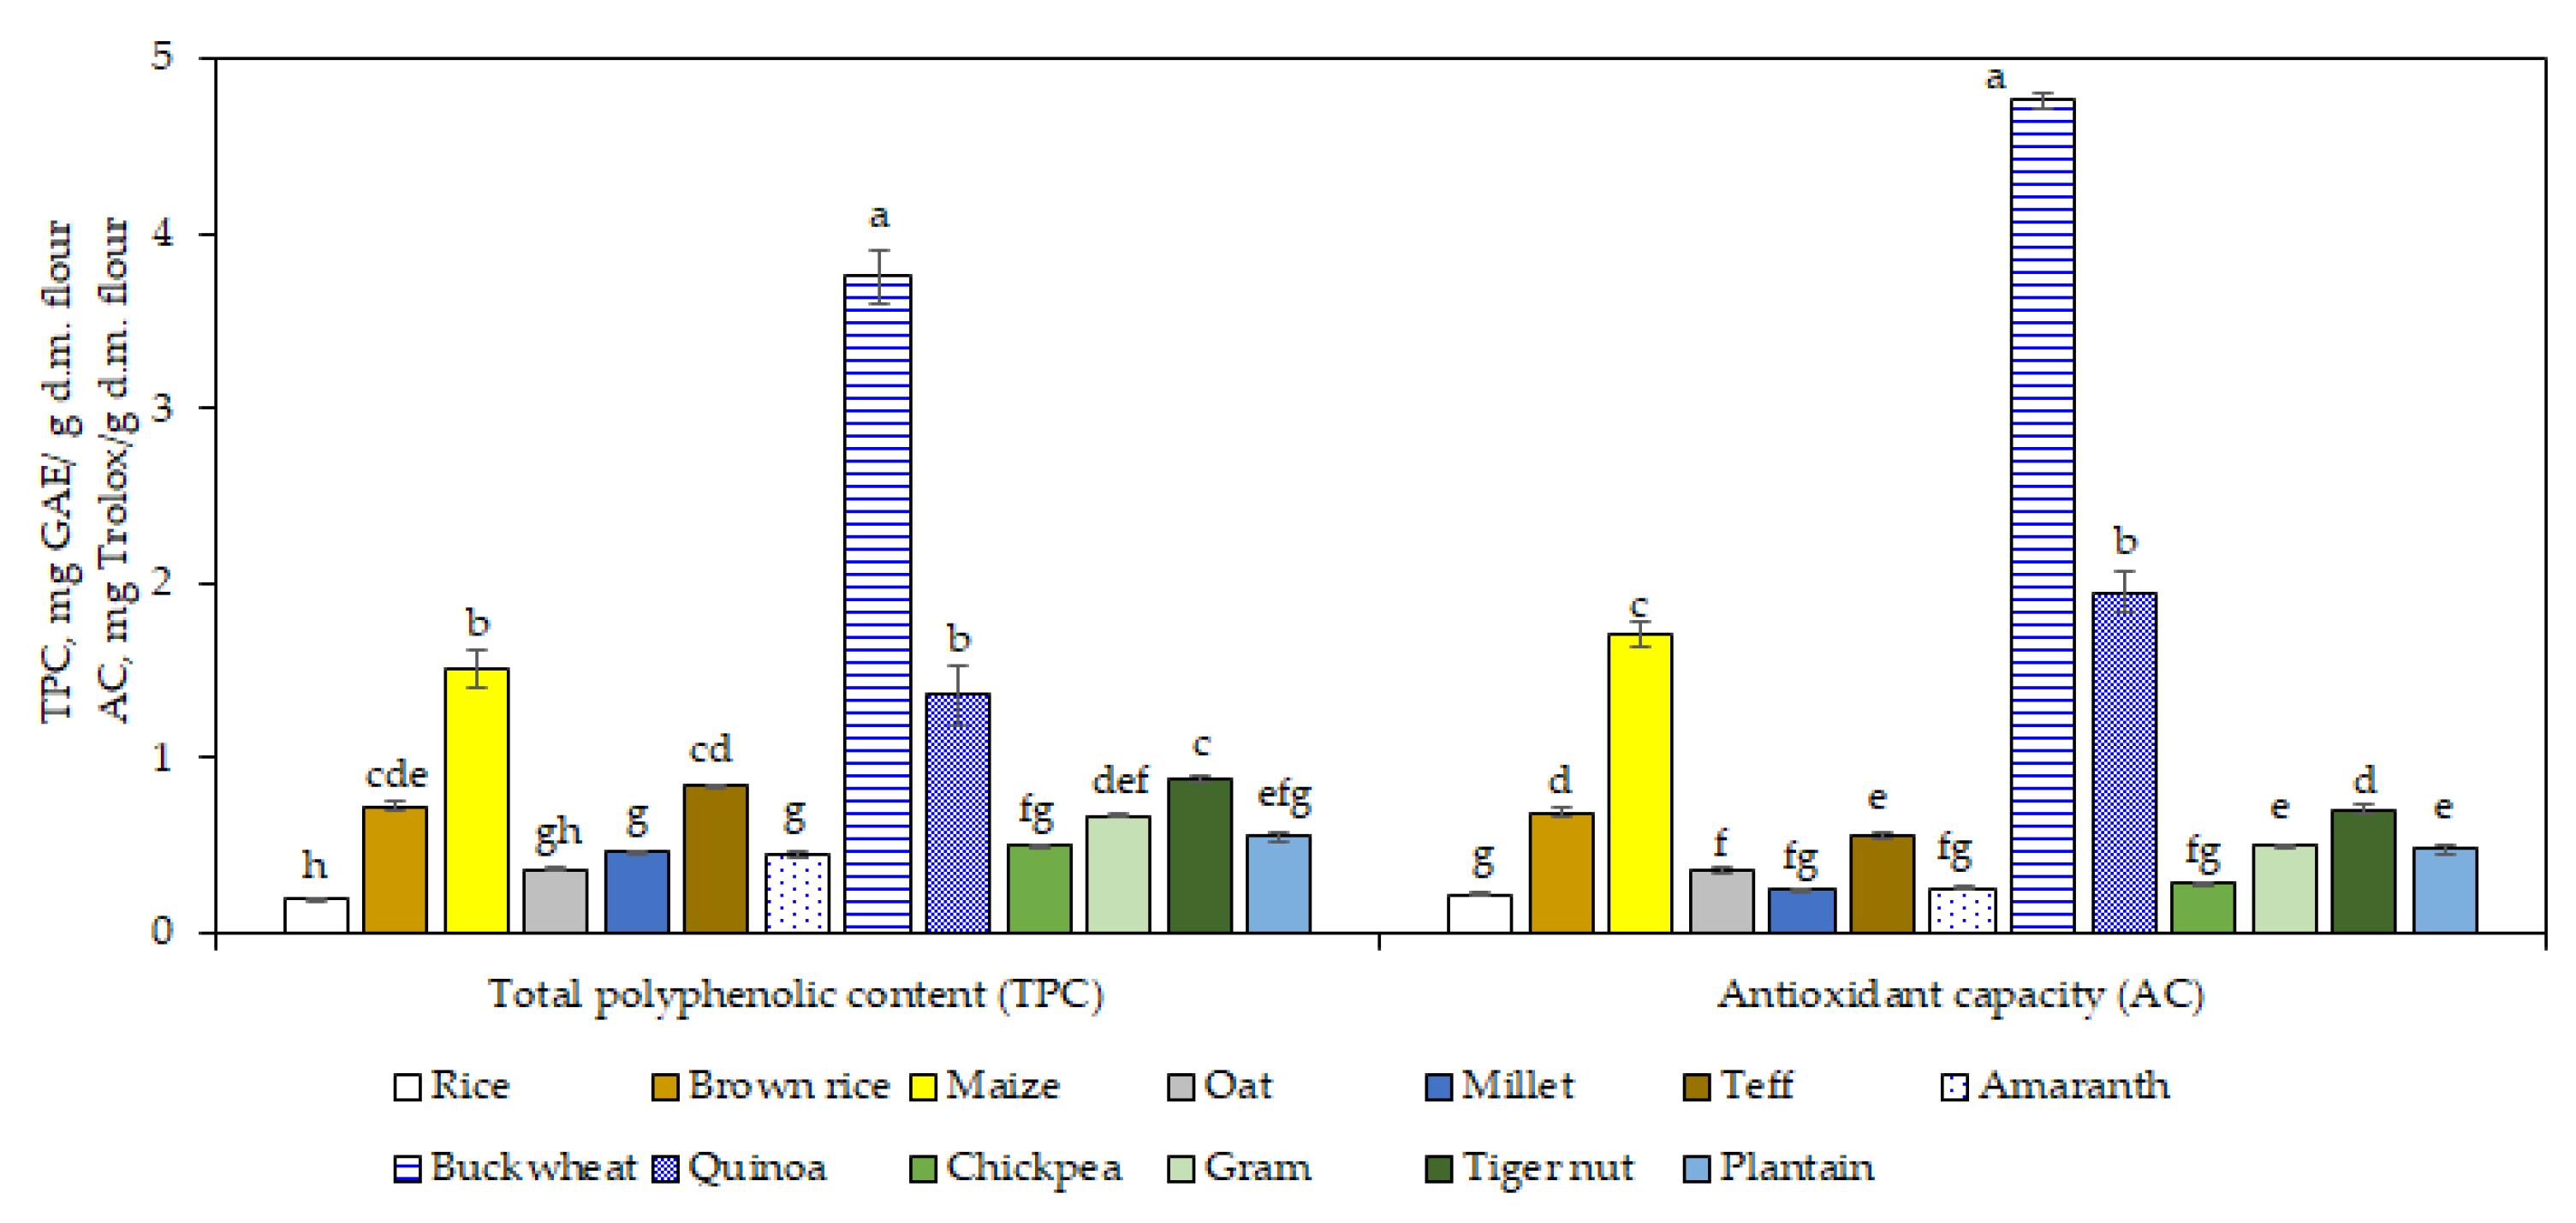
TPC and antioxidant capacity were highest in buckwheat (3.75 mg GAE/g d.m.) and the lowest in rice (0.20 mg GAE/g d.m.) flours, as shown in
Figure 3. It was reported previously that buckwheat presents stronger antioxidative potential that other cereals due to the presence of flavonoids like as rutin, quercetin, epicatechin, and catechin [
60].
Comparable polyphenolic contents were obtained for maize and quinoa flours (1.36–1.51 mg GAE/g d.m.;
p > 0.05), while brown rice, teff, and tiger nut flours showed similar value (0.72–0.88 mg GAE/g d.m.;
p > 0.05). Lower values were obtained for the rest of the samples. The TPC in brown rice was 3.6-fold higher than white rice. No significant difference was found in TPC between chickpea and gram (
p > 0.05). Significant differences in TPC (
p < 0.05) were between the flours from pseudo-cereals, decreasing in the order: buckwheat > quinoa > amaranth. Di Cairano et al. [
37] reported also that buckwheat presented the highest TPC followed by quinoa, millet, and teff. Overall, it should be taken into consideration that TPC results can be overestimated because of the presence of some non-phenolic compounds, which can interfere with the Folin reagent [
61].
In this study, a positive correlation was found between TPC and antioxidant capacity DPPH radical scavenging activities (r = 0.9892;
p < 0.05). This result is in line with Rocchetti et al. [
62], who found that the antioxidant capacity is strongly related to the phenolic profile in different gluten-free flours from cereals, pseudo-cereals, and legumes.
3.7. Gelatinization and Retrogradation Properties
Gelatinization temperatures and enthalpies associated with starch gelatinization varied among the GF flours (
Table 6).
The variation in the thermal properties among the different flours are influenced by some factors such as: size of the starch granule, molecular structure of the amylopectin (branch, length and weight), starch, protein and dietary fiber content, as well as the presence of other compounds [
63]. During starch gelatinization, the helix structure and crystallinity of the starch is lost and the granule is disrupted. Among all the samples under investigation, T
p was highest for the tiger nut flour (
p < 0.05), which can be explained by its highest fat and fiber content. The swelling of the starch granule is disturbed by the presence of non-starch compounds such as fat, which leads to higher gelatinization temperatures [
64]. Demirkesen et al. [
36] also found higher gelatinization temperatures in tiger nut flour than in rice flour because of its higher amount of oil, fiber, and sugar. On the other hand, the lowest T
p was for the oat flour (
p < 0.05). Lower gelatinization temperature is proof of shorter amylopectin chains as lower temperatures are needed for their completely dissociation [
65]. The enthalpy of gelatinization reflects the amount of energy needed to break the molecular interactions in the starch during the gelatinization. Gelatinization enthalpy was significantly higher (
p < 0.05) in plantain and both types of rice flours than in the other samples, because of the high crystallinity of the starch granules in rice and plantain [
66,
67]. In addition, the higher starch content in rice flours and plantain flour needs more energy to open the double helical structure of starch. A less thermal energy was needed for starch gelatinization in the tiger nut and oat flours, followed by chickpea and gram samples.
Retrogradation temperature and enthalpy were considerably lower than the gelatinization parameters, which denotes weaker starch crystallinity (
Table 6). As described by Karim et al. [
68], the lower values for the thermal transitions during retrogradation were attributed to improper realignment of amylose and amylopectin molecules that forms a less stable crystalline structure.
The peak corresponding to the retrograded starch presented similar values for most of the samples, except for brown rice, amaranth, oat, and buckwheat flours with significantly lower values (
p < 0.05). Plantain, rice, millet, maize, gram, chickpea, and buckwheat presented a greater tendency to retrograde (higher value for the retrogradation enthalpy). The degree of retrogradation evaluated as the ratio of retrogradation to gelatinization enthalpy showed significantly lower values (DR < 10%;
p < 0.05) for amaranth, quinoa, brown rice, teff, tiger nut, and oat compared to the other GF flours; thus, these samples present an advantage on retarding starch retrogradation. Srichuwong et al. [
55] stated that the low retrogradation tendency of starch in quinoa and amaranth were the result of the short amylopectin branch chain and high content of the soluble dietary fiber. The use of GF flours with lower retrogradation enthalpy and DR are relevant for increasing the shelf-life of bakery products.
3.8. Functional Properties of GF Flours
Table 7 presents the functional properties of GF flours, which are influenced by the flour constituents and the relationships between them.
Water absorption capacity reflects the amount of water that the flour can absorb and retain. The water absorption capacity was highest (
p < 0.05) for chickpea flour (1.92 g/g) and lowest for teff and amaranth flours with values around 0.95 g/g. For an improved food texture of bread products, higher values for water absorption are desired. Higher water absorption values were attributed to the higher content of starch and fiber [
27,
69]. Patil and Arya [
69] also stated that higher protein content tends to increased water absorption. However, in the present study, no good correlation was found between water absorption and protein content (r = 0.2099) or starch content (r = −0.4392).
Of all the GF flours studied, amaranth, tiger nut, and chickpea flours exhibited the highest oil absorption capacity (1.8–1.9 g/g), being suitable for retaining the flavor and enhance the mouthfeel when used in foods. For the other Gf flour, oil absorption capacity ranged between 1.66 and 1.80 g/g, with higher value for brown rice flour than rice. However, Di Cairano et al. [
37] did not find any significant difference in the different GF studied regarding the oil absorption capacity. The water and oil absorption capacity depends on the type of protein, amino acid composition and protein polarity and hydrophobicity [
70]. Moreover, variation in the amylose/amylopectin ratio contributes to differences in the water as well as oil absorption capacity of flour [
71].
The degree of starch from the flour that absorbs water is expressed by the swelling power property. The swelling power of the GF flours varied from 3.14 to 7.32 g/g, where the lowest values were obtained for the tiger nut flour, while the highest were for rice, plantain, and amaranth flours. The high swelling power could be related with the higher content of amylopectin [
27]. Tiger nut flour with the lowest amylopectin content (69.87%) showed the lowest swelling power (3.14%). However, only a small correlation was found between amylopectin content and swelling power (0.4694;
p > 0.05). On the other side, fats inhibit the swelling property. The significantly higher fat content in the tiger nut flour (25.15%) explained the very low swelling capacity of this flour. Accordingly, the fat content was negatively correlated with the swelling power of the GF flours (−0.67211;
p < 0.05).
The foaming capacity of the GF flours ranged from 7.8% in oat and rice flour to 83.5% in teff flour. A very strong difference was noted between rice and brown rice, the latter being 8.1-fold higher than normal rice. The foam capacity of a flour is dependent on the configuration of protein molecules and carbohydrates present in the flour [
71,
72]. Flour intended for use in bakery products should present good foam capacity.
Bulk density represents a measure of flour heaviness [
34]. The highest bulk density (
p < 0.05) was in case of buckwheat, teff, and rice flours, whereas amaranth flour had the lowest value (
p < 0.05) among the flours analyzed. Bulk density and fat content of the flours were slightly negatively correlated (r = −0.4796;
p > 0.05). This result was in contrast with the observation of Joshi et al. [
72], who reported that full fat flours tended to exhibit higher bulk density as lipids might act as adhesives in the aggregation of the flour particles, leading to an increase in the bulk density. Di Cairano et al. [
37] stated that the variable results in the bulk density of the different sources of GF analyzed are related to the nonhomogeneous particle size distributions of the flours.
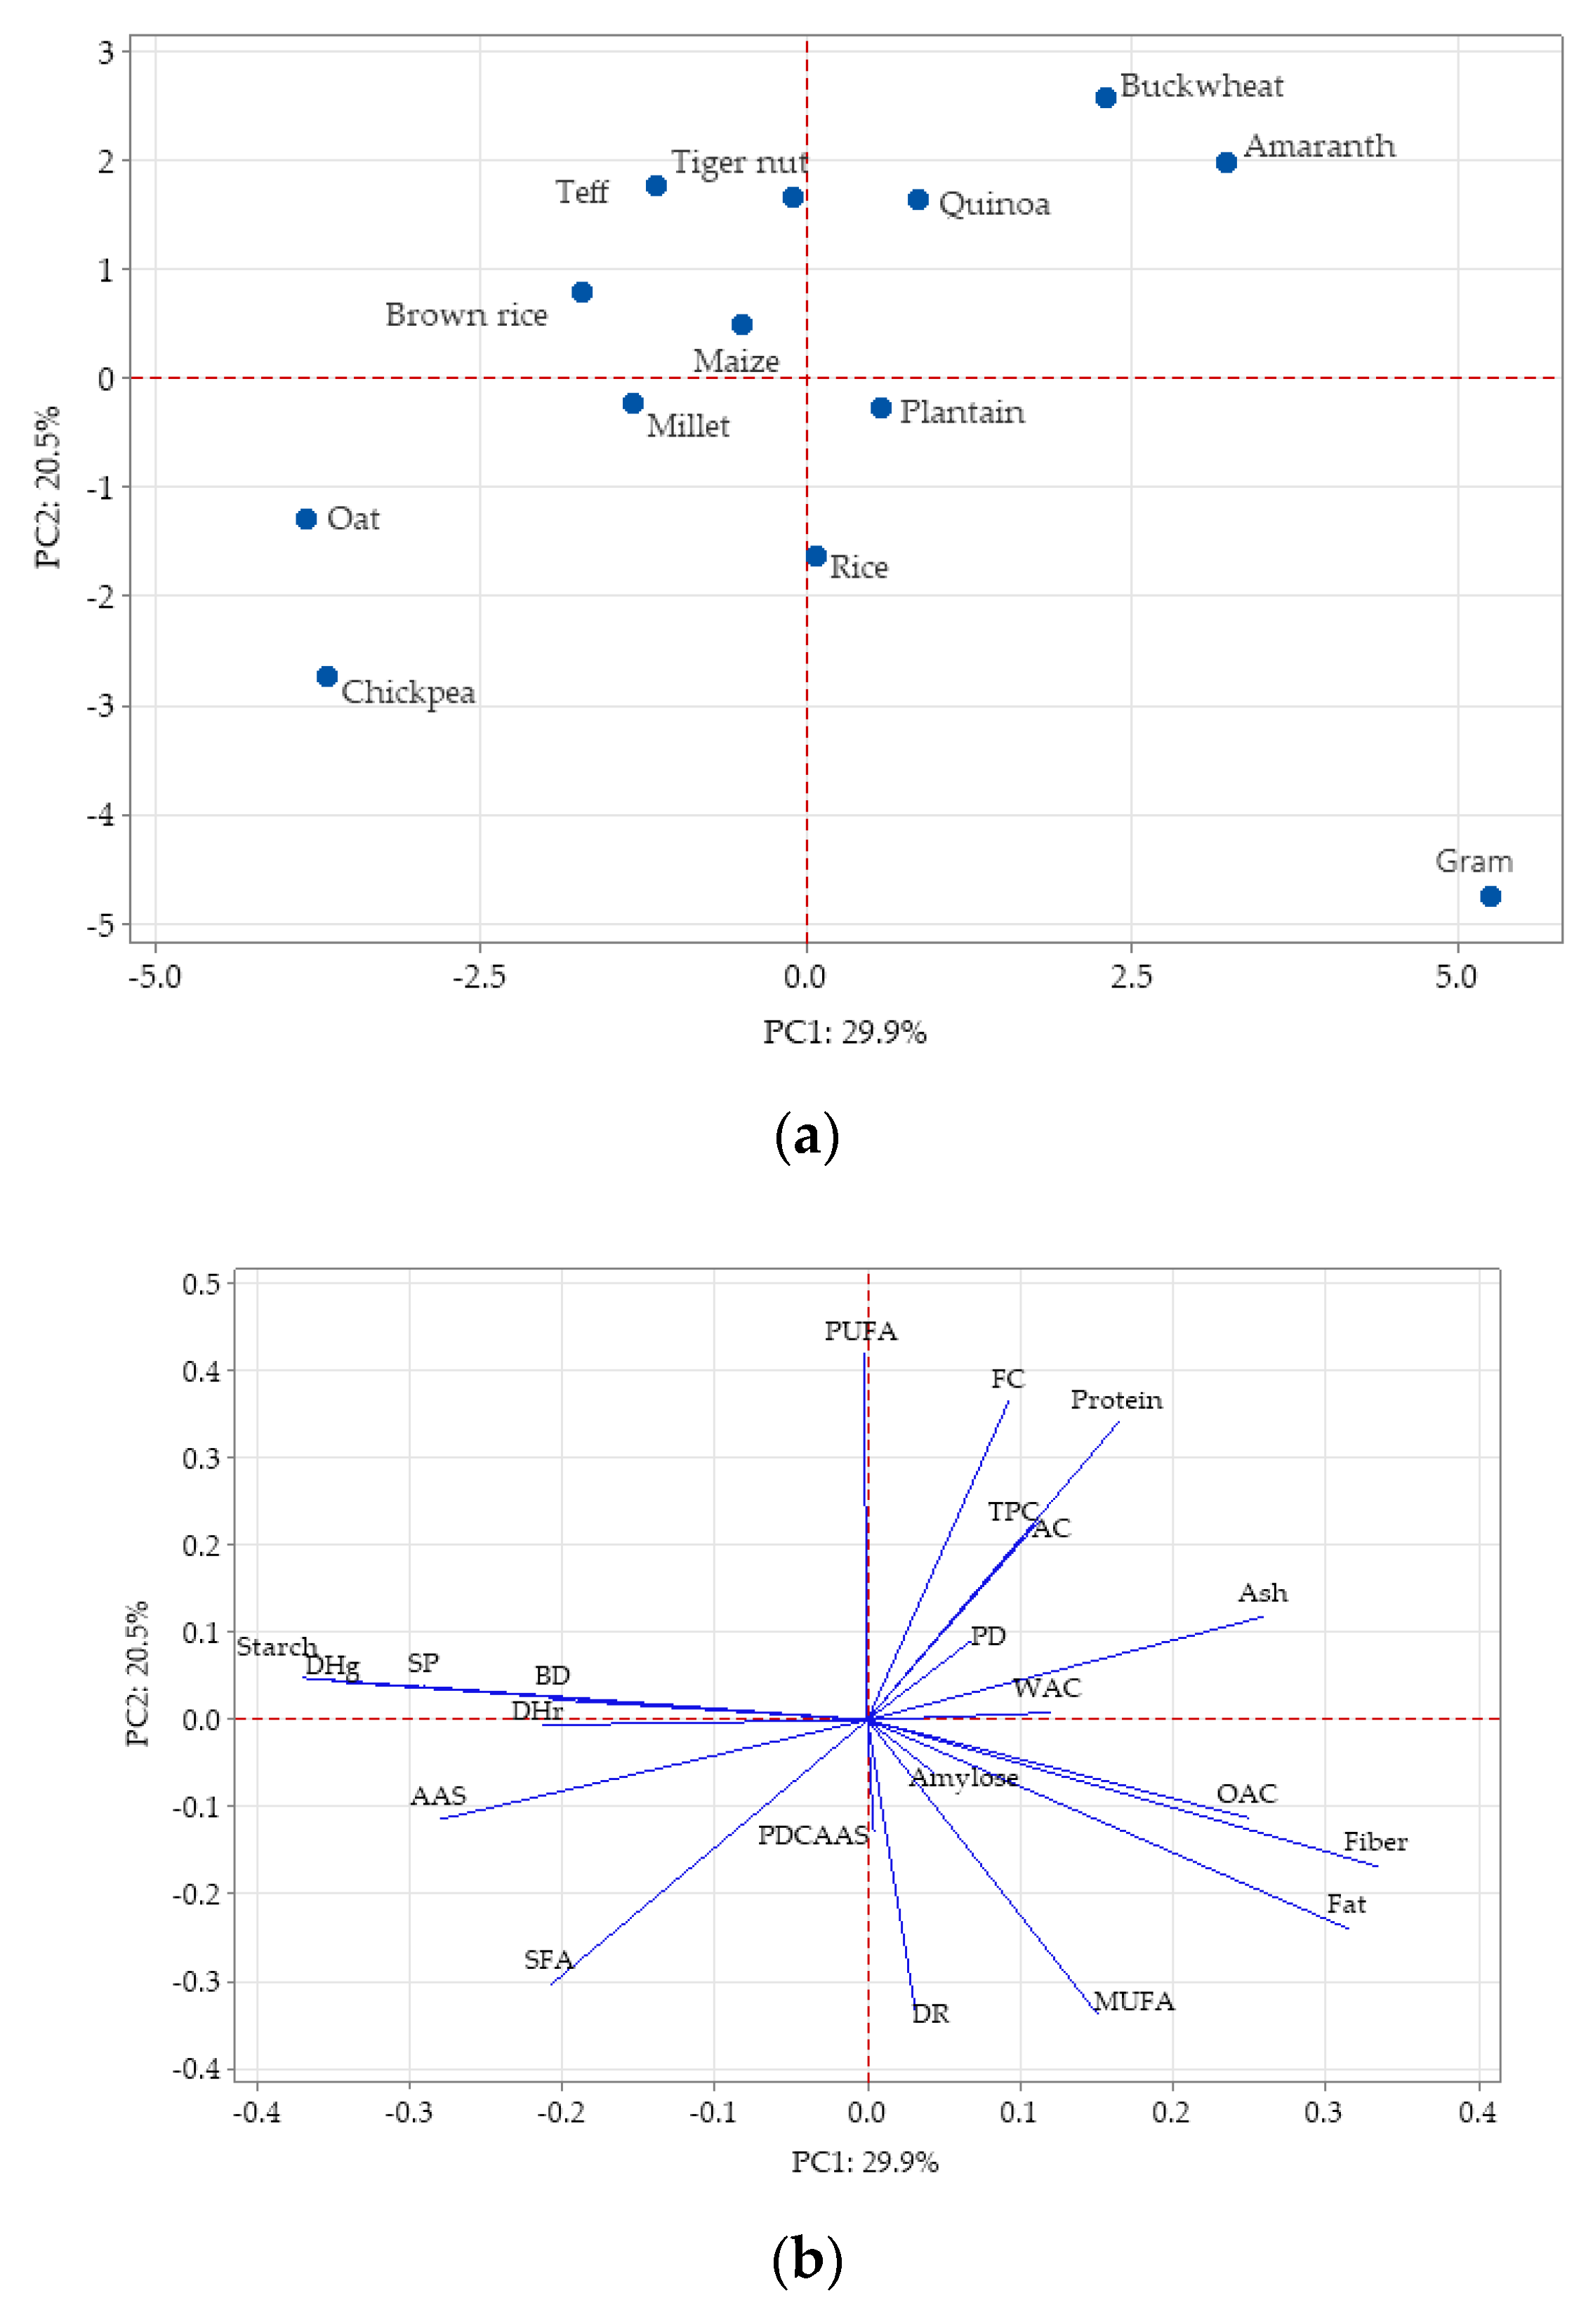
3.9. Principal Component Analysis
Principal component analysis (PCA) was used to show the variation among the gluten-free flours and identify correlations between the parameters analyzed (
Figure 4). Earlier studies also used PCA analysis to visualize variation between the characteristics of different flours [
37,
69].
The aim of PCA analysis is to reduce a big number of variables to a few variables, referred to as principal components (PCs) [
73]. The results were projected onto the first principal component (PC1)/second principal component (PC2) plane. The PC1 and PC2 described 29.9% and 20.5% of variance, respectively. The plot shows the similarity between quinoa, buckwheat, and amaranth flours (the so-called pseudo-cereals sources) as these samples are located closely in the upper right part of the PCA plot. Other similarities were observed between several groups: oat and chickpea flours; rice and plantain flours; tiger nut, teff, brown rice, and maize flours as all these groups were clustered together on the plot. On the other hand, gram flour was very distinct compared to the other flours with a high negative score in PC2 (
Figure 4a). Investigating different properties of GF flours, Di Cairano et al. [
37] also found similarities on one hand between cereal flours (millet, sorghum and teff) and on the other between legumes flours (chickpea, red lentil, lentil, and pea). The same authors stated that buckwheat flour was differentiated by the other pseudo-cereals, amaranth and quinoa, mainly for the phenolic compounds and oil absorption capacity. This observation was opposite to the results from the present study, where the pseudo-cereal flours were clustered together.
Figure 4b shows that the parameters with curves in close proximity are positively correlated, while the curves in opposite senses are negatively correlated. PC1 had positive associations with fiber, fat, ash, and oil absorption capacity, while starch, gelatinization enthalpy, swelling power, amino acid score, retrogradation enthalpy, saturated fatty acid, and bulk density had negative associations with PC1. The second component is well-characterized by polyunsaturated fatty acid, foaming capacity, protein, total polyphenolic content, and antioxidant capacity. PC2 has large negative associations with monounsaturated fatty acid, degree of retrogradation, saturated fatty acid, fat, and fiber.
4. Conclusions
To improve the quality of GF products, the trend is to use nutrient flours and find solutions for sensory and technology challenges.
The main idea of this study was to have a general overview and comparison of different gluten-free flours and to drag attention to the possibility to use other types of flours, such as gram or plantain flours in GF products. It was rather difficult to compare some of the results from this study with others from the literature because of the difference between the samples related to genotypes, environmental conditions, geographical region, and analysis methods.
Amino acid composition of the GF flours and the calculated value for PDCAAS indicated that chickpea, oat, quinoa, gram, and buckwheat flours were better protein quality sources compared to millet, maize, teff, tiger nut, rice, or plantain. To improve health conditions, the accent is to lower the consumption of SFA, increasing the PUFA and MUFA intake; thus, gram, chickpea, maize, and quinoa flours are good candidates. The starch from amaranth, quinoa, brown rice, teff, tiger nut, and oat had improved cold-storage stability and from this point of view, are more appropriate for increasing the shelf life of the bakery products.
Amaranth, tiger nut, and chickpea flours having the highest oil absorption capacity could be better than other GF flours as a flavor retainer.
PCA analysis concluded that there were similarities between oat and chickpea flours; rice and plantain flours; tiger nut, teff, brown rice, and maize flours. Thus, combinations between them would be possible. Gram flour was more distinct from all the GF flours analyzed, highlighted by its position in the PCA plot. Gram flour was characterized by higher protein, fat and ash content, higher protein digestibility, lower starch content, lower SFA, and no limiting amino acids.
Information about the complete characterization of GF flours will allow not only to establish possible combinations between them with the aim to enhance the nutritional profile of the bakery products, but also to be used in other types of products, such as beverages, soups, sauces, or food adjuvants.


