
Simulation of Sowing Precision in Laboratory Conditions


 ,
,  ,
, 
 ,
,  ,
, 
Abstract
1. Introduction
- Mechanical seed meters require a much more precise adaptation of hole sizes to the seed sizes of the crops to be sown [9];
- The diameters of the holes in the distributing discs of mechanical seed meters must be approximately 10% larger than the seed diameters [10];
- Sowing precision is higher for pneumatically assisted seed meters [10];
- Seed meters’ drive can be mechanical, electrical or hydraulic [11];
- Eliminating seed surplus from the holes of the distributing discs is done by means of a singulator of different shapes;
- The removal of broken seeds and residues that can clog the holes of the distribution discs is done by means of: ejector wheels that are interchangeable depending on the crop to be sown [12]; ball rod devices actuated by means of a spring which enters the holes of the distributing disc after passing the seed release area into the guiding tube [13,14]; and controlled penetration of free air into the depression chamber [15];
- Elimination of seed compaction inside the seed meters is ensured by mechanical means (agitators mounted on the drive shaft of the distributing disc, and vibrating mechanisms) and pneumatic means [16];
- To avoid collision of the seeds with the walls of their guiding tube towards the furrow and to manage the speed of seed inside the guiding tube, row units were built where the seed guiding tube was replaced with a brush belt that places the seeds at the bottom of the furrow according to agrotechnical norms [17,18];
- The modular construction of the seed meters allows: rapid replacement of the distributing discs when different crops are sown, hence the distribution of various types of seeds; quick check of seed meters when disturbances of the optimal sowing process are found; easy filling and emptying at the beginning and end of sowing work; and the rapid cleaning of seed meters [19,20].
2. Materials and Methods
2.1. Tests under Operating Conditions
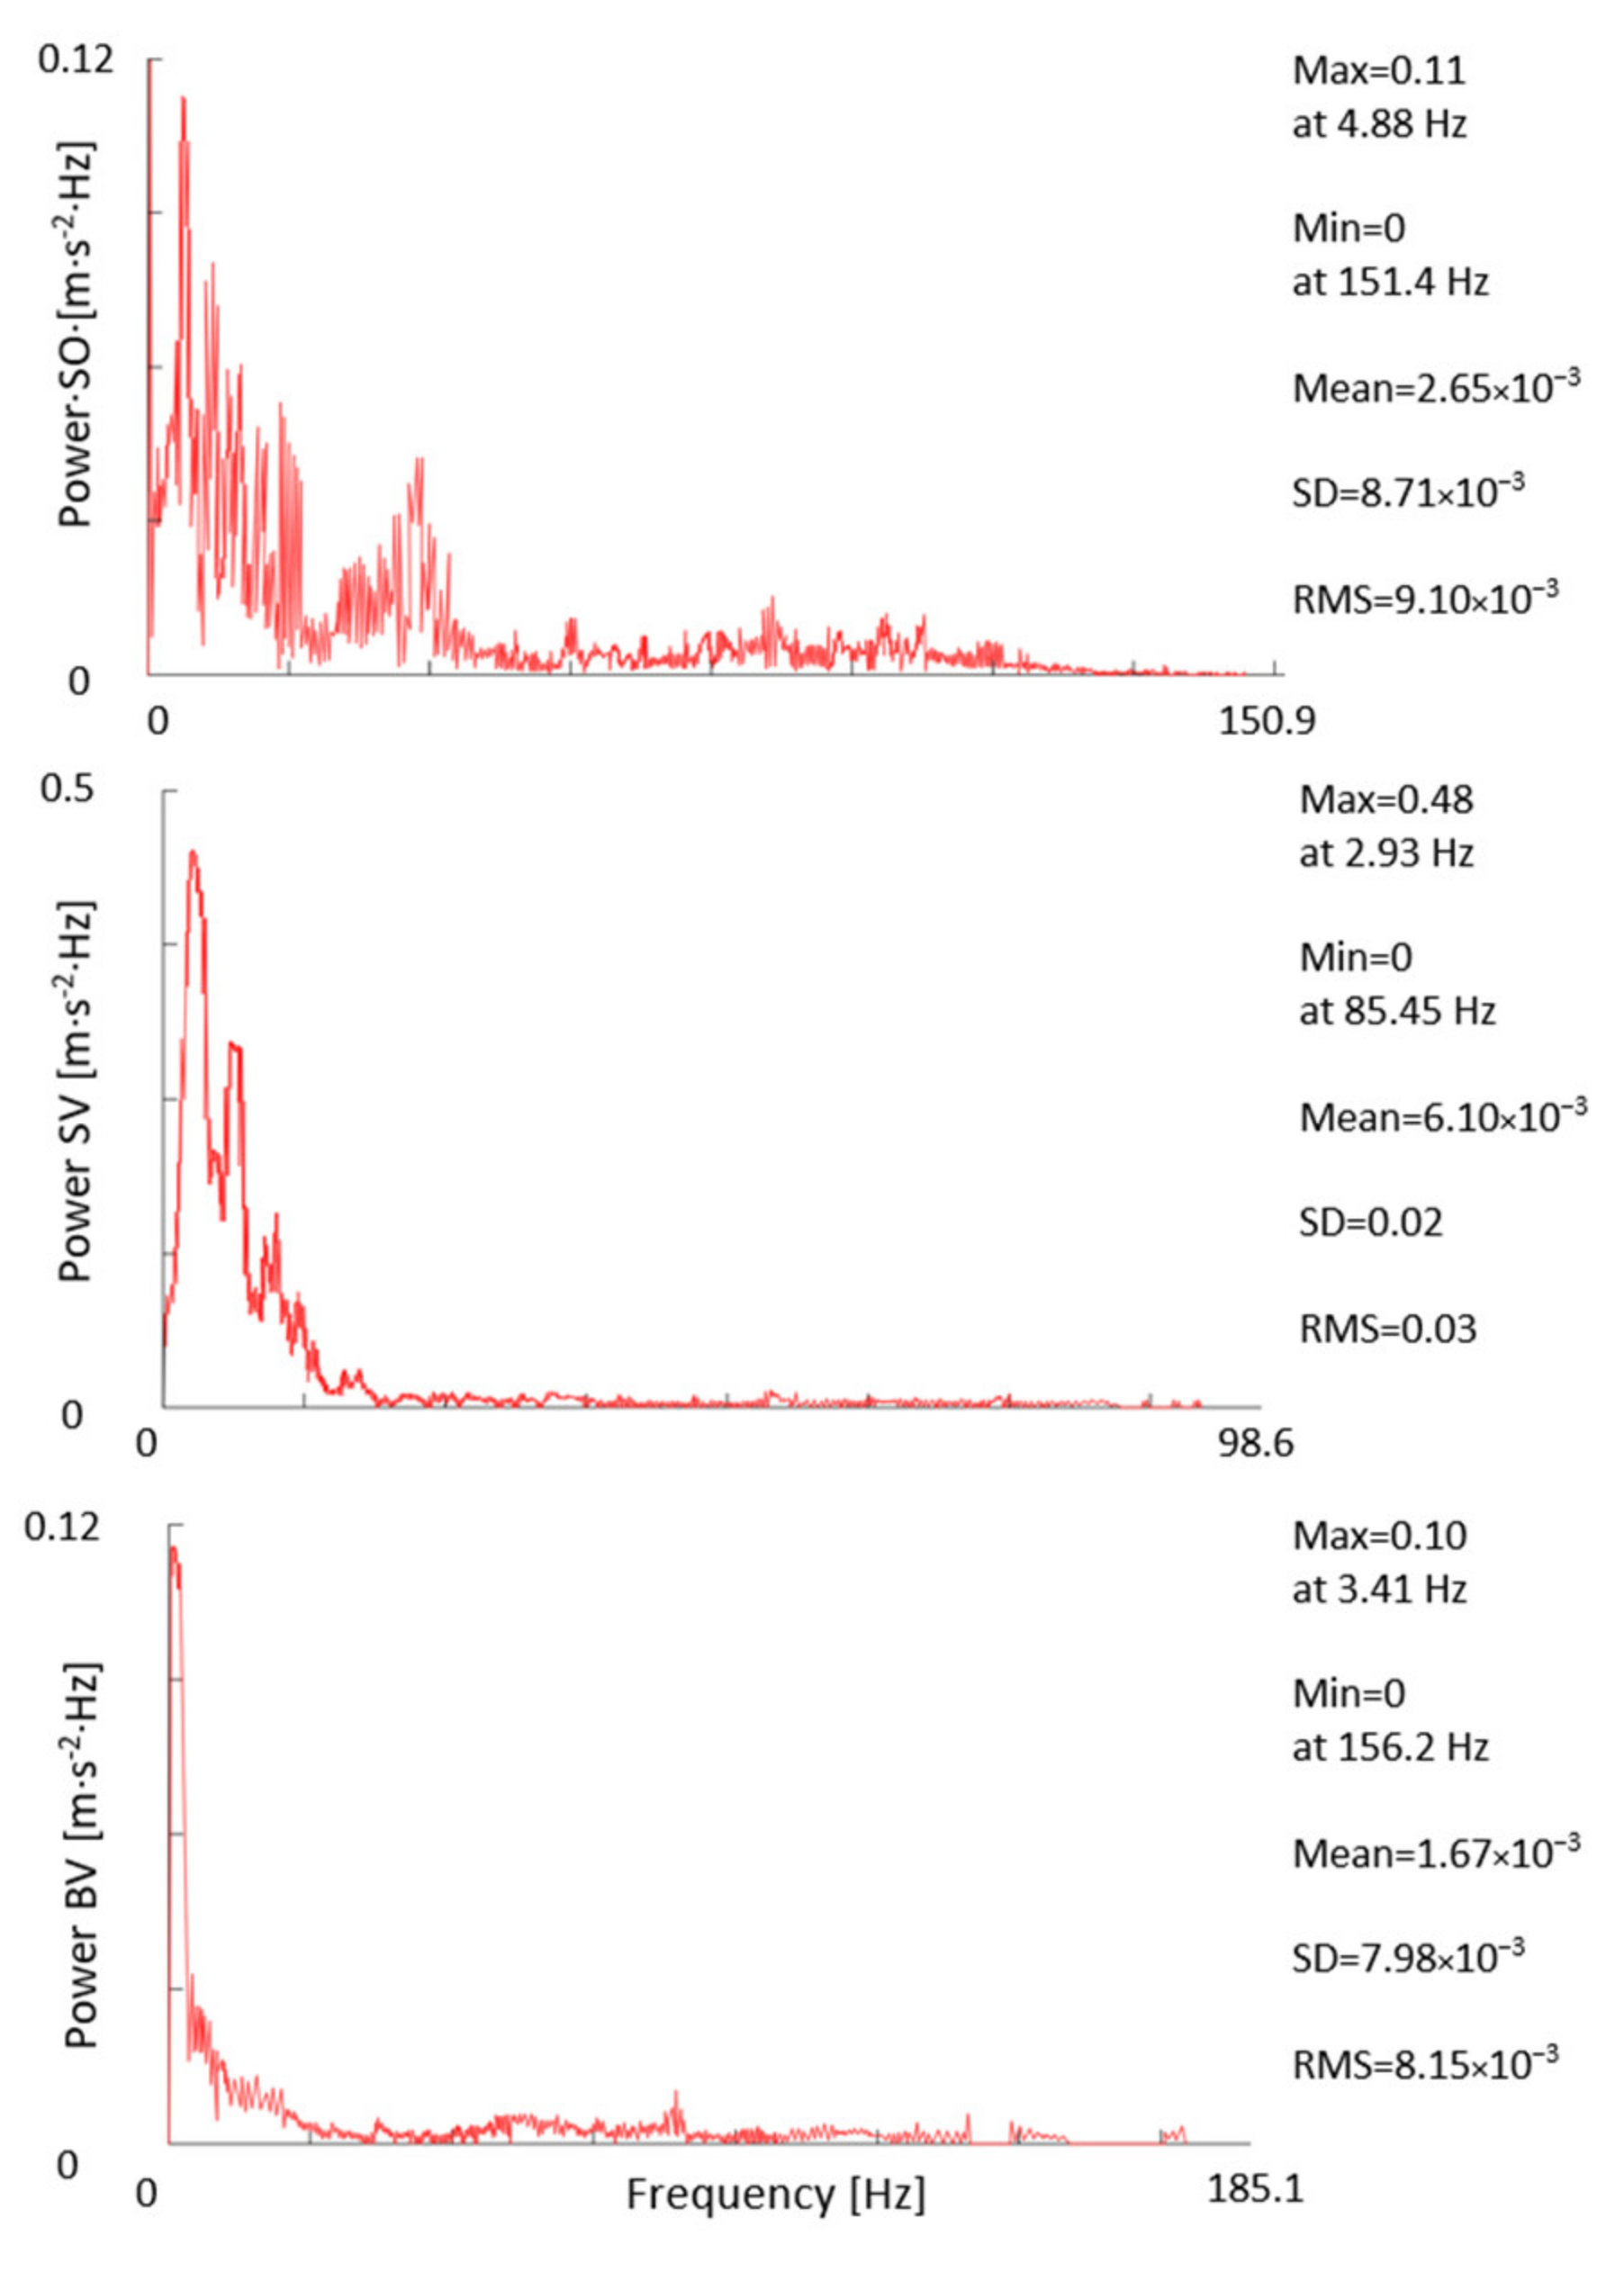
- On the SO, SV, and BV row unit in the horizontal and vertical direction;
- On the planter’s frame only on the vertical direction.
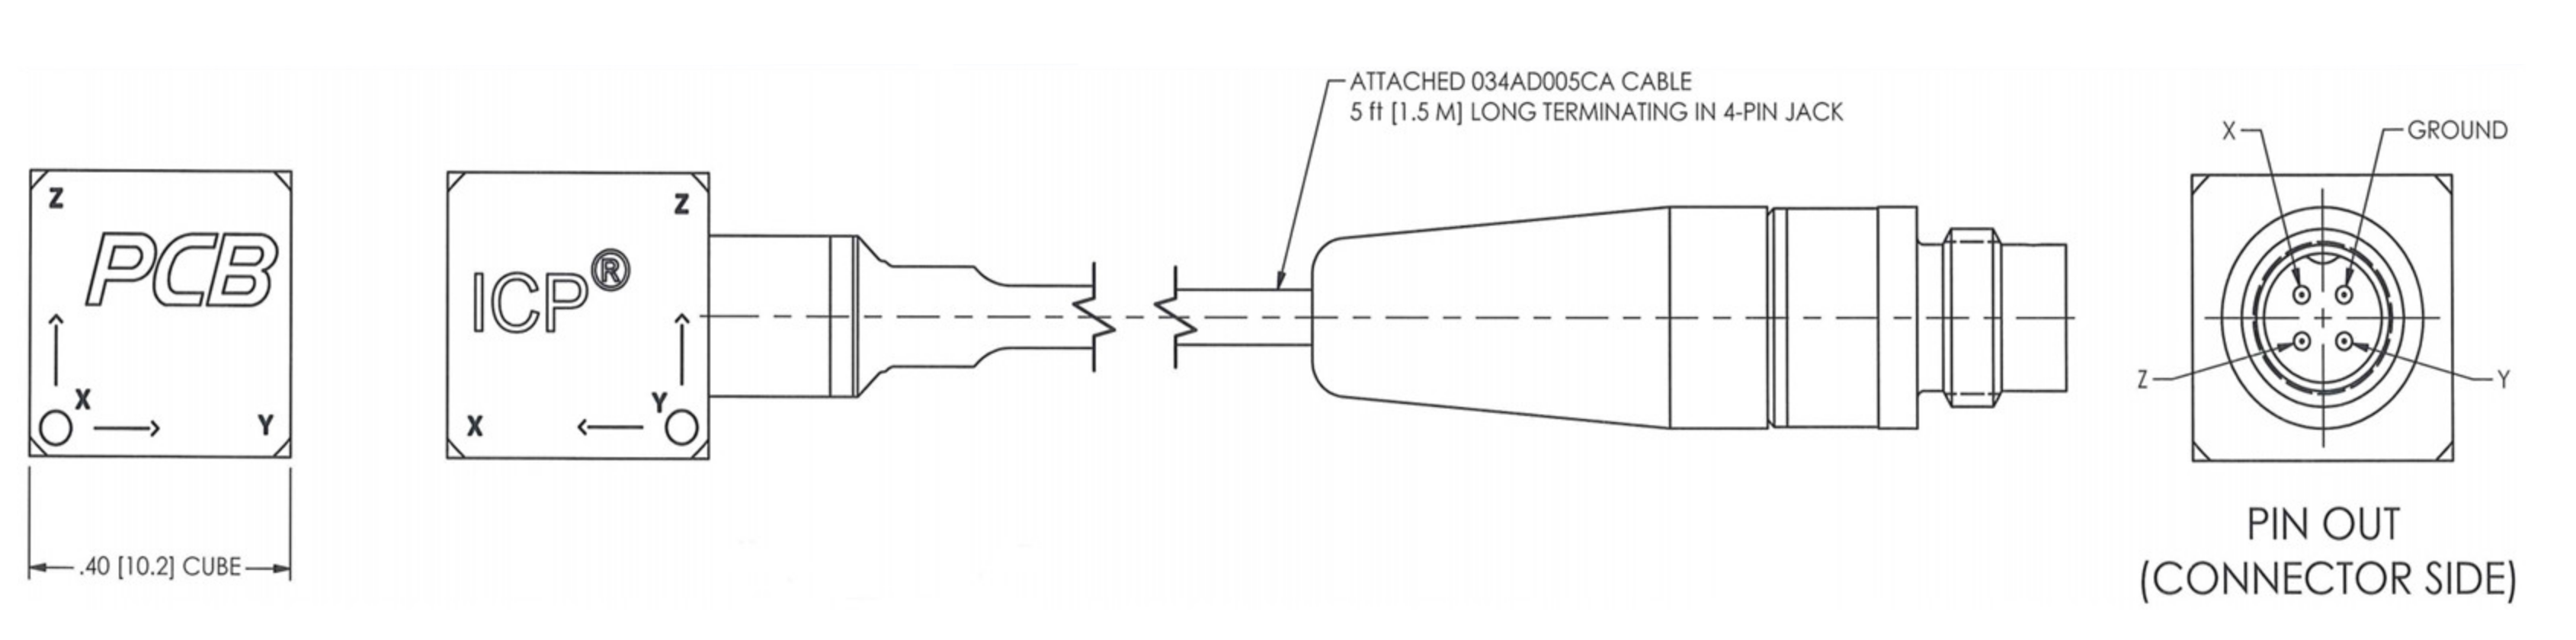
- Acceleration transducer (Figure 3);Figure 3. Scheme of PCB triaxial accelerometer model 356B10 [64].Figure 3. Scheme of PCB triaxial accelerometer model 356B10 [64].
 Table 1 shows the specifications of the PCB triaxial accelerometer, model 356B10.
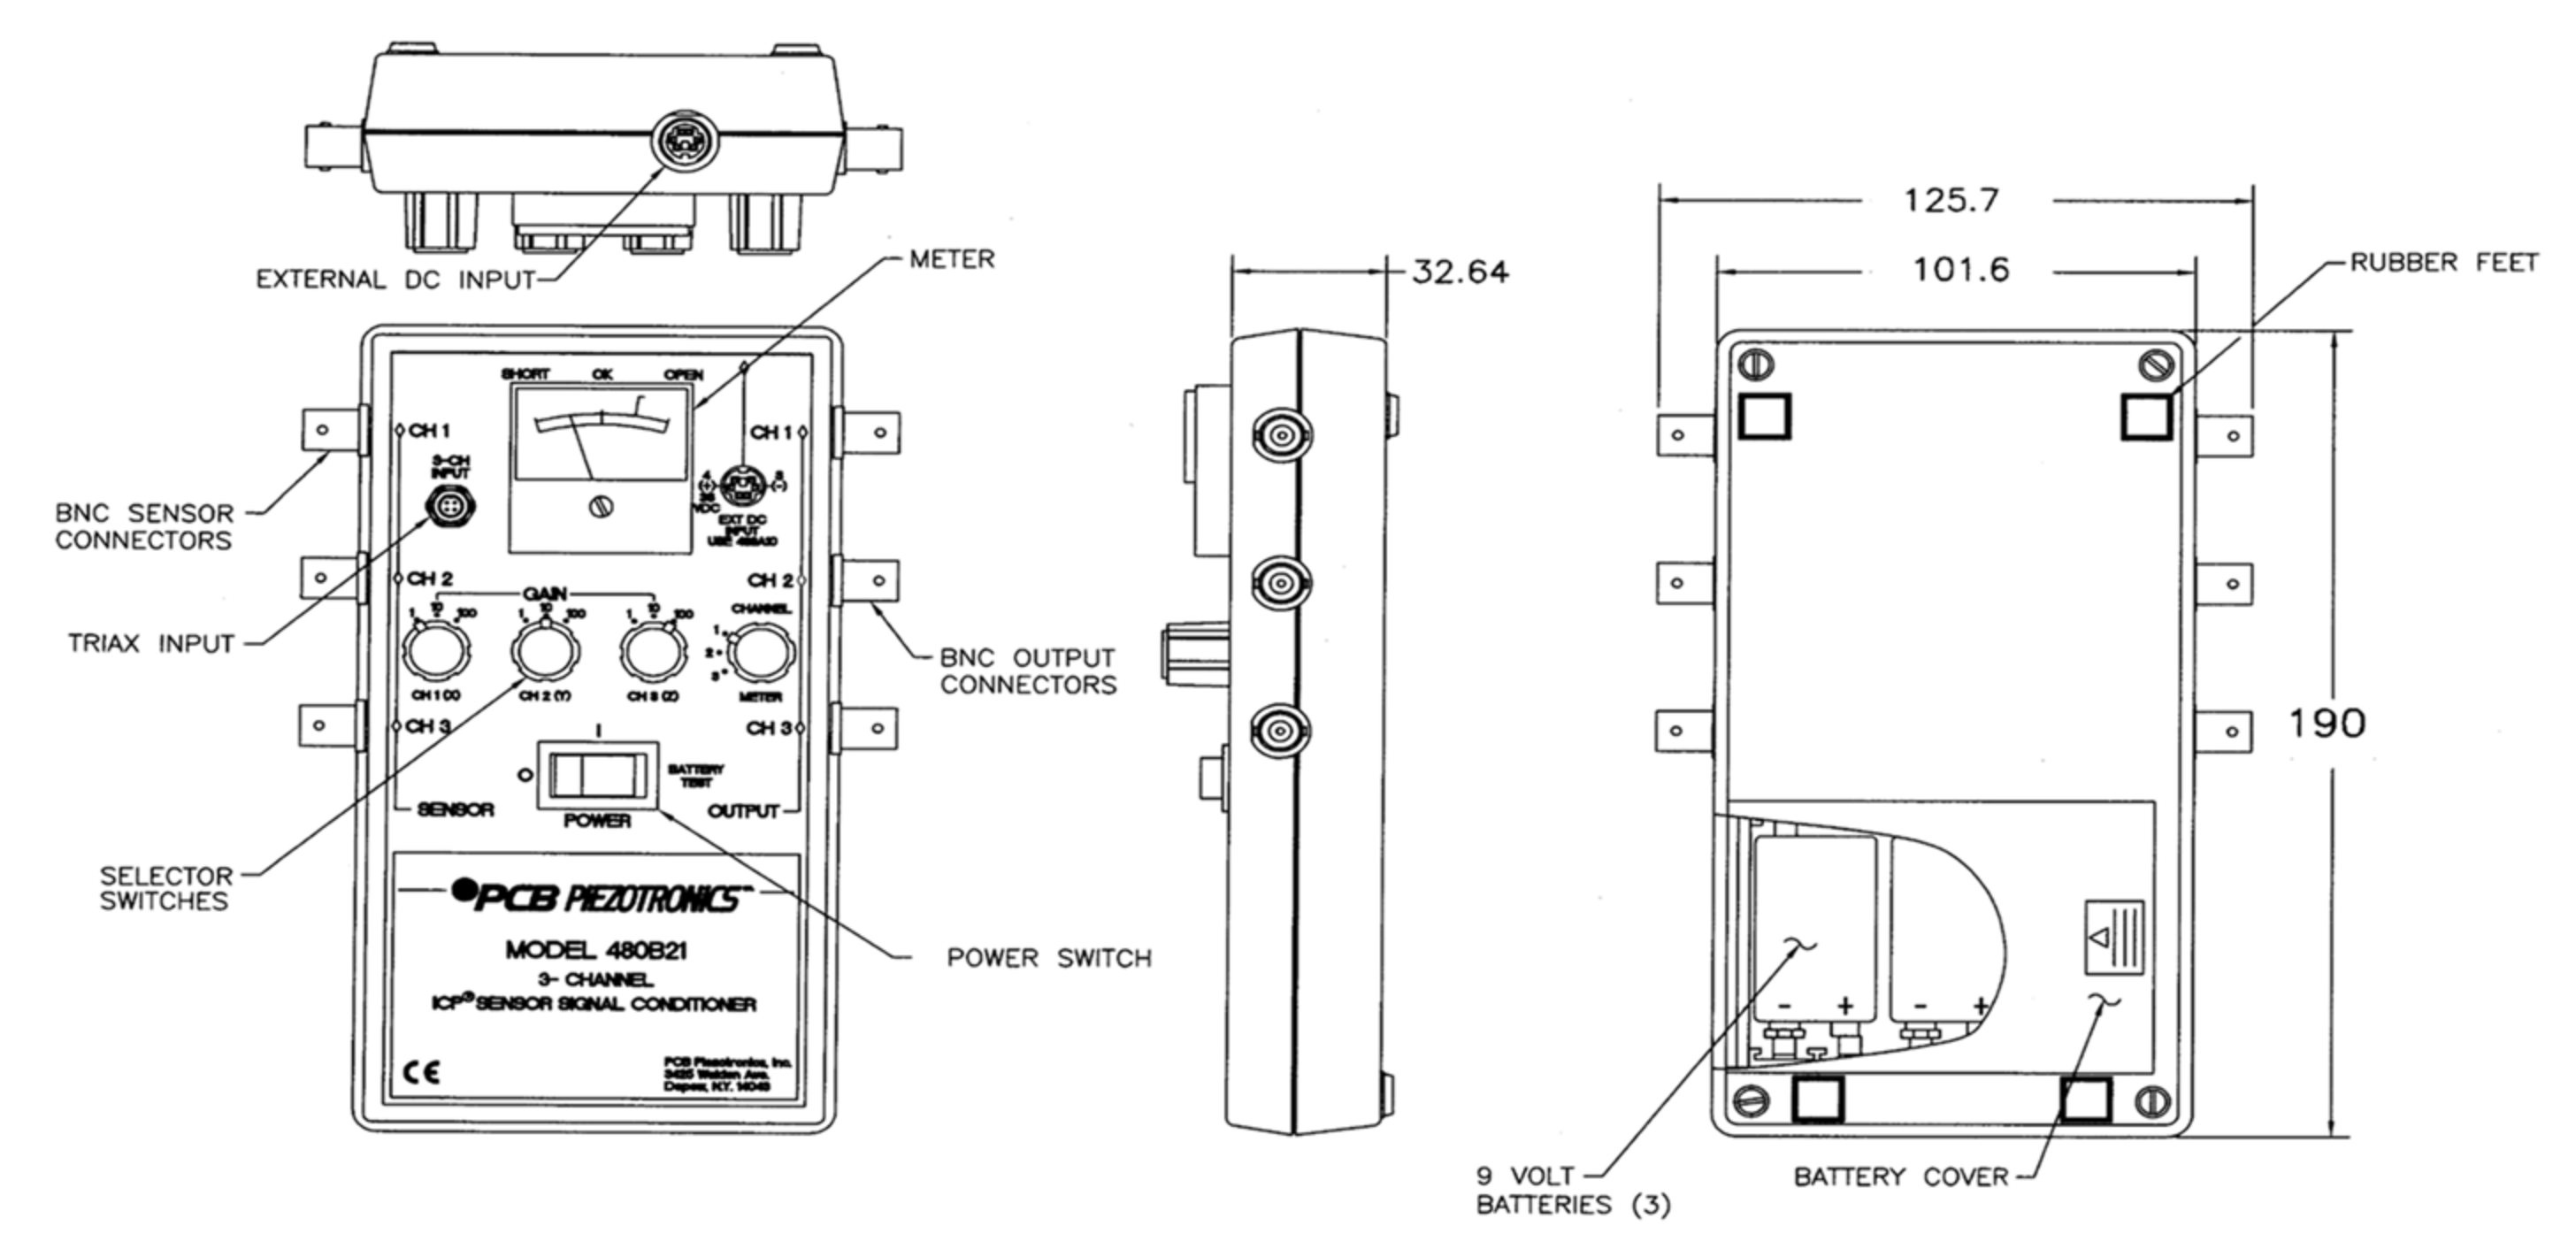
 - PCB signal conditioner model 480B21 with a frequency range of up to 100 kHz (Figure 4);Figure 4. Scheme of PCB signal conditioner model 480B21 [65].Figure 4. Scheme of PCB signal conditioner model 480B21 [65].
 Table 2 shows the specifications of PCB signal conditioner model 480B21.
 - Data recording module (NI 9233 data acquisition device + computer);The NI USB-9233 data acquisition device provides a USB interface for four channels of 24-bit analog inputs with integrated signal conditioning, consisting of two components: an NI 9233 module and an NI USB-9162 carrier (Figure 5);Figure 5. Scheme of NI USB-9233 data acquisition device with 4 analog input channels [66].Figure 5. Scheme of NI USB-9233 data acquisition device with 4 analog input channels [66].

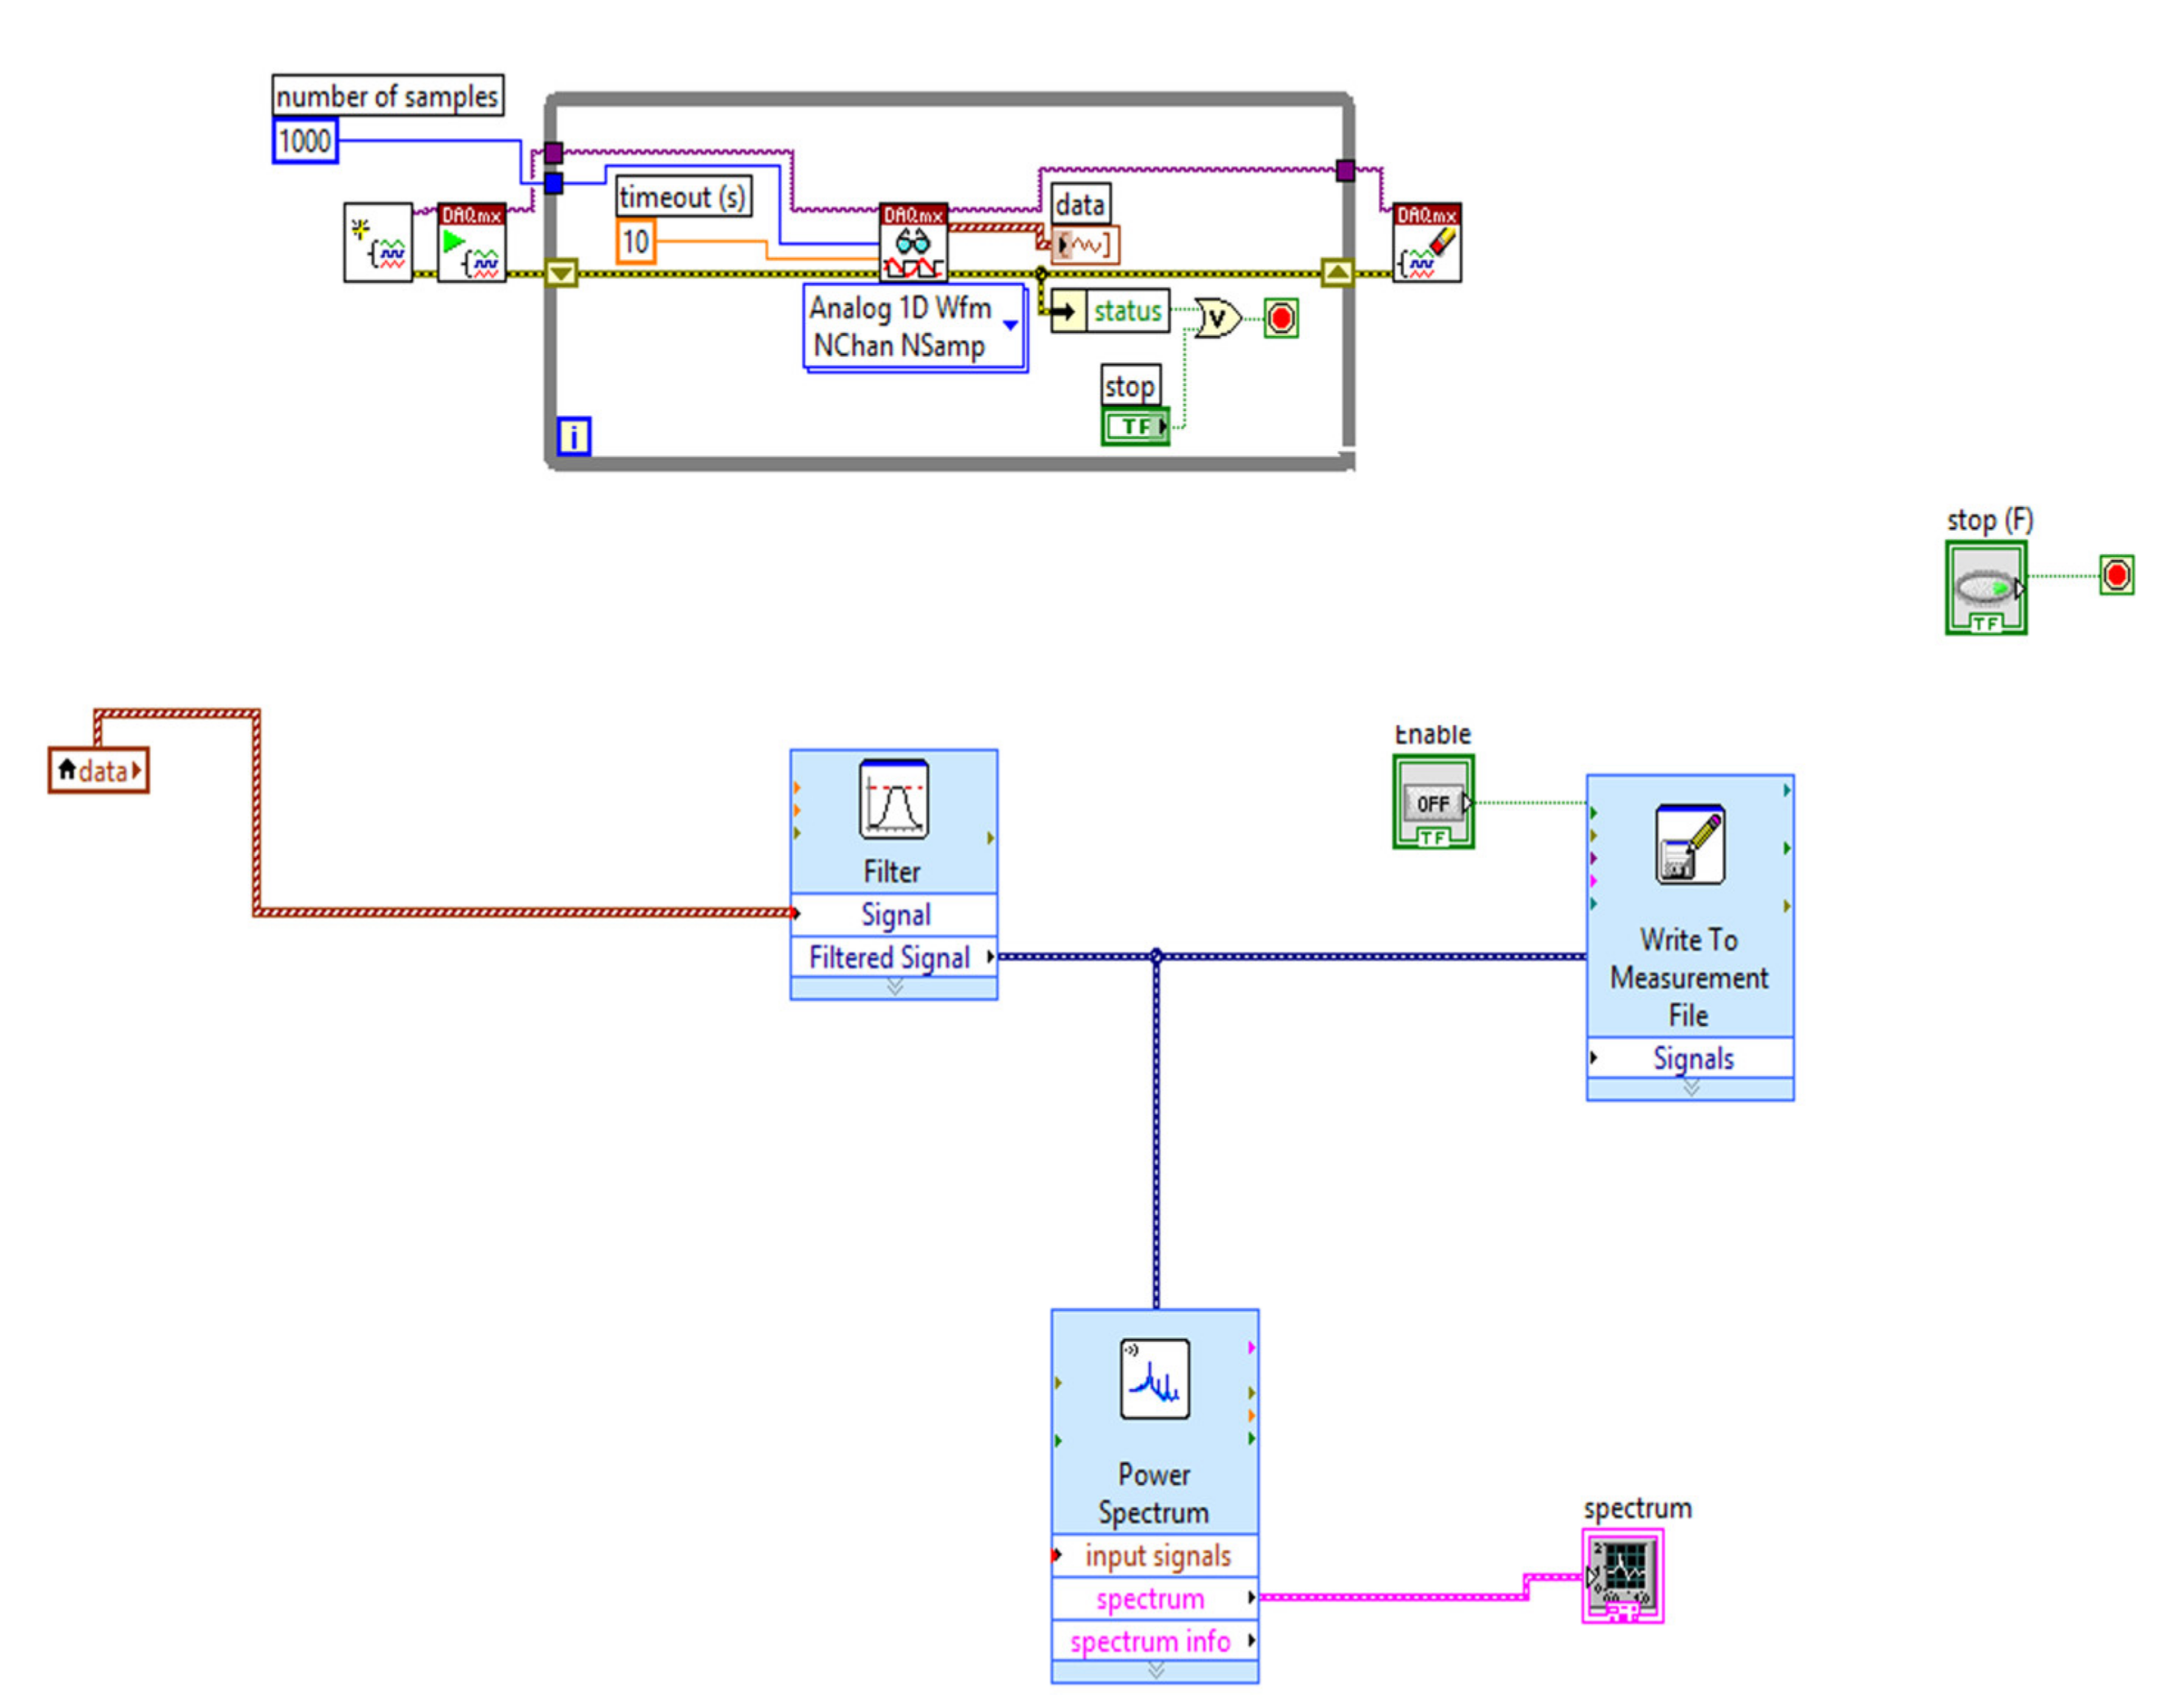
- Laptop with LabVIEW data acquisition software.The raw data acquisition software was developed in LabVIEW and contains the task of data acquisition and calibration of the three measurement channels from the accelerometer (DAQ Assistant), a virtual tool for real-time display of the power spectrum of vibrations on the 3 channels (Power Spectrum), a virtual tool for calculating real-time RMS values (Vibration Level), and a virtual tool for saving data in ASCII format. Within the program developed in LabVIEW, a data acquisition task was performed on three analog channels. The acquired data was filtered (low-pass filter to 5 Hz) and saved in an ASCII file.Figure 6 shows the program developed in LabVIEW for determining the vibration level.


- Channel demultiplications;
- Graphic editing;
- Obtaining the power spectrum for the registered acceleration signals.
- Less than 20 mm;
- Between 20 and 50 mm;
- Between 50 and 100 mm;
- More than 100 mm from the soil sample, (kg);
- A soil sample with the dimensions of 1 m x 1 m was delimited (using the meter frame and the depth equal to the working depth of the planter asem = 8 cm);
- From the respective sample the soil fractions with dimensions smaller than 50 mm were separated from the lumps with dimensions larger than 100 mm;
- The degree of soil grinding was calculated, which represents the proportion by weight of the soil fractions, in relation to the total mass of the soil sample.
2.2. Tests under Laboratory Conditions
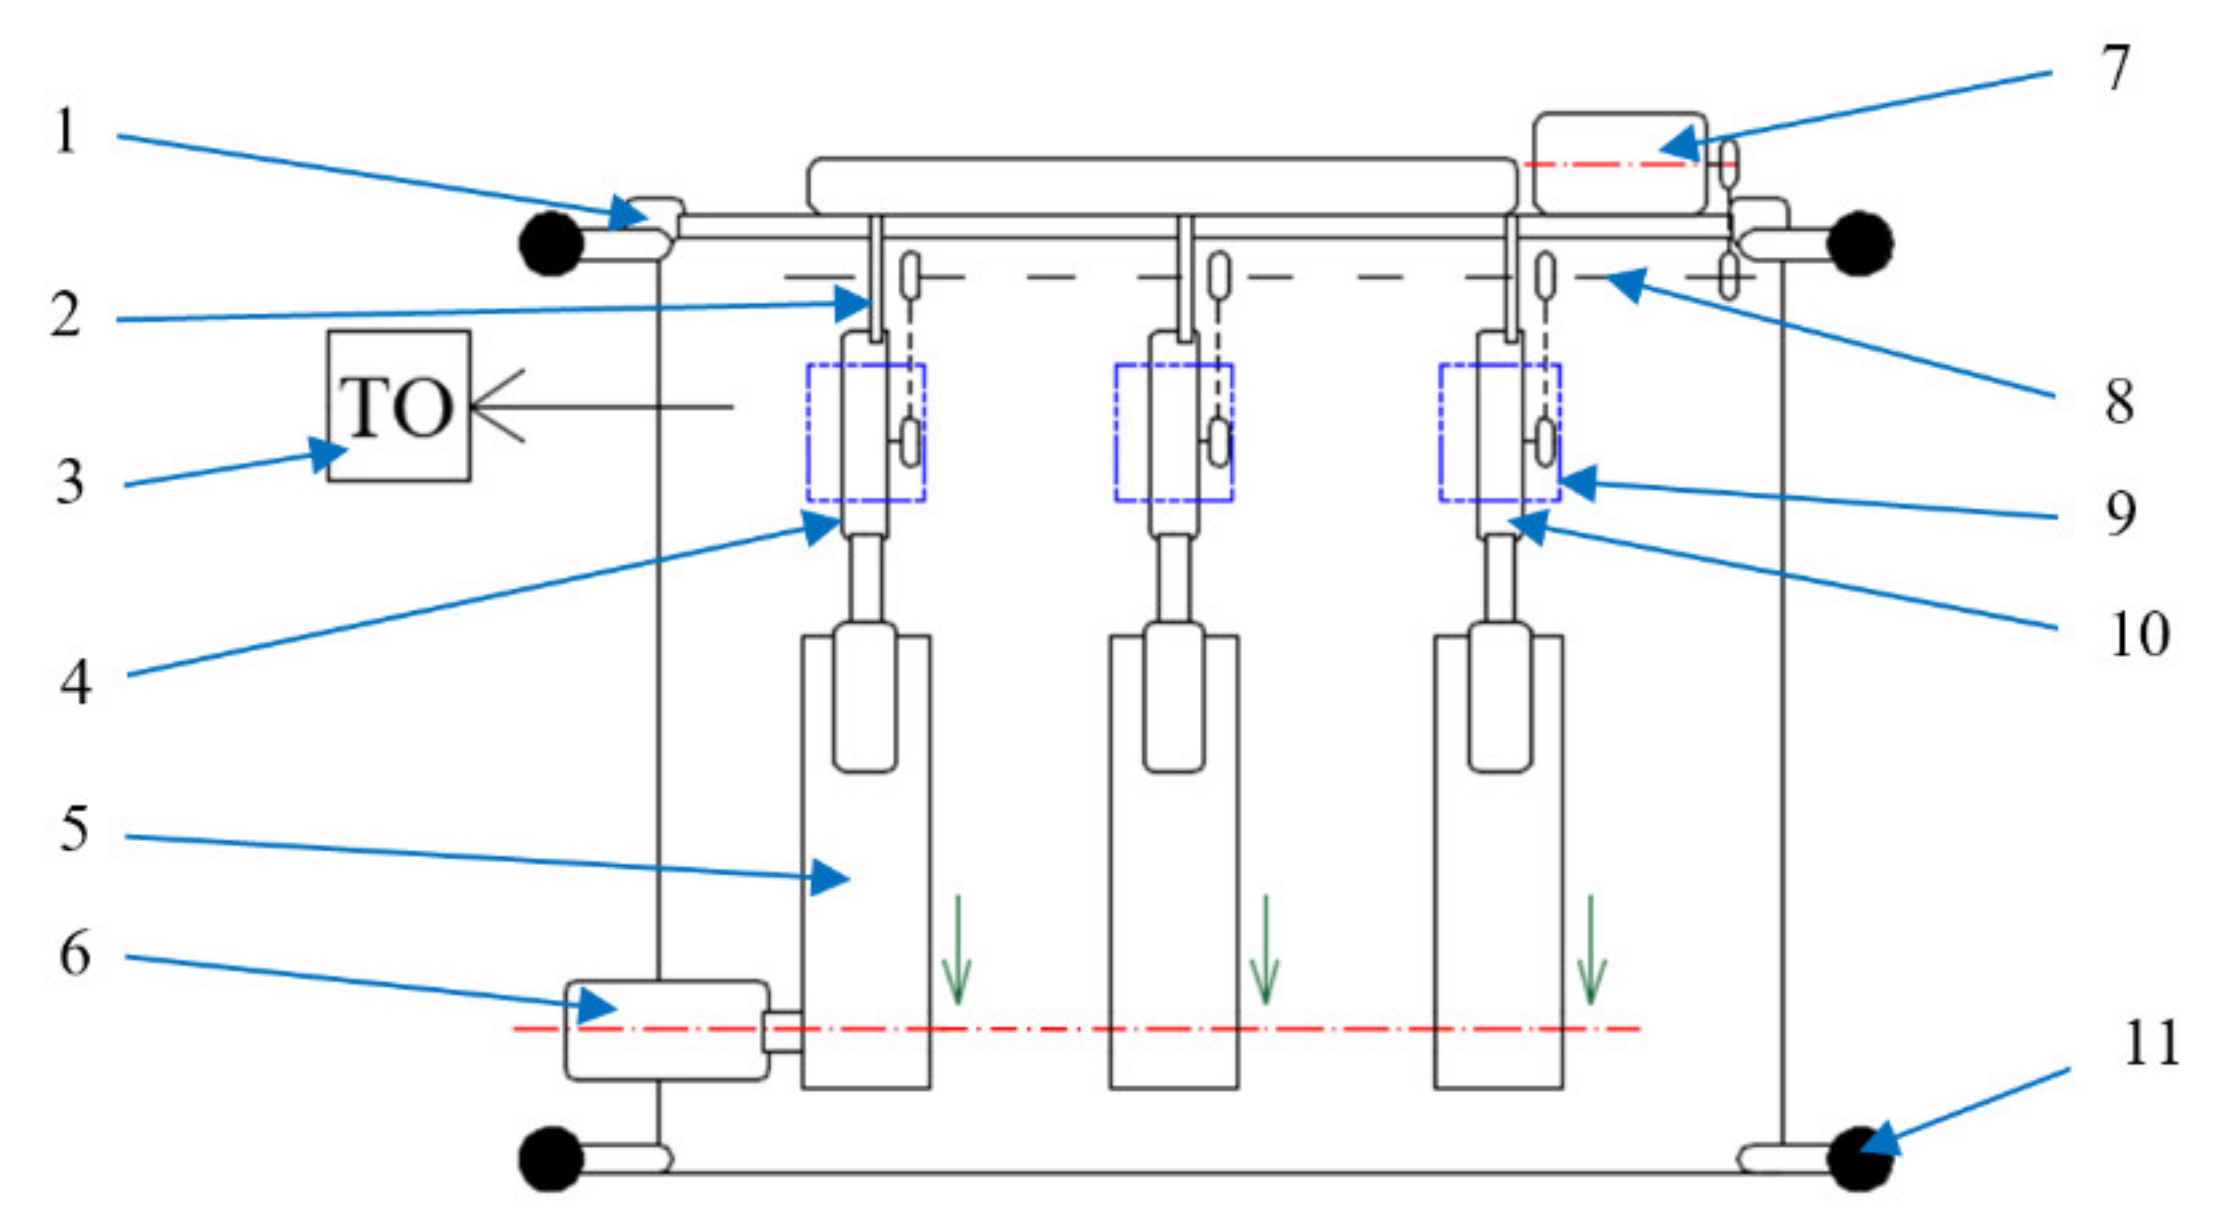
- A frame with the possibility of simulating the slope of the terrain between 0–11°;
- Two 5.5 kW variable speed motors: the first being used to drive the row units with an individual transmission, and the second for driving the seed meters of the row units with a centralized transmission, both being able to simulate working speeds between 2 and 12 km·h−1;
- Three SICK laser transducers, model FLG2-20025011, with a response time of <0.1 ms and a detection surface of 250 mm x 200 mm. Their role was to measure and transform the fall time interval between two seeds in space (multiplying the fall time by the forward speed) which, then, was compared with the reference space between the seeds in the row;
- A vacuum generator that could create a maximum depression of 5883 Pa (depression measured by means of a Prandtl-Pitot tube), the nominal speed being 4000 rev·min−1;
- A control panel with an operating terminal that processed the data received from the laser transducers and controlled the speed of the two electric motors.
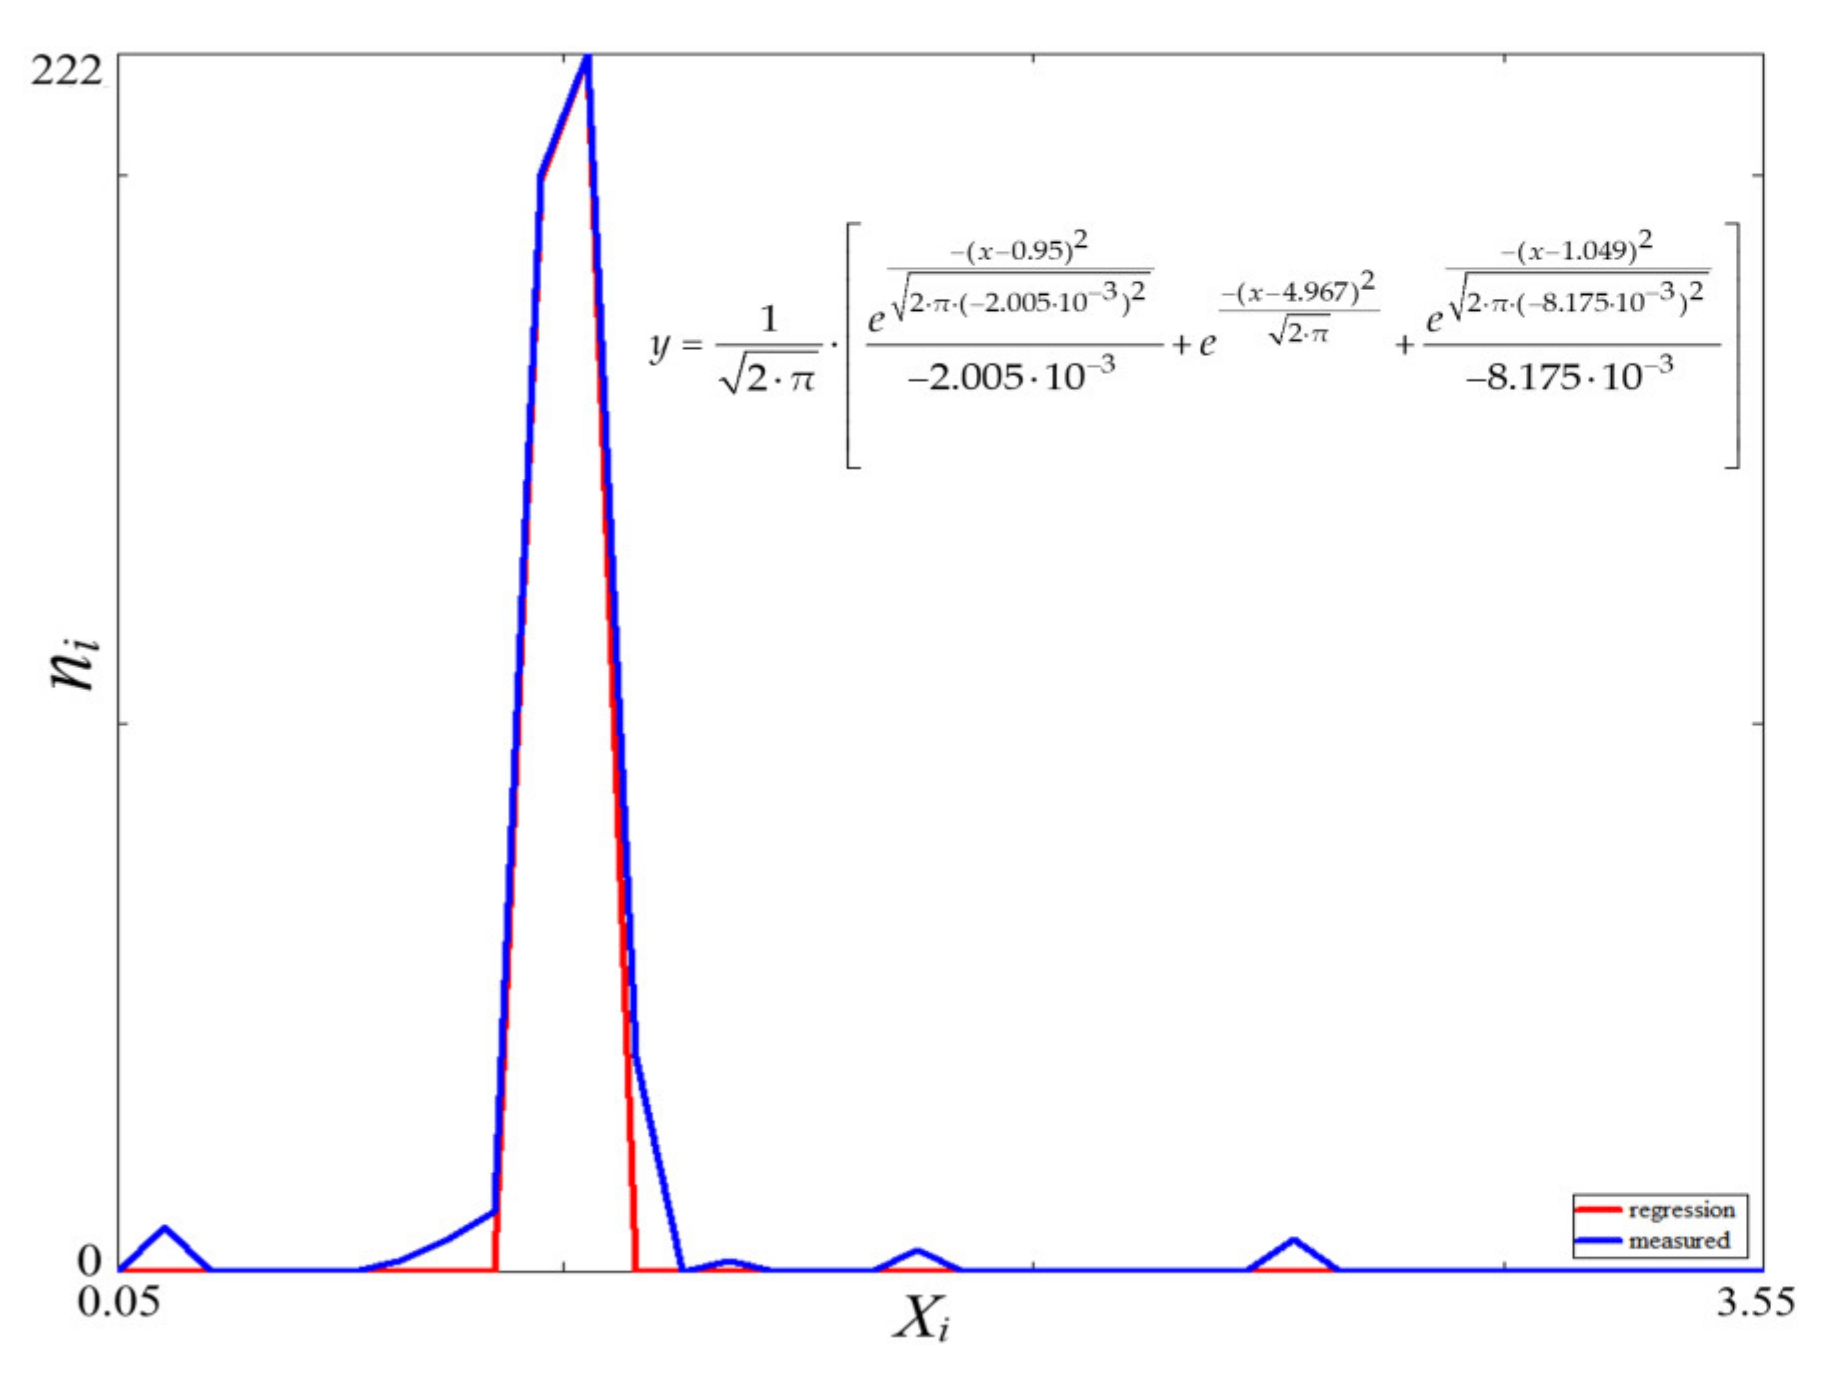
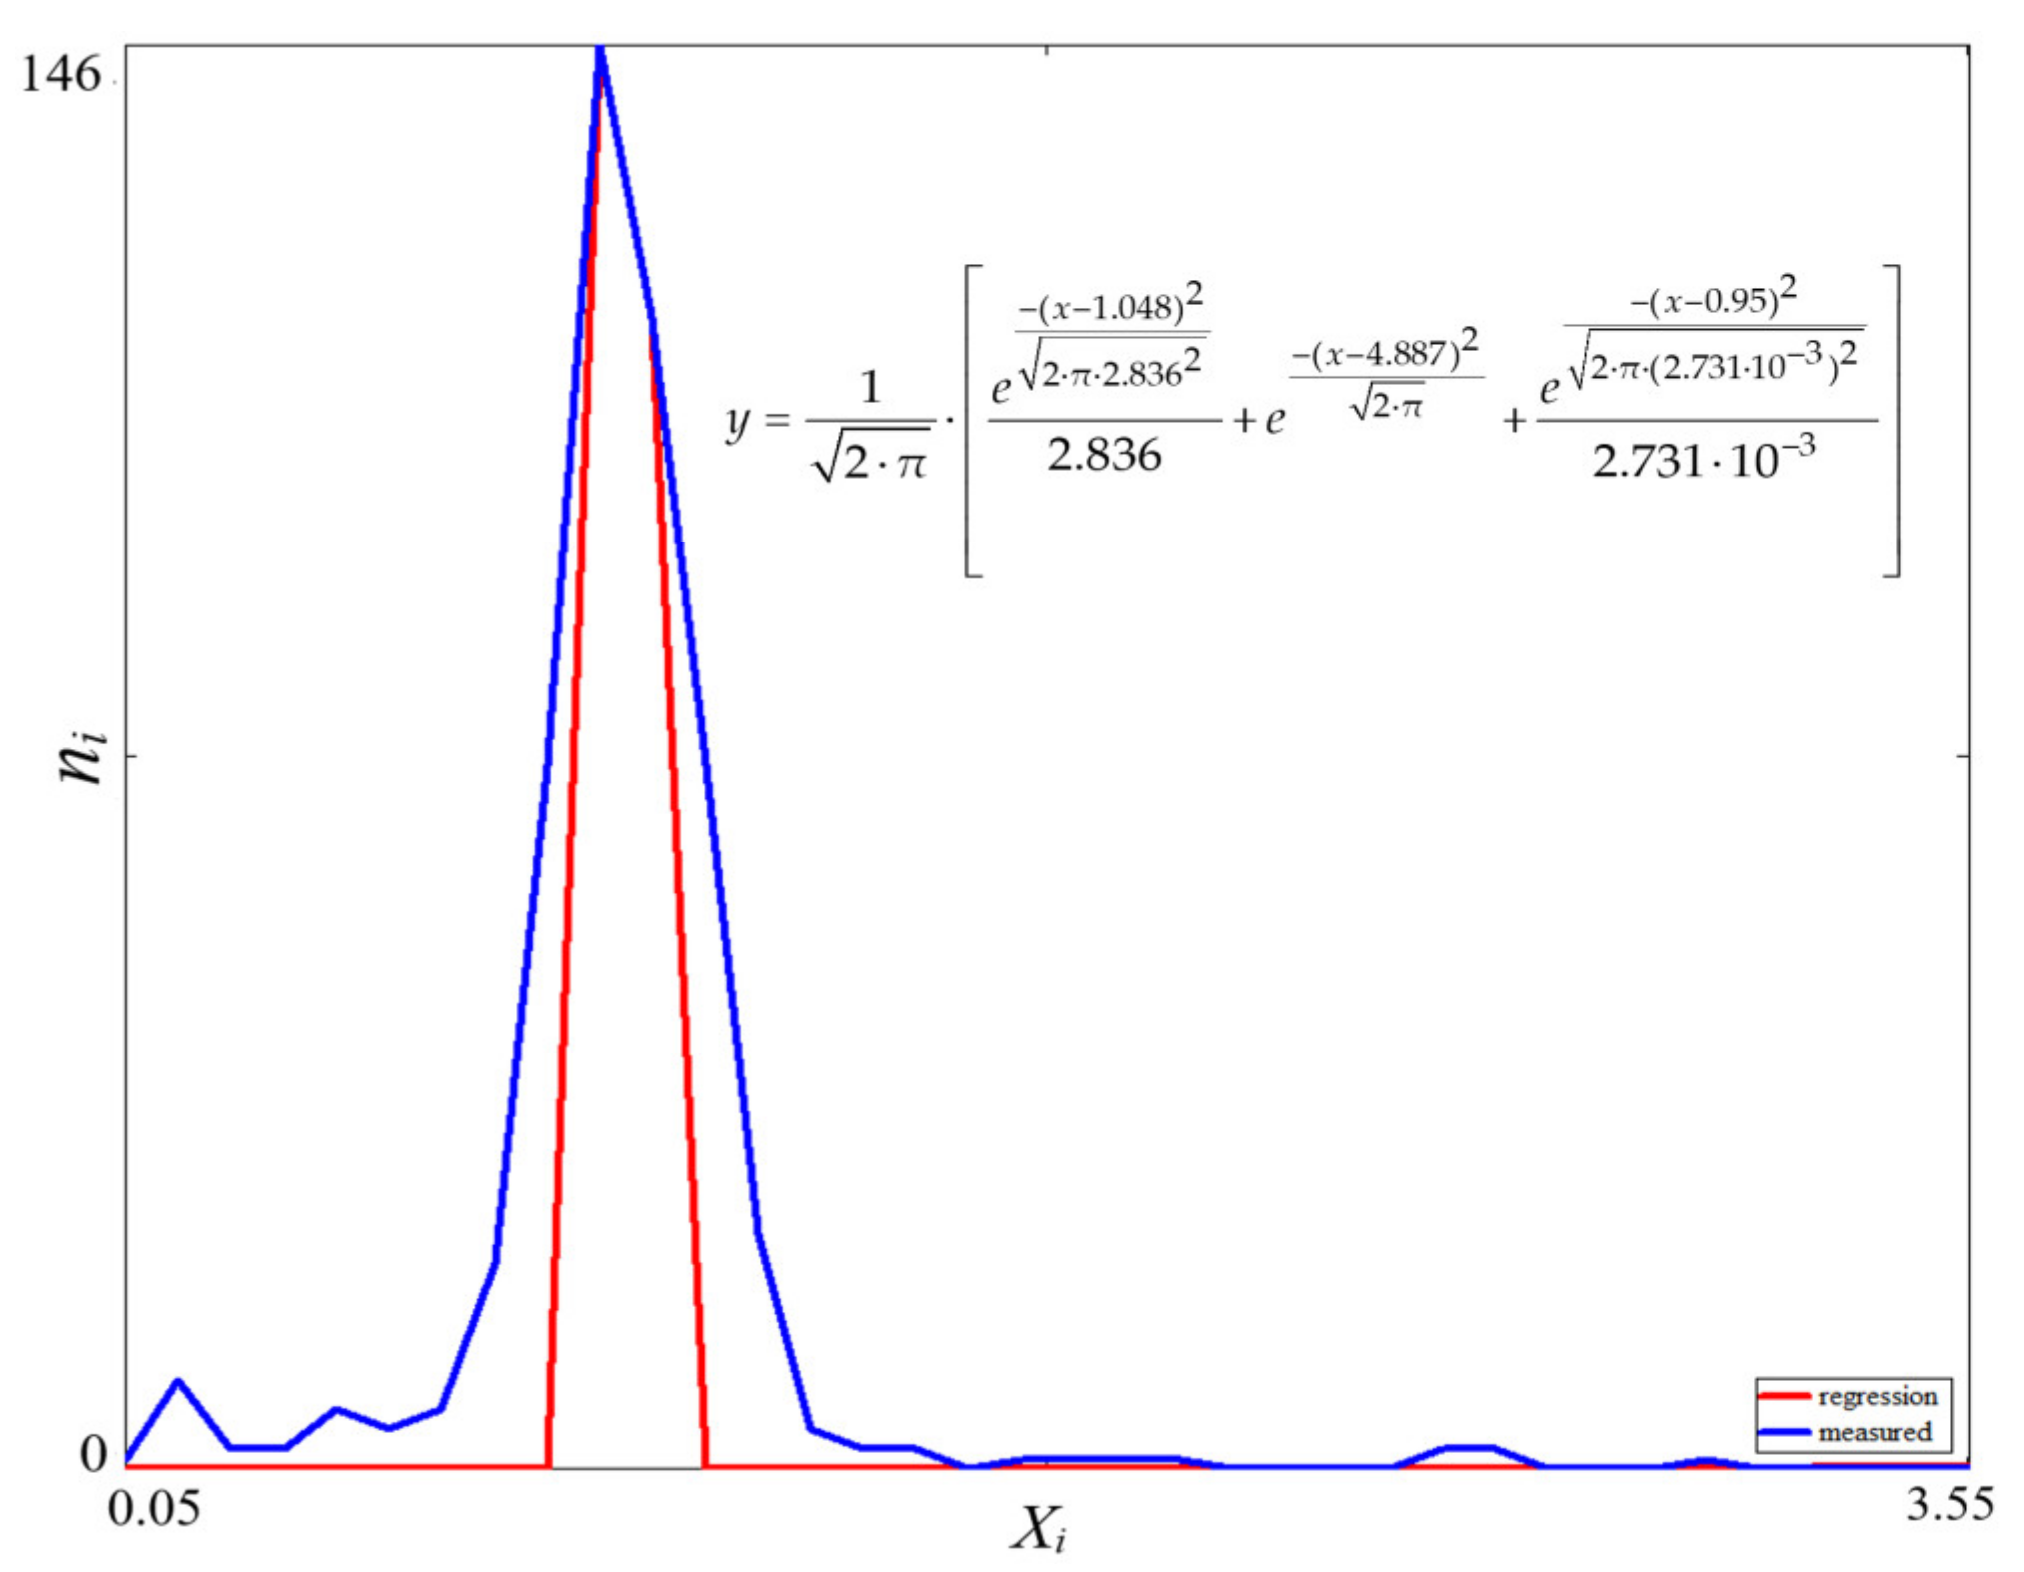
- Double sowing—any real interval: xj ≤ 0.5·xref;
- Correct sowing—any interval: 0,5·xref < xj ≤ 1.5·xref;
- Missing sowing—any real interval: xj > 1.5·xref.
3. Results
- In the first stage, which aimed to measure the stresses, induced in the mechanical structures of the precision planters in contact with the soil during movement, on three work plots with a different degree of seedbed preparation:
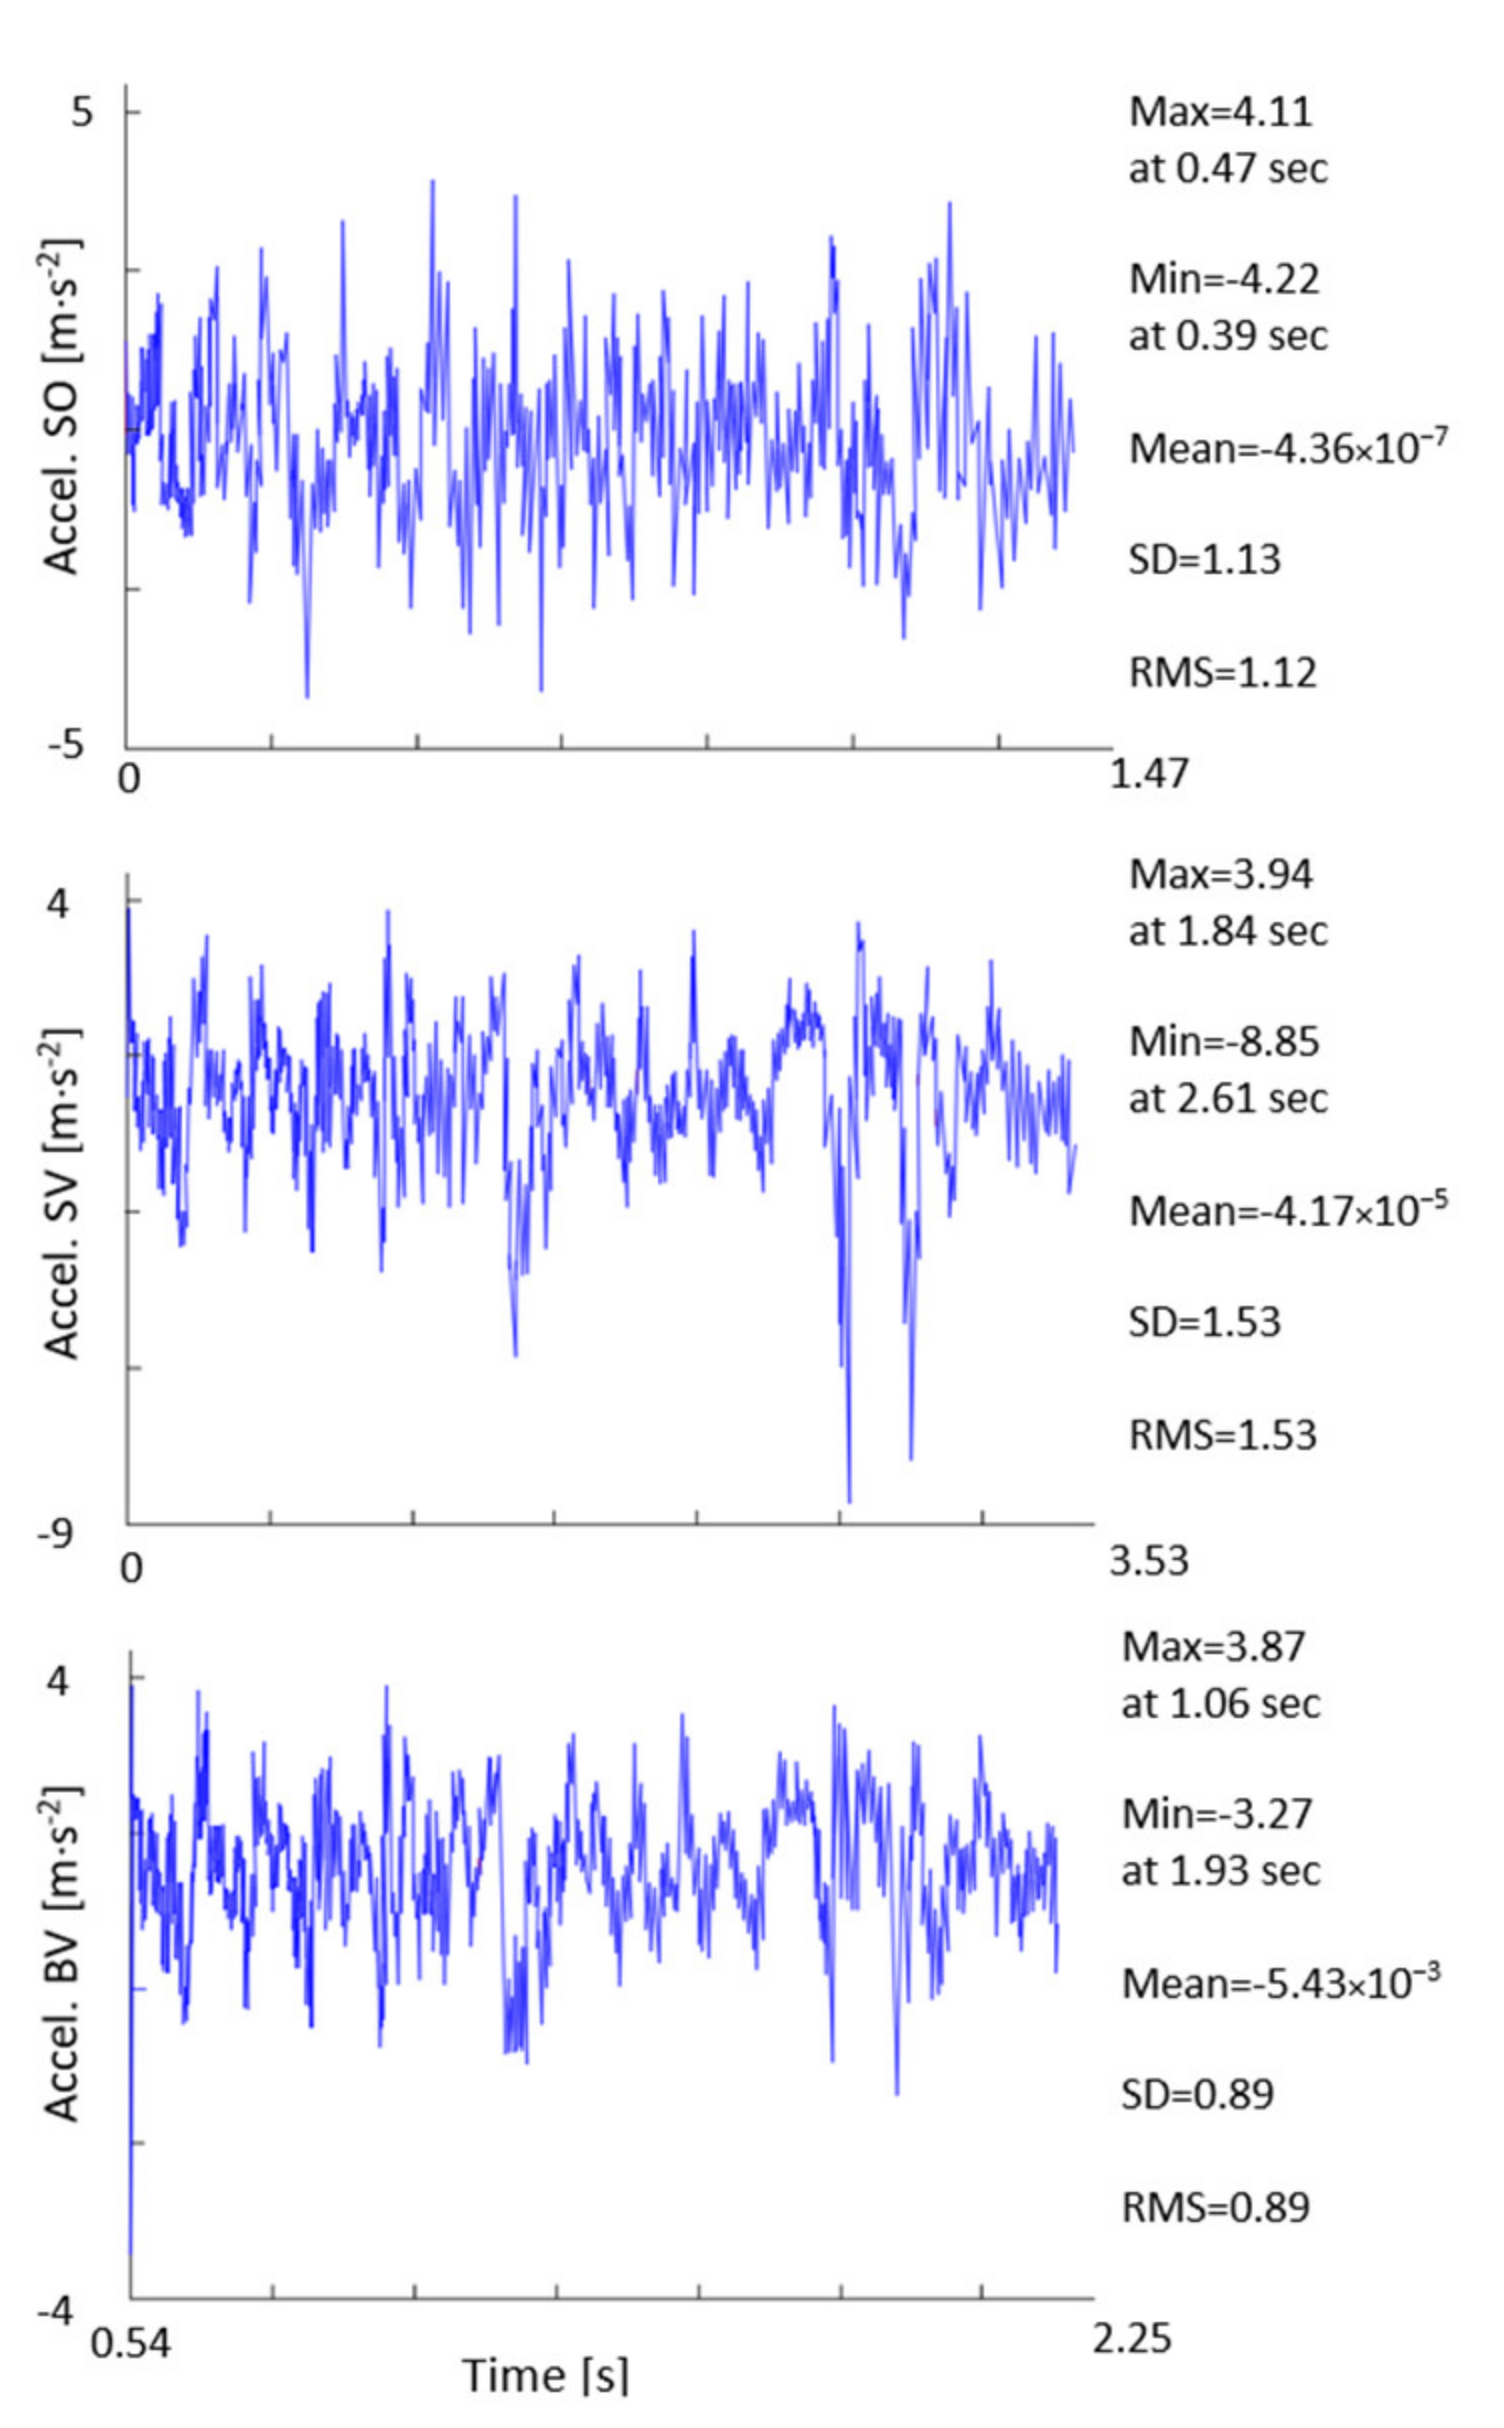
- The accelerations (vibrations), induced by the action of the running surface in the row unit and in the bar–frame of the seeder, registered an increasing value in amplitude at the same time as the transition to a higher gear;
- The amplitude of the accelerations (vibrations), measured when sowing was made on a plot with a degree of inadequate seedbed preparation (plots 1 and 3), increased compared to the case of plot (2) and worked properly, having the granulation of soil particles less than 50 mm.
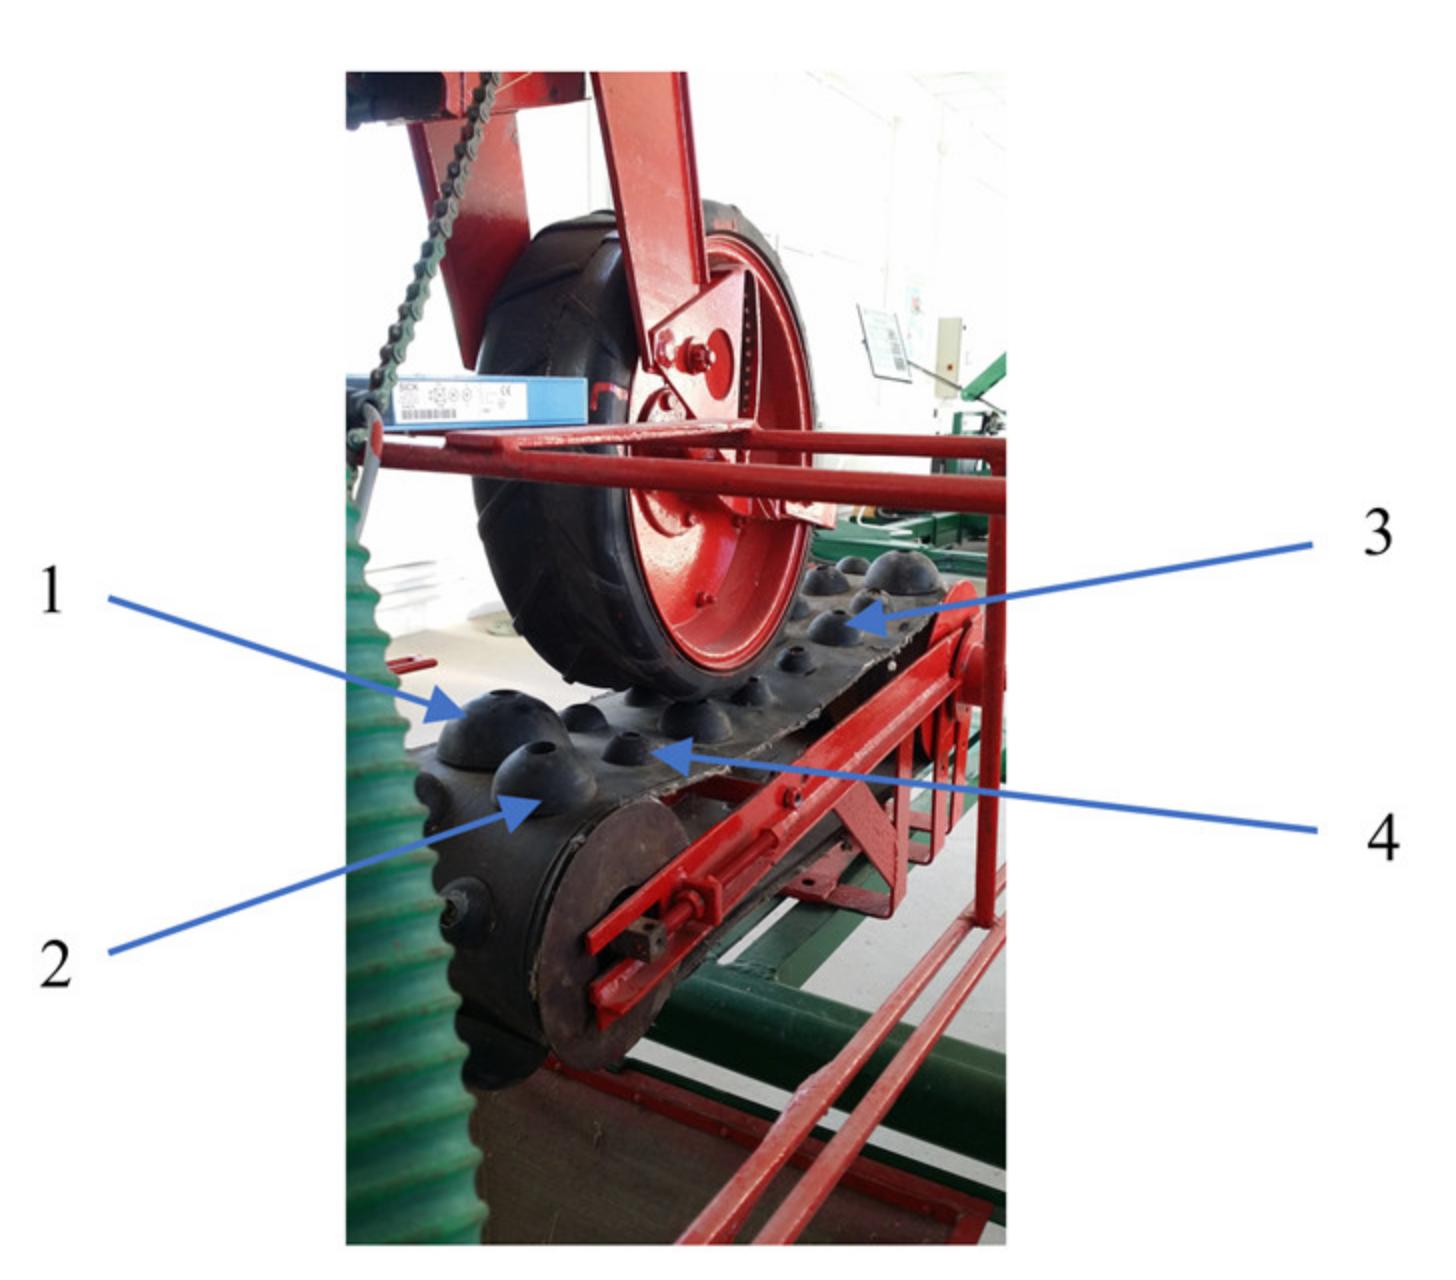
- In the second stage, when the row units were tested under simulated conditions in the laboratory (the tests being performed on the stand for determining the precision of planters, equipped with rubber bands on which rubber hemispheres were applied and positioned so that the vibrations would be similar to those made on the plots where the sowing work was carried out), on the row unit with a pneumatic seed meter, vertical discs, holes, and lamellar singulator at three working speeds (4, 6, and 8 km·h−1 respectively):
- The sowing precision determined in the stationary conditions, on the stand, decreased by approximately 3% by increasing the speed from 4 km·h−1 to 8 km·h−1;
- The sowing precision determined on a plot with an appropriate degree of seedbed preparation compared to a plot with an inadequate degree of preparation decreased by values between:
- 1.98% at 4 km·h−1;
- 2.17% at 6 km·h−1;
- 4.09% at 8 km·h−1;
- The sowing precision determined in the stationary conditions, on the stand, on a plot with an appropriate degree of seedbed preparation decreased as follows:
- 2.92% at 4 km·h−1;
- 4.75% at 6 km·h−1;
- 6.67% at 8 km·h−1;
- The sowing precision determined in the stationary conditions, on the stand, on a plot with an inadequate degree of seedbed preparation decreased as follows:
- 4.90% at 4 km·h−1;
- 6.93% at 6 km·h−1;
- 10.76% at 8 km·h−1.
4. Conclusions
- -
- The accelerations (vibrations) caused by the irregularity of the soil during the movement in the field for all the 3 plots where the experiments were conducted (with a different degree of seedbed preparation) increased with the transition to a higher gear (with the increase of the working speed);
- -
- In simulated experiments in the laboratory, the sowing precision was influenced by seedbed preparation and the working speed, which decreased as the seedbed was poorly processed (with larger irregularities), both stationary and during operation, for all three working speeds (4, 6, and 8 km h−1).
Author Contributions
Funding
Institutional Review Board Statement
Informed Consent Statement
Data Availability Statement
Conflicts of Interest
References
- Gupta, M.; Abdelsalam, M.; Khorsandroo, S.; Mittal, S. Security and Privacy in Smart Farming: Challenges and Opportunities. IEEE Access 2020, 8, 34564–34584. [Google Scholar] [CrossRef]
- Chukkapalli, S.S.L.; Mittal, S.; Gupta, M.; Abdelsalam, M.; Joshi, A.; Sandhu, R.; Joshi, K. Ontologies and Artificial Intelligence Systems for the Cooperative Smart Farming Ecosystem. IEEE Access 2020, 8, 164045–164064. [Google Scholar] [CrossRef]
- Sontowski, S.; Gupta, M.; Chukkapalli, S.S.L.; Abdelsalam, M.; Mittal, S.; Joshi, A.; Sandhu, R. Cyber Attacks on Smart Farming Infrastructure. In Proceedings of the 2020 IEEE 6th International Conference on Collaboration and Internet Computing (CIC), Atlanta, GA, USA, 1–3 December 2020; pp. 135–143. [Google Scholar]
- Choudhary, N.K.; Chukkapalli, S.S.L.; Mittal, S.; Gupta, M.; Abdelsalam, M.; Joshi, A. YieldPredict: A Crop Yield Prediction Framework for Smart Farms. In Proceedings of the 2020 IEEE International Conference on Big Data (Big Data), Atlanta, GA, USA, 1–3 December 2020; pp. 2340–2349. [Google Scholar]
- Gupta, M.; Awaysheh, F.M.; Benson, J.; Al Azab, M.; Patwa, F.; Sandhu, R. An Attribute-Based Access Control for Cloud Enabled Industrial Smart Vehicles. IEEE Trans. Ind. 2021, 17, 4288–4297. [Google Scholar] [CrossRef]
- Soyoye, B.O. Development of the Instrumentation Unit of a Motorized Precision Planter. Eur. J. Eng. Res. Sci. 2020, 5, 403–407. [Google Scholar] [CrossRef]
- Kachman, S.D.; Smith, J.A. Alternative Measures of Accuracy in Plant Spacing for Planters Using Single Seed Metering. Trans. ASAE 1995, 38, 379–387. [Google Scholar] [CrossRef]
- Kornienko, S.; Pashenko, V.; Melnik, V.; Kharchenko, S.; Khramov, N. Developing the method of constructing mathematical models of soil condition under the action of a wedge. East.-Eur. J. Enterp. Technol. 2016, 5, 34–43. [Google Scholar] [CrossRef][Green Version]
- Stout, B.A.; Cheze, B. CIGR Handbook of Agricultural Engineering; Volume III: Plant Production Engineering; The American Society of Agricultural Engineers: Saint Joseph, MI, USA, 1999; pp. 217–239. [Google Scholar]
- Murray, J.R.; Tullberg, J.N.; Basnet, B.B. Planters and Their Components. School of Agronomy and Horticulture; University of Queensland: Saint Lucia, Australia, 2006; pp. 8–30. [Google Scholar]
- Dobre, P. Energy Base and Horticultural Machinery, 2nd ed.; University of Agronomic Sciences and Veterinary Medicine of Bucharest: Bucharest, Romania, 2010; pp. 69–76. [Google Scholar]
- Sauder, D.A. Seed Meter. U.S. Patent No. 2014/0007801 A1, 9 January 2014. [Google Scholar]
- Dunham, L.J.; Barry, A.F. Air Seed Meter with Debris Clearing Device. U.S. Patent No. 7938073 B2, 10 May 2011. [Google Scholar]
- Eben, M.H.; Dunham, L.J.; Barry, A.F. Air Seed Meter. U.S. Patent No. 2005/0204972 Al, 15 March 2005. [Google Scholar]
- Peterson, B.D.; Nelson, B.W. Seed Metering Device and Seed Disk for Agricultural Seeder. U.S. Patent No. 8375874 B2, 19 February 2013. [Google Scholar]
- Crabb, R.J.; Ozers, G.; Slowinski, D.N.; Johnson, C.M.; Johnson, D.; Dunham, L.J.; Stuflebeam, J.F.; Olson, T.A.; Berry, S.D.; Brown, T.; et al. Seed Planter Apparatus and Method. U.S. Patent No. 6374759 B1, 23 April 2002. [Google Scholar]
- Garner, E.B.; Friestaf, M.E.; Mariman, N.A.; Zumdome, L.E. Air Pressure Differential Seed Meter. WO Patent No. 2012/135006 A2, 4 October 2012. [Google Scholar]
- Available online: https://www.youtube.com/watch?v=HpbyYRqX8QQ (accessed on 6 April 2021).
- Gilstring, G. Arrangement of a Seed Metering Device on an Agricultural Machine. U.S. Patent No. 2012/8336471 B2, 25 December 2012. [Google Scholar]
- Wilhelmi, M.J.; Brockmann, K. Air Seed Meter with Adjustable Singulator. EPO. Patent No. EP 2911498 B1, 24 July 2019. [Google Scholar]
- Bozdoğan, A.M. Seeding uniformity for vacuum precision seeders. Sci. Agric. 2008, 65, 318–322. [Google Scholar] [CrossRef][Green Version]
- Cârdei, P.; Manea, D.; Popescu, S.; Lazar, S. Mathematical model of the distribution device operating on the mechanical-pneumatic sowing machine SDC. INMATEH-Agric. Eng. 2011, 34, 5–12. [Google Scholar]
- Doerge, T.; Hall, T.; Gardner, D. New research confirms benefits of improved plant spacing in corn. Crop. Insights 2002, 12, 1–5. [Google Scholar]
- Morrison, J.E.; Gerik, T.J. Planter depth control: 2. Empirical testing and plant responses. Trans. ASAE 1985, 28, 1744–1748. [Google Scholar]
- Panning, J.W.; Kocher, M.F.; Smith, J.A.; Kachman, S.D. Laboratory and field testing of seed spacing uniformity for sugarbeet planters. Appl. Eng. Agric. 2000, 16, 7–13. [Google Scholar] [CrossRef]
- Babiciu, P.; Ganga, A.M.; Rada, P.N.; Pop, E.I.; Alexandrescu, I. Stand for Determining the Precision of Sowing of Row Units, for Weeding Plants. Patent No. RO 107515 B1, 25 May 1990. [Google Scholar]
- Karayel, D.; Wiesehoff, M.; Ozmerzi, A.; Muller, J. Laboratory measurement of seed drill seed spacing and velocity of fall of seeds using high-speed camera system. Comput. Electron. Agric. 2006, 50, 89–96. [Google Scholar] [CrossRef]
- Liu, W.; Tollenaar, M.; Stewart, G.; Deen, W. Impact of planter type, planting speed, and tillage on stand uniformity and yield of corn. Agron. J. 2004, 96, 1668–1672. [Google Scholar] [CrossRef]
- Li, D.; Geng, D.; Ma, B.; Li, Q.; Wang, Z.H. Study on performance monitoring system of corn precision seeder. J. Agric. Mech. Res. 2013, 11, 71–74. [Google Scholar]
- Miller, E.A.; Rascon, J.; Koller, A.; Porter, W.M.; Taylor, R.K.; Raun, W.R.; Kochenower, R. Evaluation of corn seed vacuum metering systems. In Proceedings of the 2012 ASABE Annual International Meeting, Dallas, TX, USA, 29 July–1 August 2012. [Google Scholar]
- Zubrilina, E.; Markvo, I.; Novikov, V.; Beskopylny, A.; Vysochkina, L.; Rudoy, D.; Butovchenko, A. Precise seeding planter with automated monitoring and control system. IOP Conf. Ser. Earth Environ. Sci. 2019, 403, 1–10. [Google Scholar] [CrossRef]
- Norris, C.P. Performance of some different types of peanut/maize planters in North Queensland. In Proceedings of the Agricultural Engineering Conference 1982: Resources–Efficient Use and Conservation, Armidale, Australia, 22–24 August 1982; Volume 82, pp. 149–154. [Google Scholar]
- Păunescu, D.D. Research regarding automated supervision of the work process of precision seed drills. INMATEH-Agric. Eng. 2009, 28, 14–17. [Google Scholar]
- Lacomi, C.; Popescu, O. A new concept for seed precision planting. Agric. Agric. Sci. Procedia 2015, 6, 38–43. [Google Scholar] [CrossRef]
- Yang, L.; Xiantao, H.; Dongwing, Z.; Song, S.; Zhang, R.; Mantao, W. Development of mechatronic driving system for seed meters equipped on conventional precision corn planter. Int. J. Agric. Biol. Eng. 2015, 8, 1–9. [Google Scholar] [CrossRef]
- Opriș, O.S. Researches Concerning the Influence of the Oscillations of Seeding Machines for Weeding Plants on Qualitative Work Indices. Ph.D. Thesis, Transilvania University of Brasov, Brașov, Romania, 2007. [Google Scholar]
- Guul-Simonsen, F.; Jorgensen, M.H.; Have, H.; Hakansson, I. Studies of plough design and ploughing relevant to conditions in Northern Europe. Acta Agric. Scand. 2002, 52, 57–77. [Google Scholar] [CrossRef]
- Durr, C.; Boiffin, J.; Fleury, A.; Coulomb, I. Analysis of the variability of sugarbeet (Beta-Vulgaris L.) growth during the early stages. 1. Influence of various conditions on crop establishment. Agronomie 1992, 12, 515–525. [Google Scholar] [CrossRef]
- Koller, A.A.; Taylor, R.K.; Weckler, P.R.; Buser, M.D.; Raun, W.R. Design, performance prediction, and validation of a seed orienting corn planter. In Proceedings of the American Society of Agricultural and Biological Engineers Annual International Meeting, Kansas City, MI, USA, 21–24 July 2013. [Google Scholar] [CrossRef]
- Shrestha, D.S.; Steward, B.L. Automatic corn plant population measurement using machine vision. Trans. ASAE 2003, 46, 559–565. [Google Scholar] [CrossRef]
- Nielsen, S.K.; Munkholm, L.J.; Lamandé, M.; Nørremark, M.; Edwards, G.T.C.; Green, O. Seed drill depth control system for precision seeding. Comput. Electron. Agric. 2018, 144, 174–180. [Google Scholar] [CrossRef]
- Zhan, Z.; Yafang, W.; Jianjun, Y.; Zhong, T. Monitoring method of rice seeds mass in vibrating tray for vacuum-panel precision seeder. Comput. Electron. Agric. 2015, 114, 25–31. [Google Scholar] [CrossRef]
- Gong, Z.Q.; Chen, J.; Li, Y.M.; Zhao, Z. Analysis and research of a precision seeder horizontal adjustment mechanism. Mach. Des. Res. 2012, 28, 15–18. [Google Scholar]
- Kamgar, S.; Noei-Khodabodi, F.; Shafaei, S.M. Design, development and field assessment of a controlled seed metering unit to be used in grain drills for direct seeding of wheat. Inf. Process. Agric. 2015, 2, 169–176. [Google Scholar] [CrossRef]
- Mangus, D.L.; Sharda, A.; Flippo, D.; Strasser, R.; Griffin, T. Development of high-speed camera hardware and software package to evaluate real-time electric seed meter accuracy of a variable rate planter. Comput. Electron. Agric. 2017, 142, 314–325. [Google Scholar] [CrossRef]
- Velandia, M.; Buschermohle, M.; Larson, J.A.; Thompson, N.M.; Jernigan, B.M. The economics of automatic section control technology for planters: A case study of middle and west Tennessee farms. Comput. Electron. Agric. 2013, 95, 1–10. [Google Scholar] [CrossRef]
- Strasser, R.; Badua, S.; Sharda, A.; Mangus, D.; Haag, L. Performance of planter electric-drive seed meter during simulated planting scenarios. Appl. Eng. Agric. 2019, 35, 925–935. [Google Scholar] [CrossRef]
- Abdolahzare, Z.; Abdanan Mehdizadeh, S. Real time laboratory and field monitoring of the effect of the operational parameters on seed falling speed and trajectory of pneumatic planter. Comput. Electron. Agric. 2018, 145, 187–198. [Google Scholar] [CrossRef]
- Nielsen, R.L. Effect of Plant Spacing Variability on Corn Grain Yield; Purdue University Department of Agronomy: West Lafayette, IN, USA, 2004; pp. 1–10. [Google Scholar]
- Staggenborg, S.A.; Taylor, R.K.; Maddux, L.D. Effect of planter speed and seed firmers on corn stand establishment. Appl. Eng. Agric. 2004, 20, 573–580. [Google Scholar] [CrossRef][Green Version]
- Fanigliulo, R.; Pochi, D. Air-Flow Distribution efficiency of a precision drill used in the sowing of different graded seeds. J. Agric. Sci. Technol. B 2011, 1, 655–662. [Google Scholar]
- Singh, R.C.; Singh, G.; Saraswat, D.C. Optimisation of design and operational parameters of a pneumatic seed metering device for planting cottonseeds. Biosyst. Eng. 2005, 92, 429–438. [Google Scholar] [CrossRef]
- Xiaoyan, D.; Xu, L.; Caixia, S.; Haidong, H.; Qingxi, L. Mathematical model and optimization of structure and operating parameters of pneumatic precision metering device for rapeseed. J. Food Agric. Environ. 2010, 8, 318–322. [Google Scholar]
- Kaur, T.; Kumar, D. Design and development of calibration unit for precision planter. Int. J. Comput. Sci. Eng. Appl. 2013, 3, 11–17. [Google Scholar] [CrossRef]
- Becker, R. Apparatus for Separating and/or Counting Individual Elements of a Plurality. U.S. Patent No.3715057, 6 February 1973. [Google Scholar]
- Donadon, G. Sowing Machine. U.S. Patent No. D644253 S, 12 June 2011. [Google Scholar]
- Horsch, T. Seed Meter. U.S. Patent No. 7854206 B2, 21 December 2010. [Google Scholar]
- Schaefer, T.; Radtke, I. Seed Planting Apparatus, Systems and Methods. U.S. Patent No. 2017/9861025, 9 January 2018. [Google Scholar]
- Available online: https://www.madr.ro/culturi-de-camp/cereale/porumb.html (accessed on 31 March 2021).
- Biriş, S.Ş.; Ungureanu, N.; Vlăduţ, V. Study on the influence of mechanical vibrations to the energy required for soil tillage. In Proceedings of the 5th International Conference on Thermal Equipment, Renewable Energy and Rural Development, TE-RE-RD, Golden Sands, Bulgary, 2–4 June 2016; pp. 203–7941. [Google Scholar]
- Kennes, P.; Anthonis, J.; Clijmans, L.; Ramon, H. Construction of a portable test rig to perform experimental modal analysis on mobile agricultural machinery. J. Sound Vib. 1999, 228, 421–441. [Google Scholar] [CrossRef]
- Matache, M.G.; Voicu, G.; Epure, M.; Voicea, I.F.; Găgeanu, I.; Ghilvacs, M. Measuring vibrations level during transportation work for an electrical tractor. ACTA Tech. Corviniensis Bull. Eng. 2020, XIII, 27–30. [Google Scholar]
- Ruiz-Gonzalez, R.; Gomez-Gil, J.; Gomez-Gil, F.J.; Martínez-Martínez, V. An SVM-based classifier for estimating the state of various rotating components in agro-industrial machinery with a vibration signal acquired from a single point on the machine chassis. Sensors 2014, 14, 20713–20735. [Google Scholar] [CrossRef] [PubMed]
- Available online: http://www.pcb.com/Products/model/356B10/item_id/8704 (accessed on 1 February 2021).
- Available online: http://www.pcb.com/products.aspx?m=480b21 (accessed on 1 February 2021).
- Available online: http://www.ni.com/pdf/manuals/371569d.pdf (accessed on 1 February 2021).
- SR 13230-94 Agricultural Machinery. Plows. Technical Quality Conditions. Available online: https://magazin.asro.ro/ro/standard/8951 (accessed on 28 January 2021).
- STAS ISO 7256/1-92 Sowing equipment—Test methods—Part 1: Single Seed Drills (Precision Drills). Available online: https://magazin.asro.ro/ro/standard/12319 (accessed on 28 January 2021).


| Specifications | PCB Model 356B10 |
|---|---|
| Sensitivity, (mV/(m/s2)) | 0.1 |
| Frequency Range (±5%) (y or z axis), (Hz) | 2–10,000 |
| Frequency Range (±5%) (x axis), (Hz) | 2–7000 |
| Resonant Frequency, (Hz) | ≥55 |
| Output Impedance, (Ω) | ≤200 |
| Dimensions L × l × h, (mm) | 10.2 × 10.2 × 10.2 |
| Weight, (g) | 4 |
| Specifications | PCB Model 480B21 |
|---|---|
| Channels | 3 |
| Frequency Range, (Hz) | 0.15–100,000 |
| Temperature Range, (°C) | 0–50 |
| Power supply, (Vcc) | 3 × 9 |
| Excitation Voltage (to sensor), (Vcc) | 25–29 |
| Dimensions L × l × h, (cm) | 19 × 12.5 × 5 |
| Weight (including batteries), (g) | 500 |
| Plot | Soil Fractions, (mm) | Weight of Soil Fraction, (kg) | Gms, (%) | SD, (%) |
|---|---|---|---|---|
| P1 | >100 | 1.67 | 0.96 | 0.62 |
| 50–100 | 37.00 | 21.22 | 3.58 | |
| 20–50 | 68.40 | 39.23 | 2.61 | |
| <20 | 67.30 | 38.60 | 2.98 | |
| Sample total weight | 174.37 | |||
| P2 | >100 | - | - | |
| 50–100 | 19.90 | 10.86 | 0.28 | |
| 20–50 | 82.90 | 45.23 | 2.03 | |
| <20 | 80.47 | 43.91 | 2.86 | |
| Sample total weight | 183.27 | |||
| P3 | >100 | 4.40 | 2.29 | 1.43 |
| 50–100 | 45.47 | 23.65 | 2.11 | |
| 20–50 | 81.17 | 42.22 | 7.77 | |
| <20 | 61.23 | 31.85 | 12.30 | |
| Sample total weight | 192.27 |
| Row Units Vibration Data | P1 | P2 | P3 | |||||||
|---|---|---|---|---|---|---|---|---|---|---|
| Working Speed (km·h−1) | ||||||||||
| 4 | 6 | 8 | 4 | 6 | 8 | 4 | 6 | 8 | ||
| SO | max (m·s−2) | 4.11 | 16.61 | 9.71 | 2.17 | 3.01 | 7.11 | 5.48 | 6.42 | 15.76 |
| min (m·s−2) | −4.22 | −12.59 | −8.27 | −2.34 | −3.49 | −6.56 | −5.91 | −6.31 | −10.31 | |
| RMS (m·s−2) | 1.12 | 2.99 | 2.71 | 0.64 | 0.91 | 1.45 | 1.39 | 1.71 | 2.65 | |
| SV | max (m·s−2) | 3.94 | 14.72 | 10.62 | 1.38 | 3.74 | 7.93 | 5.05 | 4.75 | 10.17 |
| min (m·s−2) | −8.84 | −12.23 | −12.68 | −1.75 | −3.71 | −12.31 | −7.48 | −11.25 | −13.85 | |
| RMS (m·s−2) | 1.53 | 4.64 | 3.43 | 0.45 | 1.06 | 2.39 | 1.51 | 1.77 | 4.02 | |
| BV | max (m·s−2) | 3.27 | 8.49 | 7.98 | 2.82 | 2.77 | 4.01 | 3.32 | 4.97 | 6.21 |
| min (m·s−2) | −3.07 | −9.05 | −7.64 | −2.02 | −2.25 | −4.35 | −3.87 | −5.45 | −8.88 | |
| RMS (m·s−2) | 0.88 | 2.12 | 2.29 | 0.57 | 0.75 | 1.24 | 1.13 | 1.42 | 2.07 | |
| Characteristics According ISO 7256/1-92 | Repetitions | ||
|---|---|---|---|
| R1 | R2 | R3 | |
| I 0 < Xi ≤ 0.5 (double sowing) | 8 | 5 | 8 |
| II 0.5 < Xi ≤ 1.5 (correct sowing) | 482 | 482 | 480 |
| III 1.5 < Xi ≤ 2.5 (missing sowing) | 4 | 7 | 9 |
| IV 2.5 < Xi ≤ 3.5 (missing sowing) | 6 | 6 | 3 |
| V 3.5 < Xi (missing sowing) | 0 | 0 | 0 |
| Real intervals | 500 | 500 | 500 |
| Theoretical intervals | 508 | 514 | 507 |
| Doubles | 8 | 5 | 8 |
| Normally sown seeds | 484 | 490 | 484 |
| Missing planting holes | 16 | 19 | 15 |
| Xaverage | 0.987 | 0.996 | 0.992 |
| Feeding quality index A (%) | 95.27 | 95.33 | 95.46 |
| Doubles index D (%) | 1.57 | 0.97 | 1.58 |
| Missing planting holes index M (%) | 3.16 | 3.70 | 2.96 |
| Theoretical deviation σ | 0.091 | 0.091 | 0.092 |
| Coefficient of variation CV (%) | 9.055 | 9.132 | 9.255 |
| Characteristics According ISO 7256/1-92 | Repetitions | ||
|---|---|---|---|
| R1 | R2 | R3 | |
| I 0 < Xi ≤ 0,5 (double sowing) | 20 | 14 | 6 |
| II 0.5 < Xi ≤ 1.5 (correct sowing) | 469 | 469 | 462 |
| III 1.5 < Xi ≤ 2.5 (missing sowing) | 6 | 9 | 31 |
| IV 2.5 < Xi ≤ 3.5 (missing sowing) | 5 | 7 | 1 |
| V 3.5 < Xi (missing sowing) | 0 | 0 | 0 |
| Real intervals | 500 | 500 | 500 |
| Theoretical intervals | 496 | 512 | 527 |
| Doubles | 20 | 14 | 6 |
| Normally sown seeds | 460 | 472 | 488 |
| Missing planting holes | 11 | 16 | 32 |
| Xaverage | 0.878 | 1.082 | 0.998 |
| Feeding quality index A (%) | 92.74 | 92.18 | 92.59 |
| Doubles index D (%) | 4.03 | 2.73 | 1.13 |
| Missing planting holes index M (%) | 3.23 | 5.09 | 6.28 |
| Theoretical deviation σ | 0.120 | 0.128 | 0.139 |
| Coefficient of variation CV (%) | 12.003 | 12.825 | 13.984 |
| Plot | Working Speed (km·h−1) | Sowing Precision (%) |
|---|---|---|
| P1 | 4 | 91.55 |
| 6 | 88.45 | |
| 8 | 84.66 | |
| P2 | 4 | 92.51 |
| 6 | 89.72 | |
| 8 | 85.87 | |
| P3 | 4 | 90.46 |
| 6 | 87.55 | |
| 8 | 81.78 |
Publisher’s Note: MDPI stays neutral with regard to jurisdictional claims in published maps and institutional affiliations. |
© 2021 by the authors. Licensee MDPI, Basel, Switzerland. This article is an open access article distributed under the terms and conditions of the Creative Commons Attribution (CC BY) license (https://creativecommons.org/licenses/by/4.0/).
Share and Cite
Cujbescu, D.; Găgeanu, I.; Persu, C.; Matache, M.; Vlăduț, V.; Voicea, I.; Paraschiv, G.; Biriș, S.Ș.; Ungureanu, N.; Voicu, G.; et al. Simulation of Sowing Precision in Laboratory Conditions. Appl. Sci. 2021, 11, 6264. https://doi.org/10.3390/app11146264
Cujbescu D, Găgeanu I, Persu C, Matache M, Vlăduț V, Voicea I, Paraschiv G, Biriș SȘ, Ungureanu N, Voicu G, et al. Simulation of Sowing Precision in Laboratory Conditions. Applied Sciences. 2021; 11(14):6264. https://doi.org/10.3390/app11146264
Chicago/Turabian StyleCujbescu, Dan, Iuliana Găgeanu, Cătălin Persu, Mihai Matache, Valentin Vlăduț, Iulian Voicea, Gigel Paraschiv, Sorin Ștefan Biriș, Nicoleta Ungureanu, Gheorghe Voicu, and et al. 2021. "Simulation of Sowing Precision in Laboratory Conditions" Applied Sciences 11, no. 14: 6264. https://doi.org/10.3390/app11146264
APA StyleCujbescu, D., Găgeanu, I., Persu, C., Matache, M., Vlăduț, V., Voicea, I., Paraschiv, G., Biriș, S. Ș., Ungureanu, N., Voicu, G., & Ipate, G. (2021). Simulation of Sowing Precision in Laboratory Conditions. Applied Sciences, 11(14), 6264. https://doi.org/10.3390/app11146264