Article

Analysis of the Possibility of Using Various Time-Frequency Transformation Methods to Barkhausen Noise Characterization for the Need of Magnetic Anisotropy Evaluation in Steels

Center for Electromagnetic Fields Engineering and High-Frequency Techniques, Faculty of Electrical Engineering, West Pomeranian University of Technology, ul. Sikorskiego 37, 70-313 Szczecin, Poland
*
Author to whom correspondence should be addressed.
Appl. Sci. 2021, 11(13), 6193; https://doi.org/10.3390/app11136193
Submission received: 28 May 2021 / Revised: 30 June 2021 / Accepted: 1 July 2021 / Published: 3 July 2021

Abstract

:
Magnetic Barkhausen Noise (MBN) is a method being currently considered by many research and development centers, as it provides knowledge about the properties and current state of the examined material. Due to the practical aspects, magnetic anisotropy evaluation is one of such key areas. However, due to the non-stationary and stochastic nature of MBN, it requires searching for postprocessing procedures, allowing the extraction of crucial information on factors influencing the phenomenon. Advances in the field of the analysis of non-stationary signals by various transformations or decompositions resulting into new time- and frequency-related representations, allow the interpretation of complex sets of signals. Therefore, in this paper, several time-frequency transformations were used to analyze the data of MBN for the purpose of the magnetic anisotropy evaluation of electrical steel. The three main transform types with their modifications were considered and compared: the Short-Time Fourier Transform, the Continuous Wavelet Transform and the Smoothed Pseudo Wigner–Ville Transform. By using Exploratory Data Analysis methods and the parametrization of time-frequency representation, the qualitative and quantitative analysis was made. The STFT presented good performance on providing useful information on MBN changes while simultaneously leading to the lowest computational efforts.

1. Introduction

The structure of ferromagnetic material comprises magnetic domains (regions within the material being magnetized in uniform direction). Its reorganization takes place during the magnetization process. The magnetizing cycle of the material under microscopic terms often has a unique course [1]. Due to the occurrence of energy-related barriers blocking free reorganization, this process, being an outcome of the state of various energies at a given moment, has a non-stationary and stochastic nature. Consequently, it is not continuous, but has a character of abrupt changes. As a result, there are sudden discrete changes of the magnetization state, which can be sensed by the measuring coil, placed in the vicinity of the surface of the tested material. Those changes force the induction of voltage pulses in the coil, whose intensities change as a function of time. By analyzing the voltage course in the full period of magnetization, it resembles the noise signal. This phenomenon has been called Magnetic Barkhausen Noise (MBN) [2,3,4].
Non-stationary means that the statistical parameters change over time [5]. Stochasticity and non-stationary signals cause the problem of extracting information about changes in material or its properties. Stochastic and non-stationary signals are difficult to analyze due to the lack of determinism. However, with the development of computational algorithms and capabilities of processing units, numerous methods have been implemented that allow the signal to be transformed into its various representation forms. Time-frequency (TF) and time-scale (TS) representations allow one to obtain information, which may complement the knowledge obtained through the separate analysis carried out only in the time or frequency domains. TF representation analysis is used in many applications, requiring the processing of signal with time-varying signals to extract information.
There are many transformations that allow one to process the signal from the time and frequency domains to the time-frequency representation (TFR). In this paper, the authors present the application of three main transformations groups, that came from different categories, along with their modifications. The first group includes the Short-Time Fourier Transform (STFT) related to the Fourier transform, based on the decomposition of the signal into components (represented by sine and cosine function with appropriate weights) for subsequent discrete time segments, so called windows of signal. This approach enables the determination of a sequence of short-time frequency characteristics in subsequent time intervals and the observation of changes in the content of the signal’s components. The second group refers to the Continuous Wavelet Transform (CWT) related to the operation of matching (scaling and transition) a base function called a wavelet. Various base wavelet functions are used to provide different properties. Considering that linear transformations, such as the STFT and the CWT, constitute a certain local averaging of the characteristics, the method called Synchrosqueezed Transform (SST) was developed. It allows one to sharpen the transformed distributions in such a way that the operation remains invertible [6,7,8]. In the works introducing this transformation, one can find a reference to the Fourier Synchrosqueezed Transform (FSST) [6] and the Wavelet Synchrosqueezed Transform (WSST) [8] as well. The SST relocates the TFR and allows the outcome distribution to be sharpened. The synchrosqueezing operation is used for two purposes: to concentrate the TFR of a signal that consists of many components, and as a signal decomposition tool. The last analyzed group refers to a bilinear transformation—the Wigner–Ville Distribution (WVD). This transformation was further modified by adding a smoothing window in time and frequency modes to remove interferences resulting in a new version called the Smoothed Pseudo Wigner–Ville Distribution (SPWVD). One of the main advantage of WVD transformation is that in the case of non-stationary signals, it enables one to achieve high resolution both over time and frequency [9].
The above-mentioned transformations have found many applications in signal analysis so far. Some of them are given below. In [10], several TF transforms were compared, including the STFT, the WVD and the SPWVD as well. The TF transforms were used to study seismocardiographic signals. A comparison was achieved by building two synthetic signals with known TF distributions resembling the real ones: first with time-independent frequencies and the second one with varying frequency components. Then, by using the above-mentioned transformations, the detection of appropriate instantaneous frequency (IF) was made. For the first signal type, the lowest Normalized Root Mean Square Error (NRMSE) value was obtained for the STFT transformation and for the second one, the lowest value was found for the SPWVD. The STFT brought no significant advantage over the SPWVD, except for simplicity. Simultaneously, the performance of the WVD was assessed to be the made worse (as it appeared to have, i.e., the highest artifacts). Similarly, in [11], various TF transformations were used to analyze EEG signals. The STFT transformation was also used to study the low-frequency signals generated by wind turbines [12]. In [13,14], the FSST was used to analyze seismological signals. In paper [14], the authors showed that in this application of the FSST can be used to detect low-frequency shadow anomalies (these are frequency bands related to hydrocarbons) and to obtain more favorable results than in relation to the STFT. In article [15], the WSST was used to analyze signals obtained by an ultrasound transducer and laser vibrometer. In this application, the WSST improved the sensitivity to damage detection by 36%. The WSST was also used to carry out research on the instantaneous resonance frequency of the modelled bridge over which the mass was moving [16]. It has been shown that the WSST can be used to monitor the condition of the bridge and detect the structure damage. Authors proposed that the WSST could be used monitor the health of structure in quasi real time.
Additionally, until now, several studies have also been published on the application of the TF transforms to the MBN signal analysis. The aggregate qualitative comparison of the TF transformation, such as the STFT and the WVD, was published in [17]. An extended analysis of the TF transformation for steels that have been hardened was carried out in [18]. The paper presents various transformations, such as the STFT, the SPWVD and the CWT as well. Various display modes were used to present qualitative and quantitative analysis. The study has shown that signal analysis through the TF and TS representations can provide valuable information about the MBN phenomenon course under the influence of various material properties. In [19], the possibility of the parametrization of the STFT spectrogram was presented in order to study the stress level in structural steel. In [20], the authors investigated the TFR of the MBN signals for magnetic anisotropy evaluation in a grain-oriented electrical steel sheet. The possibility of dividing the spectrogram into temporal subperiods, that correspond to a particular subprocess of the reorganization of domain structure, has been presented. The analysis provides information on changes in MBN activity in specific time periods of the magnetization process for different directions of the magnetic field, which may be helpful in explaining the source of the resultant anisotropy characteristic in ferromagnetic materials. In paper [21], the determination of easy and hard magnetization axes were presented by analyzing the MBN signals using the STFT transform. The influence of the measuring condition on the quality of information on magnetic anisotropy was also analyzed by the authors. The wavelets were applied successfully as a tool to analyze the MBN signal for eq. crack detection [22], material properties [23], or residual stress testing [24]. According to the best knowledge of the authors of this publication, neither the FSST nor the WSST transformation have been already used to analyze the course of the MBN phenomenon.
As it was discussed, the TF transformations are used to analyze various types of signals; however, with various efficiency depending on the application. Therefore, the aim of this paper is to examine the possibility of using various TFRs, obtained by the above-mentioned transformations with different mathematical bases, in the context of the extraction of information obtained from MBN on the magnetic anisotropy of grain-oriented electrical steel sheets. The evaluation is performed qualitatively and quantitatively for three transformation groups: the STFT, the CWT and the SPWVD. Moreover, to obtain a greater concentration of the acquired information, the result obtained by both linear transformations were additionally processed using the SST operation. In a further part of the paper, the qualitative assessment is presented. In the procedure, for each analyzed TF transformation, the possibility of the clear observation of MBN activity changes during the magnetization period is then considered. In the later part of paper, the quantitative assessment of the information quality provided by each transformation is given. The analysis is divided into two parts. In the first one, the information convergence is investigated by comparing the detailed angular distributions of two selected TF features obtained for the successive transformation methods (analysis of the parameter value courses as a function of the magnetization angle). In the second stage, the information quality is assessed in the broader context of the properties of time-frequency distributions. Additionally, the assessment of the computational effort is performed and shown.

2. Experimental Setup

Measurements were made for conventional grain-oriented electrical steel sheets. The steel was cold rolled. As a result of rolling, such steel has anisotropic magnetic properties. Consequently, it is characterized by the occurrence of easy and hard magnetization axes. In the first case, the magnetic saturation state is achieved for a relatively lower value of the magnetizing field. In contrast, the direction of hard magnetization requires the use of higher field values for the same purpose. Barkhausen Noise is one of the methods that can be used to characterize anisotropic properties, as the noise activity and the dynamics of the MBN phenomenon are strictly dependent on the direction of the magnetizing field with respect to the rolling axis [20,21,25,26,27]. Before the measurements, no additional treatment was made to the material. The steel parameters are presented in Table 1.
The measurements were made for the transducer’s 101 angular arrangement α within the (0°–180°) range, following a constant step of 1.8°. Figure 1 shows a schematic diagram of the sample with the visualization of the position of the transducer at the 0°angle and marks of the direction of further rotation (depicted with a blue arrow). The first measurement was conducted for the transducer aligned along the 0° angle (the transverse direction TD), which means that magnetization was perpendicular to the rolling direction (angle α = 90° is the angle parallel to the rolling direction RD).
The measurements were fully automated. The positioning of the transducer and signal acquisition was managed by a computer. Signals were acquired and generated by the DAQ measurement card (NI-PCI-6251). The measurements were performed using a sinusoidal excitation wave with a frequency of 10 Hz. The excitation current was 370 mA, which corresponds to the value of approximately 1.6 kA/m of magnetizing field. A detailed description of the transducer and measuring system can be found in [19,20,21,28]. Before the data acquisition process, the signal was filtered using analog filters with the pass band set to the 2 kHz–100 kHz range. Detailed information on the filtration settings was provided by the authors in [21]. For each angle, 10 measurements were made, and for a single measurement, the 10 periods of the magnetization process were acquired. The voltage signal sensed by the measuring coil (UBN) was sampled at the frequency of 250 kHz and then processed using the developed digital signal processing procedure.
The exemplary results of UBN burst along with the magnetizing current Ie obtained for the 0, 45 and 90 degree positions of the transducer with respect to the TD are presented in Figure 2. One can clearly notice the difference in the course and dynamics of the observed Barkhausen effect depending on the alignment of the transducer. The greatest activity, especially in the context of the dynamics and the value level of the main MBN peak, can be observed in the 90° direction (RD). This refers to the easier conduction of the magnetization course. As the dynamics of the process changes, the analysis of the combined domains of time and frequency can be useful. This was also shown earlier by authors in [20,21], where the possibility of the utilization of selected time-frequency transformation to MBN signal for the evaluation of anisotropy was deeply discussed. The observed differences of the course of the phenomenon make it possible to effectively conduct the process of assessing the anisotropic properties of steel.

3. TF Transforms and Results

In the following subsections, the transformations that were used to analyze the MBN signal are presented in more detail. The transformations’ input parameters (such as the window value) and output ones (such as spectrogram), as well as their result are presented. In the following part, the comparison of computational times for a single burst of MBN for each of transformation is presented. At the end of this chapter, the qualitative assessment of information provided by each transformation is discussed.

3.1. TF Analysis

The Short-Time Fourier Transform (STFT) [18,29] is relatively simple transformation, which, due to it is low computational complexity, can be successfully used on various Single Board Computers (SBCs). The STFT involves performing the Fast Fourier Transform (FFT) over small time intervals. The STFT transformation has several parameters that can be controlled to adjust the transformation to the studied phenomenon. Such parameters are, e.g., the size of the signal window (i.e., the time interval) for which the sequential FFT calculations are performed. The most frequently used windowing functions are: Hann, Hamming or Kaiser [21]. The Kaiser function allows one to carry out the parametrization of the windowing characteristic. The STFT transformation is characterized by a constant window size during computations. Simultaneously, the size affects the resolution in time and frequency. Thus, the window may be wide in the time domain, but then, narrow in the frequency domain or vice versa. However, the resolution of calculations over time can be additionally increased by overlapping the successive windows of signals [17]. In this paper, the overlapping of 75% was used, which ultimately resulted in obtaining a resolution in Δf = 488 Hz and Δt = 500 µs. The STFT and spectrogram is given, respectively, by the following formulas [29]:
X ( t , f ) = x ( τ ) ω ( τ t ) e j 2 π f τ d τ
S P E C ( t , f ) = | X ( t , f ) |   2
where ω ( t ) —window function, x(t)—input signal, X ( t , f ) —result of the STFT (matrix of complex number), and S P E C ( t , f ) —spectrogram of STFT.
The FSST is the result of a post-processing method applied to the STFT transformation distribution. This method allows one to improve the concentration of the signal consisting of many components [6]. A Kaiser window of a size of 512 samples was used during the calculation of the STFT and the FSST as well. The applied frequency resolution was the same as in case of the STFT, but the resolution over time domain reached Δt = 0.4 µs.
The Continuous Wavelet Transform (CWT) is another transform commonly used to analyze non-stationary signals [30]. As in the case of the STFT, the square of the transform module defines a spectrogram, in the case of the CWT, the result is in a form of scalogram. Computations are also performed for the sequence of windowed signal; however, compared to the STFT, a window size is not fixed in this case. There are many types of base wavelets to choose from, which make it possible to emphasize various properties of the transformed signal at a given moment in time. In this paper, a Morlet wavelet is applied to obtain a constant variance for time and frequency domains. Similar to the STFT, in the case of the CWT, it is also possible to perform the scalograms sharpening using the SST, resulting in WSST transform. For the WSST, the resolution in the frequency domain is greater than for the CWT; however, both increase logarithmically. The resolution in time domain for both transformations was the same and equal to Δt = 0.4 µs. The CWT is given by formula [5]:
C W T ( a , b ) = 1 a x ( t ) h * ( t b a ) d t
where a—parameter responsible for scaling the wavelet, b—parameter responsible for translation effect (shift in time axis),   h * —complex conjugate of the scaled and shifted wavelet function, and x(t)—input signal.
Another considered transformation is derived from the WVD transformation [31]. The WVD itself is the transformation that offers a wide range of analysis in the case of many time-varying signals. It overcomes the limited resolution of the transforms based on Fourier and wavelet methods through an autocorrelation operation. However, simultaneously, a certain difficulty brought by WVD is a cross-terms effect. It refers to a local oscillation between the main components of signals, which may take a value two times greater than the value of the main signal [32]. Thus, on the fundamentals of WVD, the Pseudo Wigner–Ville Distribution (PWVD) was created. The transformation was introduced by adding a windowing operation to the analyzed signal over the time domain [30,33]. This allows one to overcome parasitic interferences that hinder the interpretation of the result of transformation (what leads to averaged representation). As a result of the operation of this transformation, one obtains the real values—not the complex ones as in the case of the STFT. Further modification of the WVD was made by adding two smoothing windows, both in the time domain and in frequency domain as well. The modified transformation is named the Smoothed Pseudo Wigner–Ville Distribution (SPWVD). The SPWVD is given by formula [31]:
S P W V D ( t , f ) = t 1 f 1 g ( t t 1 ) H ( f f 1 ) W ( t 1 f 1 ) d t 1 d f 1
W ( t , f ) = x ( t + τ 2 ) x * ( t τ 2 ) e j 2 π f τ d τ
where g ( t ) —smoothing window in time domain, H ( f ) —smoothing window in frequency domain, τ—is a lag, and x(t)—an input signal.
In this paper, two configurations of the SPWVD transform have been compared. The first one (ascribed as SPWVDv1) was limited, so that the resolutions in the frequency and the time domains corresponded to the ones obtained for the STFT. In this case, the resolutions were equal to Δf = 456 Hz and Δt = 5310 µs. In the second case (ascribed as SPWVDv2), the boundary conditions were released, which allowed one to obtain resolutions of Δf = 125 Hz and Δt = 50 µs.

3.2. Qualitative Data Analysis Results

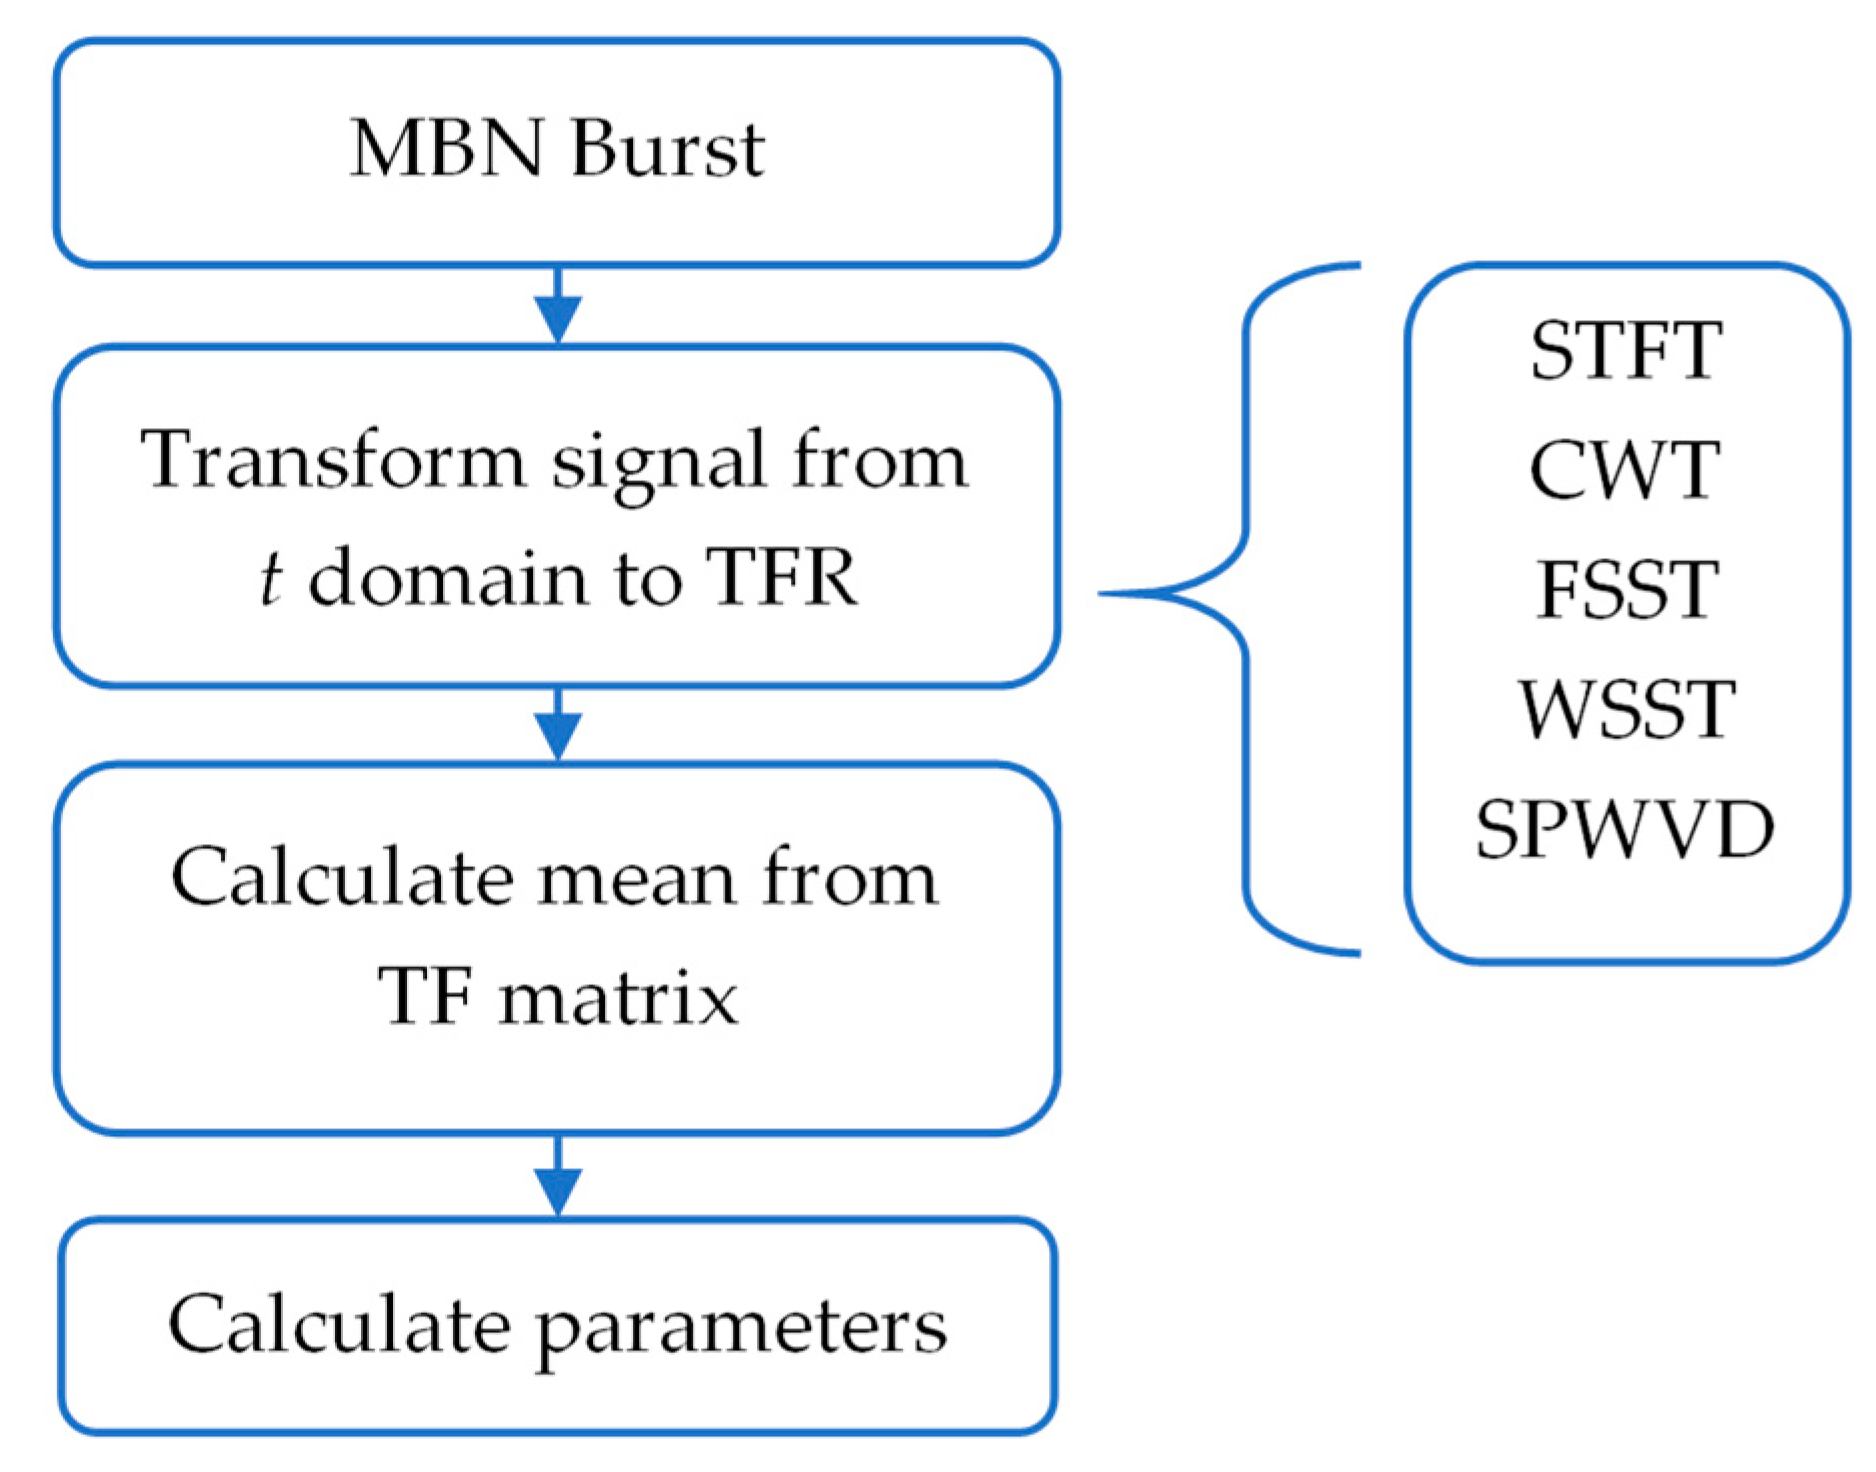
The diagram in Figure 3 shows the complete process of the UBN signal TF analysis. Two main stages can be distinguished. The first refers to the computations of six TFRs by applying all considered methods and their configurations for each analyzed MBN signal. During the second stage, the feature extraction procedure was applied, allowing for the definition of several TF parameters for each obtained TF distribution. The procedure of processing the UBN signal was the same for all transformations.
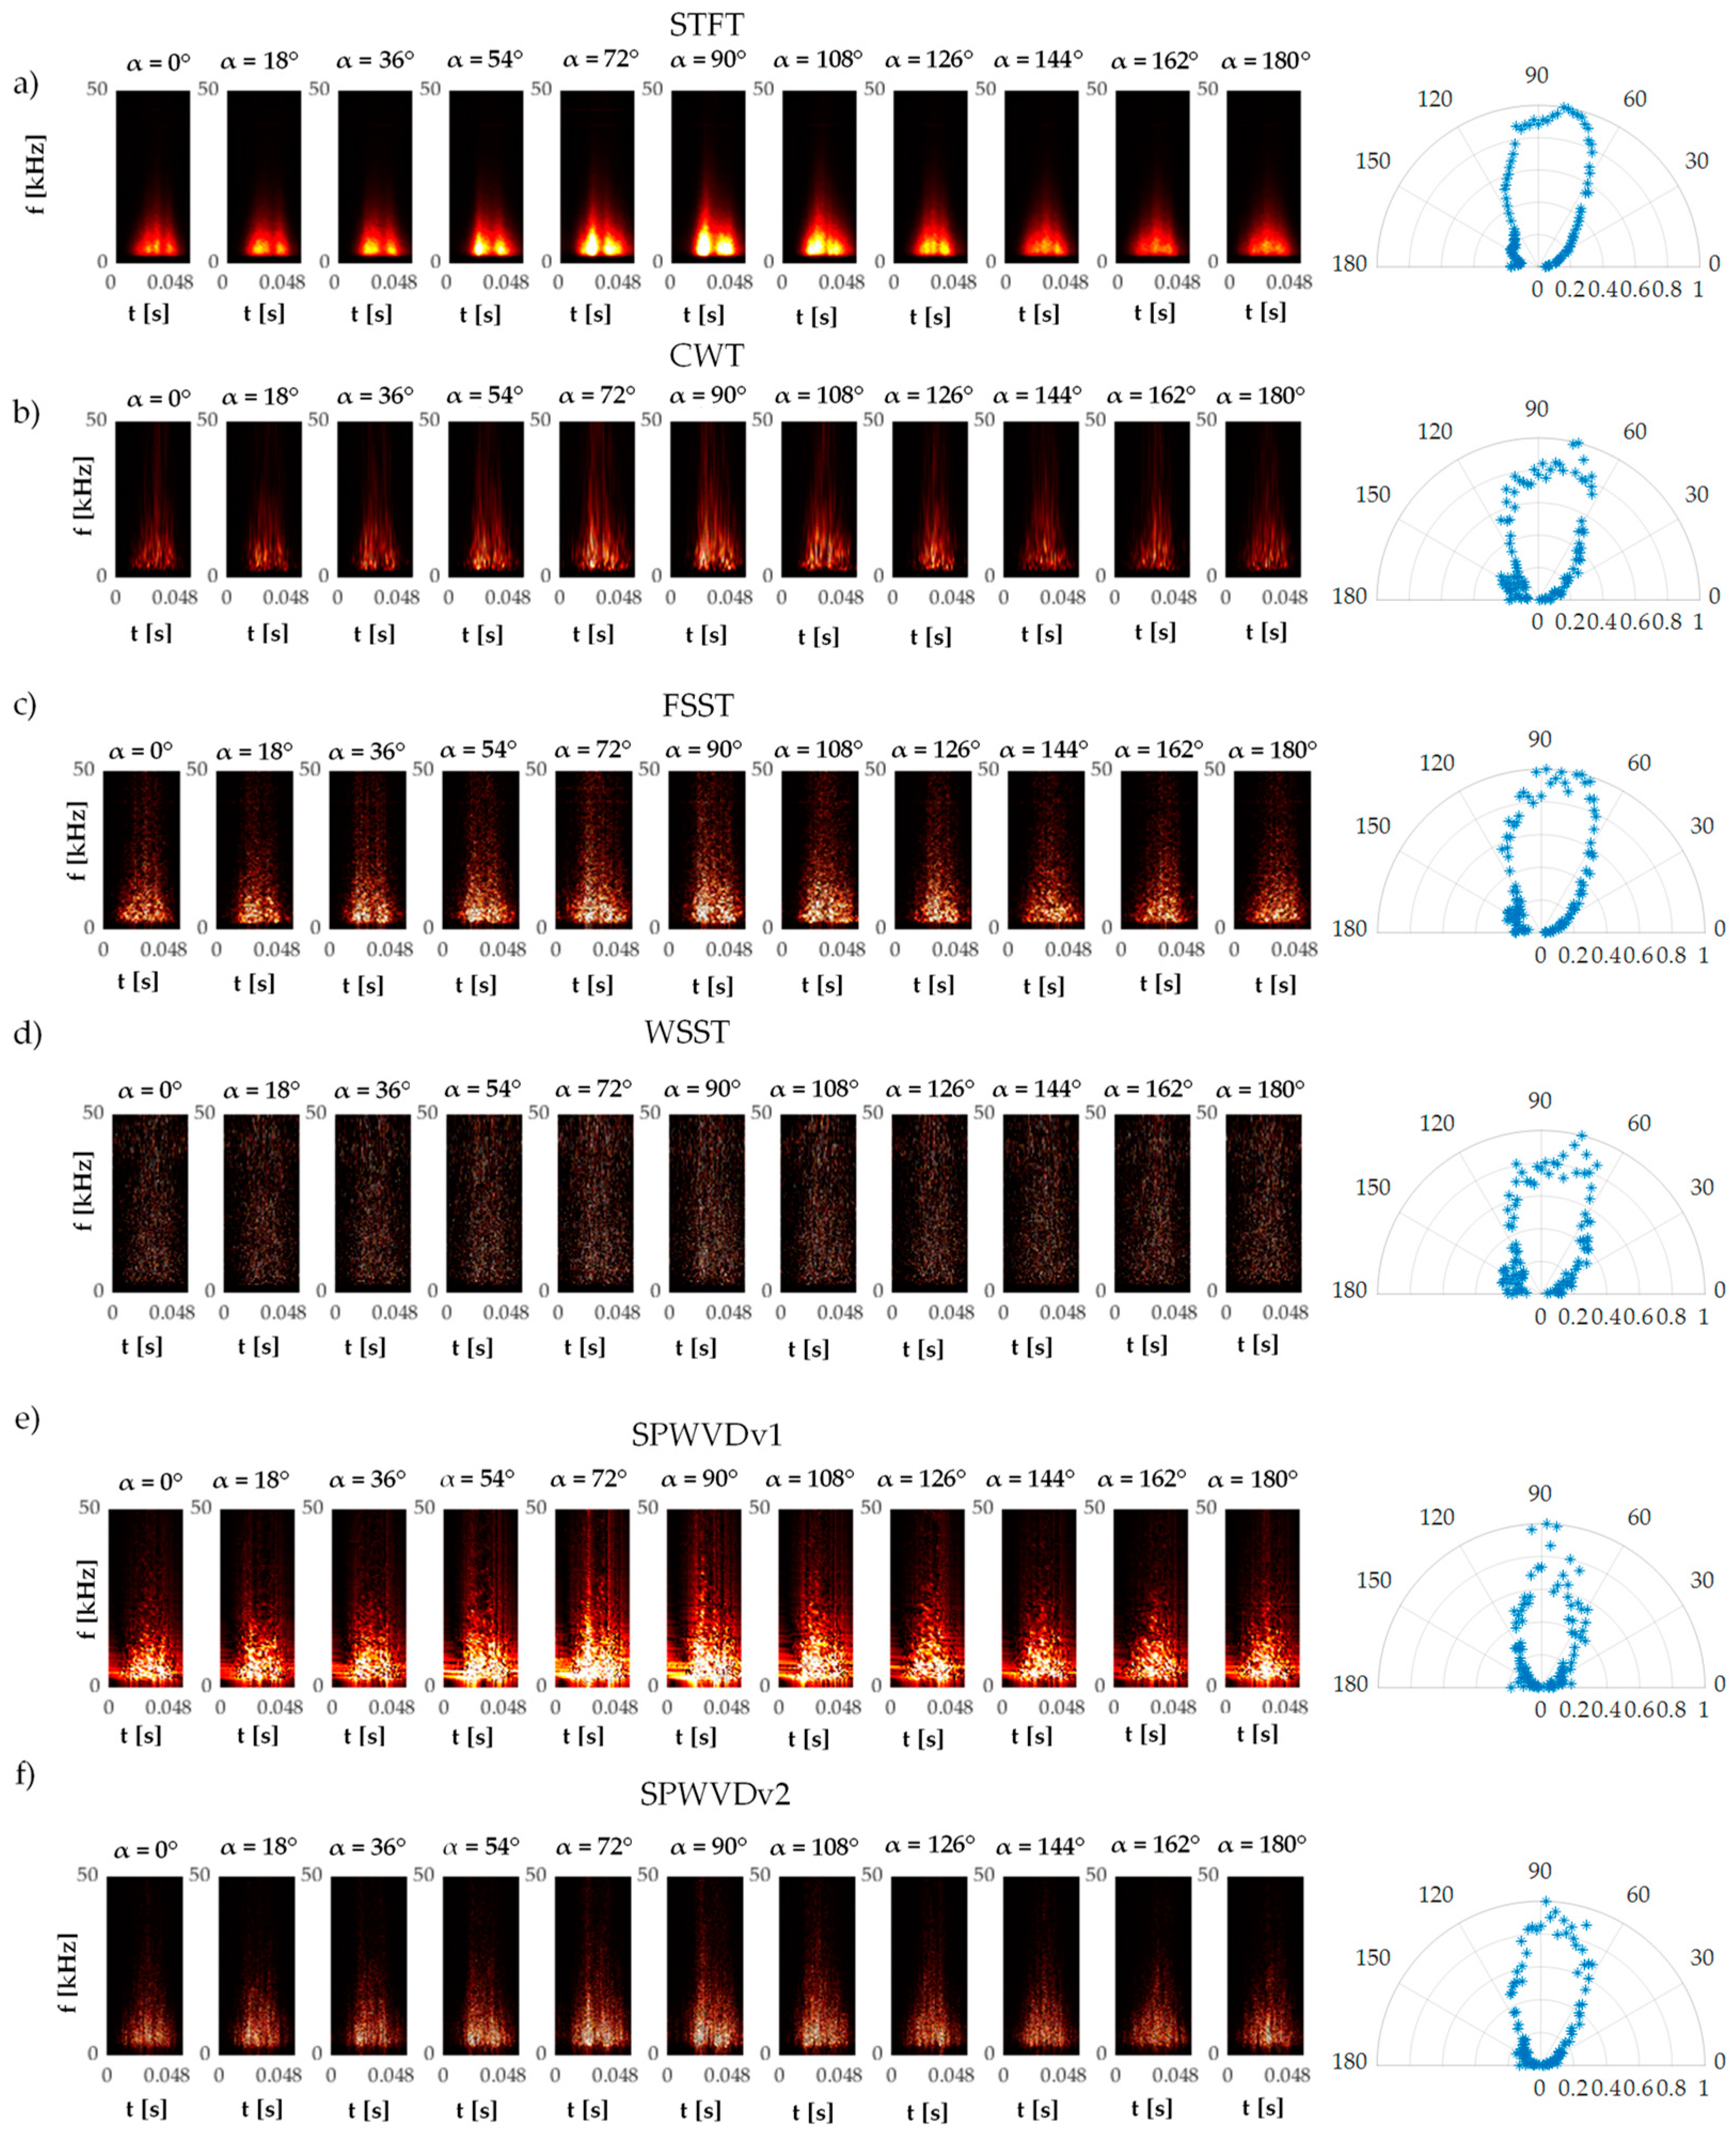
Figure 4 shows the TF distributions for all five transformations obtained for previously discussed configuration along with the distribution an exemplary TF parameter plotted as a function of magnetizing angle. Figure 4a presents the STFT spectrograms. Based on them, one can notice the increase in MBN activity with the increasing magnetizing angle from α = 0° to α = 90°, and then a decrease in the further angular range up to 180°. Considering the spectrogram achieved for the angle α = 0°, three local areas of intensive MBN activity can be distinguished. The first area of activity is located around 0.020 s, the second one close to 0.028 s and the third one to 0.035 s. These three main areas of activity can be related to the phenomena occurring during the reorganization of the magnetic domain structure in the following order: domain nucleation, 180° domain wall movement and 90° domain wall movement [20,34]. Next, these areas successively merge when the magnetizing angle α increases, what leads to the formation of two dominant activity intervals. The following stages of the process can be observed for α range until 90°. Then, for an angle greater than 90°, the two areas gradually divide into three again. In Figure 4b, the CWT scalograms are presented. To allow the comparison, the frequency axis is presented in a linear scale. One can see that the MBN activity increases with the increasing value of the angle α up to 90°, and then it decreases—similarly to the STFT distributions. However, in the CWT case, the three areas of activity are not as clearly visible as they are for the spectrograms. For the angle α = 90°, it is possible to identify the two areas of activity but not as precisely as in the case of the spectrogram obtained for the STFT transformation.
Further, Figure 4c presents spectrograms of the FSST transformation. It does not allow one to observe areas of activity as clearly as in the case of the STFT. However, two main areas of activity can be noticed in the distribution for the angle α = 90°. The MBN activity rises and falls are the same as in the cases of the previously discussed transformations. The results of the WSST scalograms are shown in Figure 4d. From the obtained results, none of qualitative analysis of MBN activity can be performed. The obtained distributions contain information that is unreadable for a human and require the use of methods which would allow one to extract the hidden information. Finally, Figure 4e,f present the absolute value of the SPWVD distributions achieved for two utilized configurations. In the first version (SPWVDv1—transformation parameters corresponding to the STFT ones), similarly as in previous cases, the MBN activity increases with the increasing angle up to α = 90°, and then decreases. However, in this transformation setup (limited resolution), none of the activity intervals can be distinguished. A visible increase in the discrimination of MBN activity areas was obtained in the second case (Figure 4f—SPWVDv2). Nevertheless, the general trends are very similar to the ones observed in the case of previously described transformations.
Additionally, the results of the considered transformations were also analyzed from the perspective of the complexity of calculations. In Table 2, the computational times are presented. All calculations were performed on one computer, with the components presented in Table 3.
The lowest time was achieved for the STFT transform, while the greatest one for the WSST. The computation time of SPWVDv2 is higher than of SPWVDv1 by about 24.87%. There is a significant computation time difference between the STFT and the FSST.

3.3. Qualitative Data Analysis

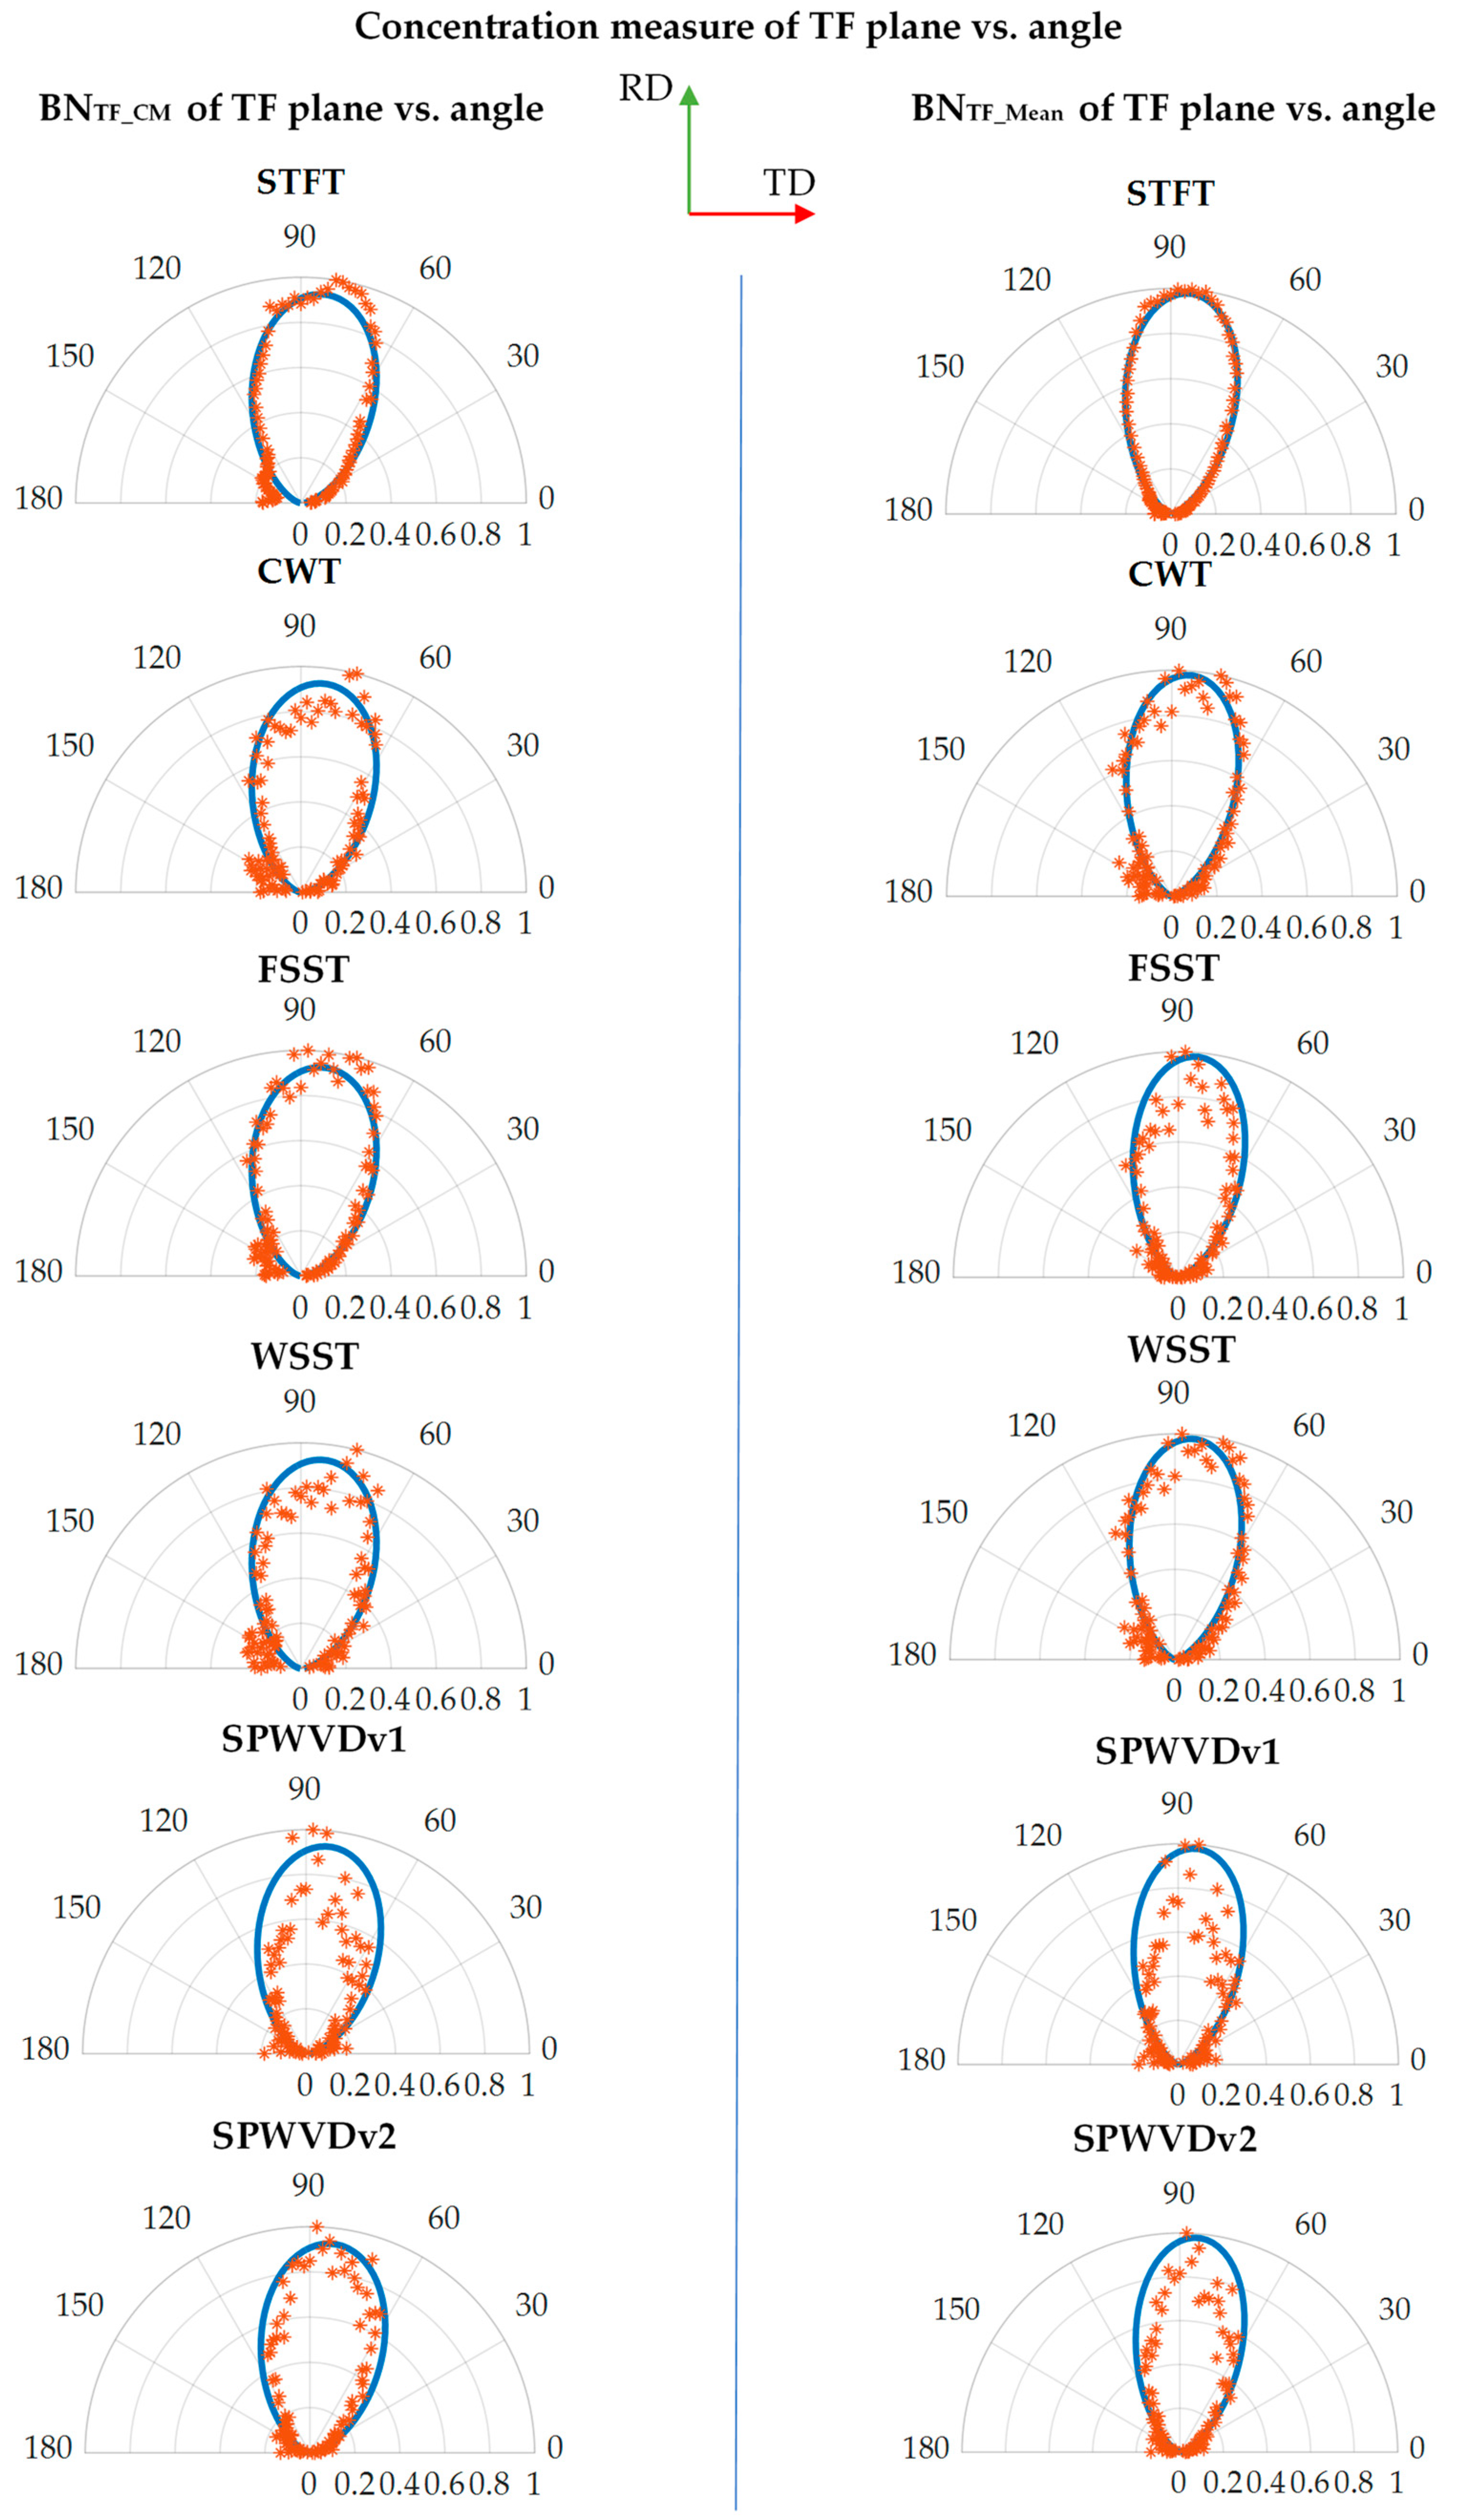
Due to the difficulty in the qualitative comparison of some transformations, a quantitative analysis was performed. For this purpose, the features extraction procedure was applied on the obtained TFRs. In Figure 5, the distribution of two selected parameters were shown as a function of angle α: the measure of the concentration of TFR—BNTF_CM (on the left side) and the average value of TFR—BNTF_MEAN (on the right side). The BNTF_CM was chosen because it allows one to generalize the information contained in the TFR well. This parameter takes a higher value when the TFR is uniform. However, it is also insensible to low values of TFR. The second parameter, BNTF_MEAN, is a standard statistical parameter describing the average value of a distribution. The formulas of both parameters are presented in Table 4. The authors provided a wide description of possible methods of parametrization of TFR in their previous publication [19,20]. Considering the angular distribution of the parameters obtained for the STFT spectrogram, the base approximation was determined. It was treated as a reference characteristic that allowed for a mutual comparison of the obtained TFRs by all considered transformations. To quantify the deviation between the characteristics of TF parameters and the reference approximation, the coefficient of determination r2 was calculated. The formula is given in Table 4, where y i refers to the value of parameter for the i-th angle, y i ^ is the value of approximation for i-th angle and y ¯ is the average value of parameter. Data were normalized for each case to the [0, 1] range.
As it can be seen in Figure 5, generally, both parameters’—BNTF_CM and BNTF_MEAN—values for all transformation increase while the angle is growing α from 0° to 90°. Then, both start to decrease. The characteristics of the TF parameters calculated from the STFT are highly correlated with the approximation (depicted with the blue continuous line on plot). In the case of other transformations, the significant local deviation from the approximation line can be clearly noticed, which may indicate a lower robustness of these transformations. In the case of SPWVDv2, a much more stable change in value relative to the angle was achieved than in case of SPWVDv1 as, along with increasing resolution both in frequency and time, the stability of the characteristics increases. The FSST-based characteristics have a similar trend as the ones for the STFT, although the values for the FSST-based TF parameters have a greater deviation from the approximation characteristic.
In Figure 6, the bar plot showing the value of coefficient of determination r2 for both analyzed TF parameters is presented. For both parameters, the highest value of the r2 coefficient was achieved for the STFT. The lowest value was obtained for both versions of the SPWVD transformations. However, the coefficient r2 for the BNTF_MEAN parameter was higher by 28.32% for SPWVDv2 than for SPWVDv1. In the case of BNTF_CM, this percentage difference was even greater and equal to 37.83%. It proves that the transformation of the SPWVD may provide better results after releasing the limitations of the computation parameters. Transformation in which the synchrosqueezing method was implemented achieved worse results than their base methods. Comparing the STFT and the FSST, the percentage change of 1.20% and 10.45% was obtained, respectively, for the distribution of the BNTF_CM and BNTF_MEAN parameters. The CWT in relation to the WSST has a better fit in terms of the r2 coefficient for BNTF_CM by 7.38%, and for BNTF_MEAN by 0.74%.

3.4. Time-Frequency Representations Robustness Analysis

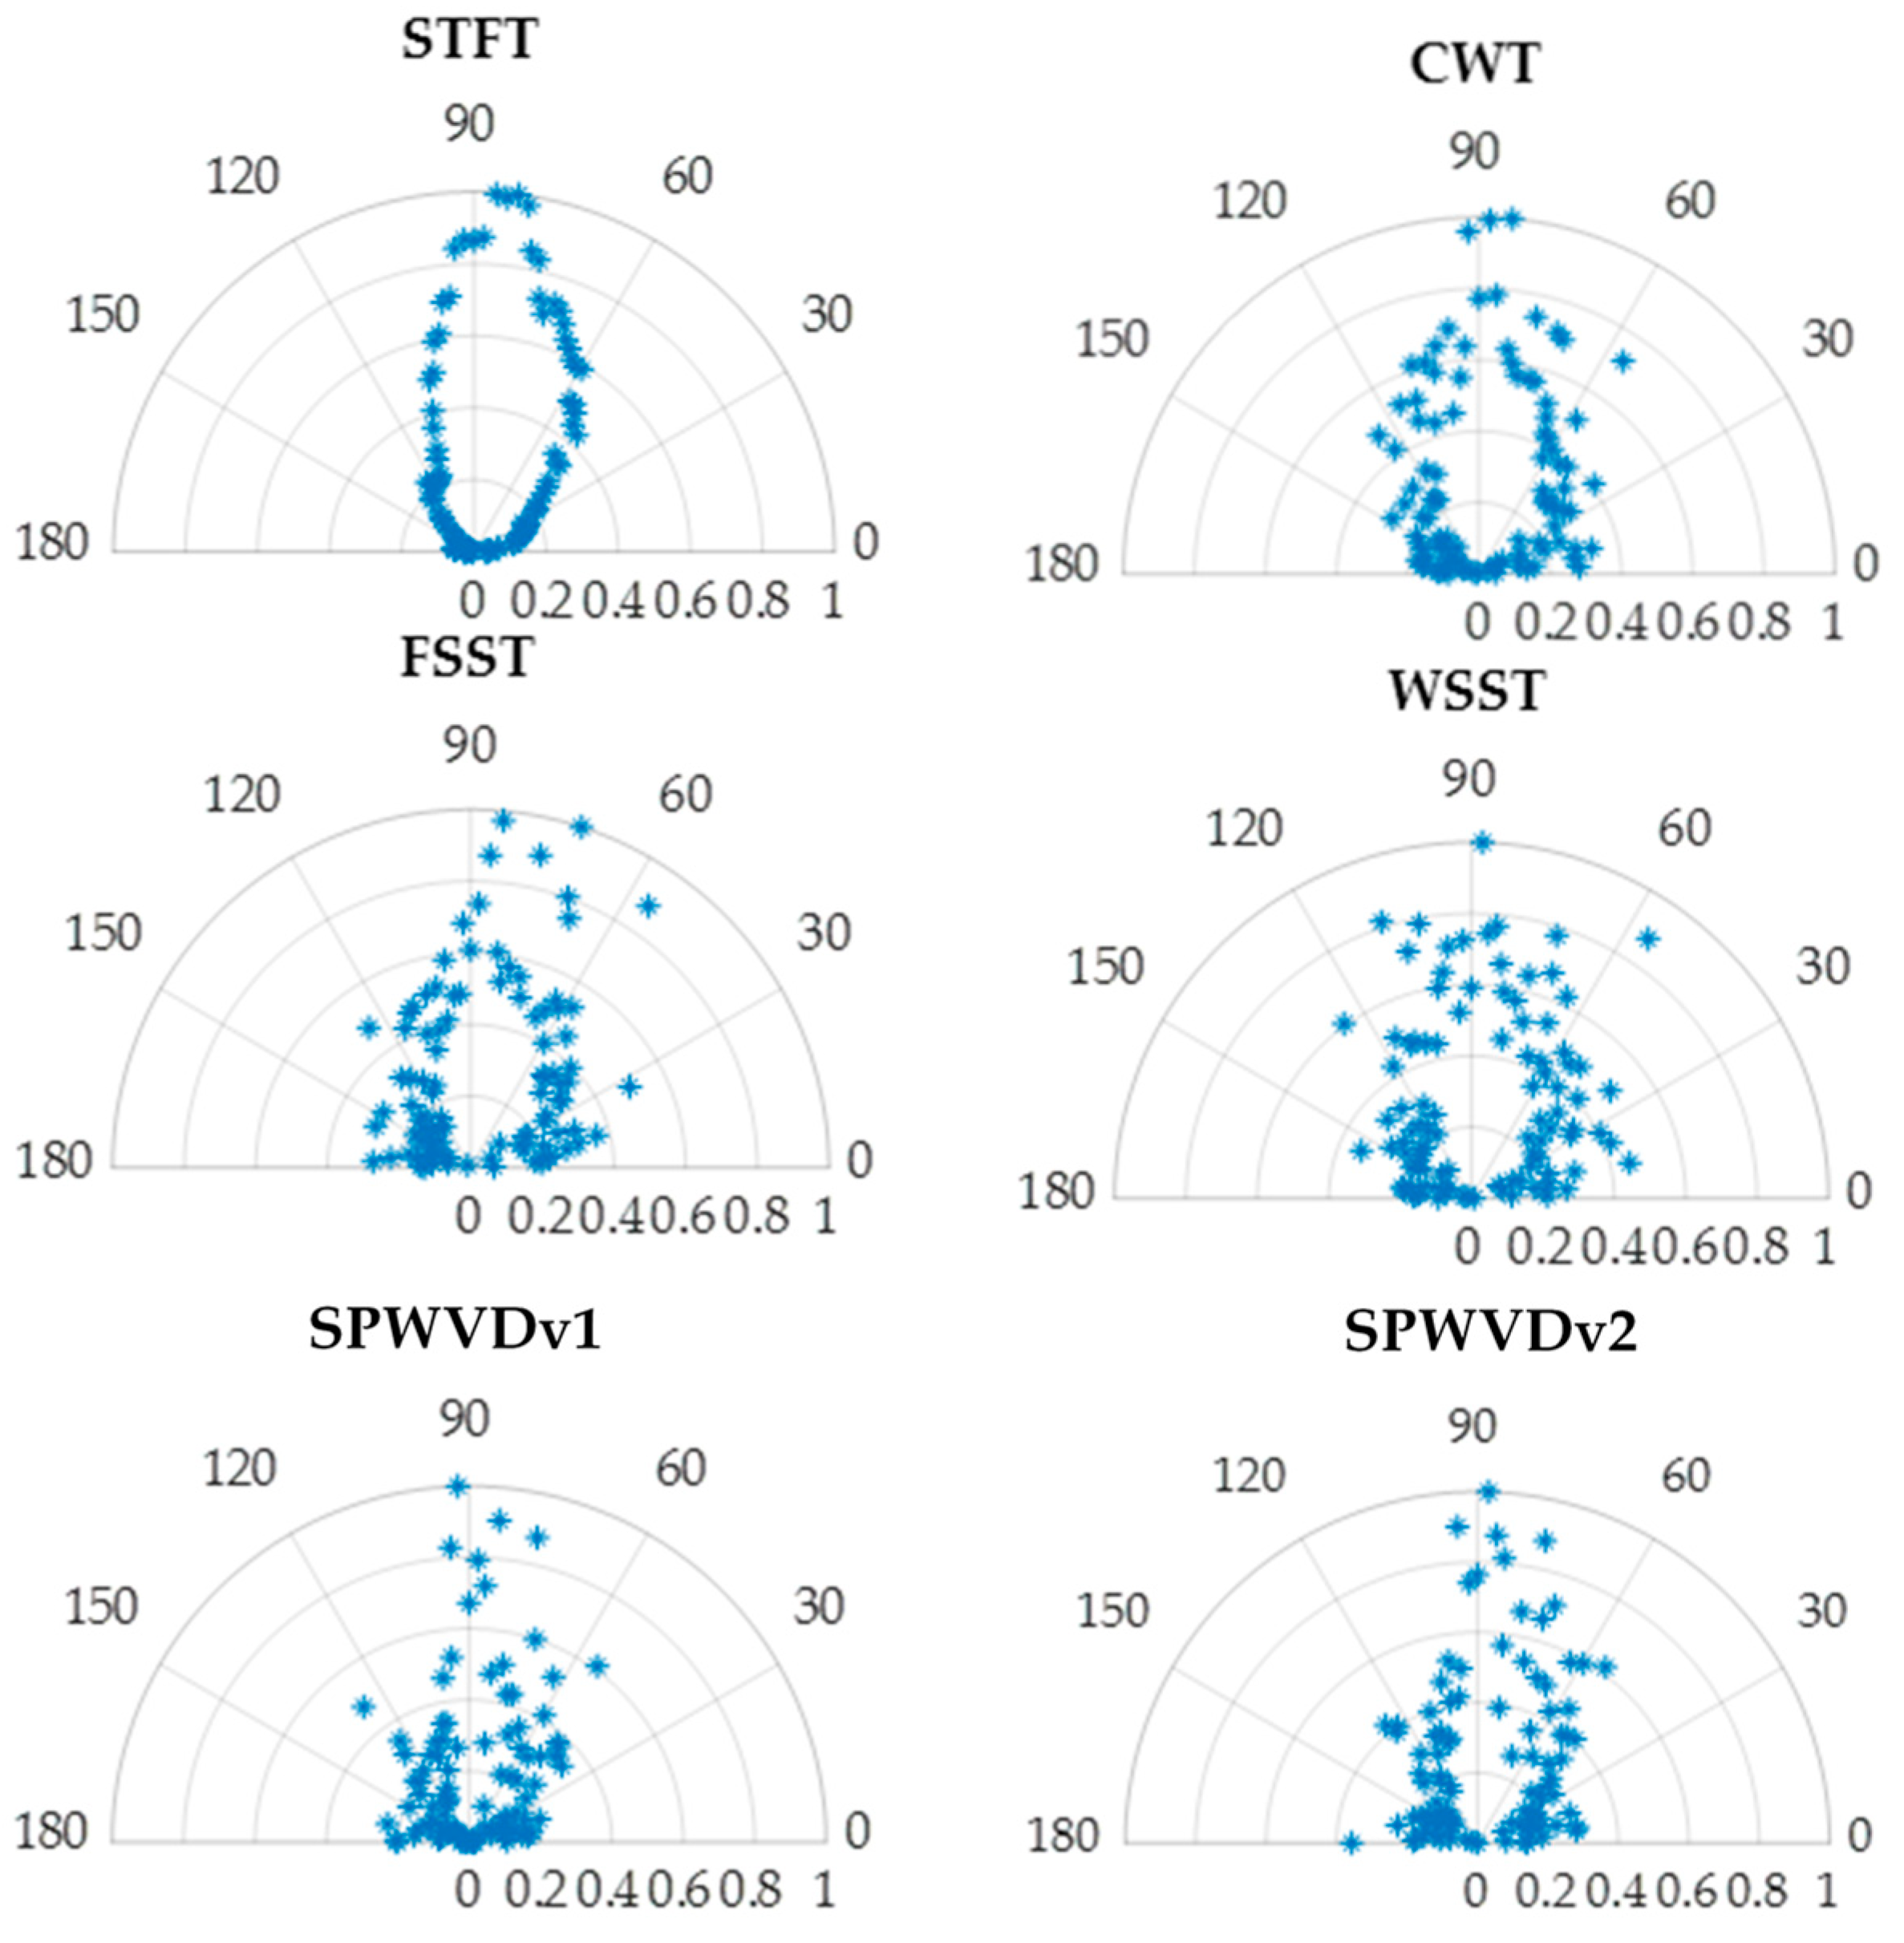
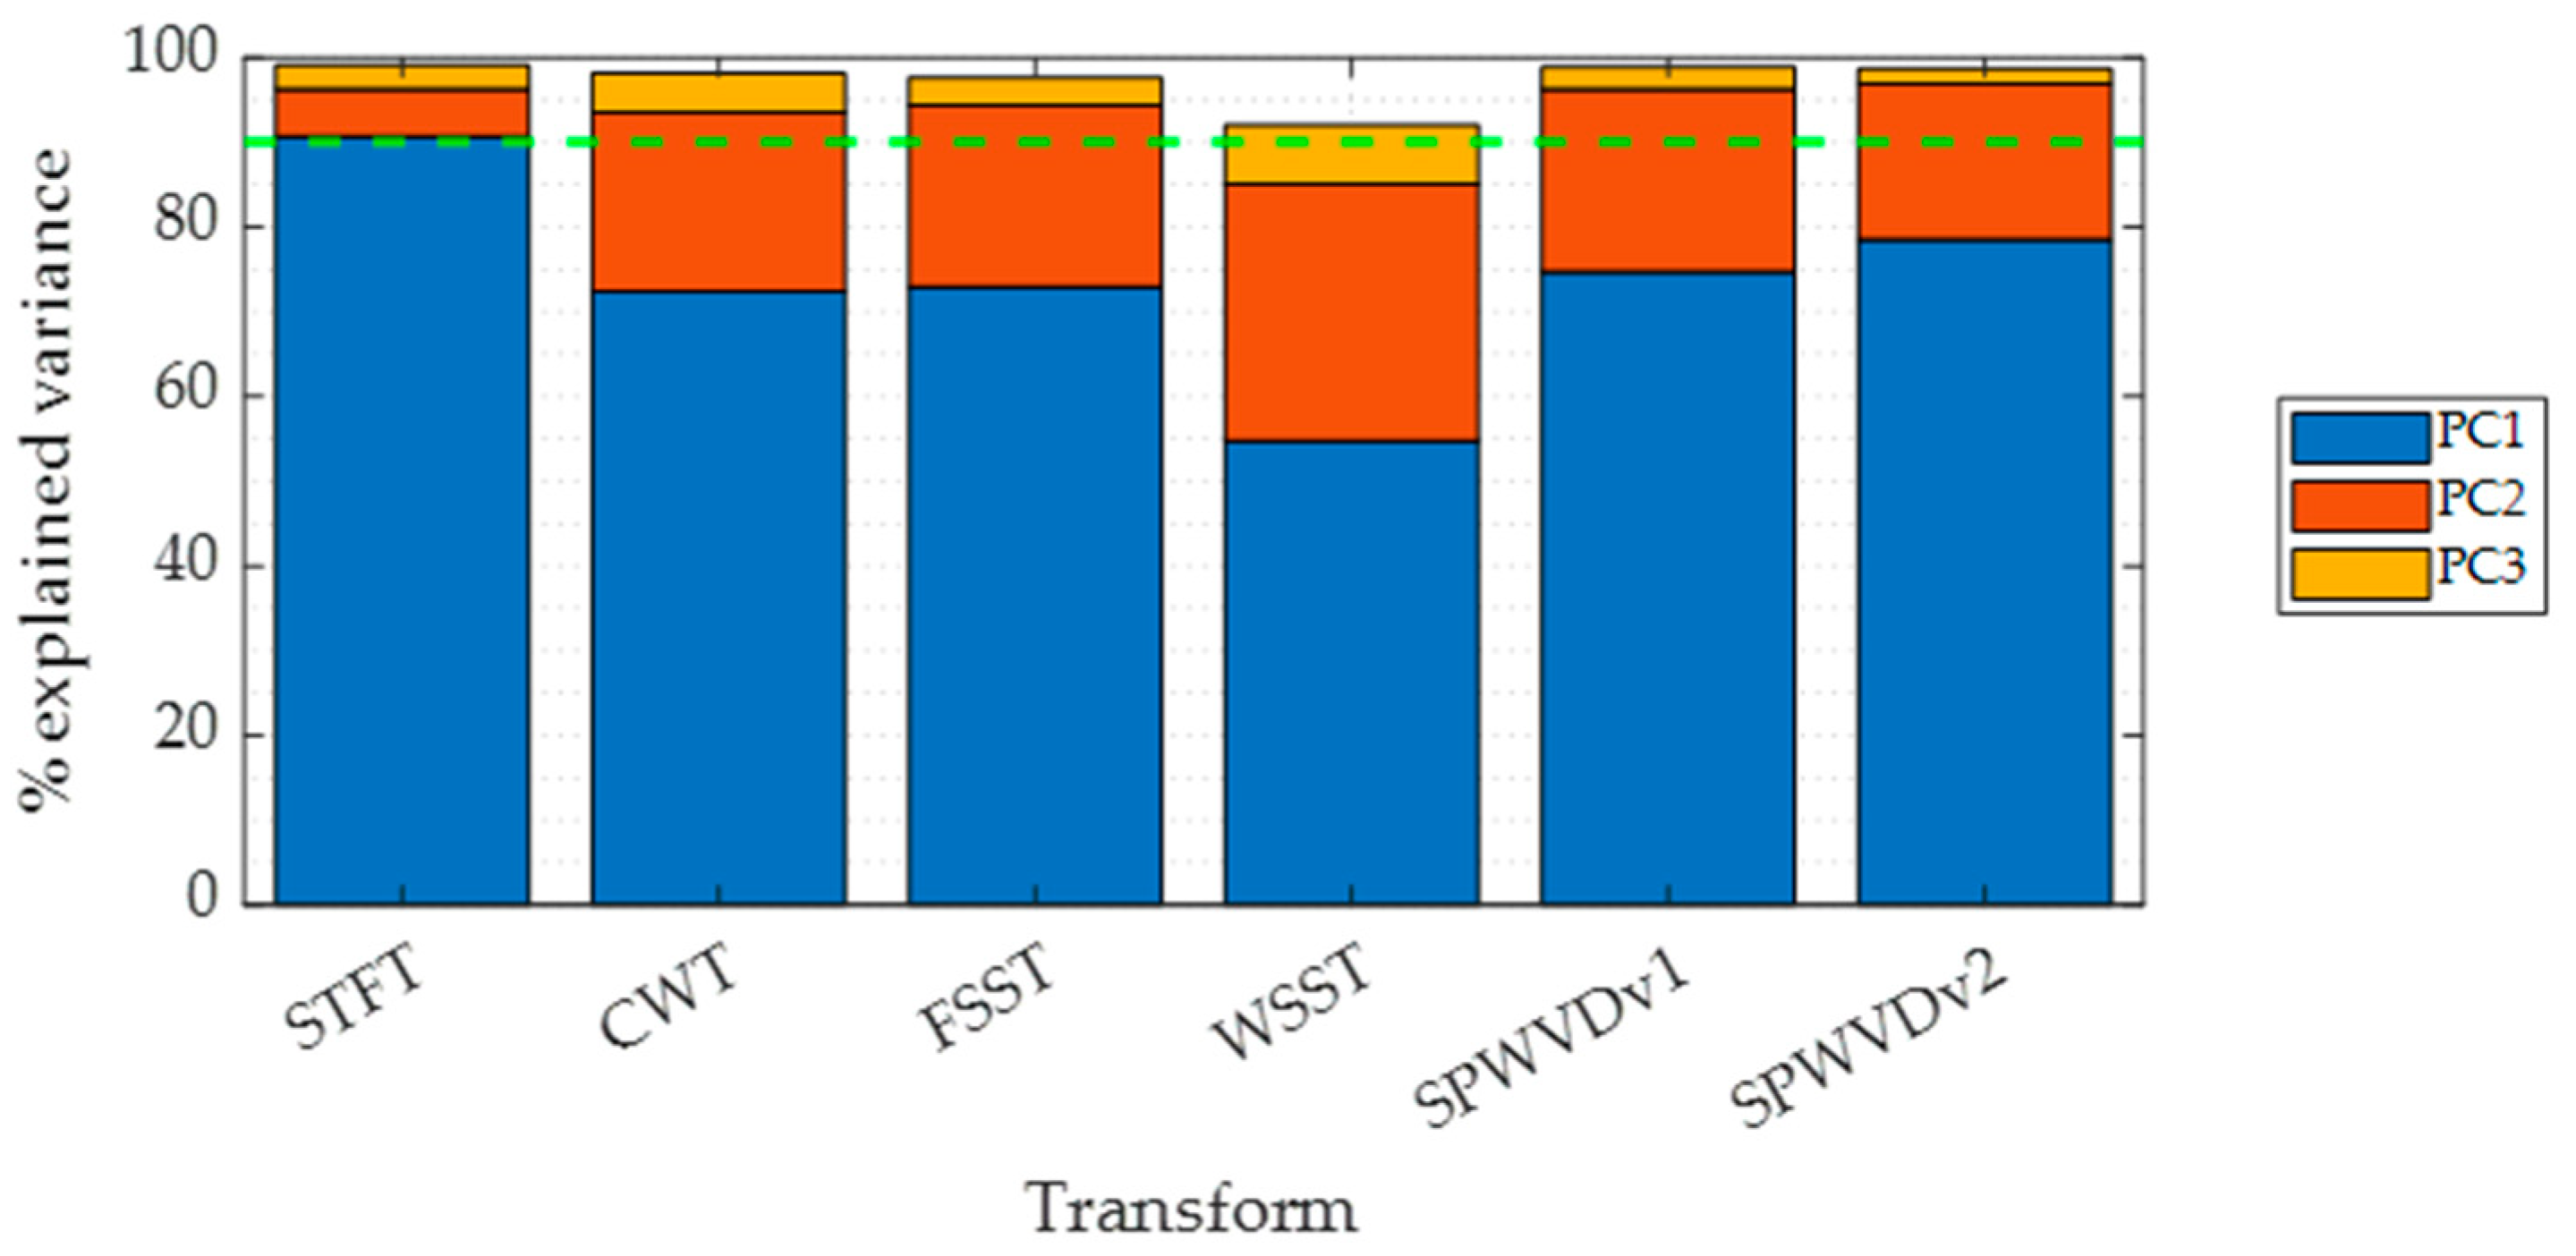
Due to the different mathematical foundations of the analyzed transformations, the information about the studied material (after the transformation) may ultimately be expressed in a different way in the given TF distribution. In consequence, it reflects in different properties of the TFR for a subsequent processing method. Therefore, one or two parameters describing the properties of these representation (e.g., relating to statistical parameters) may not be able to provide complete information about the observed properties changes. In such a situation, the need of using one of the methods of the Exploratory Data Analysis (EDA) is arising. The Principial Component Analysis (PCA) is one of such a method that enables the assessment of information variability in the entire database. Therefore, it was applied to evaluate the variance of vector, consisting of multiple TF parameters values gathered within the entire range of analyzed cases. The PCA leads to the linear transformation of the dataset so that the most variability of the input vector is presented in the new vector by fewer of its features called principal components pc (being a linear combination of the original parameters). In this case, the PCA analysis provides data on how the information is distributed over the new parameters (pcs) vector. As a result, the greatest variability is provided by the first component, and the higher the index number of the pc, the lower rate of variability it explains. Several results can be expected when using this data analysis method. If most of the data variance is expressed with the first or a few first principal components, then there is a large correlation between the parameters inside a vector. In the second case, when a high variability rate is reached under the term of several first principal components, then this may refer to the situation in which each of the underlying features provides unique information. However, on the other hand, it may also be the result of a case where the parameters are correlated, although they are supplemented by the interfering components that add variability to the input TF parameters vector. During the analysis, eleven TF parameters were taken into account, such as skewness, standard deviation, power density and entropy of the TFR (according to [19]). In Figure 7, the first principal component for each of the transformations is presented. The total variance of data within the parameters vector is shown in Figure 8.
As it can be seen, the linear combination of parameters composing the first principal component for the STFT explain more than 90% of the variation. The rest of the transformation does not reach the level of 80% explained by the first pc. The worst transformation in this case is the WSST. In reference to the given results, in the case of transformations other than the STFT, the convergence rate of information gathered in the TFR is lower. This, in the context of the obtained distributions for individual parameters, can be explained by the lower level of readability of the useful information about the tested material (see the characteristic curves with local parameter deviations presented in Figure 5). Additionally, by looking at the first component, it can be noticed that there is a lot of noisy information. The high rate of variation expressed by the first pc obtained for the STFT also proves the high robustness of this transformation to disturbing factors, hindering the ability to read the correct information about the tested material.

4. Discussion

As it can be seen from the above comparative analysis of different TF transformations performed for grain-oriented electrical steel sheets, the best information robustness is achieved for the STFT. The TFR obtained for the WSST could be rejected after the qualitative assessment. Although its TF parameters’ angular distributions show that it may also carry useful information about the material anisotropy, as in the case of the BNTF_Mean parameter, the obtained r2 value in relation to the CWT decreases only by 0.73%. The very low value of the coefficient of determination achieved for SPWVDv1 is due to the set limitation bands to the frequency and time resolution. However, this transform provided almost unlimited resolutions; therefore, by releasing the limits in the case of SPWVDv2, it was possible to reach significant improvement in the performance. Simultaneously, it must be noted that this transformation results in an increase in the required computational time by 19.85%. This can significantly limit the possibility of the implementation of the SPWVD-based procedures in inspection systems utilizing SBC. Additionally, the wider analysis of the information variability contained in the analyzed TFRs using PCA confirms the validity of the STFT. For this transformation, over 90% of the variability is already contained in the first principal component, which proves the high convergence and robustness of information. No other transformation achieves this level of results.
To summarize, based on the obtained results, it can be concluded that the STFT transformation, although it is dedicated to the analysis of periodic signals, enables a good representation of the properties of the MBN signals, which are stochastic in nature. At the same time, this transformation method is relatively simple to implement. All these aspects make its application for the analysis of the course of the Barkhausen phenomenon very promising. The transformation of the SPWVD also offers great opportunities, but nevertheless, there has been no significant gain in the quality of the information provided in this case. At the same time, a significant increase in computational effort has been noticed, which may be a problem in the case of real implementation. In the future, the authors will continue their work on the use of time-frequency analysis for the purpose of obtaining information about the course of the MBN phenomenon.

Author Contributions

Conceptualization, G.P.; data curation, M.M.; formal analysis, M.M.; investigation, M.M.; methodology, M.M. and G.P.; resources, M.M.; software, M.M.; supervision, G.P.; validation, G.P.; visualization, M.M.; writing—original draft, M.M. and G.P.; writing—review and editing, M.M. and G.P. All authors have read and agreed to the published version of the manuscript.

Funding

The APC was funded by Research Funds of the Faculty of Electrical Engineering of West Pomeranian University of Technology, Szczecin, Poland.

Institutional Review Board Statement

Not applicable.

Informed Consent Statement

Not applicable.

Data Availability Statement

Not applicable.

Conflicts of Interest

The authors declare no conflict of interest.

References

  1. Shilling, J.; Houze, G. Magnetic Properties and Domain Structure in Grain-Oriented 3% Si-Fe. IEEE Trans. Magn. 1974, 10, 195–223. [Google Scholar] [CrossRef]
  2. Jiles, D. Introduction to Magnetism and Magnetic Materials, 3rd ed.; CRC Press: Boca Raton, FL, USA, 2016; ISBN 978-1-4822-3887-7. [Google Scholar]
  3. Cullity, B.D.; Graham, C.D. Introduction to Magnetic Materials, 2nd ed.; IEEE: Piscataway Township, NJ, USA; Wiley: Hoboken, NJ, USA, 2009; ISBN 978-0-471-47741-9. [Google Scholar]
  4. Roskosz, M.; Fryczowski, K.; Tuz, L.; Wu, J.; Schabowicz, K.; Logoń, D. Analysis of the Possibility of Plastic Deformation Characterisation in X2CrNi18-9 Steel Using Measurements of Electromagnetic Parameters. Materials 2021, 14, 2904. [Google Scholar] [CrossRef] [PubMed]
  5. Gao, R.X.; Yan, R. Wavelets: Theory and Applications for Manufacturing; Springer: New York, NY, USA, 2011; ISBN 978-1-4419-1544-3. [Google Scholar]
  6. Oberlin, T.; Meignen, S.; Perrier, V. The Fourier-Based Synchrosqueezing Transform. In Proceedings of the 2014 IEEE International Conference on Acoustics, Speech and Signal Processing (ICASSP), Florence, Italy, 4–9 May 2014; pp. 315–319. [Google Scholar]
  7. Meignen, S.; Oberlin, T.; Pham, D.-H. Synchrosqueezing Transforms: From Low- to High-Frequency Modulations and Perspectives. Comptes Rendus Phys. 2019, 20, 449–460. [Google Scholar] [CrossRef]
  8. Daubechies, I.; Lu, J.; Wu, H.-T. Synchrosqueezed Wavelet Transforms: An Empirical Mode Decomposition-like Tool. Appl. Comput. Harmon. Anal. 2011, 30, 243–261. [Google Scholar] [CrossRef] [Green Version]
  9. Debnath, L. Wavelet Transforms and Their Applications; Birkhäuser Boston: Boston, MA, USA, 2002; ISBN 978-1-4612-6610-5. [Google Scholar]
  10. Taebi, A.; Mansy, H.A. Analysis of Seismocardiographic Signals Using Polynomial Chirplet Transform and Smoothed Pseudo Wigner-Ville Distribution. In Proceedings of the 2017 IEEE Signal Processing in Medicine and Biology Symposium (SPMB), Philadelphia, PA, USA, 2 December 2017; pp. 1–6. [Google Scholar]
  11. Boashash, B.; Ouelha, S. Automatic Signal Abnormality Detection Using Time-Frequency Features and Machine Learning: A Newborn EEG Seizure Case Study. Knowl. Based Syst. 2016, 106, 38–50. [Google Scholar] [CrossRef]
  12. Boczar, T.; Zmarzły, D.; Kozioł, M.; Wotzka, D. The Application of Time-Frequency Ridge Transformation for the Analysis of Infrasound Signals Generated by Wind Turbines. Appl. Acoust. 2021, 177, 107961. [Google Scholar] [CrossRef]
  13. Herrera, R.H.; Han, J. Van Der Baan, M. Applications of the Synchrosqueezing Transform in Seismic Time-Frequency Analysis. Geophysics 2014, 79, V55–V64. [Google Scholar] [CrossRef]
  14. Gholtashi, S.; Siahsar, M.A.N.; Kahoo, A.R.; Marvi, H.; Ahmadifard, A. Synchrosqueezing-Based Transform and Its Application in Seismic Data Analysis. Iran. J. Oil Gas Sci. Technol. 2015, 4, 14. [Google Scholar]
  15. Wiciak, P.; Cascante, G.; Polak, M.A. Novel Application of Wavelet Synchrosqueezed Transform (WSST) in Laser-Vibrometer Measurements for Condition Assessment of Cementitious Materials. NDT E Int. 2021, 120, 102424. [Google Scholar] [CrossRef]
  16. Mostafa, N.; Loendersloot, R.; Maio, D.D.; Tinga, T. Application of Wavelet Synchro-Squeezed Transform (WSST) Method to Railway Bridge Health Monitoring. In Proceedings of the EURODYN 2020—XI International Conference on Structural Dynamics: Proceedings, Athens, Grace, 23–26 November 2020; pp. 1388–1396. [Google Scholar]
  17. Fryczowski, K.; Roskosz, M. Metody ilościowej analizy szumu napięciowego Barkhausena. Weld. Technol. Rev. 2016, 88. [Google Scholar] [CrossRef] [Green Version]
  18. Padovese, L.; Martin, N.; Millioz, F. Time-Frequency and Time-Scale Analysis of Barkhausen Noise Signals. Proc. Inst. Mech. Eng. Part G J. Aerosp. Eng. 2009, 223, 577–588. [Google Scholar] [CrossRef] [Green Version]
  19. Maciusowicz, M.; Psuj, G. Use of Time-Dependent Multispectral Representation of Magnetic Barkhausen Noise Signals for the Needs of Non-Destructive Evaluation of Steel Materials. Sensors 2019, 19, 1443. [Google Scholar] [CrossRef] [PubMed] [Green Version]
  20. Maciusowicz, M.; Psuj, G. Time-Frequency Analysis of Barkhausen Noise for the Needs of Anisotropy Evaluation of Grain-Oriented Steels. Sensors 2020, 20, 768. [Google Scholar] [CrossRef] [Green Version]
  21. Maciusowicz, M.; Psuj, G. Use of Time-Frequency Representation of Magnetic Barkhausen Noise for Evaluation of Easy Magnetization Axis of Grain-Oriented Steel. Materials 2020, 13, 3390. [Google Scholar] [CrossRef] [PubMed]
  22. Miesowicz, K.; Staszewski, W.J.; Korbiel, T. Analysis of Barkhausen Noise Using Wavelet-Based Fractal Signal Processing for Fatigue Crack Detection. Int. J. Fatigue 2016, 83, 109–116. [Google Scholar] [CrossRef]
  23. Maass, P.; Teschke, G.; Willmann, W.; Wollmann, G. Detection and Classification of Material Attributes-a Practical Application of Wavelet Analysis. IEEE Trans. Signal Process. 2000, 48, 2432–2438. [Google Scholar] [CrossRef]
  24. Kownacki, C. Wavelet Analysis of Barkhausen Noise in Reconstructing Distributions of Residual Stress. Available online: https://www.scientific.net/SSP.144.112 (accessed on 29 March 2019).
  25. De Campos, M.F.; Campos, M.A.; Landgraf, F.J.G.; Padovese, L.R. Anisotropy Study of Grain Oriented Steels with Magnetic Barkhausen Noise. J. Phys. Conf. Ser. 2011, 303, 012020. [Google Scholar] [CrossRef]
  26. Espina-Hernández, J.H.; Pérez-Benítez, J.A.; Caleyo, F.; Baudin, T.; Helbert, A.L.; Hallen, J.M. Barkhausen Noise Measurements Give Direct Observation of Magnetocrystalline Anisotropy Energy in Ferromagnetic Polycrystals. J. Phys. D Appl. Phys. 2013, 46, 392001. [Google Scholar] [CrossRef]
  27. Pérez-Benítez, J.A.; Espina-Hernández, J.H.; Man, T.L.; Caleyo, F.; Hallen, J.M. Identification of Different Processes in Magnetization Dynamics of API Steels Using Magnetic Barkhausen Noise. J. Phys. D Appl. Phys. 2015, 48, 295002. [Google Scholar] [CrossRef]
  28. Łopato, P.; Psuj, G.; Herbko, M.; Maciusowicz, M. Evaluation of Stress in Steel Structures Using Electromagnetic Methods Based on Utilization of Microstrip Antenna Sensor and Monitoring of AC Magnetization Process. Informatyka Automatyka, Pomiary Gospodarce Ochronie Środowiska 2016, 6, 32–36. [Google Scholar] [CrossRef]
  29. Boashash, B. Time-Frequency Signal Analysis and Processing—A Comprehensive Reference, 2ed ed.; Elsevier: Amsterdam, The Netherlands, 2016; ISBN 978-0-12-398499-9. [Google Scholar]
  30. Zieliński, T.P. Cyfrowe Przetwarzanie Sygnałów; Wydawnictwa Komunikacji i Łączności sp. z o.o.: Warszawa, Poland, 2014; ISBN 978-83-206-1640-8. [Google Scholar]
  31. Scholl, S. Fourier, Gabor, Morlet or Wigner: Comparison of Time-Frequency Transforms. arXiv 2021, arXiv:2101.06707 [eess]. [Google Scholar]
  32. Sandsten, M. Time-Frequency Analysis of Time-Varying Signals and Non-Stationary Processes, an Introduction; Lund University: Lund, Sweden, 2018. [Google Scholar]
  33. Szmajda, M.; Górecki, K.; Mroczka, J. Gabor transform, spwvd, gabor-wigner transform and wavelet transform—Tools for power quality monitoring. Metrol. Meas. Syst. 2010, 17, 383–396. [Google Scholar] [CrossRef] [Green Version]
  34. Pérez-Benitez, J.A.; Padovese, L.R.; Capó-Sánchez, J.; Anglada-Rivera, J. Investigation of the Magnetic Barkhausen Noise Using Elementary Signals Parameters in 1000 Commercial Steel. J. Magn. Magn. Mater. 2003, 263, 72–77. [Google Scholar] [CrossRef]
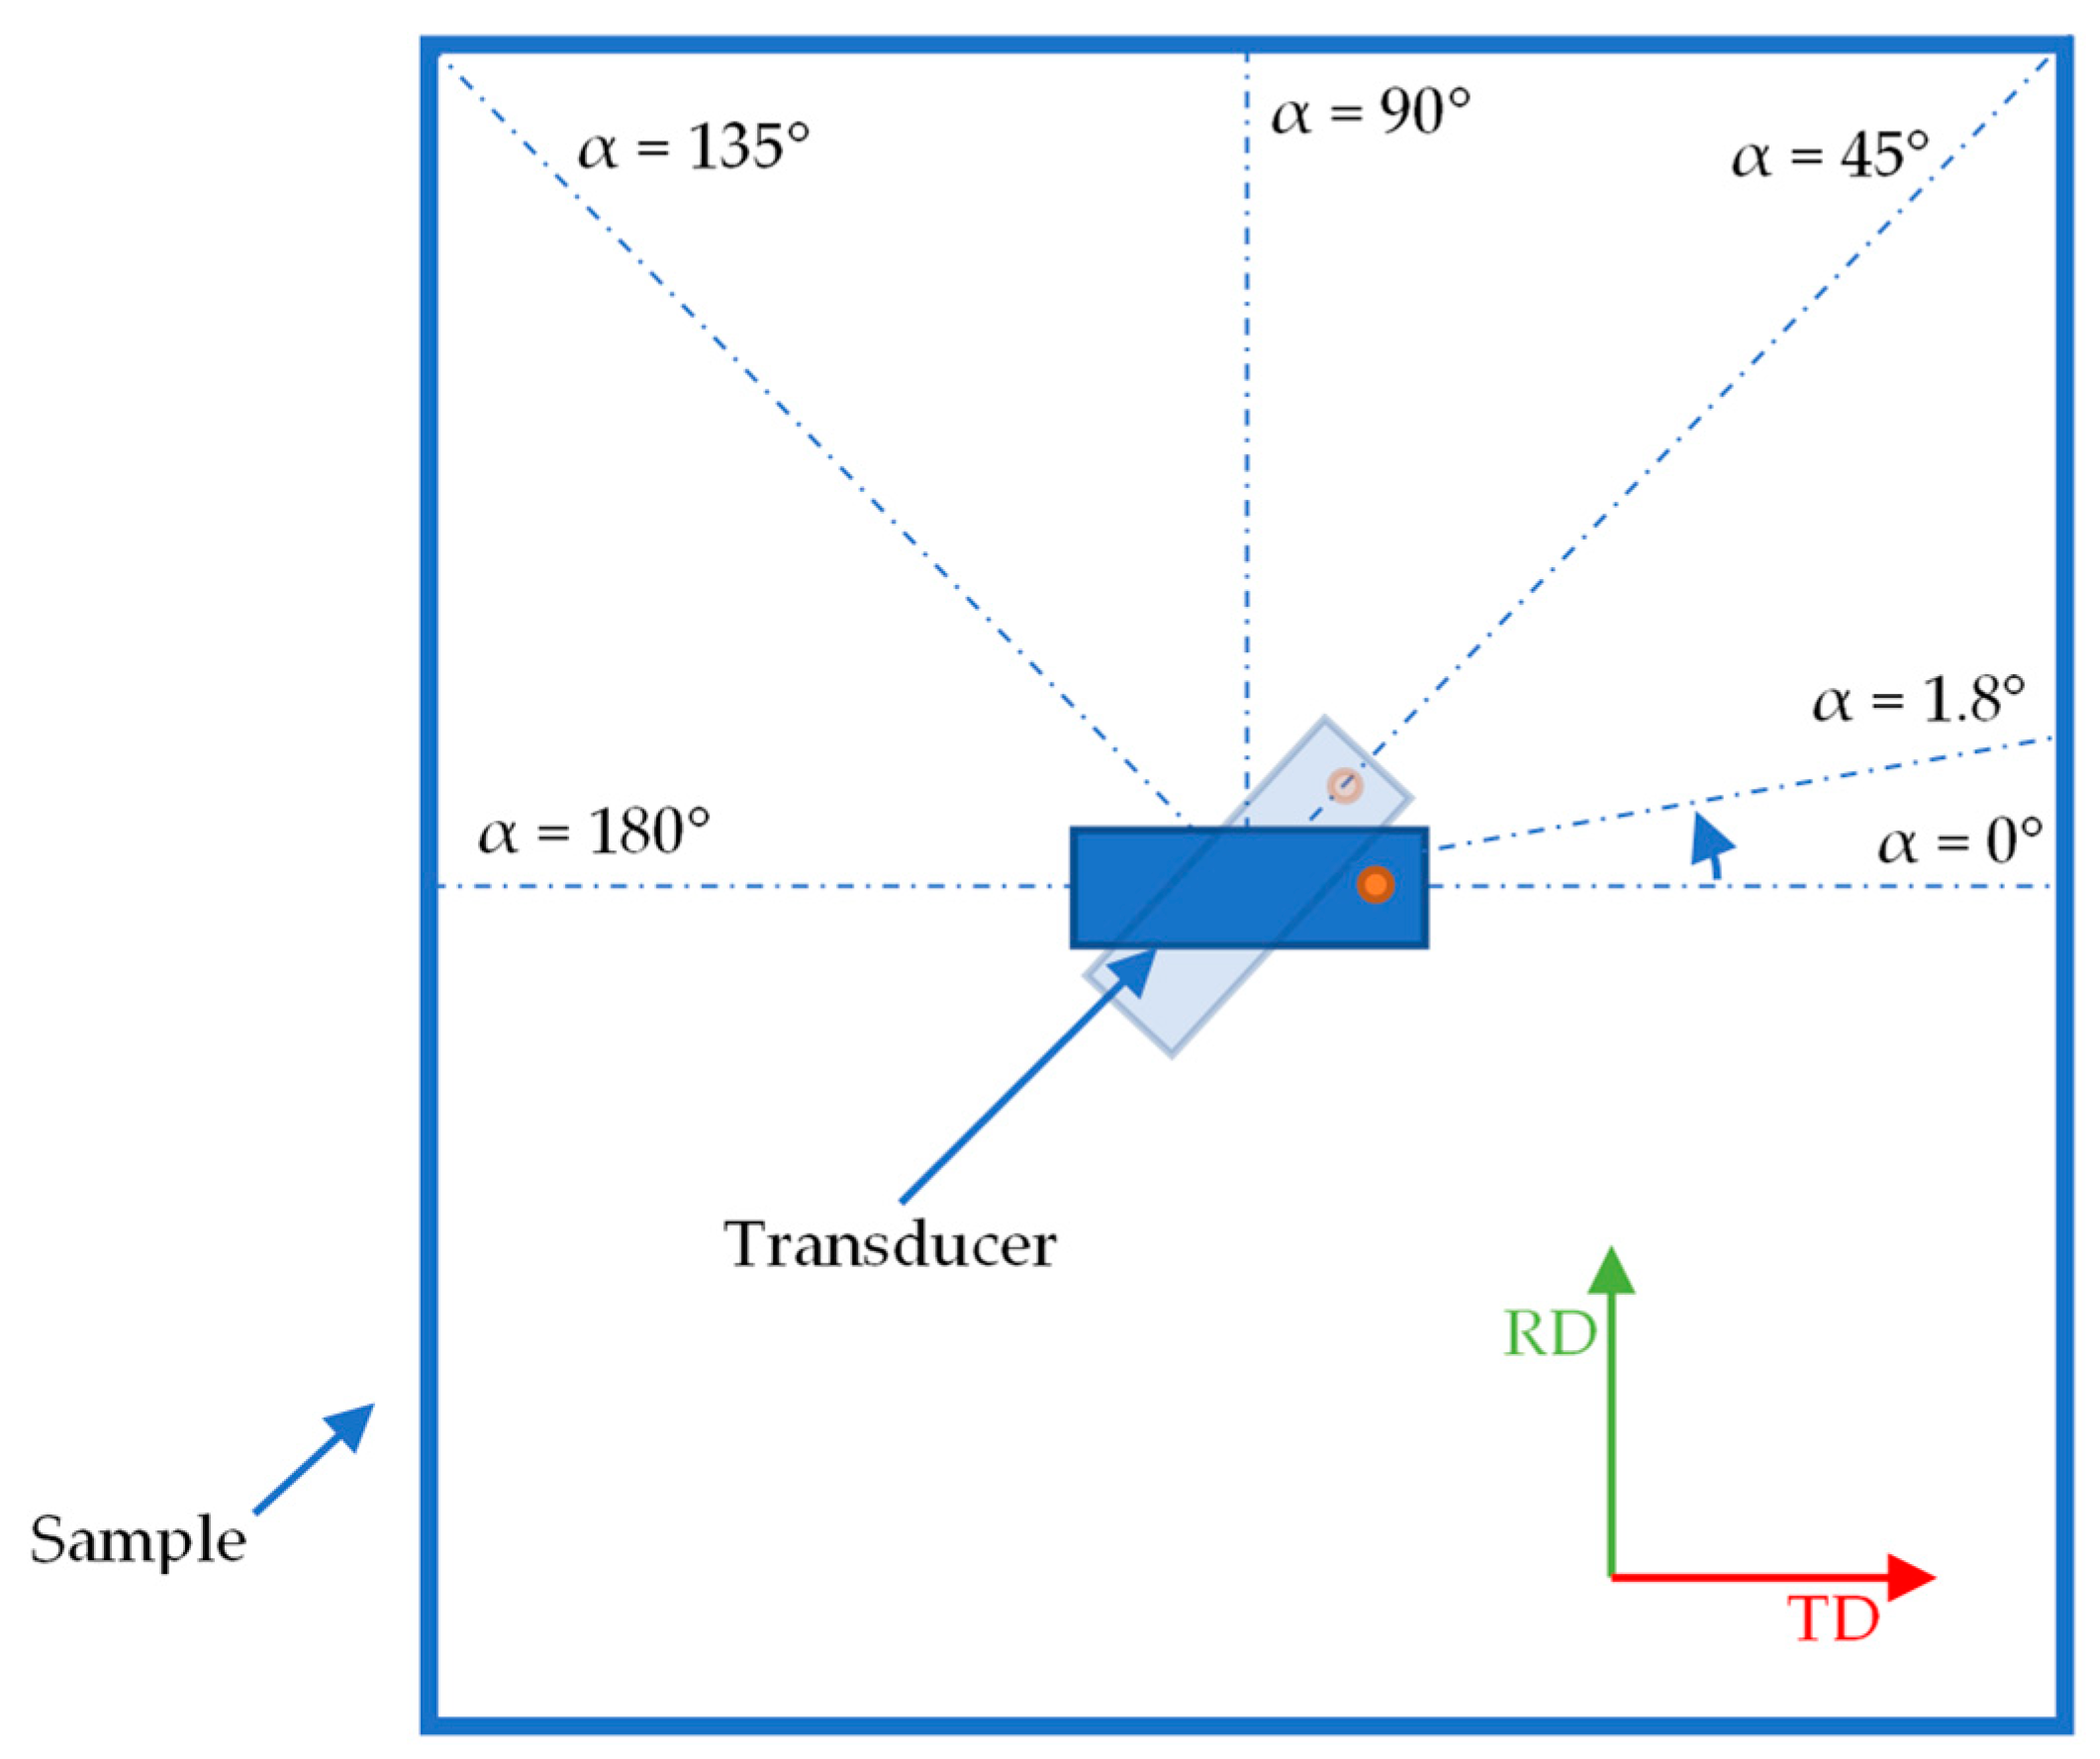
Figure 1. Diagram which illustrates: the sample, transducer, and depicts the direction of rotation, direction of the rolling axis (RD) and transvers direction (TD—it is perpendicular to the rolling axis).
Applsci 11 06193 g001
Figure 2. Exemplary UBN burst and magnetizing current course Ie.
Applsci 11 06193 g002
Figure 3. Calculation procedure.
Applsci 11 06193 g003
Figure 4. Spectrograms obtained on the basis of considered transformations: (a) STFT (b) CWT (c) FSST (d) WSST (e) SPWVDv1 (f) SPWVDv2.
Applsci 11 06193 g004
Figure 5. Plot of BNTF_CM and BNTF_MEAN parameters with approximation; RD—rolling direction, TD—transverse direction.
Applsci 11 06193 g005
Figure 6. Result of the r2 coefficient for BNTF_CM and BNTF_MEAN parameters.
Applsci 11 06193 g006
Figure 7. First principal component for each of the transformations.
Applsci 11 06193 g007
Figure 8. Explanation of variability by first three principal components for each transformation. The green horizontal line marks the 90% level of variability in dataset.
Applsci 11 06193 g008
Table 1. Steel parameters.
Steel Parameters
Length/Width150 mm
Thickness0.23 mm
Lossiness1.10 W/kg
Induction1.80 T
Table 2. Absolute computational times of each considered transformations for single MBN burst.
TransformationTime (s)
STFT0.005556
Wavelet0.073326
FSST0.507287
WSST0.634261
SPWVDv10.175987
SPWVDv20.219765
Table 3. Computer components configuration utilized in the computational process.
ComponentModel
CPUAMD Ryzen 7 1800X Eight-Core 3.60 Hz
RAM32 GB 2900 MHz
GPUGeForce GTX 1660 6 GB
HDDADATA XPG SX 8200PNP M.2
Table 4. Definition of analyzed parameters ( B N TF _ S i , j is a matrix from the parameters where calculated).
FeatureFormula
Concentration Measure B N TF _ CM = ( i = 1 N j = 1 M | B N TF _ S i , j | 1 p ) p (6)
Mean B N TF _ MEAN = 1 N M i = 1 N j = 1 M B N TF _ S i , j (7)
Coefficient of determination r 2 = 1 i = 1 n ( y i y ^ i )   2 i = 1 n ( y i y ) ¯ 2 (8)
Publisher’s Note: MDPI stays neutral with regard to jurisdictional claims in published maps and institutional affiliations.