Abstract
Additive manufacturing processes offer high geometric flexibility and allow the use of new alloy concepts due to high cooling rates. For each new material, parameter studies have to be performed to find process parameters that minimize microstructural defects such as pores or cracks. In this paper, we present a system developed in Python for accelerated image analysis of optical microscopy images. Batch processing can be used to quickly analyze large image sets with respect to pore size distribution, defect type, contribution of defect type to total porosity, and shape accuracy of printed samples. The open-source software is independent of the microscope used and is freely available for use. This framework allows us to perform such an analysis on a circular area with a diameter of 5 mm within 10 s, allowing detailed process maps to be obtained for new materials within minutes after preparation.
1. Introduction
Additive manufacturing processes [1] build up a component through a continuous mass input. Typical processes are the FDM process (fused deposition modeling) [2], which is common for polymers, the LPBF process (laser powder bed fusion) [3] or the LMD process (laser metal deposition) [4]. All these processes have in common high geometric flexibility due to free-form modeling without a mold. In the field of additive processes for metals, potentials for new material concepts [5,6] arise from the use of the comparatively high cooling rates [7,8] in the range of 105–106 K/s for the LPBF process [9]. However, process parameters that minimize defects in the printed component [10] must be determined at great expense for each new material. The search for optimized and robust parameter sets [11,12] is a time-consuming process.
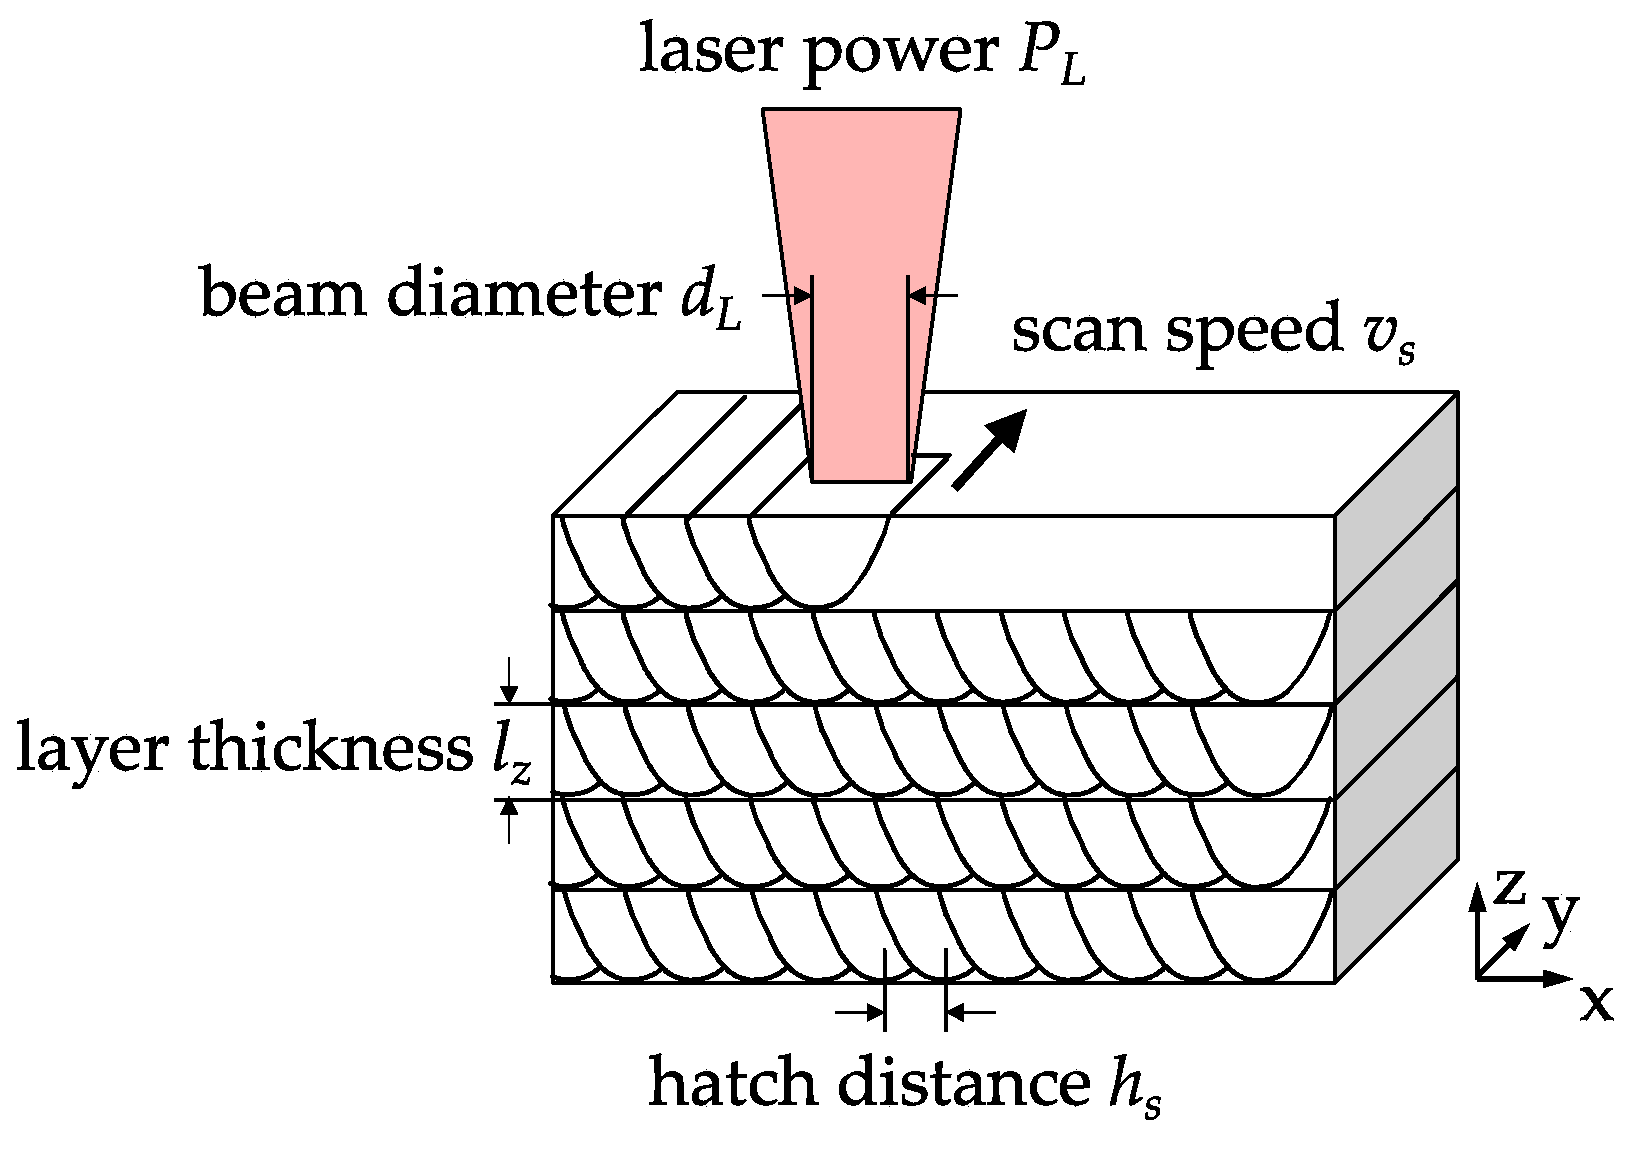
Defects in additive manufacturing [13] result, on the one hand, from the material properties and properties of the powder (e.g., bulk density, flowability, particle size) and, on the other hand, from the process conditions, with particular emphasis on the importance of thermal conditions [7]. While for a given material the material properties and the resulting solidification kinetics are fixed, the various parameters of typical LPBF systems offer a wide range of possible process conditions. Two essential parameters are the scan speed vS at which the laser moves over the powder bed and the laser power PL (Figure 1).

Figure 1.
LPBF (laser powder bed fusion) process schematic and main process parameters.
With the layer thickness lZ and the hatch distance hS, the volume energy density is obtained.
If the chosen volume energy density is too low, not all of the particles can be completely melted and irregular pores are formed [14], which often may still contain loose particles. If, on the other hand, a volume energy density that is too high is selected, strong evaporation of the material in the keyhole will occur. As a result of the high solidification rate, the gas formed cannot be released from the keyhole entirely and remains as spherical pores in the solidified material [8]. Cracks [15] typically occur due to stresses caused by high local temperature gradients, phase transformation or shrinkage. Minimizing such defects is of great importance since defects will decrease mechanical properties [16] or lead to material failure [17].
While the average porosity of a sample may be determined by the Archimedes method, a determination of the shape of porosity to determine its origin requires image-based methods [18]. These include two-dimensional methods such as classic metallography, or may also feature three-dimensional methods such as micro tomography [19]. While three-dimensional methods offer the possibility to analyze volumetrics, their resolution is still lower than classical light microscopy or electron microscopy. Light microscopy allows the determination of spatial distributions of porosity in a cross-section, making it a very versatile and automated tool. The detailed analysis of pore size distribution has been shown to be an important quality measure for additively manufactured parts [20].
While many studies search for the porosity minimum from a combinatorial variation of scan speed and laser power [11,21], this work includes the defect type and pore size distribution to find good processing conditions for the ferritic steel 410L. These analyses are based on our open source framework “PoreAnalyzer” that is easily adaptable for custom applications.
2. Experimental Design
An Aconity Mini LPBF machine was used to build an exemplary array with cylindrical samples (diameter: 4 mm, height: 15 mm, distance between samples: 3 mm) on a stainless steel substrate. Parameters were varied according for each cylinder. Powder of the ferritic steel X2CrNi12 (AISI 410L) was used to generate samples with different defect structures to demonstrate the method. The alloy composition is given in Table 1.

Table 1.
Chemical composition of X2CrNi12 used for experiments.
Laser power, scan speed and hatch distance were varied in a wide range to produce samples that contain different levels and types of defect in order to develop and demonstrate their morphological classification. Process parameter ranges are summarized in Table 2.
Table 2.
Process parameter ranges of LPBF experiments.
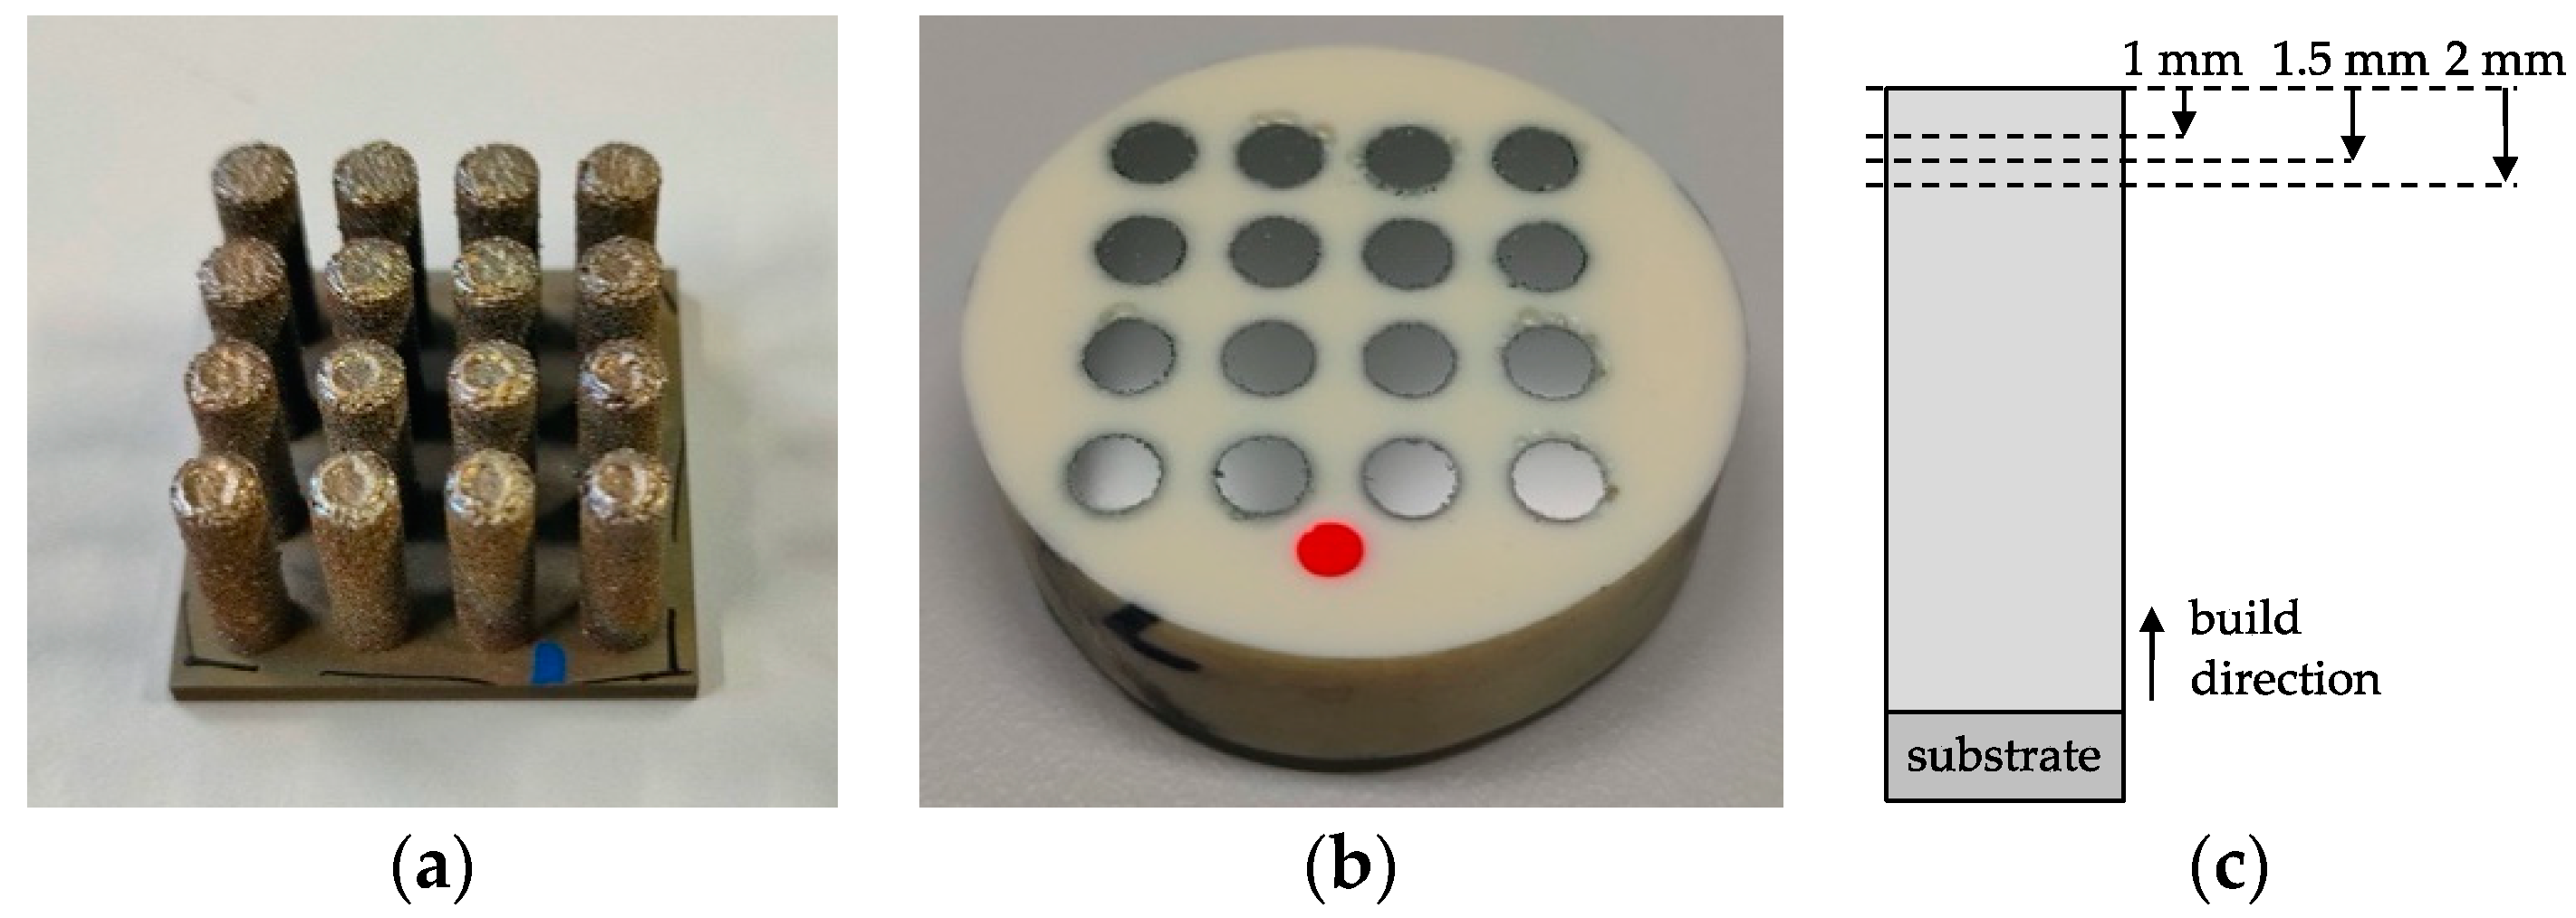
The whole sample arrays (Figure 2a) were embedded and metallographically prepared (Figure 2b). Grinding papers from P80–P1500 were used with subsequent polishing with a 3 µm and 1 µm polycrystalline diamond suspension. Images were taken 1 mm below the original sample top surface, then the samples were grinded and polished again to take two more images 0.5 mm and 1 mm below to obtain a larger dataset for each sample (Figure 2c).
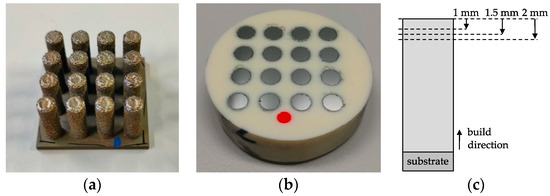
Figure 2.
Samples (diameter: 5 mm) (a) as-printed, (b) after preparation, (c) position of prepared sections.
Images of the whole samples were taken with a Zeiss AxioImager microscope with Zeiss ZenCore software at a 10× magnification (pixel size: 0.56 µm) in stitching mode.
3. Analysis Design
The analysis software was developed based on the free Python language with the Computer Vision Library [22] for image analysis methods. The samples were automatically detected and separated from the background for further analysis of the whole sample area.
First, a Gaussian filter was applied to the images to reduce noise. The images were then binarized, using the well-known Otsu algorithm [23] for thresholding. After binarization, image segmentation and morphological analysis of all detected defects was performed using the algorithms from the Computer Vision Library. The classification of defects was based on the defect circularity CD
with AD and PD being the area and perimeter of the defect, respectively. Another shape factor was the aspect ratio ARD derived from the ratio of the two semi axes of a fitted ellipse
with rmajor and rminor being the major and minor half axes. This approach was chosen since the classical elongation shape factor in the OpenCV-library does not allow the defect to be rotated at an arbitrary angle while the fitted-ellipse algorithm does.
Furthermore, the hierarchy of objects was determined. This allowed us to determine if there were objects located within another object.
Currently implemented defect classifications are summarized in Table 3. Unmelted particles are particles which can be found inside a defect. For classification they are assumed to be a pore with another object inside it. Gas pores are characterized by their high circularity of 95% or more. Cracks are elongated objects. A threshold of AR > 5 was set to characterize cracks. All other defects found in this study were irregular and are believed to be lack of fusion defects. However, defect types can be easily extended and their thresholds can be easily adjusted if necessary.
Table 3.
Currently implemented defect types.
For circular sample geometries, shape accuracy is determined based on the actual perimeter PC from image analysis in relation to the theoretical perimeter (Sample Diameter D). If the shape is irregular, PC will be much larger than Pth. This parameter is meant to help find optimized contour parameters for the LPBF process. This feature is implemented as well for rectangular geometries.
The total sample porosity is determined as the ratio of the total area of all defects and the total sample area:
The area of each defect is used to calculate its circle-equivalent diameter
These diameters are used to calculate the pore size distribution as a number distribution of diameter q0 and an area-weighted distribution of diameter q2 to emphasize the effect of pore size on the mechanical properties. Pre-defined size classes between the minimum and maximum diameters dmin and dmax, respectively are summarized in Table 4.
Table 4.
Size classes used for the calculation of the pore size distribution.
The median diameter d50 was calculated from both distributions as well as the characteristic values d10 and d90, which can be used to calculate the span:
of the pore size distribution. The maximum defect diameter is determined as well as a measure for the most critical pore regarding mechanical properties along with the feret diameter (longest length within defect) for every defect.
A morphological description of each sample, its defect type, size distributions and summarizing characteristic values are written in a CSV (comma-separated values) and JSON (JavaScript object notation) file along with sorted images of each defect for further analyses. Standard graphs for pore size distributions are generated.
4. Results
A binarized image of the sample array is shown in Figure 3a along with the parameters chosen for each sample. Figure 3b shows the average porosity for each sample. Porosities between 0.37% and 1.58% have been achieved. The highest porosity yields from the coldest processing conditions are given by the highest scan speed (1400 mm/s) and lowest laser power (285 W). Decreasing the scan speed from the highest porosity decreases porosity to a value of 0.37% at a scan speed of 950 mm/s. However, other combinations, such as (1250 mm/s, 330 W), may lead to a slightly increased porosity of 0.43%.
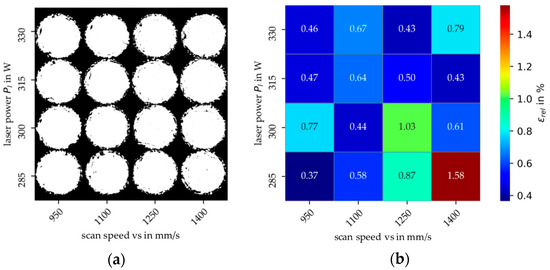
Figure 3.
(a) Binarized image of sample array, (b) relative porosity of samples.
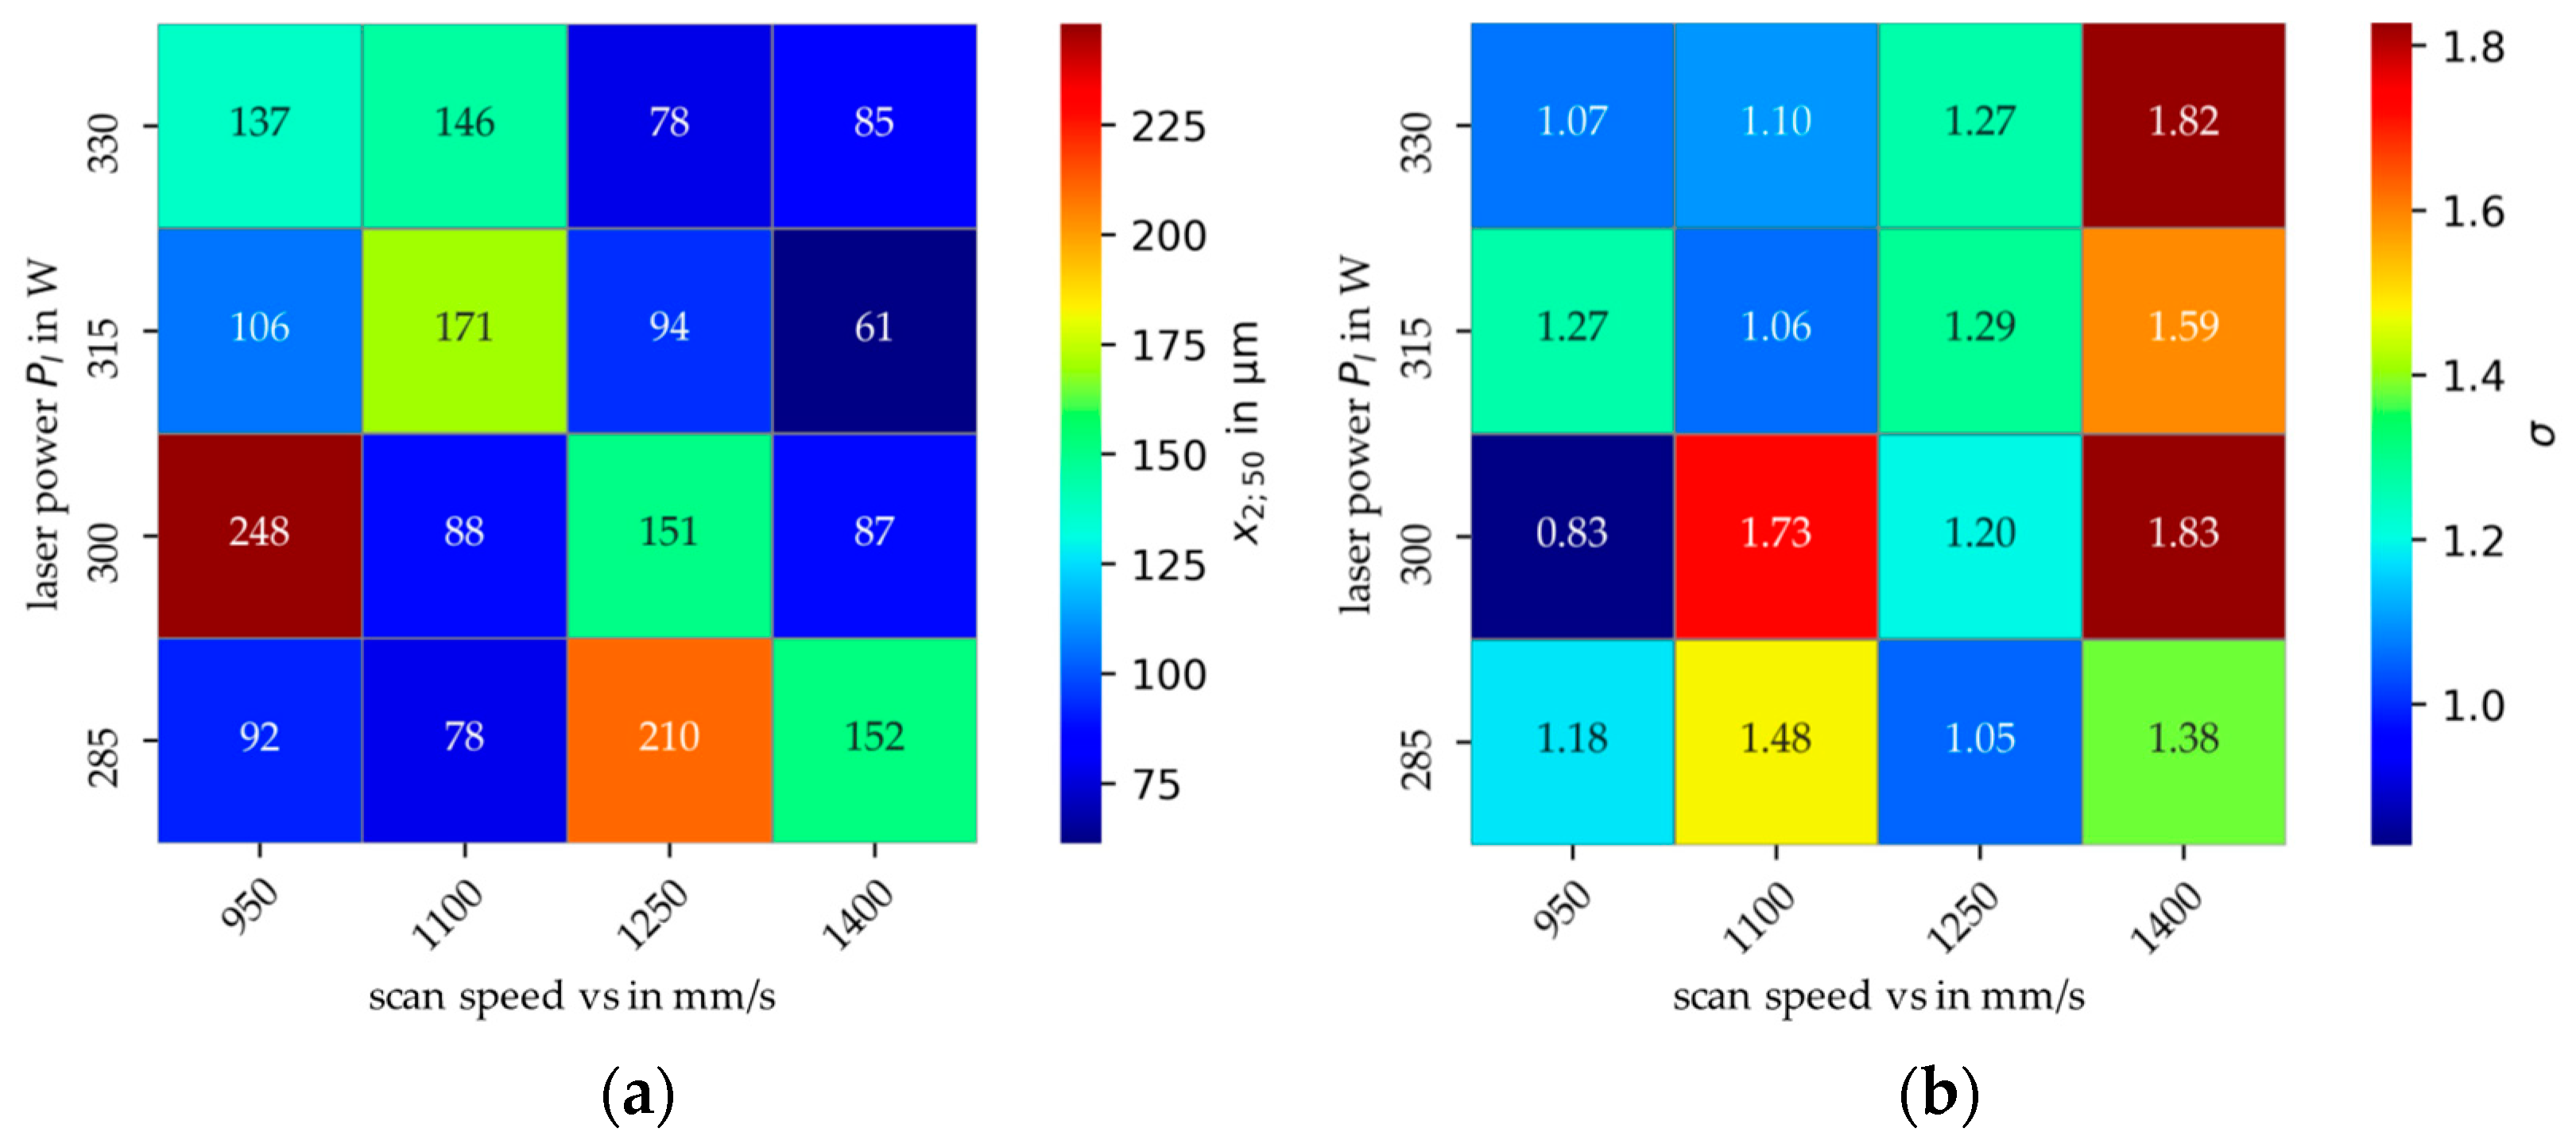
The mechanical properties of a component are weakened by defects. In addition to a low porosity, a small pore size is also to be targeted. Characteristic for the pore size distribution is the area median diameter d50,2 (Figure 4a) as well as the span value (Figure 4b), which indicates the width of the distribution. For the previously discussed conditions that yielded 0.37% and 0.43% porosity, we obtained a d50,2 of 92 and 78 µm with a span of 1.18 and 1.27, respectively. The smaller median pore size diameter was related to a wider size distribution in this case. On the other hand, the largest median diameter of 248 µm yielded in the narrowest span value of 0.83, while the largest span value of 1.83 related to a small median diameter of 87 µm.

Figure 4.
(a) Area median diameter pore-size distribution, (b) span σ = (d90 − d10)/d50 of distribution.
A large pore diameter with a small span value means that the porosity is governed by large pores, which is very critical regarding material properties. In this case, there are many large pores which can act as an initiator for a crack. On the other hand, smaller diameters with a large span value result in a wide distribtion with few large pores.
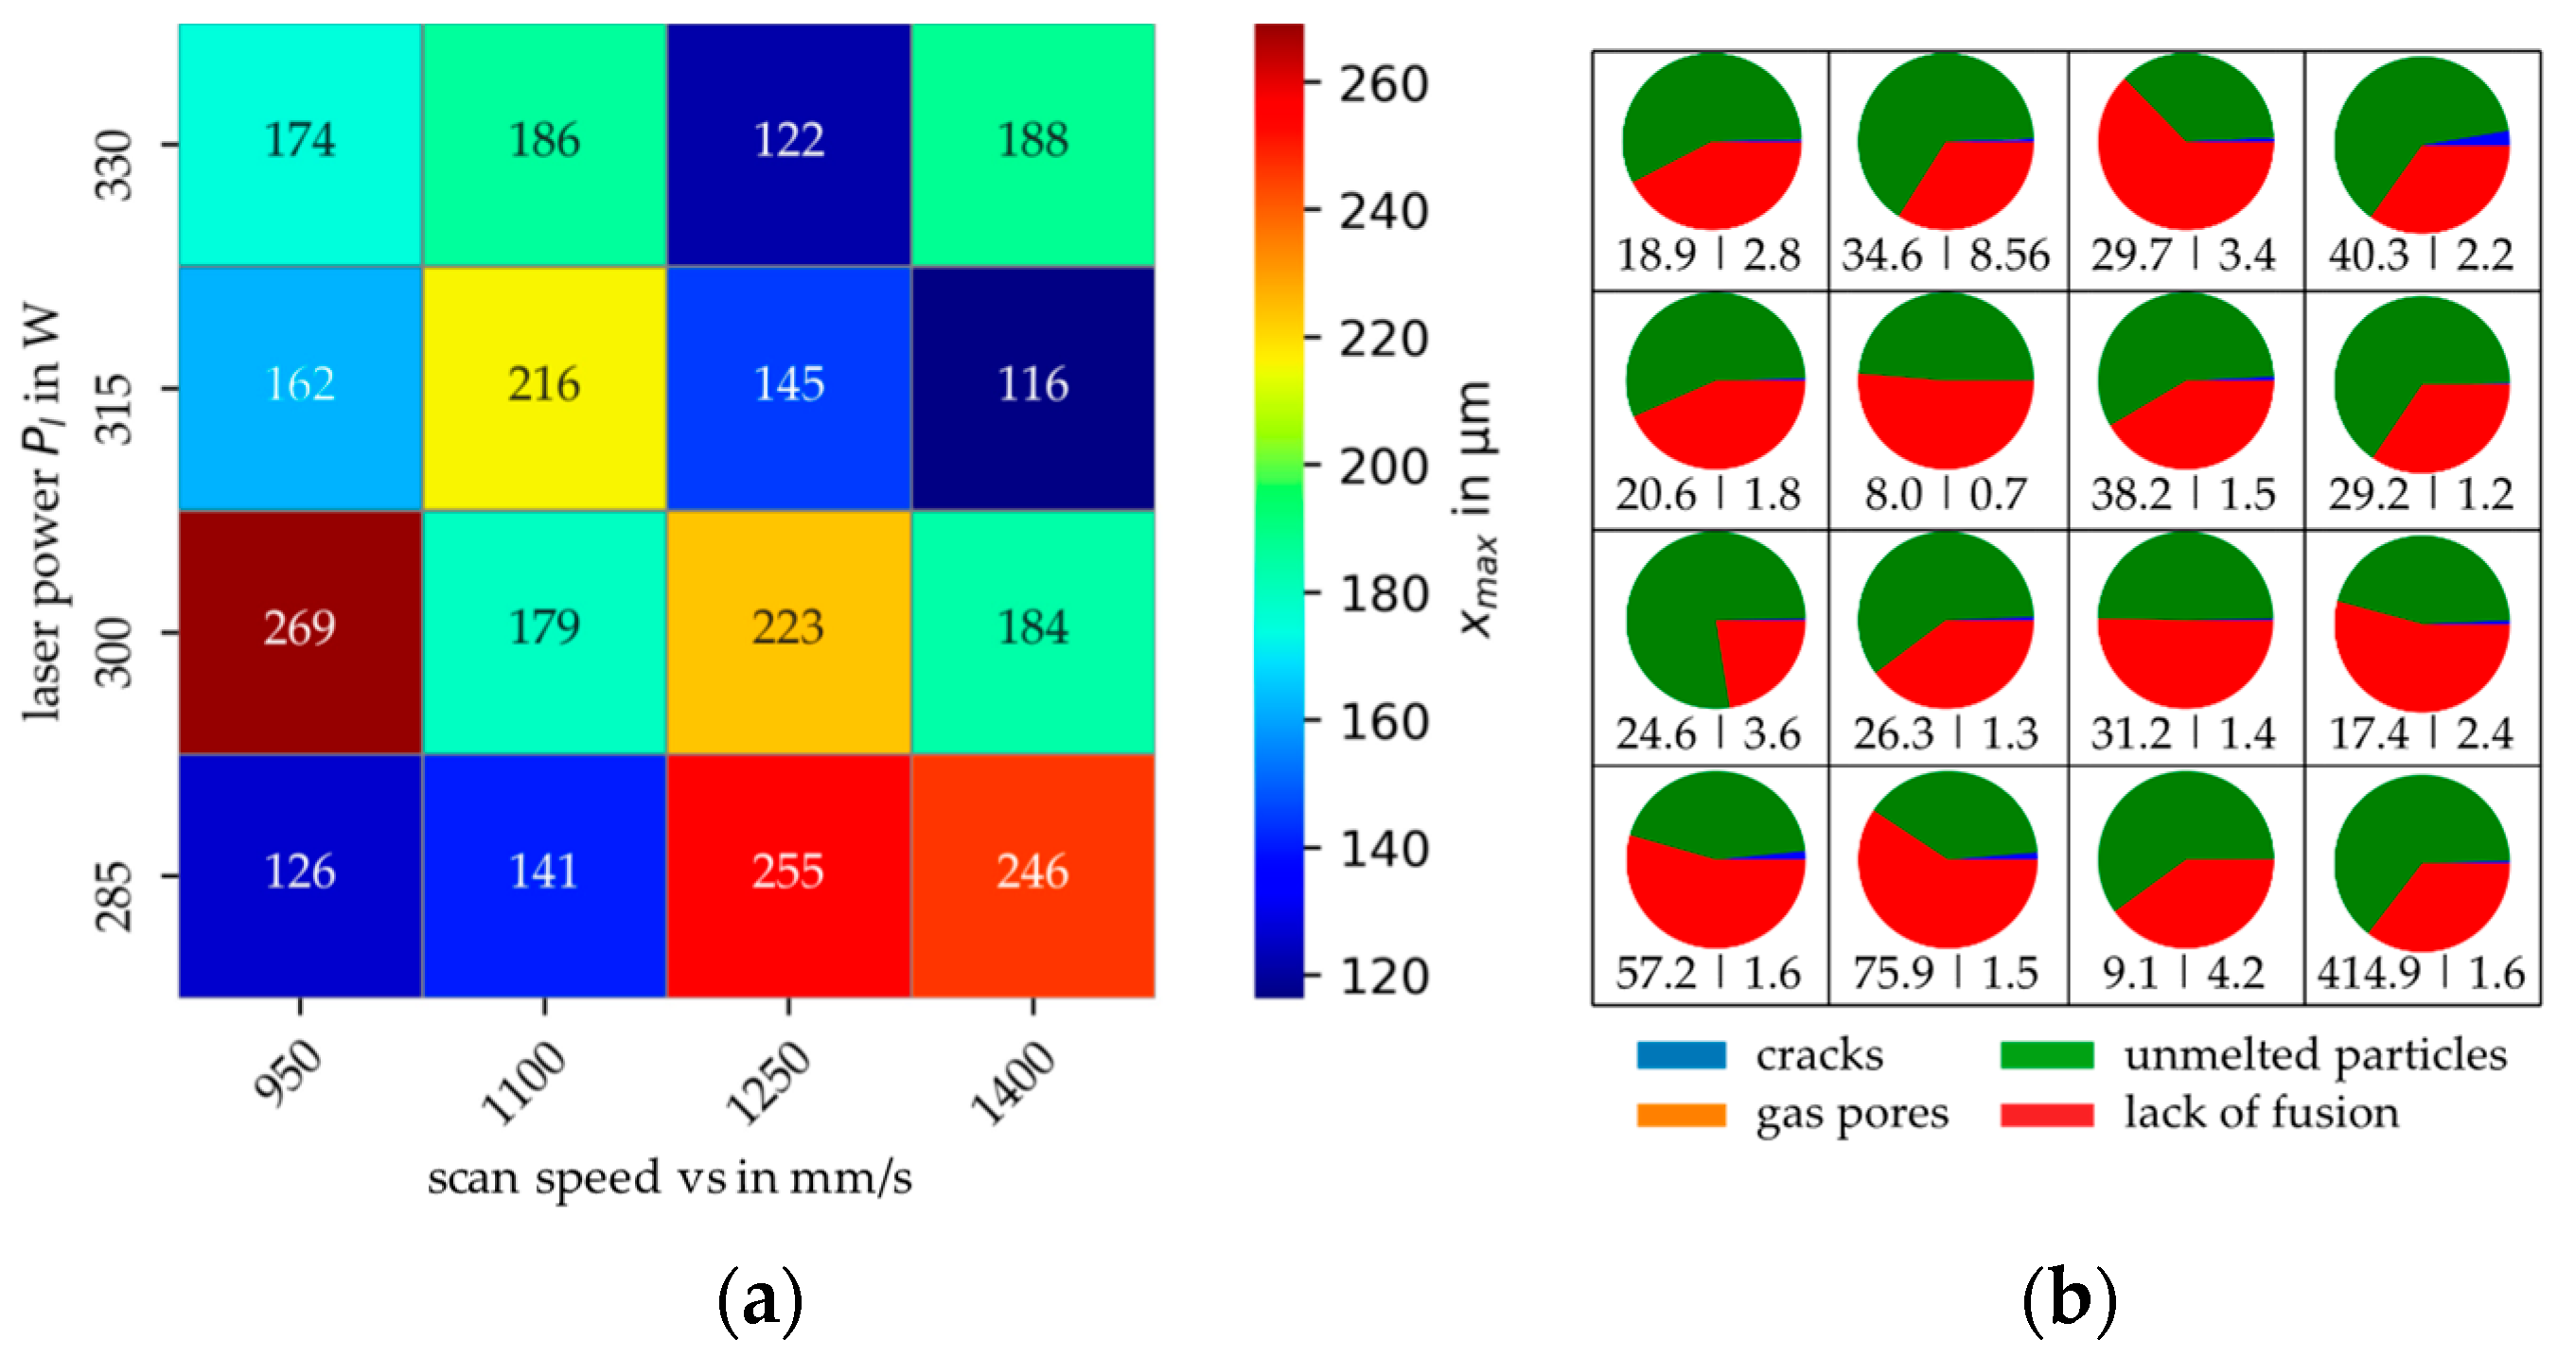
It is well known from high cycle fatigue studies that the largest defect in a part will usually initiate its failure. Not only the size, but also the shape of the defect plays a major role. For example, an existing crack will propagate more easily than a new crack will develop from a spherical pore. As a result, cracks should be avoided. Figure 5a shows the maximum pore size for each sample. For the larger pore sizes with low span values, the maximum pore diameter is slightly higher than the median value. The highest scan speed of 1400 mm/s with a maximum laser power of 315 W yields in the lowest maximum pore sizes of 116 µm.

Figure 5.
(a) Maximum pore size, (b) porosity fraction of each defect type and absolute porosity caused by cracks (left number) and gas pores (right number) in ppm.
The porosity fraction of each defect is shown in Figure 5b. Lack of fusion defects and unmelted particles are the dominant defect types. There is no significant contribution of gas pores for this material and process conditions and cracks make a minor contribution to porosity. While many cracks were found at the condition (1400 mm/s, 285 W) with an area fraction of 415 ppm, their appearance was a magnitude less frequent in all other conditions.
Finally, we evaluate the shape accuracy of the samples from the ratio sample perimeter from image analysis and the theoretical sample perimeter (Figure 6). Since a larger value represents a higher deviation from the targeted shape due to surface roughness or surface defects, small values are to be aimed at. Cold conditions such as (1400 mm/s, 285 W) lead to a high value of 3.37 due to incomplete melting and powder bonding at the surface, hotter conditions such as (950 mm/s, 330 W) yield in the lowest value 2.34. In this study, we have not used specific contour parameters, so that the shape accuracy will be a result of porosity optimization.
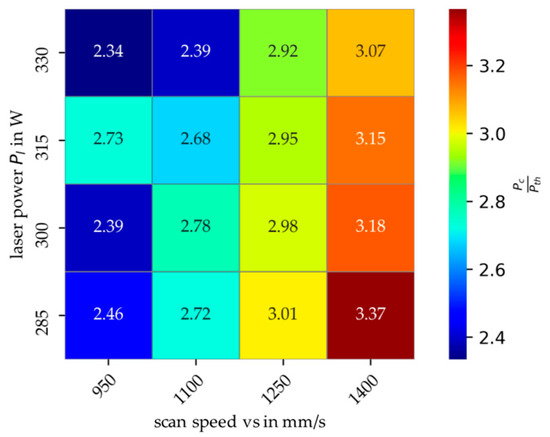
Figure 6.
Shape and contour accuracy determined from the ratio of the actual sample perimeter and its theoretical perimeter PC/Pth. Low values stand for a smooth sample surface.
5. Discussion
We have previously discussed the effect of processing parameters on porosity, the pore size distribution and the fraction of each defect type. In general, the aim of such a parameter study is usually to minimize porosity and pore sizes (especially maximum pore size) and to avoid cracks, which can easily expand when the material is stressed. We have shown that not all these aims could be achieved at the same time. We have selected five process conditions, which are favorable regarding one or more defects.
Table 5 summarizes the descriptions of two different parameters. While the parameters (950 mm/s, 285 W) feature the lowest porosity of 0.37%, the parameters (1400 mm/s, 315 W) lead to a lightly higher porosity of 0.43%. However, this condition leads to a smaller pore median d50,2 (61 vs. 92 µm), a smaller maximum pore size (116 vs. 126 µm) and with a lower area fraction of cracks, which may be a critical issue for mechanically loaded applications. The perimeter accuracy is lower which may be further optimized by specific contour parameters.
Table 5.
Selection of process conditions, optimal values are marked bold.
The decision as to which of these conditions is used to build final parts depends greatly on the application. For very high cycle fatigue applications, a strict minimization of cracks and maximum pore diameter is crucial. For applications with minor stressing, the weighting of objectives may be different. In our opinion, it is important to be aware of these different targets quantitatively instead of focusing on the porosity level.
Such detailed data can now be acquired in much shorter time. Previous analysis methods took around 10 min for each sample, including determination of pore size distributions. Our integrated analysis solution now takes approximately 10 s per sample, resulting in a time decrease with a factor of 50–60.
6. Conclusions
In this work we have presented our approach “PoreAnalyzer” for the analysis of an example of the ferritic steel 410L. The Open Source software is freely available (download link under “Data Availability Statement”) and can be easily extended and adapted to similar problems.
We have shown that the classification of the defect type gives more insight into the process and allows multi-objective decisions regarding most critical defects for a specific application. While a minimization of porosity based on volumetric energy density is common, quantitative measures of each defect type and probability allow knowledge to be obtained on the influence of each parameter. This has the potential to create large databases in the future to learn how to transfer parameter sets between materials by means of artificial intelligence techniques. Including online analyses data, such as surface temperature from a pyrometer, will help to maintain a low porosity even in complicated parts.
Author Contributions
Conceptualization, review and writing, N.E. and A.T.; methodology, software and investigation, F.F. All authors have read and agreed to the published version of the manuscript.
Funding
This research received no external funding.
Institutional Review Board Statement
Not applicable.
Informed Consent Statement
Not applicable.
Data Availability Statement
The software “PoreAnalyzer” is available as open-source. If you use this software, please cite this article to help us obtain funding for further development. The reference for the initial release of PoreAnalyzer is: N. Ellendt, A. Toenjes, F. Fabricius, PoreAnalyzer V1.0 release, doi:10.5281/zenodo.4918711.
Conflicts of Interest
The authors declare no conflict of interest.
References
- Ngo, T.D.; Kashani, A.; Imbalzano, G.; Nguyen, K.T.Q.; Hui, D. Additive manufacturing (3D printing): A review of materials, methods, applications and challenges. Compos. Part B Eng. 2018, 143, 172–196. [Google Scholar] [CrossRef]
- Popescu, D.; Zapciu, A.; Amza, C.; Baciu, F.; Marinescu, R. FDM process parameters influence over the mechanical properties of polymer specimens: A review. Polym. Test. 2018, 69, 157–166. [Google Scholar] [CrossRef]
- Khorasani, A.; Gibson, I.; Veetil, J.K.; Ghasemi, A.H. A review of technological improvements in laser-based powder bed fusion of metal printers. Int. J. Adv. Manuf. Technol. 2020, 108, 191–209. [Google Scholar] [CrossRef]
- Zhong, C.; Liu, J.; Zhao, T.; Schopphoven, T.; Fu, J.; Gasser, A.; Schleifenbaum, J.H. Laser metal deposition of Ti6Al4V—A brief review. Appl. Sci. 2020, 10, 764. [Google Scholar] [CrossRef] [Green Version]
- Prashanth, K.G.; Shakur Shahabi, H.; Attar, H.; Srivastava, V.C.; Ellendt, N.; Uhlenwinkel, V.; Eckert, J.; Scudino, S. Production of high strength Al85Nd8Ni5Co2 alloy by selective laser melting. Addit. Manuf. 2015, 6, 1–5. [Google Scholar] [CrossRef]
- Scudino, S.; Unterdörfer, C.; Prashanth, K.G.; Attar, H.; Ellendt, N.; Uhlenwinkel, V.; Eckert, J. Additive manufacturing of Cu–10Sn bronze. Mater. Lett. 2015, 156, 202–204. [Google Scholar] [CrossRef]
- Keshavarzkermani, A.; Marzbanrad, E.; Esmaeilizadeh, R.; Mahmoodkhani, Y.; Ali, U.; Enrique, P.D.; Zhou, N.Y.; Bonakdar, A.; Toyserkani, E. An investigation into the effect of process parameters on melt pool geometry, cell spacing, and grain refinement during laser powder bed fusion. Opt. Laser Technol. 2019, 116, 83–91. [Google Scholar] [CrossRef]
- Tang, C.; Tan, J.L.; Wong, C.H. A numerical investigation on the physical mechanisms of single track defects in selective laser melting. Int. J. Heat Mass Transf. 2018, 126, 957–968. [Google Scholar] [CrossRef]
- Hooper, P.A. Melt pool temperature and cooling rates in laser powder bed fusion. Addit. Manuf. 2018, 22, 548–559. [Google Scholar] [CrossRef]
- Gordon, J.V.; Narra, S.P.; Cunningham, R.W.; Liu, H.; Chen, H.; Suter, R.M.; Beuth, J.L.; Rollett, A.D. Defect structure process maps for laser powder bed fusion additive manufacturing. Addit. Manuf. 2020, 36, 101552. [Google Scholar] [CrossRef]
- Deng, Y.; Mao, Z.; Yang, N.; Niu, X.; Lu, X. Collaborative Optimization of Density and Surface Roughness of 316L Stainless Steel in Selective Laser Melting. Materials 2020, 13, 1601. [Google Scholar] [CrossRef] [Green Version]
- Ahmadi, A.; Mirzaeifar, R.; Moghaddam, N.S.; Turabi, A.S.; Karaca, H.E.; Elahinia, M. Effect of manufacturing parameters on mechanical properties of 316L stainless steel parts fabricated by selective laser melting: A computational framework. Mater. Design 2016, 112, 328–338. [Google Scholar] [CrossRef]
- Zhang, B.; Li, Y.; Bai, Q. Defect formation mechanisms in selective laser melting: A review. Chin. J. Mech. Eng. 2017, 30, 515–527. [Google Scholar] [CrossRef] [Green Version]
- Wang, W.; Ning, J.; Liang, S.Y. Prediction of lack-of-fusion porosity in laser powder-bed fusion considering boundary conditions and sensitivity to laser power absorption. Int. J. Adv. Manuf. Technol. 2020, 112, 61–70. [Google Scholar] [CrossRef]
- Stopyra, W.; Gruber, K.; Smolina, I.; Kurzynowski, T.; Kuźnicka, B. Laser powder bed fusion of AA7075 alloy: Influence of process parameters on porosity and hot cracking. Addit. Manuf. 2020, 35, 101270. [Google Scholar] [CrossRef]
- Ronneberg, T.; Davies, C.M.; Hooper, P.A. Revealing relationships between porosity, microstructure and mechanical properties of laser powder bed fusion 316L stainless steel through heat treatment. Mater. Design 2020, 189, 108481. [Google Scholar] [CrossRef]
- Zhang, B.; Dembinski, L.; Coddet, C. The study of the laser parameters and environment variables effect on mechanical properties of high compact parts elaborated by selective laser melting 316L powder. Mater. Sci. Eng. A 2013, 584, 21–31. [Google Scholar] [CrossRef]
- de Terris, T.; Andreau, O.; Peyre, P.; Adamski, F.; Koutiri, I.; Gorny, C.; Dupuy, C. Optimization and comparison of porosity rate measurement methods of Selective Laser Melted metallic parts. Addit. Manuf. 2019, 28, 802–813. [Google Scholar] [CrossRef]
- du Plessis, A.; le Roux, S.G.; Booysen, G.; Els, J. Directionality of cavities and porosity formation in powder-bed laser additive manufacturing of metal components investigated using X-ray tomography. 3D Print. Addit. Manuf. 2016, 3, 48–55. [Google Scholar] [CrossRef] [Green Version]
- Wang, P.; Tan, X.; He, C.; Nai, M.L.S.; Huang, R.; Tor, S.B.; Wei, J. Scanning optical microscopy for porosity quantification of additively manufactured components. Addit. Manuf. 2018, 21, 350–358. [Google Scholar] [CrossRef]
- Liu, R.; Liu, S.; Zhang, X. A physics-informed machine learning model for porosity analysis in laser powder bed fusion additive manufacturing. Int. J. Adv. Manuf. Technol. 2021, 113, 1943–1958. [Google Scholar] [CrossRef]
- Bradski, G. The OpenCV Library. Dr. Dobb’s J. Softw. Tools 2000, 120, 122–125. [Google Scholar]
- Otsu, N. A threshold selection method from gray-level histograms. IEEE Trans. Syst. Man Cybern. 1979, 9, 62–66. [Google Scholar] [CrossRef] [Green Version]


Publisher’s Note: MDPI stays neutral with regard to jurisdictional claims in published maps and institutional affiliations. |
© 2021 by the authors. Licensee MDPI, Basel, Switzerland. This article is an open access article distributed under the terms and conditions of the Creative Commons Attribution (CC BY) license (https://creativecommons.org/licenses/by/4.0/).