Article

Numerical Analysis of an Upstream Tailings Dam Subjected to Pond Filling Rates

Department of Civil, Environmental and Natural Resources Engineering, Division of Mining and Geotechnical Engineering, Luleå University of Technology, 97187 Luleå, Sweden
*
Author to whom correspondence should be addressed.
Appl. Sci. 2021, 11(13), 6044; https://doi.org/10.3390/app11136044
Submission received: 5 June 2021 / Revised: 26 June 2021 / Accepted: 27 June 2021 / Published: 29 June 2021
(This article belongs to the Special Issue Trends and Prospects in Geotechnics)

Abstract

:
One of the challenges in upstream tailings dam projects is to ensure the allowable rate of deposition of tailings in the pond (i.e., pond filling rate) while maintaining the stability of the dam. This is due to the fact that an upstream tailings dam is constructed by placing dikes on top of previously deposited soft tailings, which could lead to a decrease in dam stability because of the build-up of excess pore water pressure. The main purpose of this work is to investigate the effects of pond filling rates on excess pore water pressure and the stability of an upstream tailings dam by a numerical study. A finite element software was used to simulate the time-dependent pond filling process and staged dam construction under various pond filling rates. As a result, excess pore water pressure increased in each raising phase and decreased in the subsequent consolidation phase. However, some of the excess pore water pressure remained after every consolidation phase (i.e., the build-up of excess pore water pressure), which could lead to a potentially critical situation in the stability of the dam. In addition, the remaining excess pore water pressure varied depending on the pond filling rates, being larger for high filling rates and smaller for low filling rates. It is believed that the approach used in this study could be a guide for dam owners to keep a sufficiently high pond filling rate but still ensure the desirable stability of an upstream tailings dam.

1. Introduction

This study focuses on the effects of pond filling rates on excess pore water pressure and the stability of an upstream tailings dam. Owing to a low initial investment (as a small amount of building material is required), the upstream method is the most popular design for a raised tailings embankment, especially in low-risk seismic areas [1]. It should be noted that there are over 3500 tailings dams worldwide, of which 50% are of the upstream design [2]. One of challenges in an upstream tailings dam is to ensure the allowable rates of deposition in the pond (i.e., pond filling rates) and still maintain the stability of a tailings dam [3]. This is due to the fact that an upstream tailings dam is constructed by placing dikes on top of previously deposited soft tailings, which could lead to a decrease in dam stability [4] because of the build-up of excess pore water pressure. During the operation of an upstream tailings dam, a small starter dike is first built at the extreme downstream toe. The dam wall is then progressively raised on the upstream side, mainly founded on the tailings beach. The pond filling operation process is then gradually accomplished as the height of the dam increases during the stage of construction [5,6]. In general, an adequate pond filling rate allows excess pore water pressure to dissipate gradually during the consolidation process. However, if the consolidation process is not completed when a new dike is built, i.e., in case of high pond filling rates, the excess pore water pressure will not have enough time to dissipate. In this sense, excess pore water pressure could build up under the dikes, which could lead to a critical stability situation of the dam [7]. A close relationship can thereby be seen between the consolidation process and the stability of the dam. In the present study, an approach which can simulate both consolidation processes and stability for a tailings dam is needed. Somogyi [8] investigated a slow deposition process in impoundments of slimes and tailings based on a nonlinear one-dimensional numerical approach. Gassner and Fourie [9] used a simple one-dimensional numerical approach for optimizing the allowable rate of deposition on tailings dams.
However, due to the complexities of the consolidation process coupled with the stability analysis as well as the complicated behavior of tailings materials, an advanced numerical approach would be appropriate. Note that the actual consolidation in the facility is two-dimensional under the assumption of plane strain or axisymmetric conditions, at least at the straight portions of the tailings impoundments and dams [10]. With regard to the use of the advanced numerical approach for a tailings dam, there have been a number of studies addressing two-dimensional numerical simulations [7,11,12,13,14,15] and three-dimensional numerical simulations [16,17,18]. In the study by Psarropoulos and Tsompanakis [12], an investigation on the mechanical behavior and the stability of a tailings dam under static and dynamic loading was performed. Two-dimensional numerical simulations were used in their study for three typical types of tailings dams. Zandarín et al. [13] developed a numerical model to study the stability of tailings dams subjected to the role of capillarity. Their numerical model considered the consolidation processes under self-weight loads, continuous addition of water with the tailings discharge, infiltration of rainwater, and evaporation. Ormann et al. [7,11] and Zardari et al. [15] boused the two-dimensional finite element method for the simulations of both consolidation processes and the stability of an upstream tailings dam. Ormann et al. [7,11] focused on static aspects, i.e., stability of a curved embankment and strengthening by rockfill embankments, whereas Zardari et al. [15] focused on earthquake-induced liquefaction of an upstream tailings dam. However, none of the abovementioned references have closely evaluated the effects of the pond filling rates on excess pore water pressure and the stability of an upstream tailings dam. Vick [3] addressed the need to manage the pond filling rates of an upstream tailings dam to prevent the build-up of excess pore water pressure that can reduce the shear strength of the fill material. Excessive rates of the pond filling would cause a trigger for static liquefaction that has been the underlying cause for many upstream tailings impoundment failures [19].
In this study, a numerical approach (two-dimensional finite element method) was used to investigate the effects of pond filling rates on excess pore water pressure and the stability of an upstream tailings dam. The time-dependent pond filling process and the stage of dam construction under various pond filling rates were considered in the simulations. The UBCSAND model was used for the tailings materials, whereas the Mohr–Coulomb (M-C) model was applied for moraine and rockfill materials. The results show that the finite element method can be a useful tool for studying how an upstream tailings dam should be built in order to be stable enough for different pond filling rates. With the finite element method, a finite model of a tailings dam can be built easily, e.g., a gradual raising of a dam in its geometry.

2. Numerical Modelling and Methods

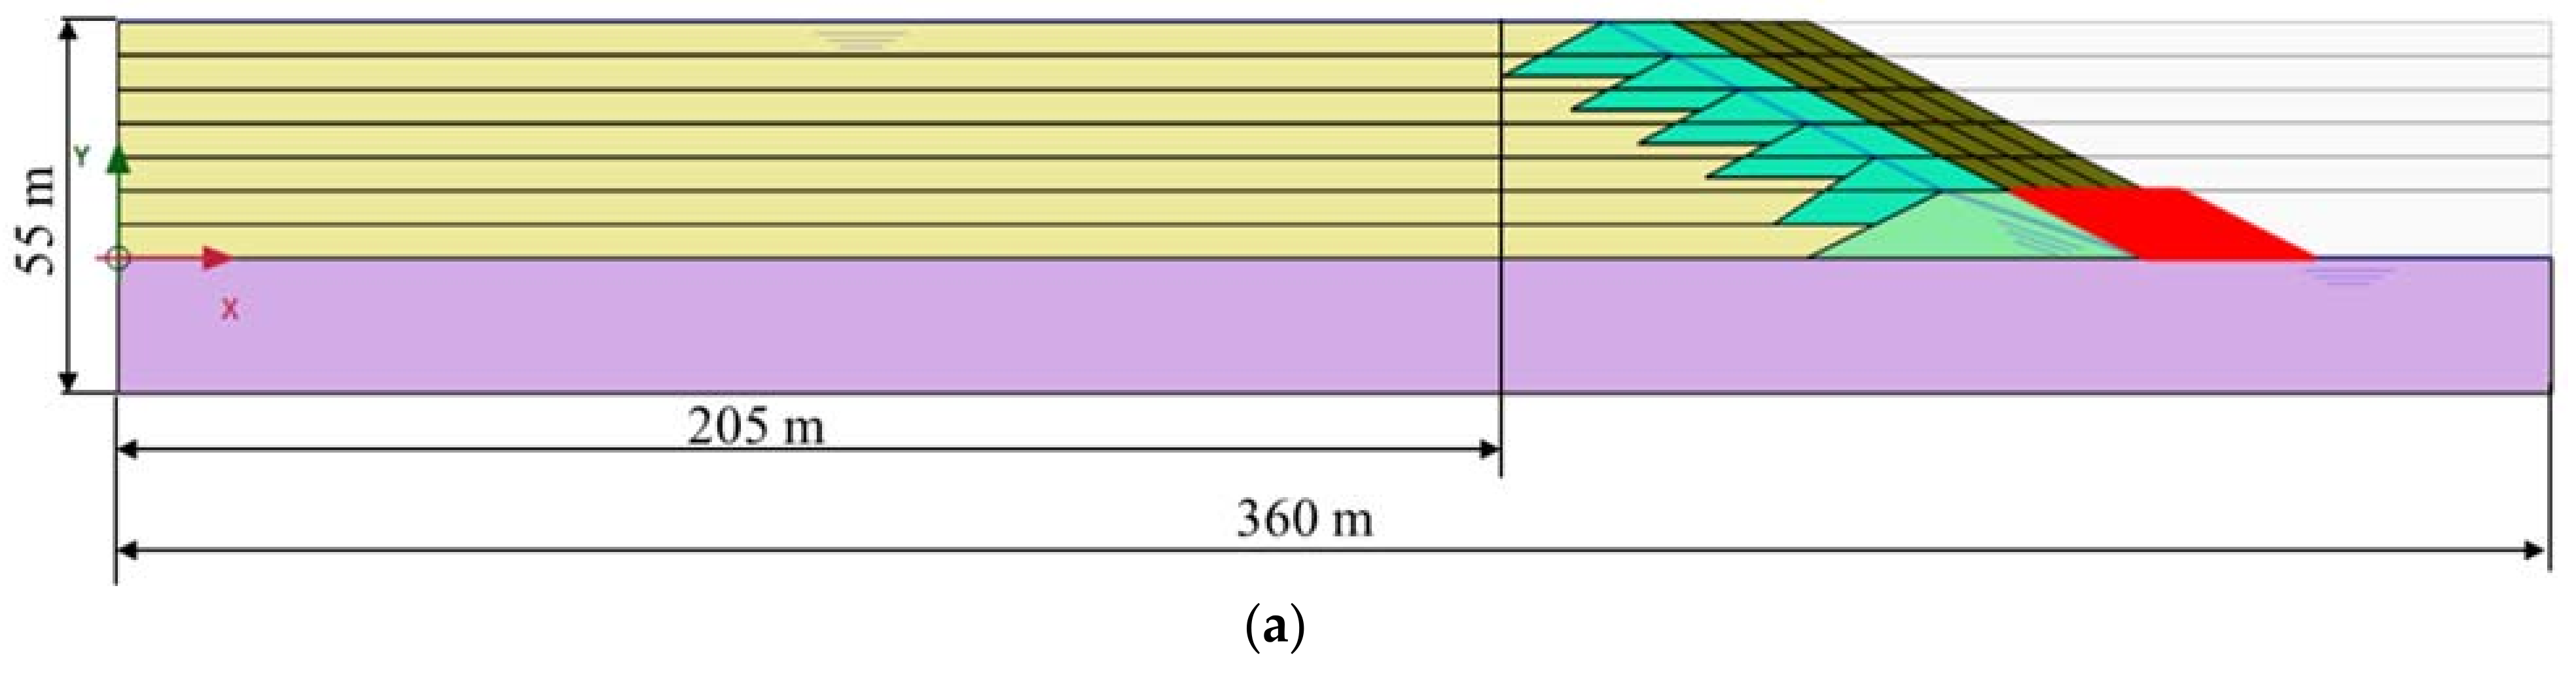
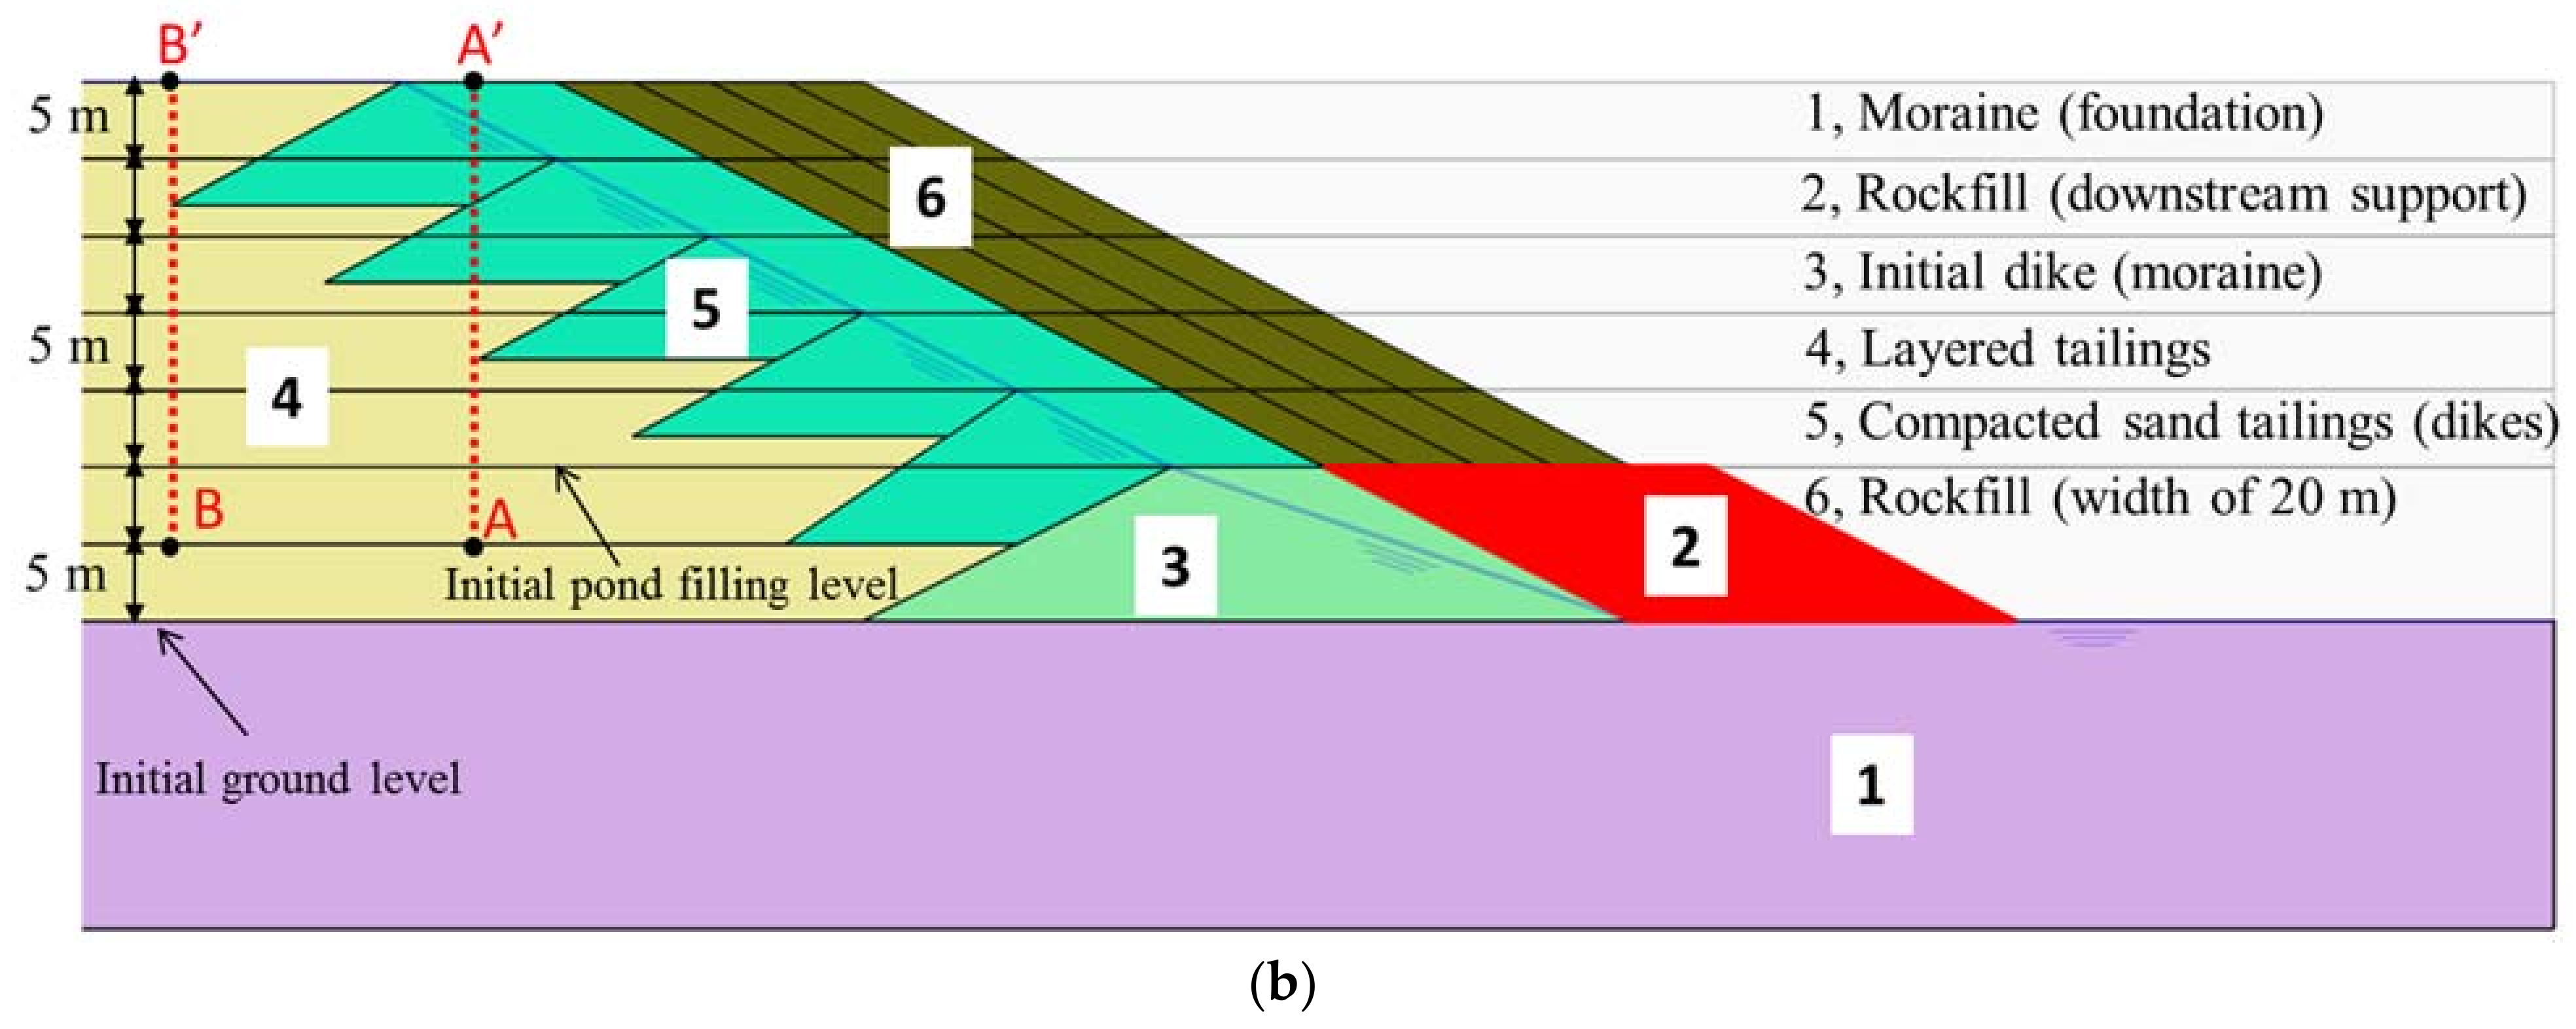
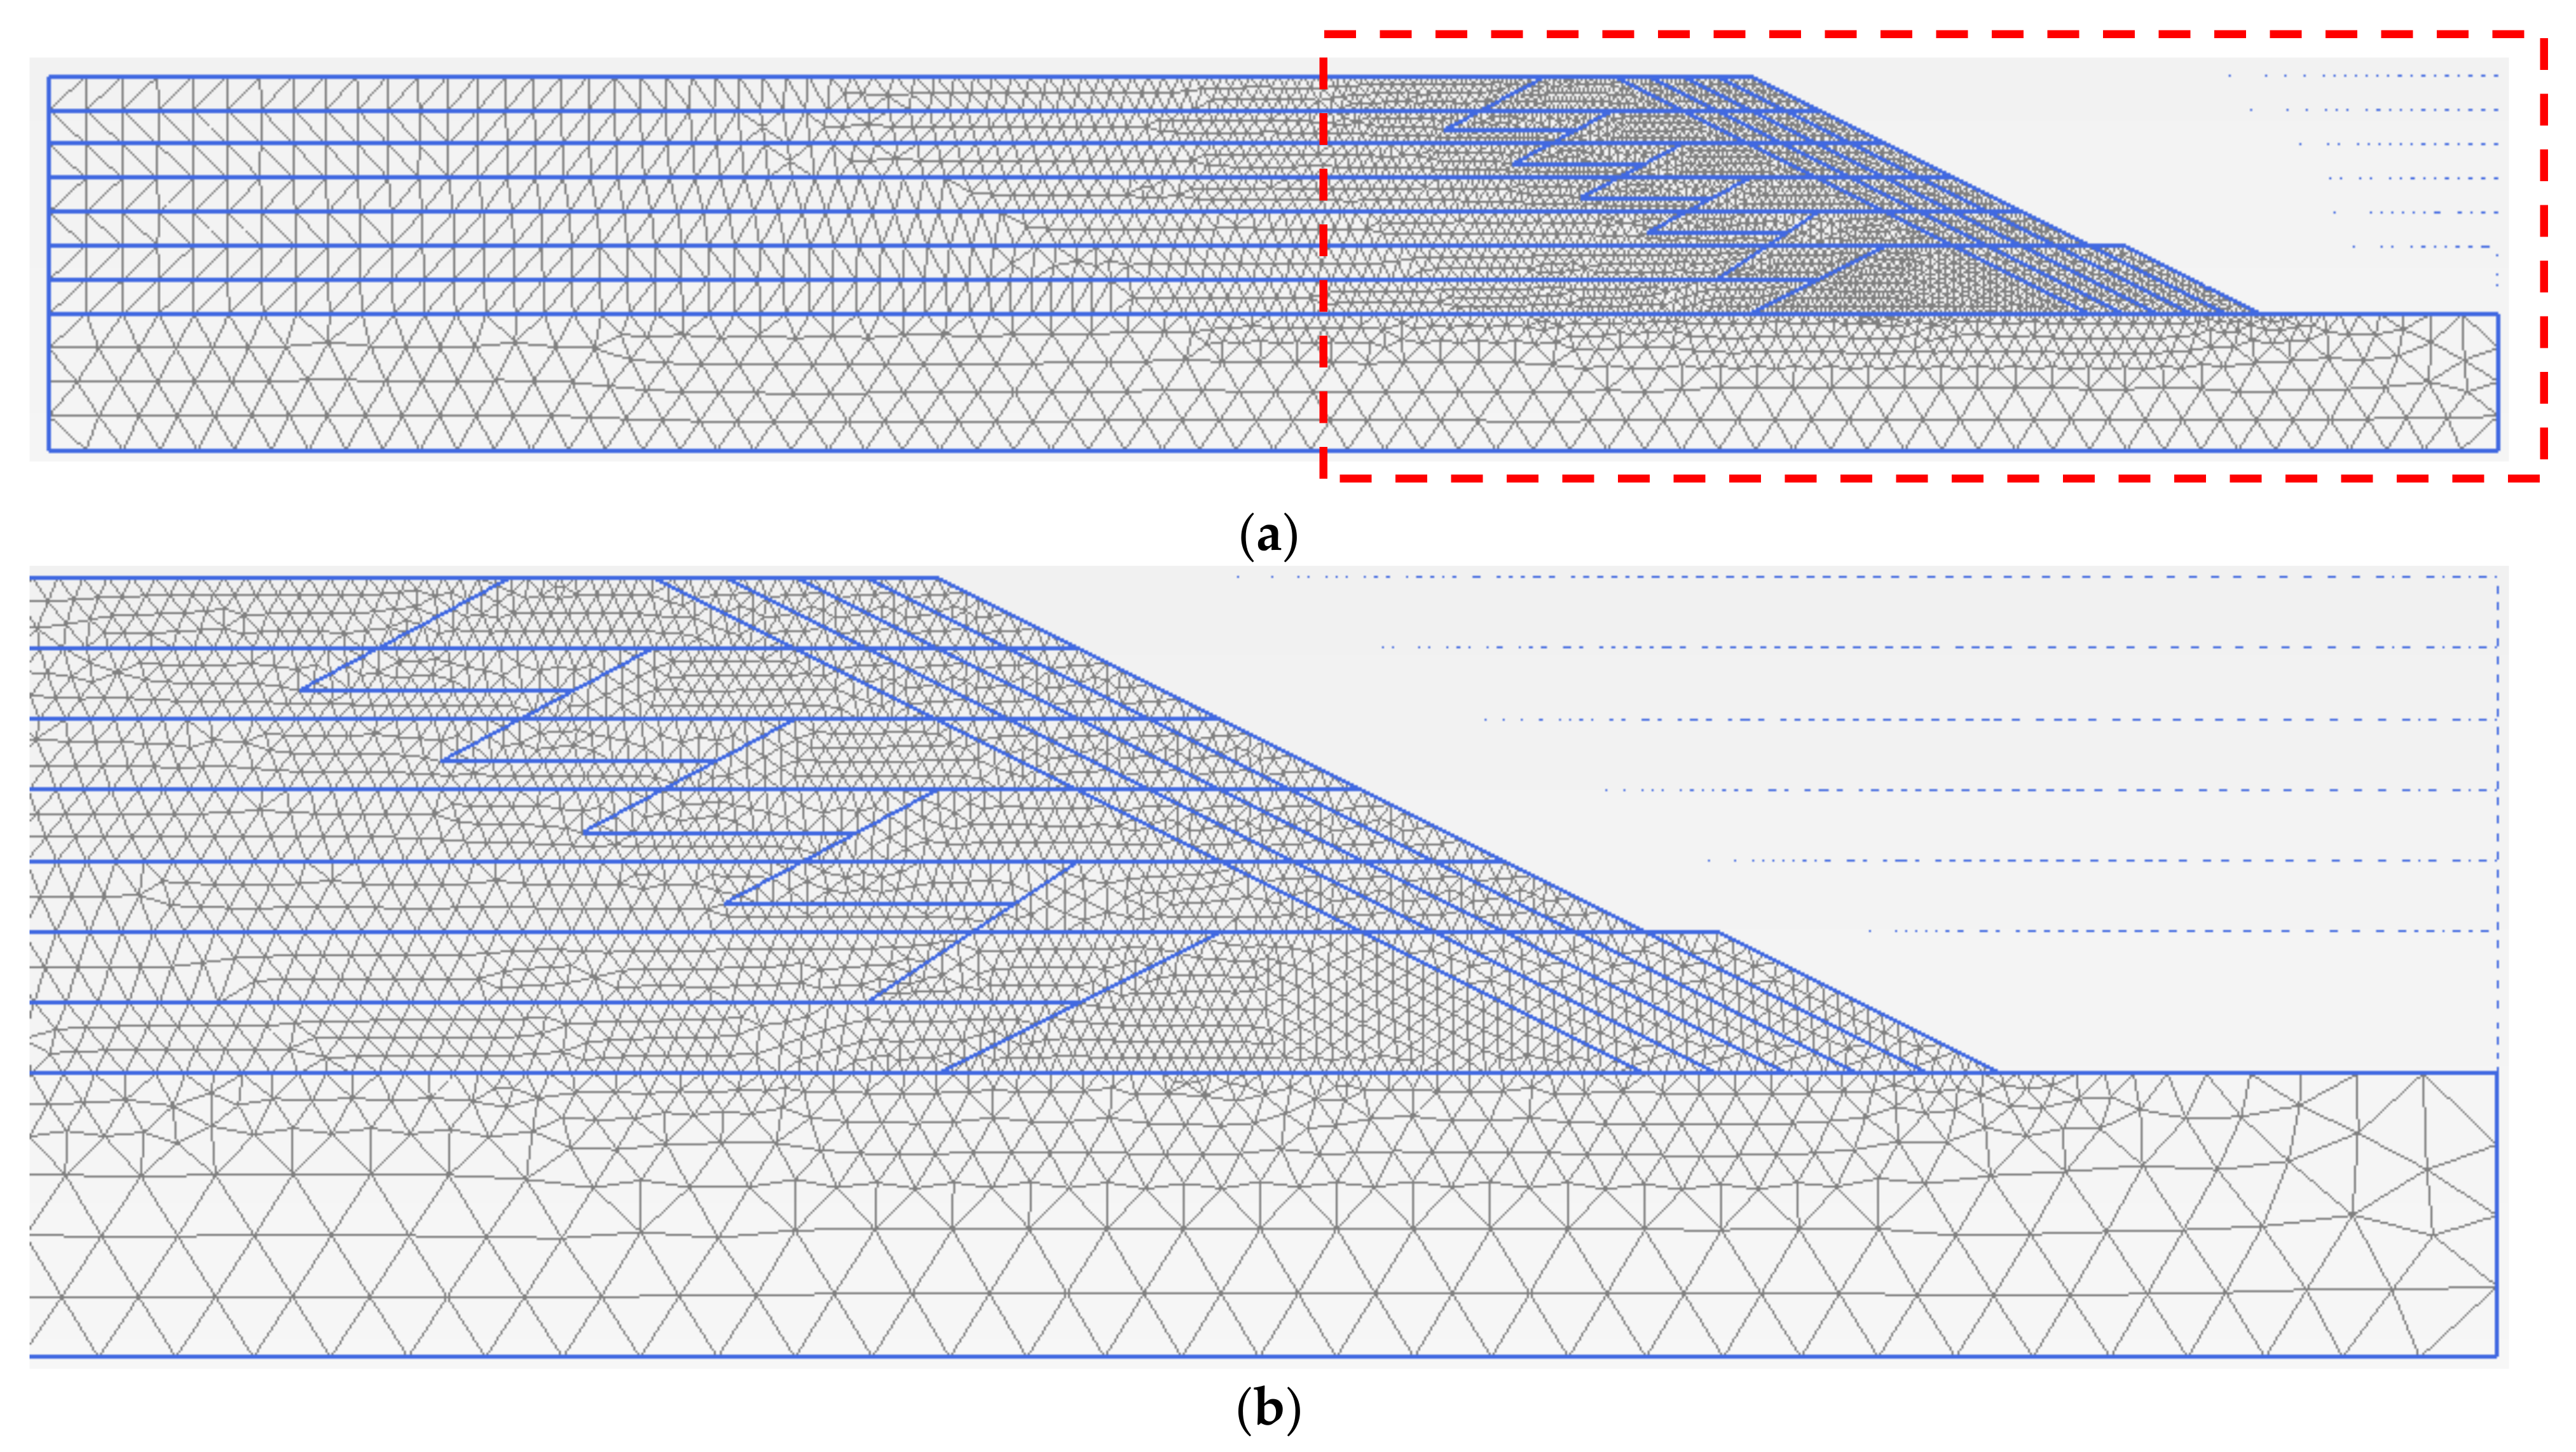
2.1. General Description

An idealized upstream tailings dam was simulated using the finite element software Plaxis 2D [20]. Note that the plane strain condition is commonly adopted in simulations of tailings dams as it is a long straight section (except for corners) [7,12,21]. A full model was 360 m wide and 55 m high after the last construction stage, as shown in Figure 1a. In general, the model size should be large enough to avoid boundary effects on simulation outputs. In this study, the left vertical boundaries were 205 m away from the dam in all models. The slope inclination of 2H:1V (horizontal to vertical) was adopted as in the previous work of a simplified upstream tailings dam simulation by Psarropoulos and Tsompanakis [12]. The model comprised six soil types: moraine (foundation), rockfill (downstream support), initial dike (starter dike), layered tailings, compacted sand tailings (dikes), and rockfill (Figure 1b). Figure 1b shows the initial pond filling step, which was located at 10 m above the initial ground level. From this level, five construction stages comprising a raising phase (R) and a consolidation phase (C) were simulated in the model. In each raising phase, a new dike was constructed on top of previously layered tailings, assumed to be completed in 10 days and followed by a 10-day raising period for both new layered tailings and rockfill. The consolidation analysis was carried out to investigate the transient system response allowing excess pore water pressure to dissipate gradually during the consolidation process. The time in the consolidation phase (consolidation time) depends on the pond filling rate. In this current work, four case studies corresponding to four pond filling rates of 10.0 m/year, 5.0 m/year, 3.3 m/year, and 2.5 m/year were used to investigate the effects of the pond filling rates on excess pore water pressure and the stability of the upstream tailings dam. Therefore, the consolidation times in each stage were set over 163 days, 345 days, 528 days, and 710 days corresponding to the pond filling rates of 10.0 m/year, 5.0 m/year, 3.3 m/year, and 2.5 m/year, respectively. The phreatic line was assumed to be located at the surface of the tailings impoundment (worst-case scenario). The locations of the phreatic lines were adapted depending on the pond filling steps. In each analysis step, a new set of hydraulic boundary conditions was imposed, i.e., closed boundaries at the bottom (Ymin) and the left vertical edge (Xmin), and open boundaries for others. As for the mechanical boundary conditions, the model was assumed to be fully fixed at its bottom. The horizontal displacements were assumed to be zero along the lateral edges (i.e., both left and right vertical boundaries). These hydraulic and mechanical boundary conditions can be found in many previous works dealing with two-dimensional numerical simulations of upstream tailings dams [7,11,12,13,14,15]. The finite element mesh of the upstream tailings dam after the last construction stage is shown in Figure 2. The finite element mesh in each cluster was composed of 15-node triangular elements. These elements give a fourth-order (quartic) interpolation for displacements [20]. A massive number of elements were generated in the areas of interest (structural zone), providing the finer mesh near the slope with embankments and rockfill. This is due to the fact that these areas would be affected by large strains during the stage of construction. The coarser mesh was then generated at the far-field areas to minimize computation time.
Apart from the fully coupled analysis on deformation and consolidation, the global factor of safety (FoS) for slope failure was computed for every stage of construction. The global factor of safety is computed in the finite element software Plaxis 2D using the shear strength reduction method. The idea of this method is that the soil strength is gradually reduced, and when a failure occurs, the corresponding strength reduction factor can be considered as the factor of safety of soil strength [20,22,23,24,25]. In this study, the factor of safety should have a value of at least 1.5 under normal operation conditions according to the Swedish dam safety guidelines [26]. In order to maintain the factor of safety of 1.5 at every stage of the construction, a strengthening by rockfill berms was added on the downstream side of the slope. The procedure for the construction of the rockfill berms was simulated in the finite element model. The rockfill berms were placed immediately after each dike construction in the finite element model. The width of the rockfill was then optimized in this study by a parametric sensitivity analysis where the rockfill width was varied until no FoS became smaller than approximately 1.5 at every stage of construction. Four rockfill widths of 5.0 m, 10.0 m, 15.0 m, and 20.0 m were applied to reach the target (discussed in Section 3.1, Figure 6).

2.2. Constitutive Models

In this study, the UBCSAND constitutive model was used to simulate the tailings materials, whereas the Mohr–Coulomb (M-C) model was applied for moraine and rockfill materials. The M-C model is a linear elastic–perfectly plastic model. The UBCSAND model is an effective stress plasticity model used in advanced stress deformation analyses of geotechnical materials. A fully coupled analysis (mechanical and groundwater flow calculations) can be performed simultaneously in this model. It can predict the shear stress–strain behavior of soil using an assumed hyperbolic relationship [27]. Therefore, this model can overcome the drawback of the elastic–perfectly plastic M-C model with a possibility to capture the nonlinearity in the elastic part of the soil. In addition, the UBCSAND model is appropriate for tailings materials as excess pore water pressure can build up in tailings during pond filling and dam raising. Figure 3 presents the behavior of tailings materials during drained simple shear tests and simulations. The laboratory tests were performed by Wiklund [28] at the Luleå University of Technology. Several simulation models were performed in this study to evaluate parameters for the UBCSAND model. As can be observed, while the stress–strain curves followed the nonlinear behavior of the experimental data well in the UBCSAND model, they overestimated the shear strength of the tailings materials significantly in the M-C model, regardless of the applied normal stresses (50 kPa, 100 kPa, 150 kPa) or the tailings types (layered tailings, compacted tailings). The UBCSAND model has also been used for materials in the development of excess pore water pressure-induced static liquefaction [29] or seismic liquefaction [15,30].
The M-C input parameter values of moraine and rockfill materials were adopted from previous works [31,32], as summarized in Table 1, except for the Poisson’s ratio and the dilatancy angle. In this study, the Poisson´s ratio (υ) and the dilatancy angle (ψ) were assumed to be 0.33 and 0, respectively. These assumed values have been used in many simulation works of tailings dams in Sweden by Ormann et al. [7,11], Knutsson et al. [21], and Zardari et al. [15]. The laboratory tests were performed on tailings materials taken from an iron mine in northern Sweden. In addition, the parametric sensitivity analyses (curve fitting method) for obtaining elastic shear modulus number (KGe), plastic shear modulus number (KGp), and elastic bulk modulus number (KBe) were performed. In the curve fitting method, the friction angles and cohesion, which were evaluated based on the direct shear test results, were fixed. Elastic shear modulus number (KGe) and plastic shear modulus number (KGp) were varied to capture the stress–strain curves from the experiments. Finally, elastic bulk modulus number (KBe) was estimated as 70% of elastic shear modulus number (KGe), as recommended in [20] (material models part). As can be seen in Figure 3, there is a good agreement between the simulations (UBCSAND model) and experimental results, regardless of the tailings types used. The index parameters me, ne, and np were assigned the values of 0.5, 0.5, and 0.4, respectively, as suggested in the original UBCSAND report by Beaty and Byrne [27]. The hydraulic conductivity of the tailings was adopted from previous studies [28,31]. In the present study, the hydraulic conductivity values in the horizontal direction were assumed to be 10 times higher than those in the vertical direction due to the layered nature of the tailings [26,31]. All input parameter values of the UBCSAND model used in the numerical analyses are tabulated in Table 2.

3. Simulation Results

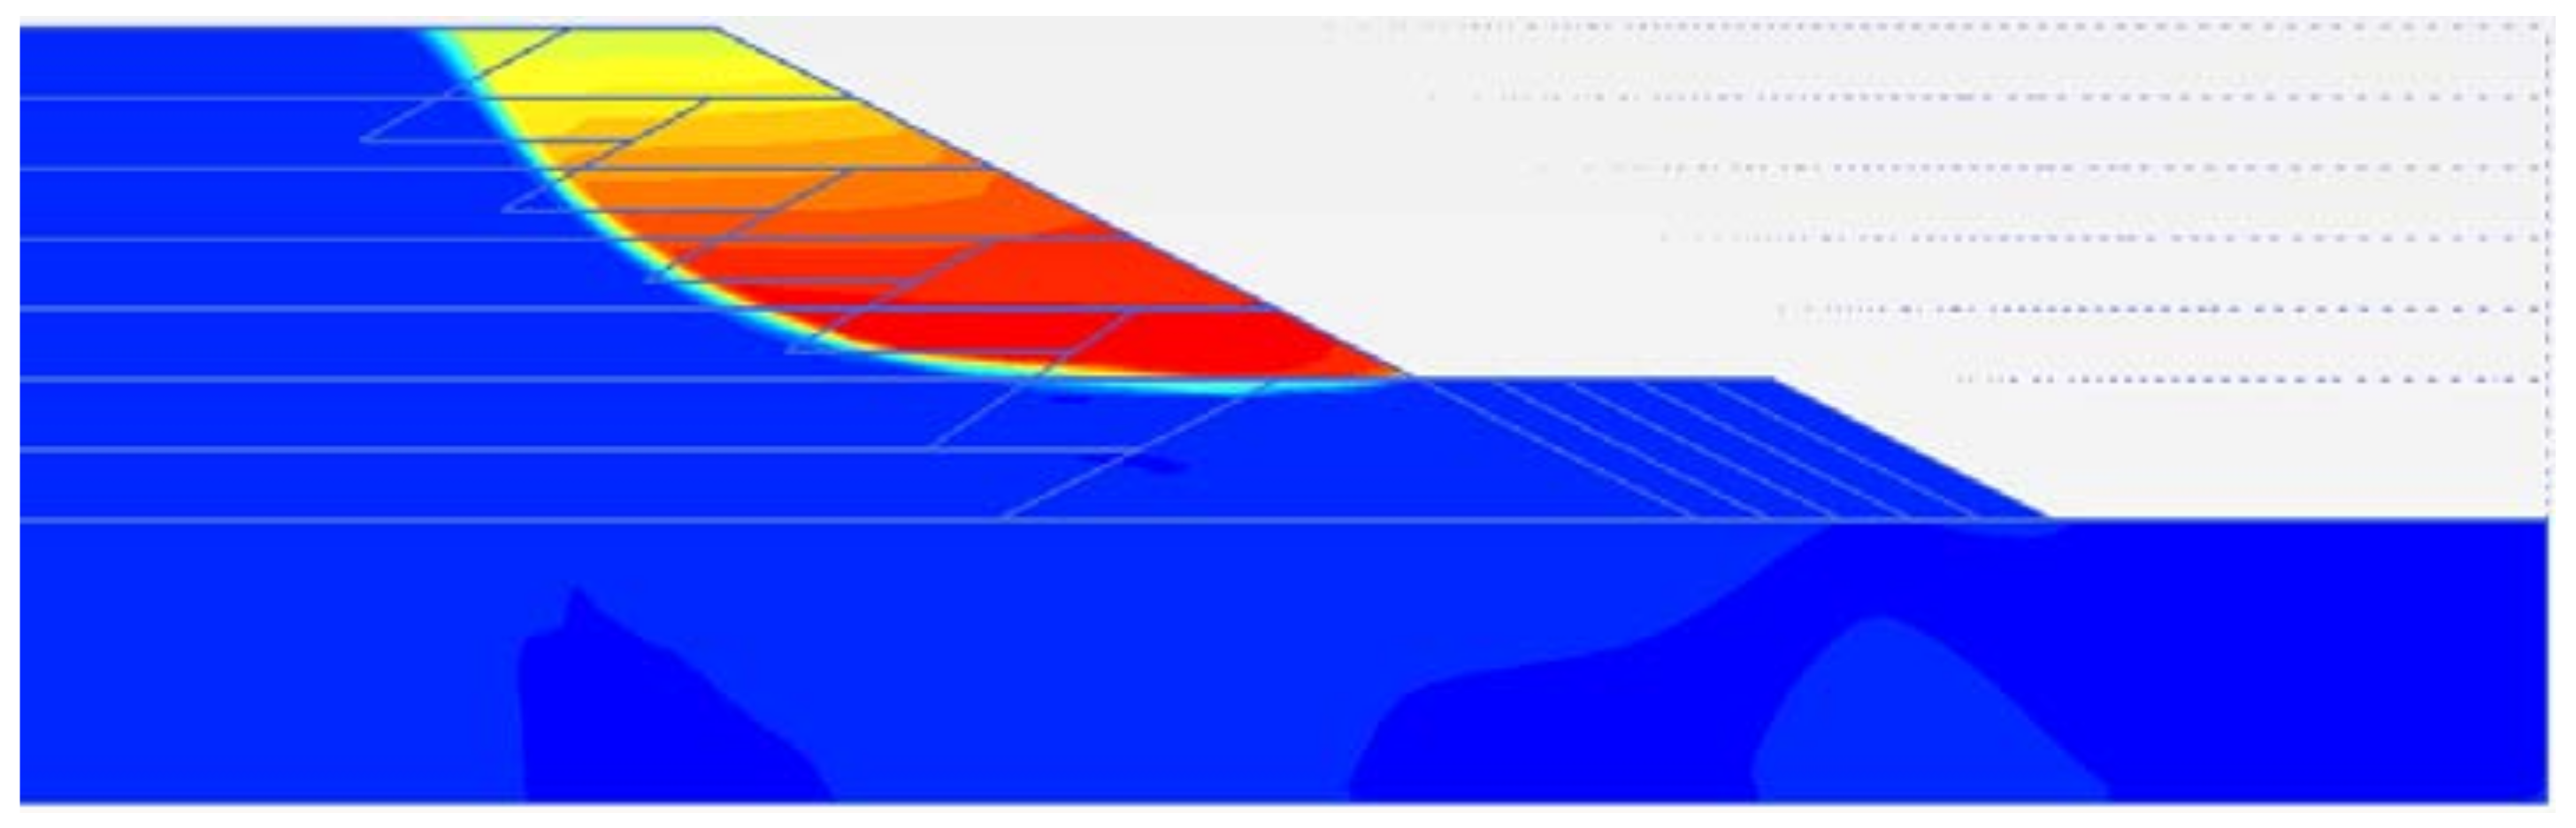
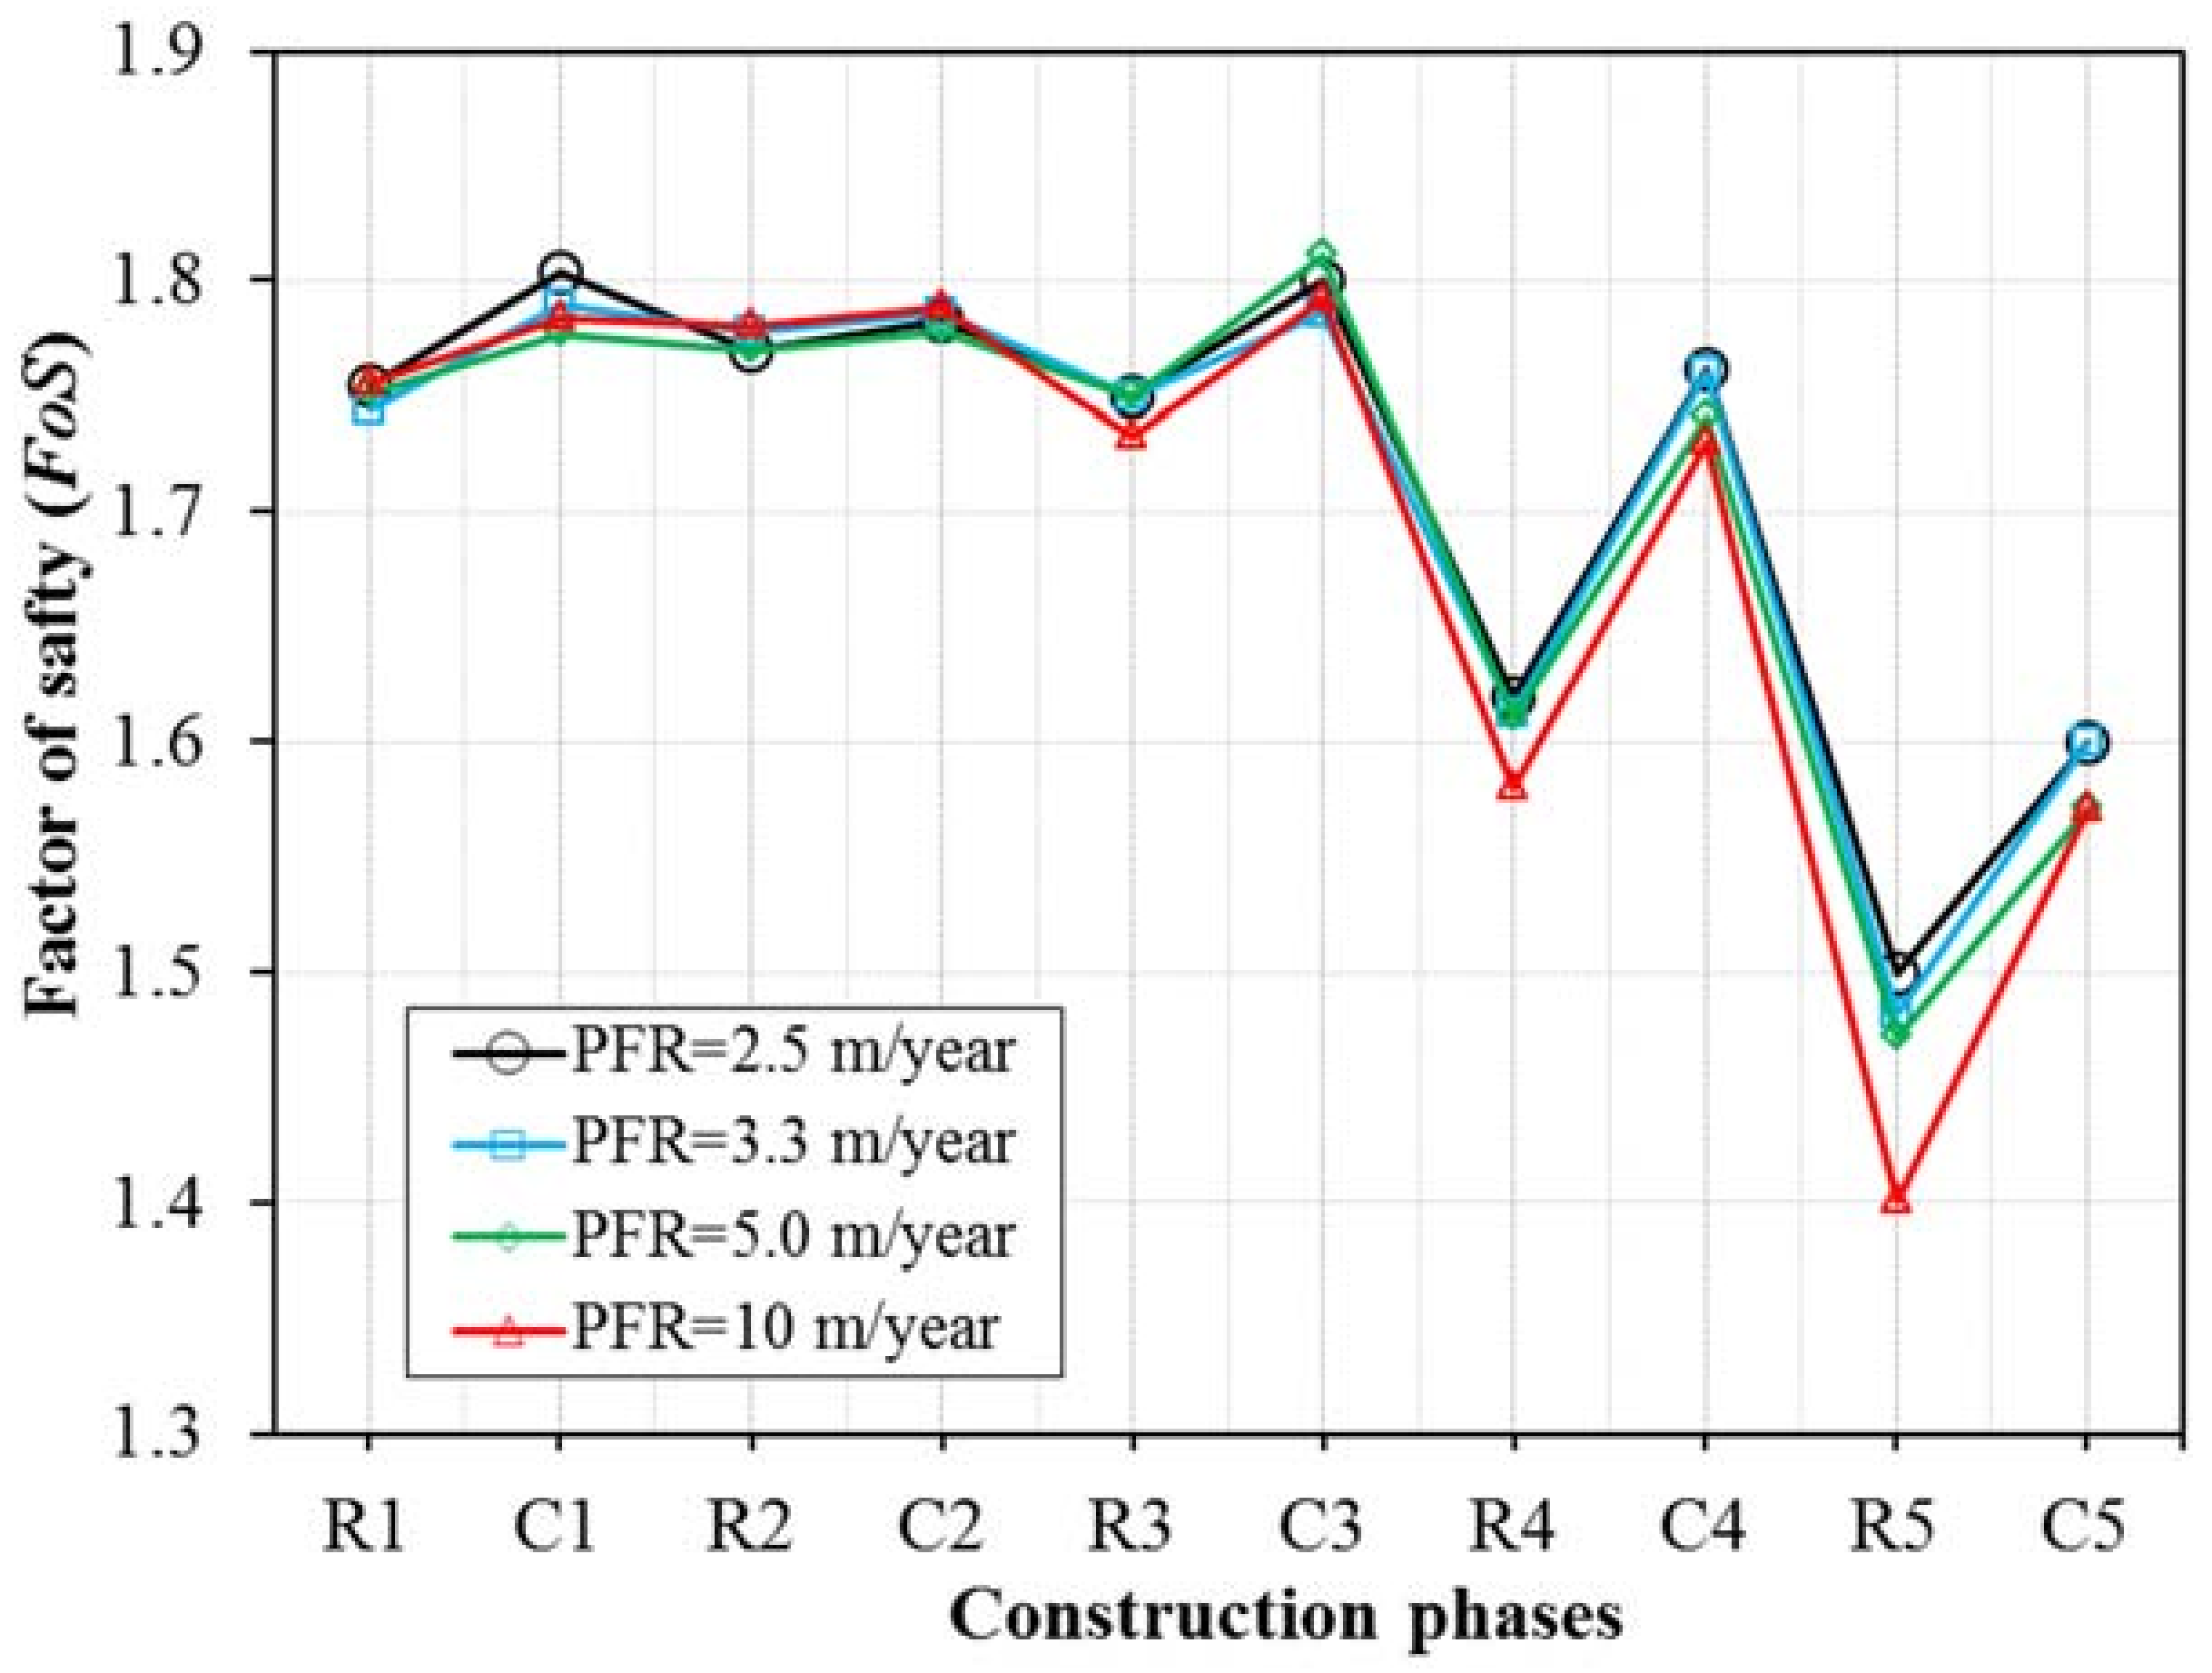
3.1. Stability Analyses

Stability analysis is an important component in the design of any earth structure, including tailings dams. Stability is usually expressed in terms of the factor of safety (FoS), which is defined as the ratio between the available shear strength of the soil and the minimum shear strength required against failure [12]. Figure 4 illustrates the factor of safety of the dam (pond filling rate of 5.0 m/year) during the pond filling, comprising raising phases (R) and consolidation phases (C). As shown, the FoS decreased gradually and dropped to less than 1.5 after the construction of three dikes of a height of 20 m from the initial pond filling level, i.e., FoS was 1.37 for R3 and 1.48 for C3. These values kept falling and even dropped to around 1.0 after the last construction stage. In addition, it was found that the FoS values decreased after every raising phase and then increased again due to the subsequent consolidation phase. This can be explained by the increase in effective stresses at the same rate as the excess pore pressure dissipates. The shear strength increases gradually during the consolidation phase. In this sense, the lowest stability of the dam is expected immediately after a new dike construction (a raising phase). This observation is similar to that of many previous studies on the stability of an upstream tailings dam [7,12,21,33]. The possible failure mechanism of the dam is shown in Figure 5. The slip surface most likely associated with the lowest FoS occurred according to Figure 5. In this case, the FoS did not meet the adopted code requirements of the Swedish dam safety guidelines. Therefore, a slope strengthening was introduced in this study to maintain the factor of safety of 1.5 at every stage of construction.
Strengthening an upstream tailings dam with rockfill berms at the downstream slope is a common technique that has been introduced and used in many previous works [7,15,21,25,33]. In this study, the width of the rockfill was optimized. The rockfill width was increased in the models (with the rockfill widths of 5 m, 10 m, 15 m, and 20 m) until no FoS became smaller than approximately 1.5 at every stage. The factors of safety for all the cases can be observed in Figure 6. These observed factors of safety were higher than those from the upstream tailings dam without rockfill berms. The weight of the rockfill berms placed next to the dikes could provide a resisting moment which increases the slope stability. As expected in all the cases, the FoS values decreased after every raising phase and then increased again due to the subsequent consolidation phase, regardless of rockfill widths. This trend is found to be similar to that in Figure 4. In conclusion, the rockfill width of 20 m should be used to keep the dam stable enough (FoS ≥ 1.5) for the pond filling rate of 5.0 m/year.

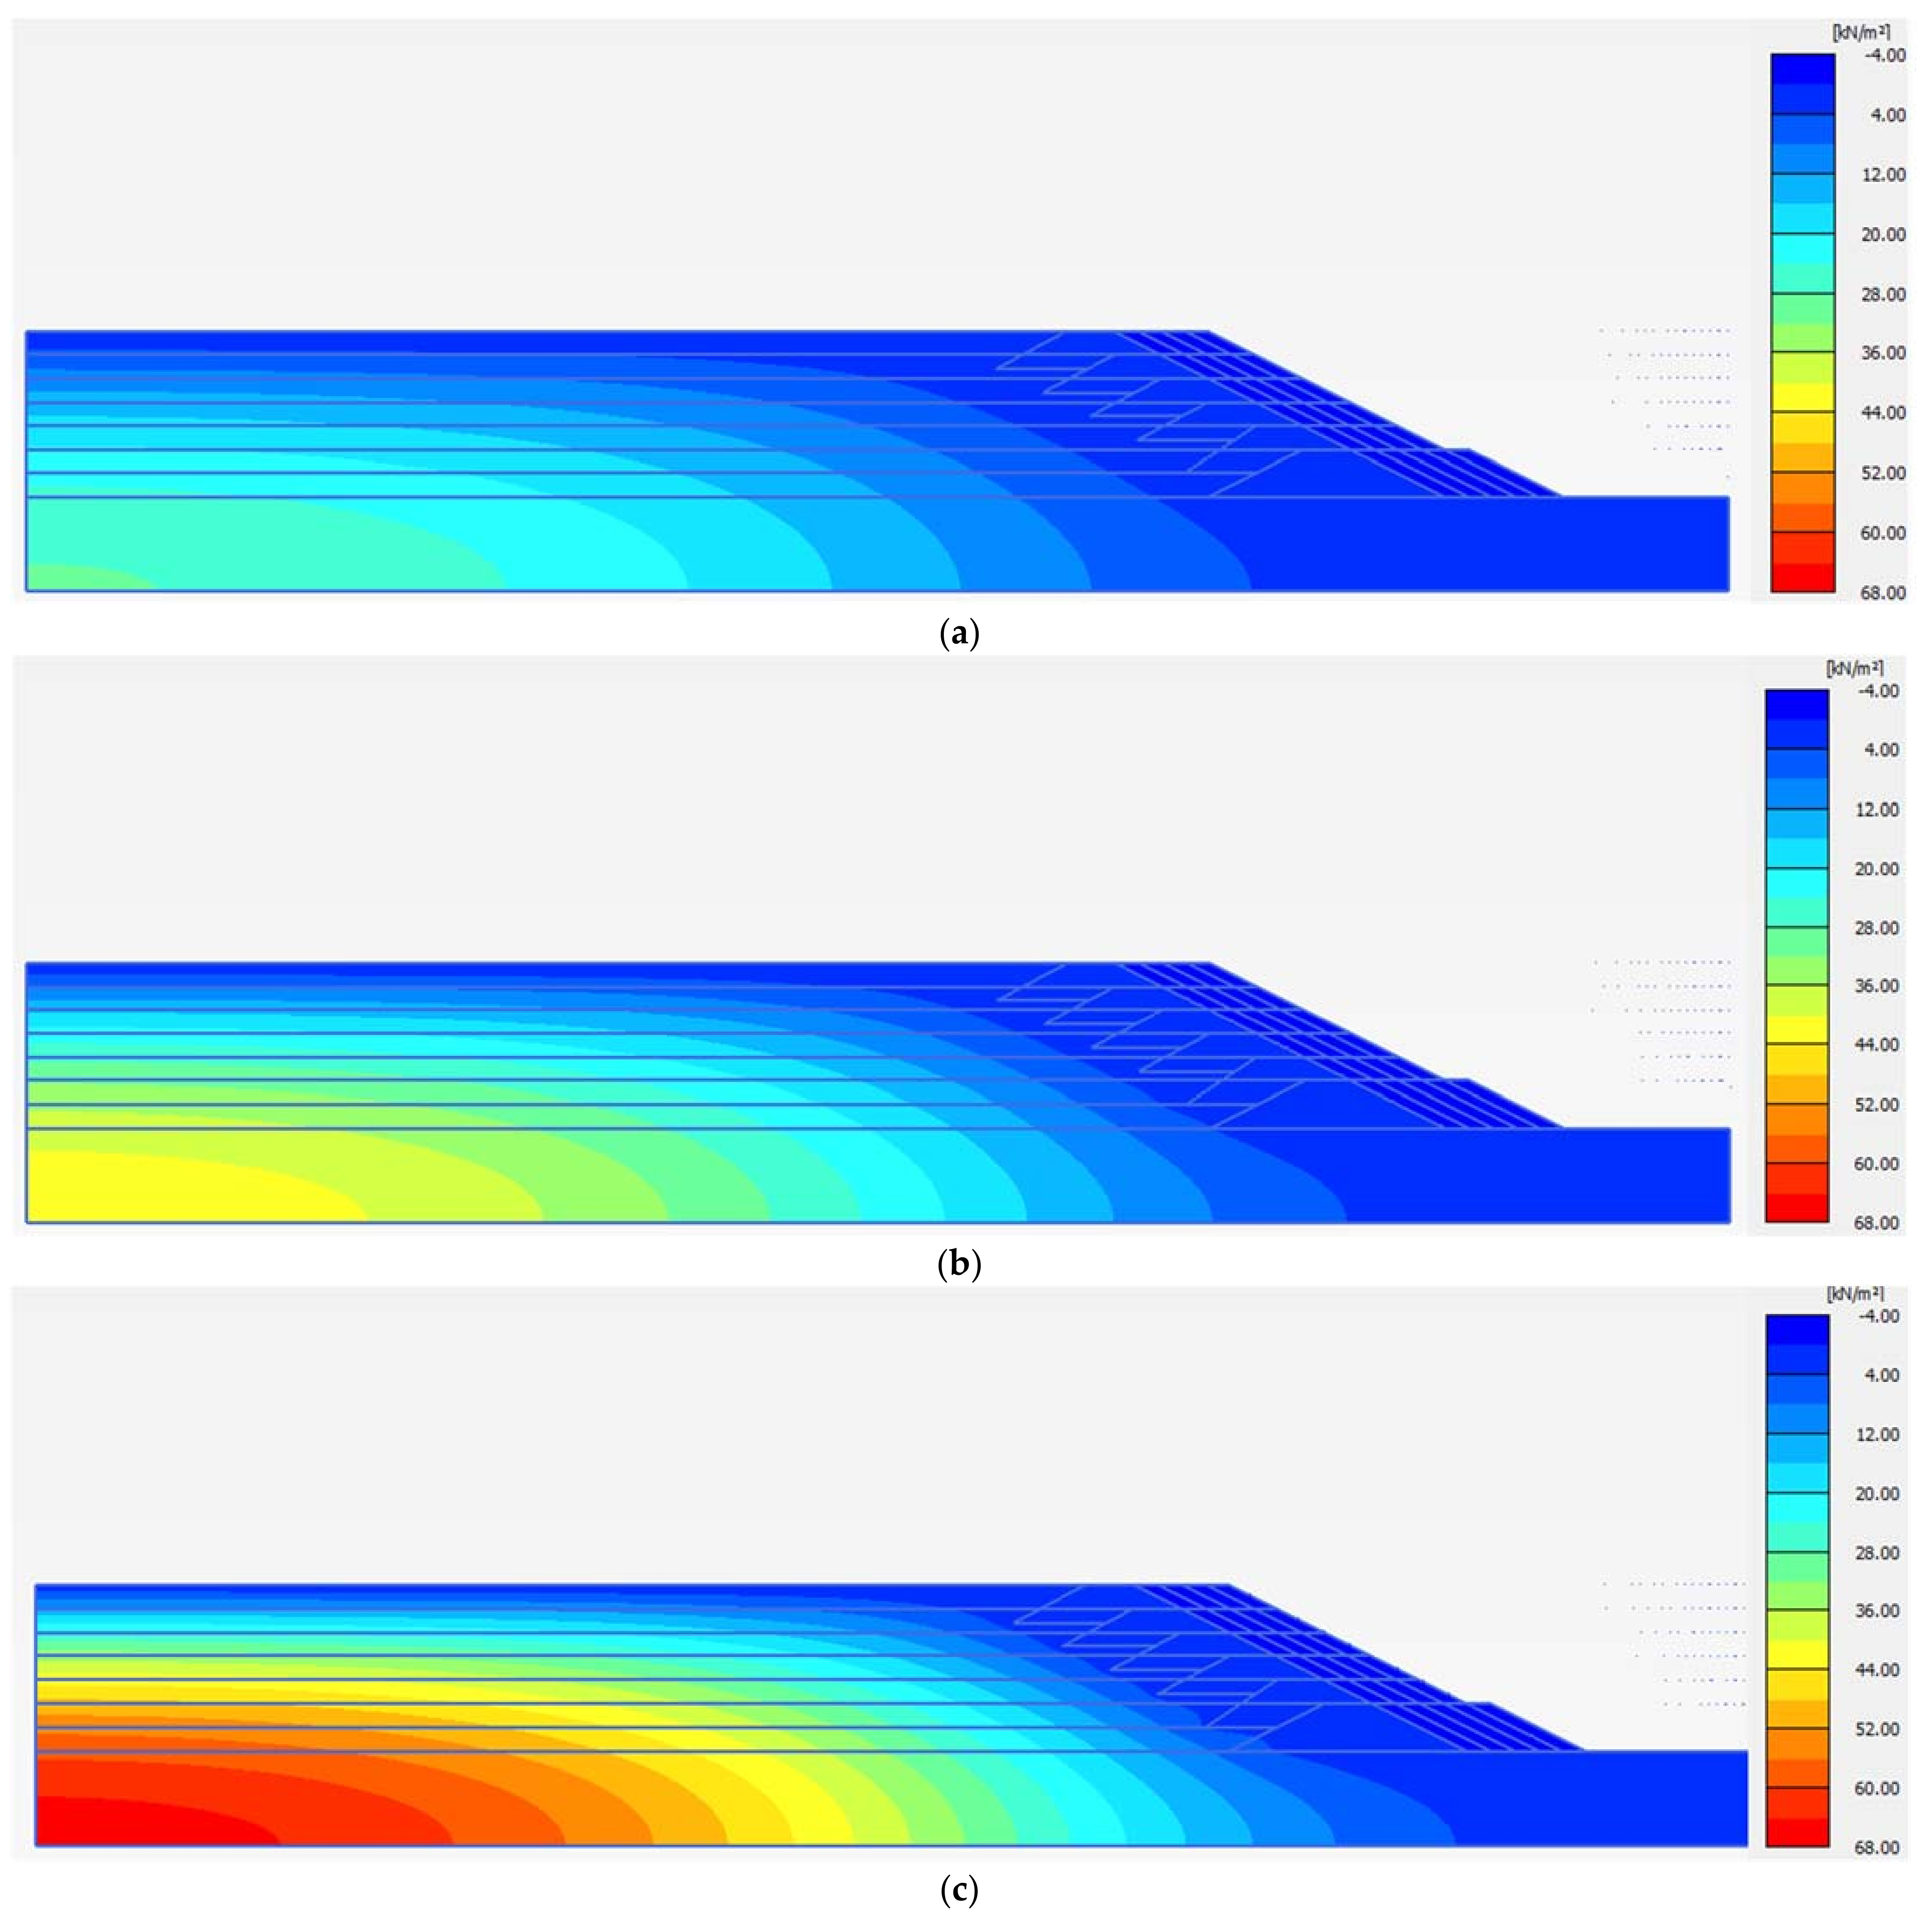
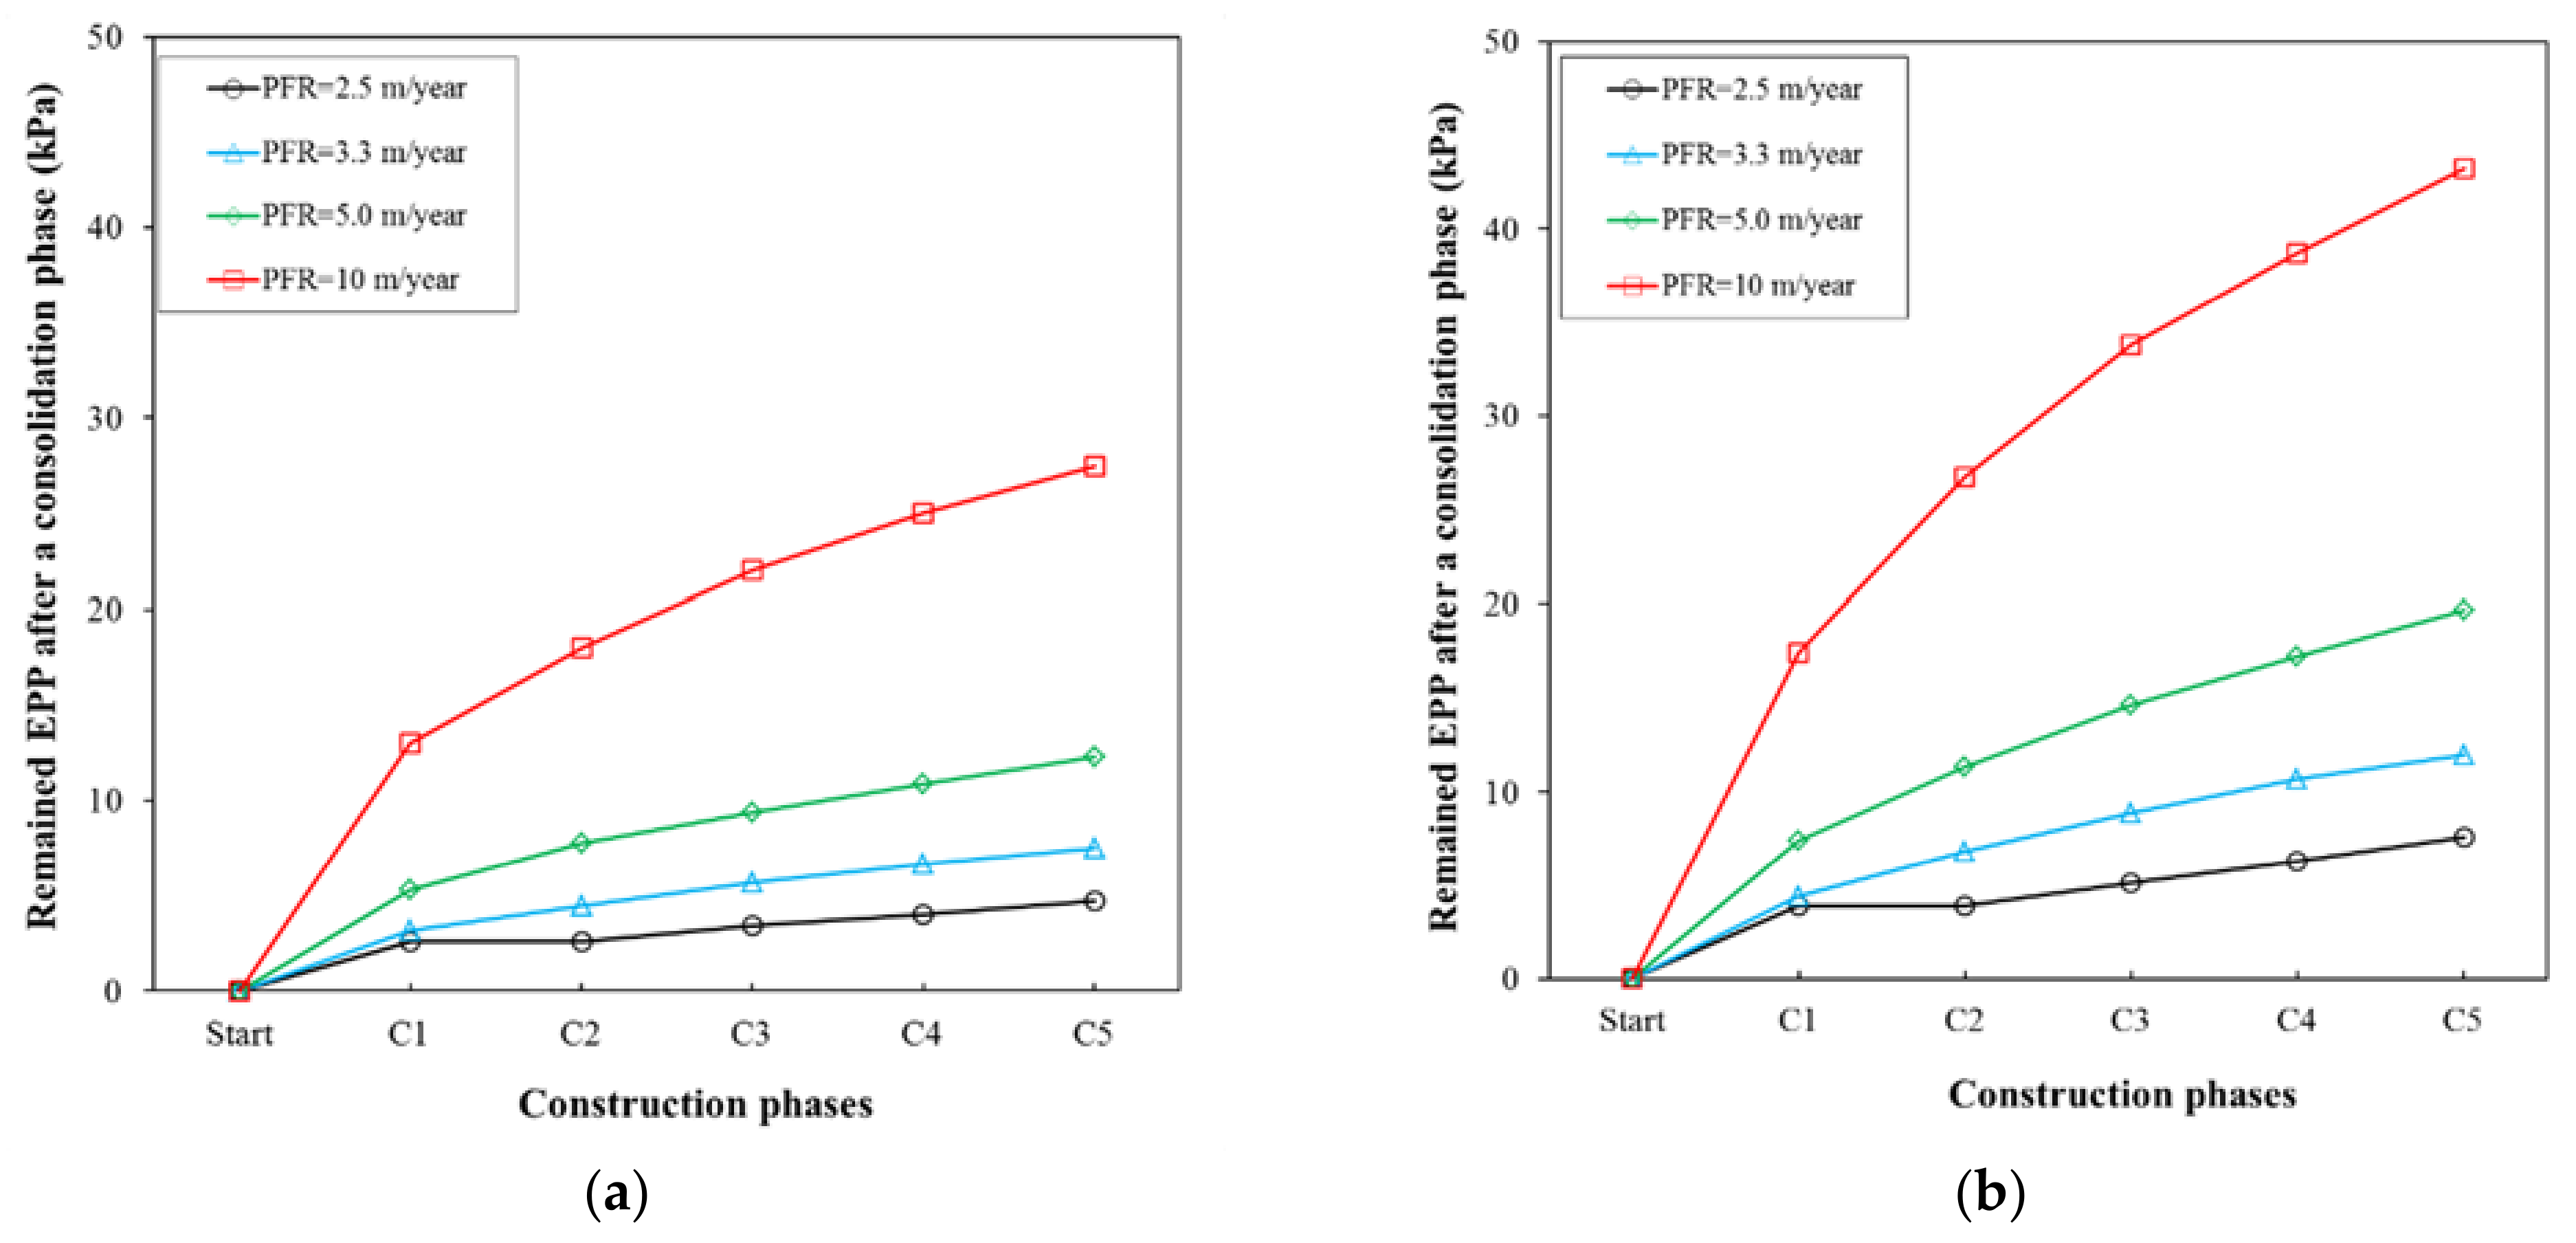
3.2. Excess Pore Water Pressure Analyses

Figure 7 shows the excess pore water pressure at the last construction stage (filling rate of 2.5 m/year and rockfill width of 20 m). There was a relatively high excess pore pressure in some zones beneath the dikes after the raising phase R5 (Figure 7a). However, this pressure decreased significantly after the consolidation phase C5 (Figure 7b). The remaining high excess pore pressure after the consolidation phase C5 occurred in the lower part of the impoundment but further away from the dam. This is due to the presence of the impermeable base in the finite element model. The trend of the excess pore water pressure distribution observed in this study is similar to that reported by Ormann et al. [7] and Saad and Mitri [14], i.e., larger remaining excess pore pressure after a consolidation phase occurred in the lower part of the impoundment but farther away from the dam.

3.3. Effects of the Pond Filling Rates on the Stability and Excess Pore Water Pressure

Figure 8 shows the effect of the pond filling rates (PFR) on the stability of the upstream tailings dam with the rockfill width of 20 m during the pond filling, comprising raising phases (R) and consolidation phases (C). As shown, the FoS decreased very slightly when the PFR increased from 2.5 m/year to 5.0 m/year, regardless of construction phases. At the pond filling rate of 5.0 m/year, the factor of safety of the dam at every stage of construction fulfilled the adopted code requirement of the Swedish dam safety guidelines, except for the raising phase R5 (FoS at R5 was 1.472). However, when the PFR increased from 5.0 m/year to 10 m/year, the FoS suddenly dropped to 1.40 at the raising phase R5. Thus, the FoS did not satisfy the abovementioned requirement, which might be a sign of potential instability issues for the dam.
Figure 9 shows excess pore water pressure after the last consolidation phase C5 with respect to the pond filling rates. For the ease of interpretation, the shading views of excess pore water pressure in Figure 9 are fixed at the same color intervals, except for the model with the pond filling rate of 10 m/year. As shown, an effect of the pond filling rate on excess pore water pressure was discovered: an increase in pond filling rate can lead to an increase in excess pore water pressure in the model. In particular, the maximum excess pore water pressure in the model with the pond filling rate of 2.5 m/year was 29 kPa. This value rose up to 43 kPa, 68 kPa, and 138 kPa in the models with the pond filling rates of 3.3 m/year, 5.0 m/year, and 10 m/year, respectively. In cases of high pond filling rates, there was less time for the excess pore pressure to dissipate during consolidation.
In addition, excess pore water pressure which developed along cross sections A–A’ and B–B’ (defined in Figure 1b) are plotted in Figure 10. Excess pore water pressure increased with an increase in the PFR, regardless of the cross sections analyzed. Take the elevation of 5 m from the initial ground level as an example: at the section A–A’, excess pore water pressure in the model with the pond filling rate of 2.5 m/year had the lowest value of 4.65 kPa, followed by 7.50 kPa (PFR = 3.3 m/year), 12.25 kPa (PFR = 5.0 m/year), and 27.25 kPa (PFR = 10 m/year). Similarly, at the cross section B–B’ at 5 m height, excess pore water pressure in the models with the pond filling rates of 2.5 m/year, 3.3 m/year, 5.0 m/year, and 10 m/year were 7.5 kPa, 12.1 kPa, 19.6 kPa, and 43.1 kPa, respectively. Interestingly, the same trend was observed at both cross sections, even though excess pore water pressure at the cross section B–B’ was higher than the corresponding excess pore water pressure at the cross section A–A’. It should be noted that cross section A–A’ had a draining distance shorter than cross section B–B’. It was also found from Figure 10 that excess pore water pressure decreased with increased heights from the initial ground level, regardless of the PFR and sections. This is because of the presence of the impermeable base in the finite element model.
Finally, the build-up of excess pore pressure (EPP) was also considered in this study. Figure 11 shows the basic concept of excess pore water pressure build-up during the stage of construction at point B and PFR = 10 m/year. As shown, the excess pore water pressure increased after every raising phase and then decreased after every consolidation phase which followed. Again, this finding supports the abovementioned stability analyses, that is, the FoS values decrease after raising phases and then increase again after consolidation phases. More importantly, it is worth observing that EPP remained after every pond filling step (i.e., after consolidation phases C1, C2, C3, C4, and C5). The remaining EPP were built up until the last phase of consolidation C5. Based on this concept, the EPP build-up during the stage of construction with respect to pond filling rates (PFR) is presented in Figure 12. Typical points A and B (in Figure 1b) were selected for the analyses. As shown, the build-up of excess pore water pressure was dependent on the PFR. Take point B in Figure 12b as an example: when the PFR was small (i.e., PFR = 2.5 m/year), the remaining EPP were EPPC1 = 3.9 kPa, EPPC2 = 4.0 kPa, EPPC3 = 5.1 kPa, EPPC4 = 6.3 kPa, and EPPC5 = 7.6 kPa after the consolidation phases C1, C2, C3, C4, and C5, respectively. The remaining EPP, in this case, was built up, reaching only a small value of 7.6 kPa (EPPC5) after the last consolidation phase C5. However, higher values of EPPC5 were found when the PFR was higher (i.e., 12.0 kPa, 19.7 kPa, and 43.2 kPa for the cases with PFR = 3.3 m/year, PFR = 5.0 m/year, and PFR = 10.0 m/year). The same effect of the pond filling rates on the EPP build-up during the stage of construction can be observed in the results of point A (Figure 12a).

4. Discussion

It is concluded by Ormann et al. [7] that the stability of an upstream tailings dam could be improved by utilizing rockfill berms as supports on the downstream side. The stability analyses obtained in this study agree with this conclusion; refer, for example, to Figure 4 and Figure 6. In addition, it was found from this study that, in order to keep the stability of an upstream tailings dam, the exceptionally high pond filling rate is not recommended. However, the recommendation is only applicable in the case of 20 m rockfill width and the tailings type used in this study. In practice, larger rockfill width could be added next to dikes or on the downstream side to enhance the slope stability and hold the production speed. In this case, key questions remain to be answered: (i) which design of rockfill berms is needed for different production speeds to maintain the stability of a tailings dam, and (ii) how can the volume of rockfill berms be minimized (i.e., for minimum cost) while still maintaining the stability and production speed?
In practice, an upstream tailings dam is typically constructed by placing dikes on top of previously deposited soft saturated tailings, which could lead to the excess pore water pressure gradually increasing during pond filling and dam raising. Therefore, an adequate pond filling rate is required to allow excess pore water pressure to dissipate gradually during the consolidation process. The numerical results from this study showed that excess pore water pressure increased in each raising phase and decreased in the subsequent consolidation phase. However, some of the excess pore water pressure remained after every consolidation phase (i.e., the build-up of excess pore water pressure) (Figure 11). The build-up excess pore water pressure varied depending on the pond filling rates. The dam with a high pond filling rate had a shorter time for the excess pore pressure to dissipate during every consolidation phase than the dam with low ones. Therefore, the highest value was found in the dam with the pond filling rate of 10 m/year in this study (Figure 12).
Even though the numerical results obtained are encouraging, some additional work will need to be performed in the future to simulate other conditions involved in the responses of an upstream tailings dam under cyclic and seismic loading.

5. Conclusions

In this study, a numerical analysis of an upstream tailings dam subjected to pond filling rates was conducted. A finite element software was used to simulate the time-dependent pond filling process and the staged dam construction under various pond filling rates. An advanced constitutive model was adopted in the finite element models to capture the nonlinearity in the elastic deformations of the tailings materials. Based on the results of this study, the following conclusions can be drawn:
  • Excess pore water pressure increased after every raising phase and then decreased after every subsequent consolidation phase in the numerical models. However, excess pore water pressure remained after every consolidation phase, leading to the build-up of excess pore water pressure and, eventually, a potentially critical situation in the stability of the dam (i.e., especially for the dam without strengthening).
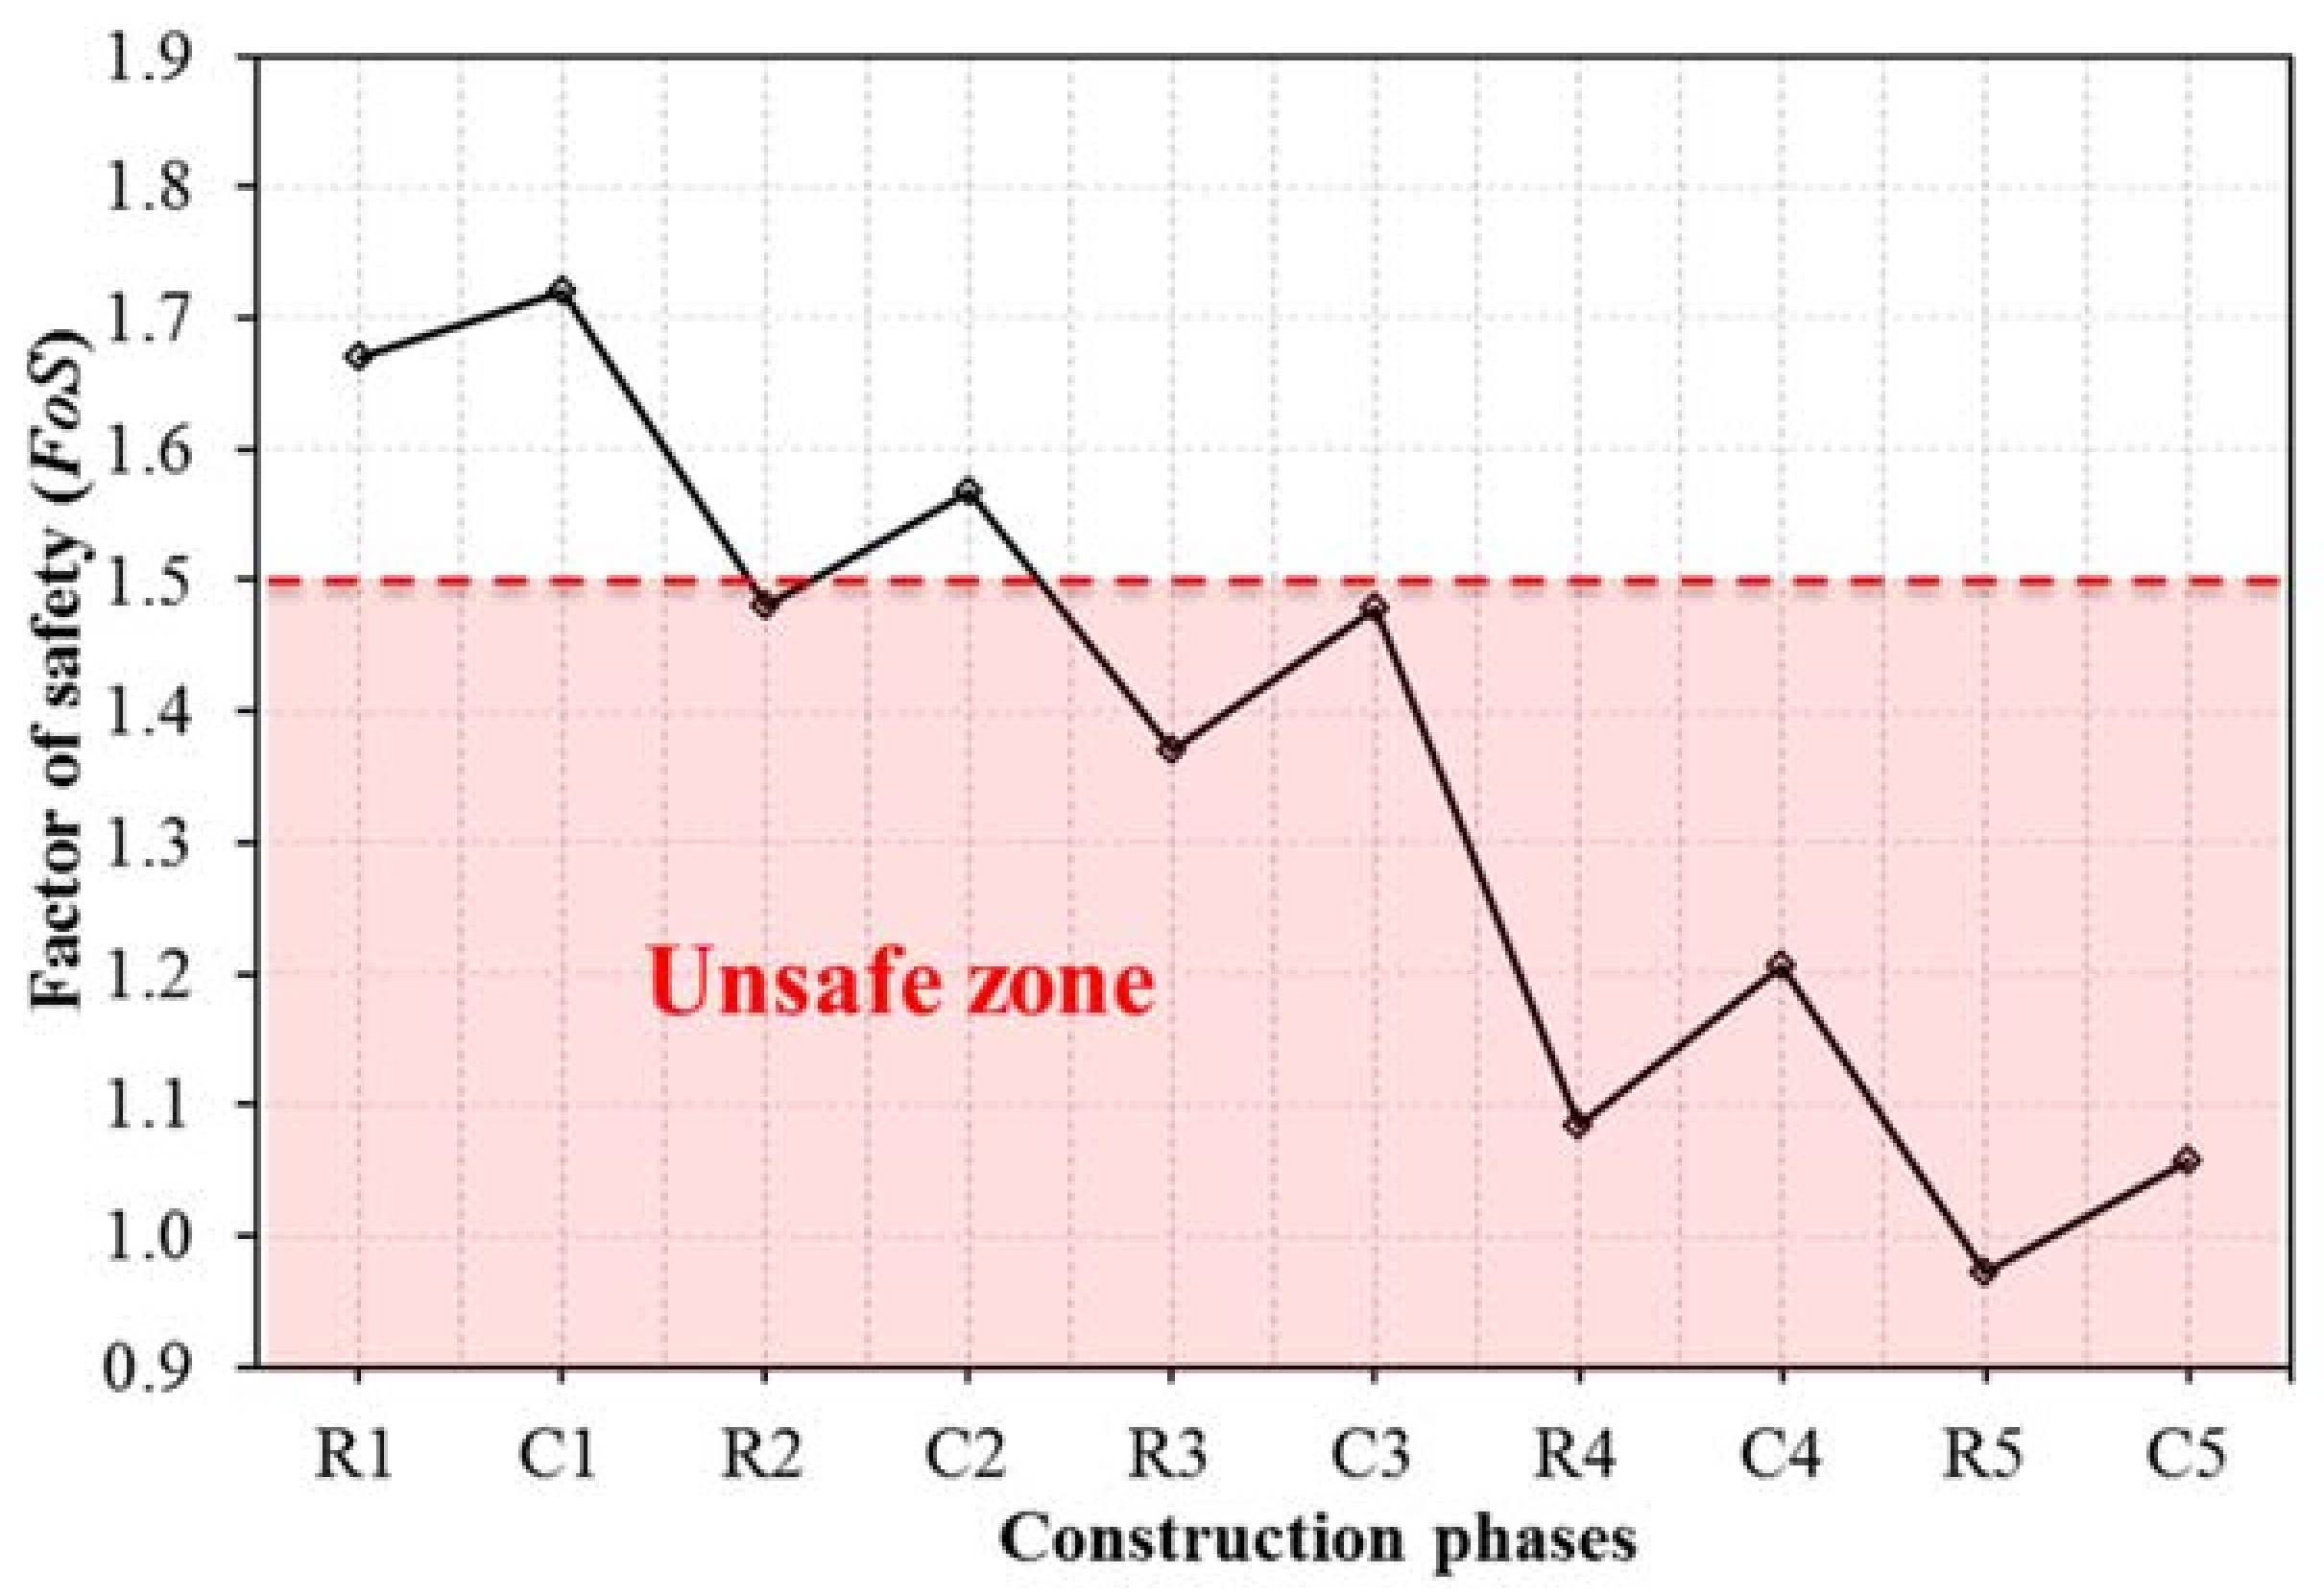
  • The stability of the dam decreased during the raising phase but increased during the consolidation phase. This is due to the changes of excess pore water pressure, i.e., increased values with the raising phase and decreased values with the consolidation phase. In addition, it is also vital to mention that the strengthening of an upstream tailings dam with rockfill berms at the downstream slope could improve the stability of the dam.
    The basic concept of excess pore water pressure build-up during the stage of construction was presented based on the remaining excess pore water pressure after every consolidation phase. The remaining excess pore water pressure varied depending on the pond filling rates, being larger in high filling rates and smaller in low filling rates. A very high pond filling rate is, therefore, not recommended for an upstream tailings dam as the dissipation of excess pore water pressure usually takes a long time.
  • This study provided an in-depth analysis of the build-up of excess pore water pressure and slope stability during the stage of construction (pond filling and dam raising) of an upstream tailings dam. It is believed that the finite element method could be used to study how an upstream tailings dam should be built in order to be stable for different pond filling rates.

Author Contributions

Conceptualization, T.M.D.; J.L.; H.M.; methodology, T.M.D.; J.L.; software, T.M.D.; H.M.; validation, T.M.D.; J.L.; H.M.; Q.J.; formal analysis, T.M.D.; J.L.; H.M.; investigation, T.M.D.; J.L.; H.M.; writing—original draft preparation, T.M.D.; writing—review and editing, T.M.D.; J.L.; H.M.; Q.J.; supervision, J.L.; H.M.; Q.J.; project administration, J.L.; funding acquisition, J.L. All authors have read and agreed to the published version of the manuscript.

Funding

This research was funded by Svenskt Vattenkraftcentrum, SVC (“The Swedish Hydropower Center”).

Data Availability Statement

Not applicable.

Acknowledgments

The research presented in this paper was carried out as a part of the Swedish Hydropower Center (Svenskt Vattenkraftcentrum, SVC). SVC has been established by the Swedish Energy Agency, Energiforsk, and Svenska Kraftnät, together with the Luleå University of Technology, KTH Royal Institute of Technology, Chalmers University of Technology, Uppsala University, and Lund University. The participating companies and industry associations are: Andritz Hydro, Boliden, Fortum Sweden, Holmen Energi, Jämtkraft, Karlstads Energi, LKAB, Mälarenergi, Norconsult, Rainpower, Skellefteå Kraft, Sollefteåforsens, Statkraft Sverige, Sweco Sverige, Tekniska verken i Linköping, Uniper, Vattenfall R&D, Vattenfall Vattenkraft, Voith Hydro, WSP Sverige, Zink-gruvan, and ÅF Industry. This research was funded by SVC and the Luleå University of Technology.

Conflicts of Interest

The authors declare no conflict of interest.

Abbreviations

PFRPond filling rate
EPPExcess pore water pressure
RRaising phase
CConsolidation phase
XminBoundary at the left vertical edge
YminBoundary at the bottom
FoSFactor of safety
M-CMohr–Coulomb model
γunsatSoil unit weight above phreatic level
γsatSoil unit weight below phreatic level
EYoung’s modulus
c’Effective soil cohesion
φ’Effective friction angle
kxHorizontal hydraulic conductivity
kyVertical hydraulic conductivity
KGeElastic shear modulus number
KGpPlastic shear modulus number
KBeElastic bulk modulus number
meElastic bulk modulus index
neElastic shear modulus index
npPlastic shear modulus index
ɸvConstant volume friction angle
ɸpPeak friction angle
υPoisson’s ratio
ψDilatancy angle

References

  1. Kossoff, D.; Dubbin, W.E.; Alfredsson, M.; Edwards, S.J.; Macklin, M.G.; Hudson-Edwards, K.A. Mine tailings dams: Characteristics, failure, environmental impacts, and remediation. Appl. Geochem. 2014, 51, 229–245. [Google Scholar] [CrossRef] [Green Version]
  2. Davies, M.; Martin, T.; Lighthall, P. Mine tailings dams: When things go wrong. In Tailings Dams; Association of State Dam Safety Officials, U.S. Committee on Large Dams: Las Vegas, NV, USA, 2000; pp. 261–273. [Google Scholar]
  3. Vick, S.G. Planning, Design, and Analysis of Tailings Dams; Wiley: New York, NY, USA, 1990. [Google Scholar]
  4. Dixon-Hardy, D.W.; Engels, J.M. Guidelines and recommendations for the safe operation of tailings management facilities. Environ. Eng. Sci. 2007, 24, 625–637. [Google Scholar] [CrossRef]
  5. Wills, B.A.; Finch, J.A. Tailings Disposal. In Wills’ Mineral Processing Technology, 8th ed.; Wills, B.A., Finch, J.A., Eds.; Butterworth-Heinemann: Boston, MA, USA, 2016; pp. 439–448. [Google Scholar]
  6. Wei, Z.A.; Yin, G.Z.; Wan, L.; Li, G.Z. A case study on a geotechnical investigation of drainage methods for heightening a tailings dam. Environ. Earth Sci. 2016, 75, 106. [Google Scholar] [CrossRef]
  7. Ormann, L.; Zardari, M.A.; Mattsson, H.; Bjelkevik, A.; Knutsson, S. Numerical analysis of strengthening by rockfill embankments on an upstream tailings dam. Can. Geotech. J. 2013, 50, 391–399. [Google Scholar] [CrossRef]
  8. Somogyi, F. Large strain consolidation of fine-grained slurries. In Proceedings of the Canadian society for civil engineering, Annual Conference, Manitoba, OT, Canada, 9–12 June 1980. [Google Scholar]
  9. Gassner, F.W.; Fourie, A.B. Optimising the allowable rate of deposition on tailings dams. In Proceedings of the Fifth International Conference on Tailings and Mine Waste ‘98, Fort Collins, CO, USA, 26–28 January 1998; pp. 241–248. [Google Scholar]
  10. Mittal, H.K.; Morgenstern, N.R. Seepage control in tailings dams. Can. Geotech. J. 1976, 13, 277–293. [Google Scholar] [CrossRef]
  11. Ormann, L.; Zardari, M.A.; Mattsson, H.; Bjelkevik, A.; Knutsson, S. Numerical analysis of curved embankment of an upstream tailings dam. Electron. J. Geotech. Eng. 2011, 16, 931–944. [Google Scholar]
  12. Psarropoulos, P.N.; Tsompanakis, Y. Stability of tailings dams under static and seismic loading. Can. Geotech. J. 2008, 45, 663–675. [Google Scholar] [CrossRef]
  13. Zandarín, M.T.; Oldecop, L.A.; Rodríguez, R.; Zabala, F. The role of capillary water in the stability of tailing dams. Eng. Geol. 2009, 105, 108–118. [Google Scholar] [CrossRef]
  14. Saad, B.; Mitri, H. Hydromechanical analysis of upstream Tailings disposal facilities. J. Geotech. Geoenviron. Eng. 2011, 137, 27–42. [Google Scholar] [CrossRef]
  15. Zardari, M.A.; Mattsson, H.; Knutsson, S.; Khalid, M.S.; Ask, M.; Lund, B. Numerical analyses of earthquake induced liquefaction and deformation behaviour of an upstream tailings dam. Adv. Mater. Sci. Eng. 2017, 1–12. [Google Scholar] [CrossRef] [Green Version]
  16. Zardari, M.A.; Mattsson, H.; Knutsson, S. 3D finite element analyses of a corner at Aitik tailings dam in Sweden. In Proceedings of the International symposium on Environmental Issues and Waste Management in Energy and Mineral Production, New Delhi, India, 28–30 November 2012. [Google Scholar]
  17. Zardari, M.A.; Mattsson, H.; Knutsson, S.; Ormann, L. Comparison of three dimensional and two dimensional axisymmetric finite element analyses of a corner section of a tailings dam. Sci. Iran. 2017, 24, 2320–2331. [Google Scholar]
  18. Liu, C.; Shen, Z.; Gan, L.; Xu, L.; Zhang, K.; Jin, T. The seepage and stability performance assessment of a new drainage system to increase the height of a tailings dam. Appl. Sci. 2018, 8, 1840. [Google Scholar] [CrossRef] [Green Version]
  19. Martin, T.E.; McRoberts, E.C. Some Considerations in the Stability Analysis of Upstream Tailings Dams; AGRA Earth & Environmental Limited: Burnaby, BC, Canada, 2002. [Google Scholar]
  20. Brinkgreve, R.; Swolfs, W.; Engin, E.; Waterman, D.; Chesaru, A.; Bonnier, P.; Galavi, V. PLAXIS 2D Reference Manual; Delft University of Technology and PLAXIS, B.V.: Delft, The Netherlands, 2018. [Google Scholar]
  21. Knutsson, R.; Viklander, P.; Knutsson, S. The use of numerical modelling in alert level set-up for instrumentation in tailings dams. In Proceedings of the ICOLD Congress 2015: International Commission on Large Dams, Stavanger, Norway, 14–20 June 2015. [Google Scholar]
  22. Lee, K.; Ko, J.; Lim, H.; Lee, J.K. Stability numbers for unsupported conical excavations in multi-layered cohesive soils. Appl. Sci. 2020, 10, 8839. [Google Scholar] [CrossRef]
  23. Griffiths, D.V.; Marquez, R.M. Three-dimensional slope stability analysis by elasto-plastic finite elements. Géotechnique 2007, 57, 537–546. [Google Scholar] [CrossRef] [Green Version]
  24. Griffiths, D.V.; Lane, P.A. Slope stability analysis by finite elements. Géotechnique 1999, 49, 387–403. [Google Scholar] [CrossRef]
  25. Hassellund, L.; Knutsson, R.; Mattsson, H.; Knutsson, S. Numerical simulations of stability of a gradually raised upstream tailings dam in northern Sweden. Electron. J. Geotech. Eng. 2016, 21, 4699–4720. [Google Scholar]
  26. GruvRIDAS. The Mining Industry’s Guidelines for Dam Safety; Svensk Energi AB/SveMin: Stockholm, Sweden, 2007. (In Swedish) [Google Scholar]
  27. Beaty, M.H.; Byrne, P.M. UBCSAND Constitutive Model Version 904ar; Itasca UDM: Minneapolis, MN, USA, 2011. [Google Scholar]
  28. Wiklund, V. Fines Content and Density Effects on Tailings Behaviour: A Laboratory Study on Geotechnical Properties; Luleå University of Technology: Luleå, Sweden, 2018. [Google Scholar]
  29. Askarinejad, A.; Zhang, W.; de Boorder, M.; van der Zon, J. Centrifuge and numerical modelling of static liquefaction of fine sandy slopes. Phys. Model. Geotech. 2018, 2, 1119–1124. [Google Scholar]
  30. Ferdosi, B.; James, M.; Aubertin, M. Numerical simulations of seismic and post-seismic behavior of tailings. Can. Geotech. J. 2015, 53, 85–92. [Google Scholar] [CrossRef]
  31. Jonasson, F. Geoteknisk Provtagning av Anrikningssand Damm e-F Och G-H Aitik. PM Geoteknik Uppdragsnummer 2473649; SWECO VBB: Luleå, Sweden, 2007. (In Swedish) [Google Scholar]
  32. Jonasson, F. PM Förslag på Materialparametrar för “Övriga Material” vid Beräkning i Plaxis. Uppdragsnummer 2166133310; SWECO VBB: Luleå, Sweden, 2008. (In Swedish) [Google Scholar]
  33. Hassellund, L.; Knutsson, R.; Mattsson, H.; Knutsson, S. Numerical analysis of an upstream tailings dam. In Proceedings of the Nordic Geotechnical Meeting: Challanges in Nordic Geotechnics, Reykjavik, Iceland, 25–27 May 2016; pp. 727–736. [Google Scholar]
Figure 1. Geometry of the upstream tailings dam (rockfill width of 20 m): (a) full model and (b) upscaled model (downstream part).
Applsci 11 06044 g001aApplsci 11 06044 g001b
Figure 2. Finite element mesh of the upstream tailings dam: (a) full model and (b) upscaled model (downstream part).
Applsci 11 06044 g002
Figure 3. Behavior of tailings materials during drained simple shear tests and simulations: (a) layered tailings with dry density of 1.65 t/m3 and (b) compacted tailings with dry density of 1.82 t/m3.
Applsci 11 06044 g003
Figure 4. Factor of safety (filling rate of 5.0 m/year) during the pond filling comprising both raising phases (R) and consolidation phases (C).
Applsci 11 06044 g004
Figure 5. Failure mechanism of the upstream tailings dam (filling rate of 5.0 m/year).
Applsci 11 06044 g005
Figure 6. Rockfill width optimization based on slope stability analysis (filling rate of 5.0 m/year).
Applsci 11 06044 g006
Figure 7. Excess pore water pressure at the last construction stage with the pond filling rate of 2.5 m/year and rockfill width of 20 m: (a) after the raising phase R5 and (b) after the consolidation phase C5.
Applsci 11 06044 g007aApplsci 11 06044 g007b
Figure 8. Effect of the pond filling rates (PFR) on the stability of the upstream tailings dam (rockfill width of 20 m).
Applsci 11 06044 g008
Figure 9. Excess pore water pressure after the last consolidation phase with respect to the pond filling rates: (a) 2.5 m/year, (b) 3.3 m/year, (c) 5.0 m/year, and (d) 10 m/year.
Applsci 11 06044 g009aApplsci 11 06044 g009b
Figure 10. Excess pore water pressure after the last consolidation phase C5 with respect to the pond filling rates (PFR) at sections: (a) A–A’ and (b) B–B’ (defined in Figure 1b).
Applsci 11 06044 g010
Figure 11. Concept of excess pore water pressure build-up during the stage of construction (point B and PFR = 10 m/year).
Applsci 11 06044 g011
Figure 12. Effect of the pond filling rates (PFR) on the build-up of EPP during the stage of construction at: (a) point A and (b) point B (defined in Figure 1b).
Applsci 11 06044 g012
Table 1. Parameters of Mohr–Coulomb (M-C) model.
ParameterSymbolsMoraine
(Foundation)
Moraine
(Initial Dike)
Rockfill Unit
Soil unit weight above phreatic levelγunsat202018kN/m3
Soil unit weight below phreatic levelγsat222220kN/m3
Young’s modulusE20,00020,00040,000kN/m2
Cohesionc’111kN/m2
Friction angleφ’373542degree
Horizontal hydraulic conductivitykx4.98 × 10−81.0 × 10−71 × 10−1m/s
Vertical hydraulic conductivityky1.0 × 10−84.98 × 10−81 × 10−1m/s
Table 2. Parameters of UBCSAND model.
ParameterSymbolsLayered Tailings Compacted Tailings
(Dikes)
Unit
Soil unit weight above phreatic levelγunsat1718kN/m3
Soil unit weight below phreatic levelγsat2020kN/m3
Elastic shear modulus numberKGe130130-
Plastic shear modulus numberKGp5075-
Elastic bulk modulus number KBe9191-
Elastic bulk modulus index me0.50.5-
Elastic shear modulus index ne0.50.5-
Plastic shear modulus indexnp0.40.4-
Constant volume friction angleɸv2528degree
Peak friction angle ɸp2836degree
Cohesionc’00kN/m2
Horizontal hydraulic conductivitykx1.0 × 10−71.0 × 10⁻⁶m/s
Vertical hydraulic conductivityky1 × 10−81.0 × 10⁻⁷m/s
Publisher’s Note: MDPI stays neutral with regard to jurisdictional claims in published maps and institutional affiliations.

