1. Introduction
Buffer packaging is essential for ensuring high-quality logistics services. Although the packaging is part of external quality costs, achieving an effective packaging design is essential in the industry [
1,
2]. Foamed plastics are commonly used as buffer packaging materials. However, with the rise of environmental awareness, some countries have regulated the use of foamed plastic materials [
3]. Recently, corrugated board has been favored for buffer packaging [
4,
5,
6,
7]. Biancolini [
6] proposed a numerical model to evaluate the stiffness parameters of corrugated boards; the model was used for the parametric investigation of the influence of local parameters on corrugated board panel stiffness. The results showed that the stiffness parameters were weakly controlled, acting on the fluting shape and composition. Further, design methods for corrugated board containers were reviewed, and two numerical models were developed using finite elements to evaluate the buckling and ultimate load predictions [
7].
In practice, the six-step method of cushion packaging design and MIL-HDBK-304C form the most important basis for packaging design [
8]. Product damage during delivery may occur from shock (accidental drop during handling) and vibration (bumps during transportation). Therefore, shock absorption and vibration transfer characteristics must be considered in packaging design. The dynamic buffer curve can reveal the shock ab-sorption characteristics of the buffer material. This curve shows the impact strength (maximum acceleration) of a specific buffer material with a specific thickness and height under different static stresses. The dynamic buffering curve can be used to determine the thickness and area of the buffering material in the early design stage. However, because the corrugated board is a composite made of multilayer Kraft paper and corrugated core paper, each layer may be changed owing to cost, leading to various permutations and combinations. In addition, the existing buffer material evaluation method to obtain dynamic buffer curve does not provide the final packaging solution and, thus, causes excessive packaging.
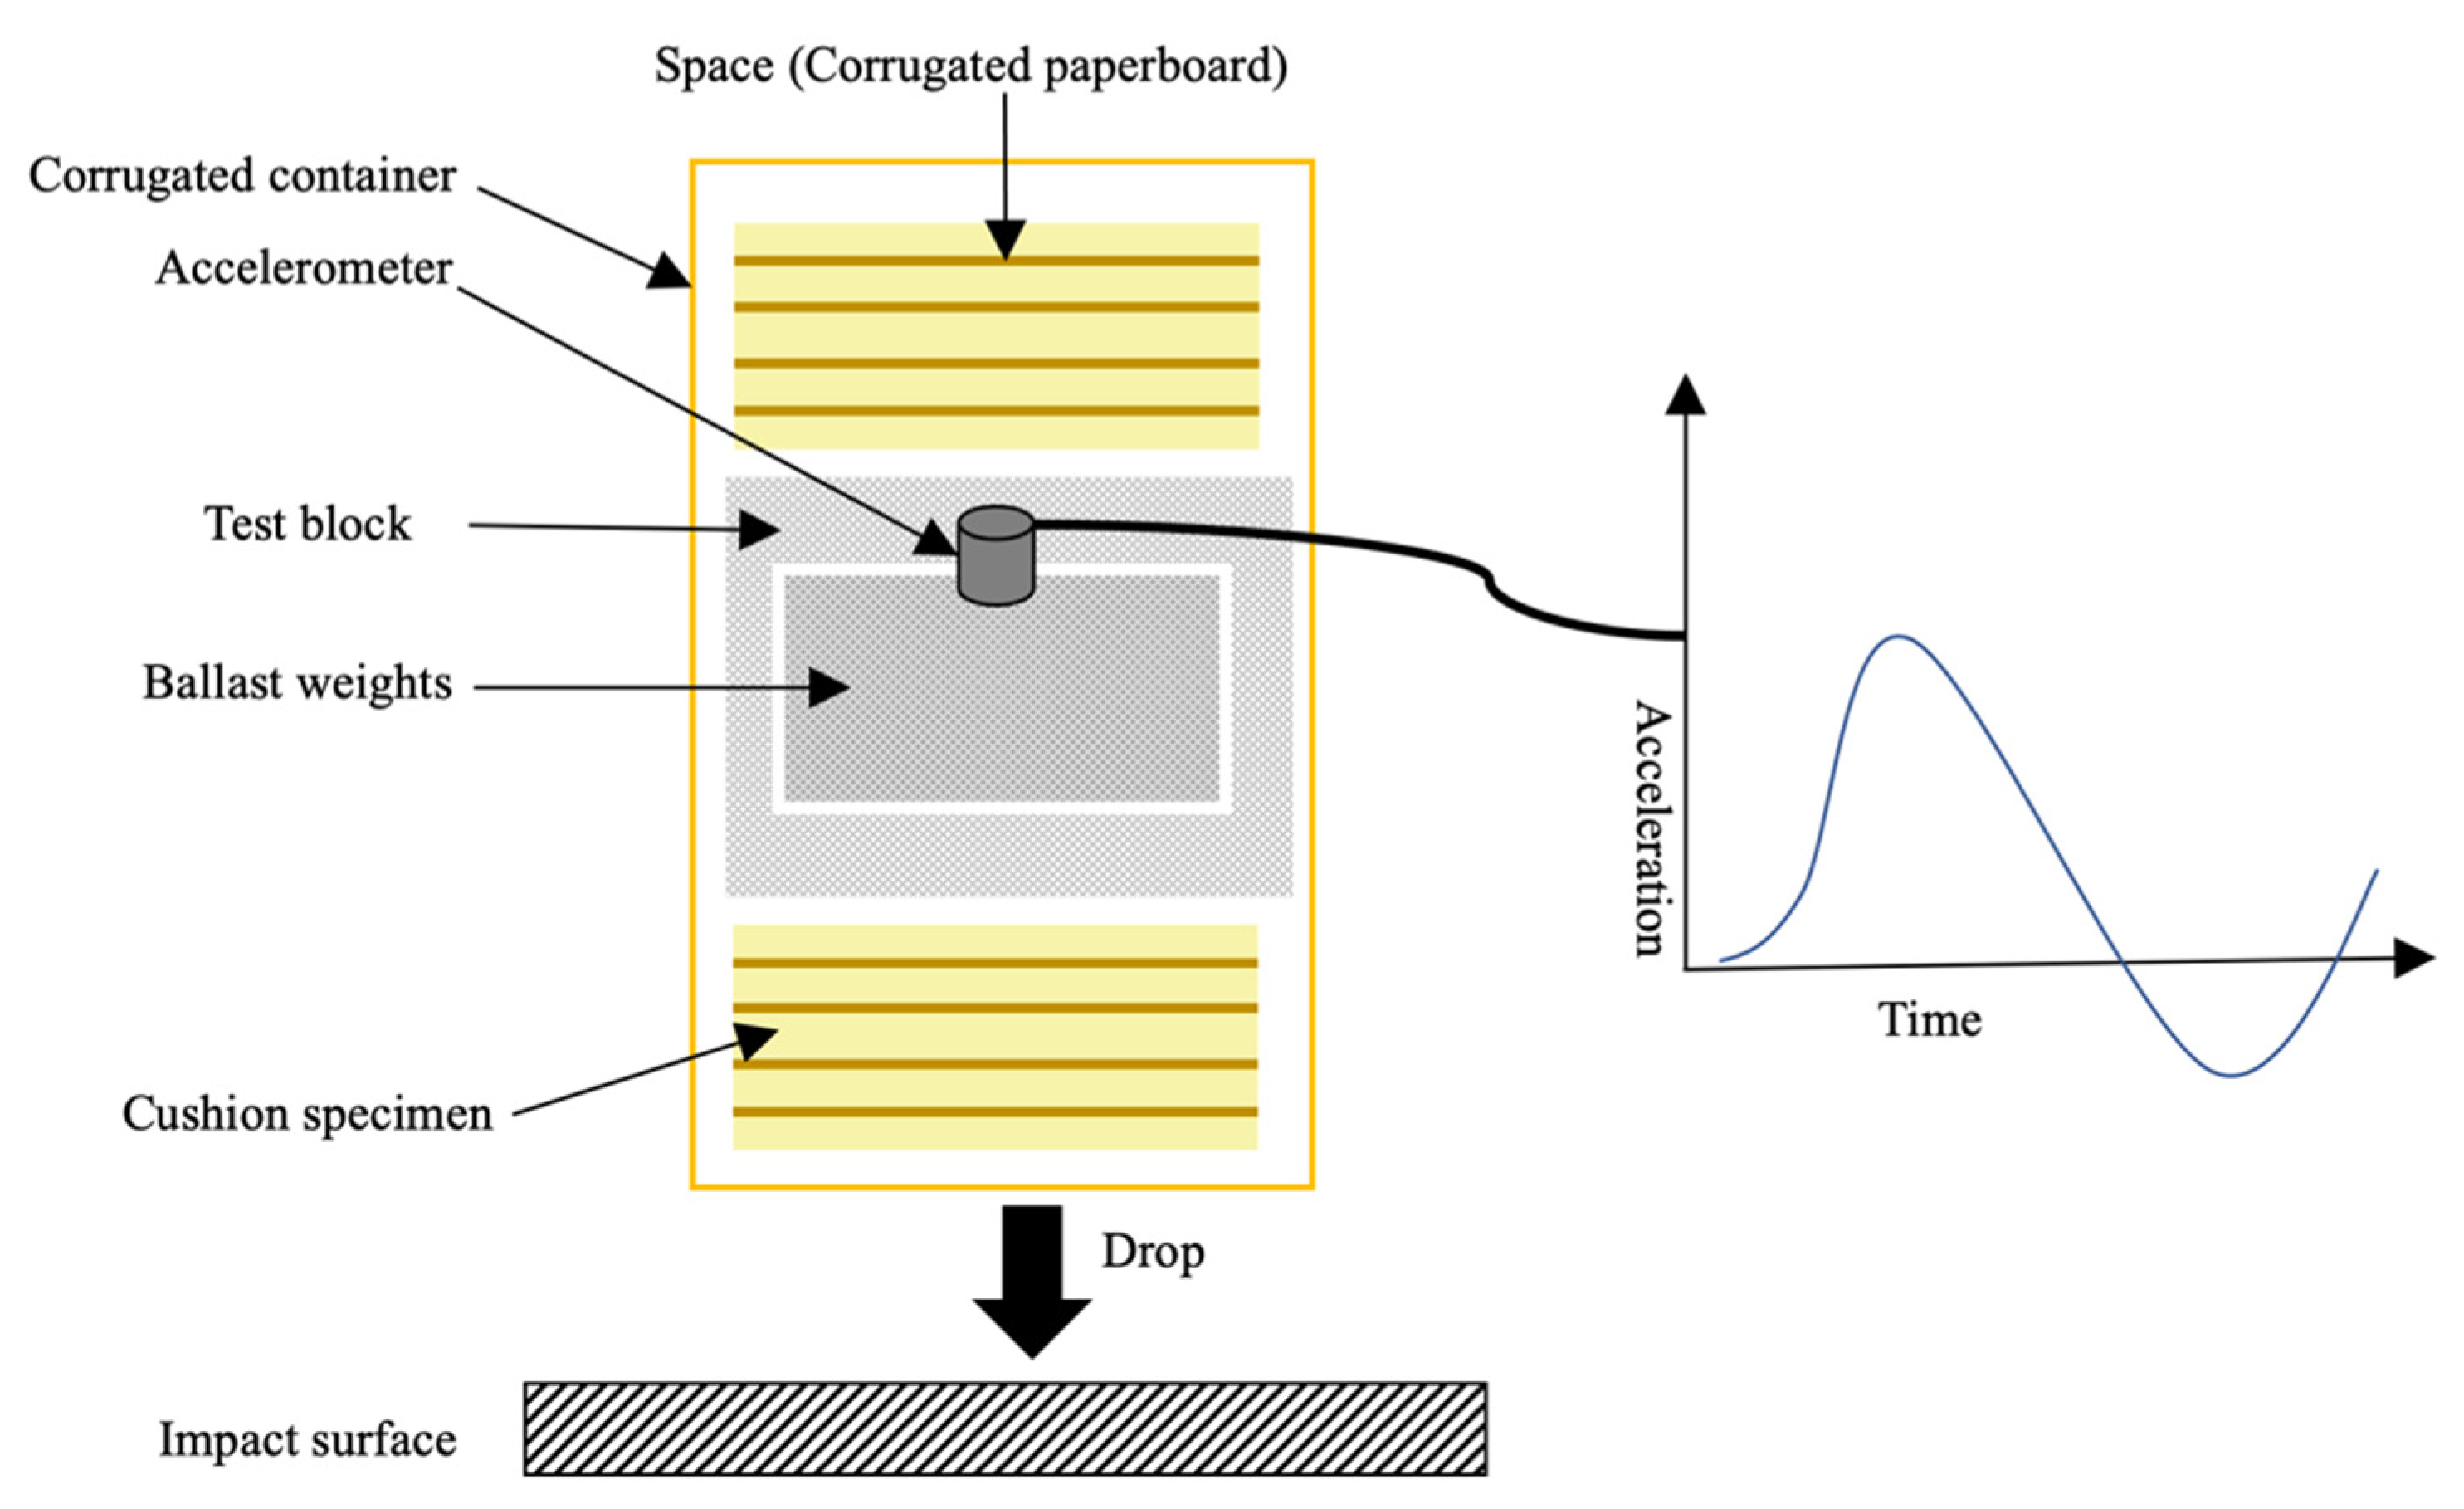
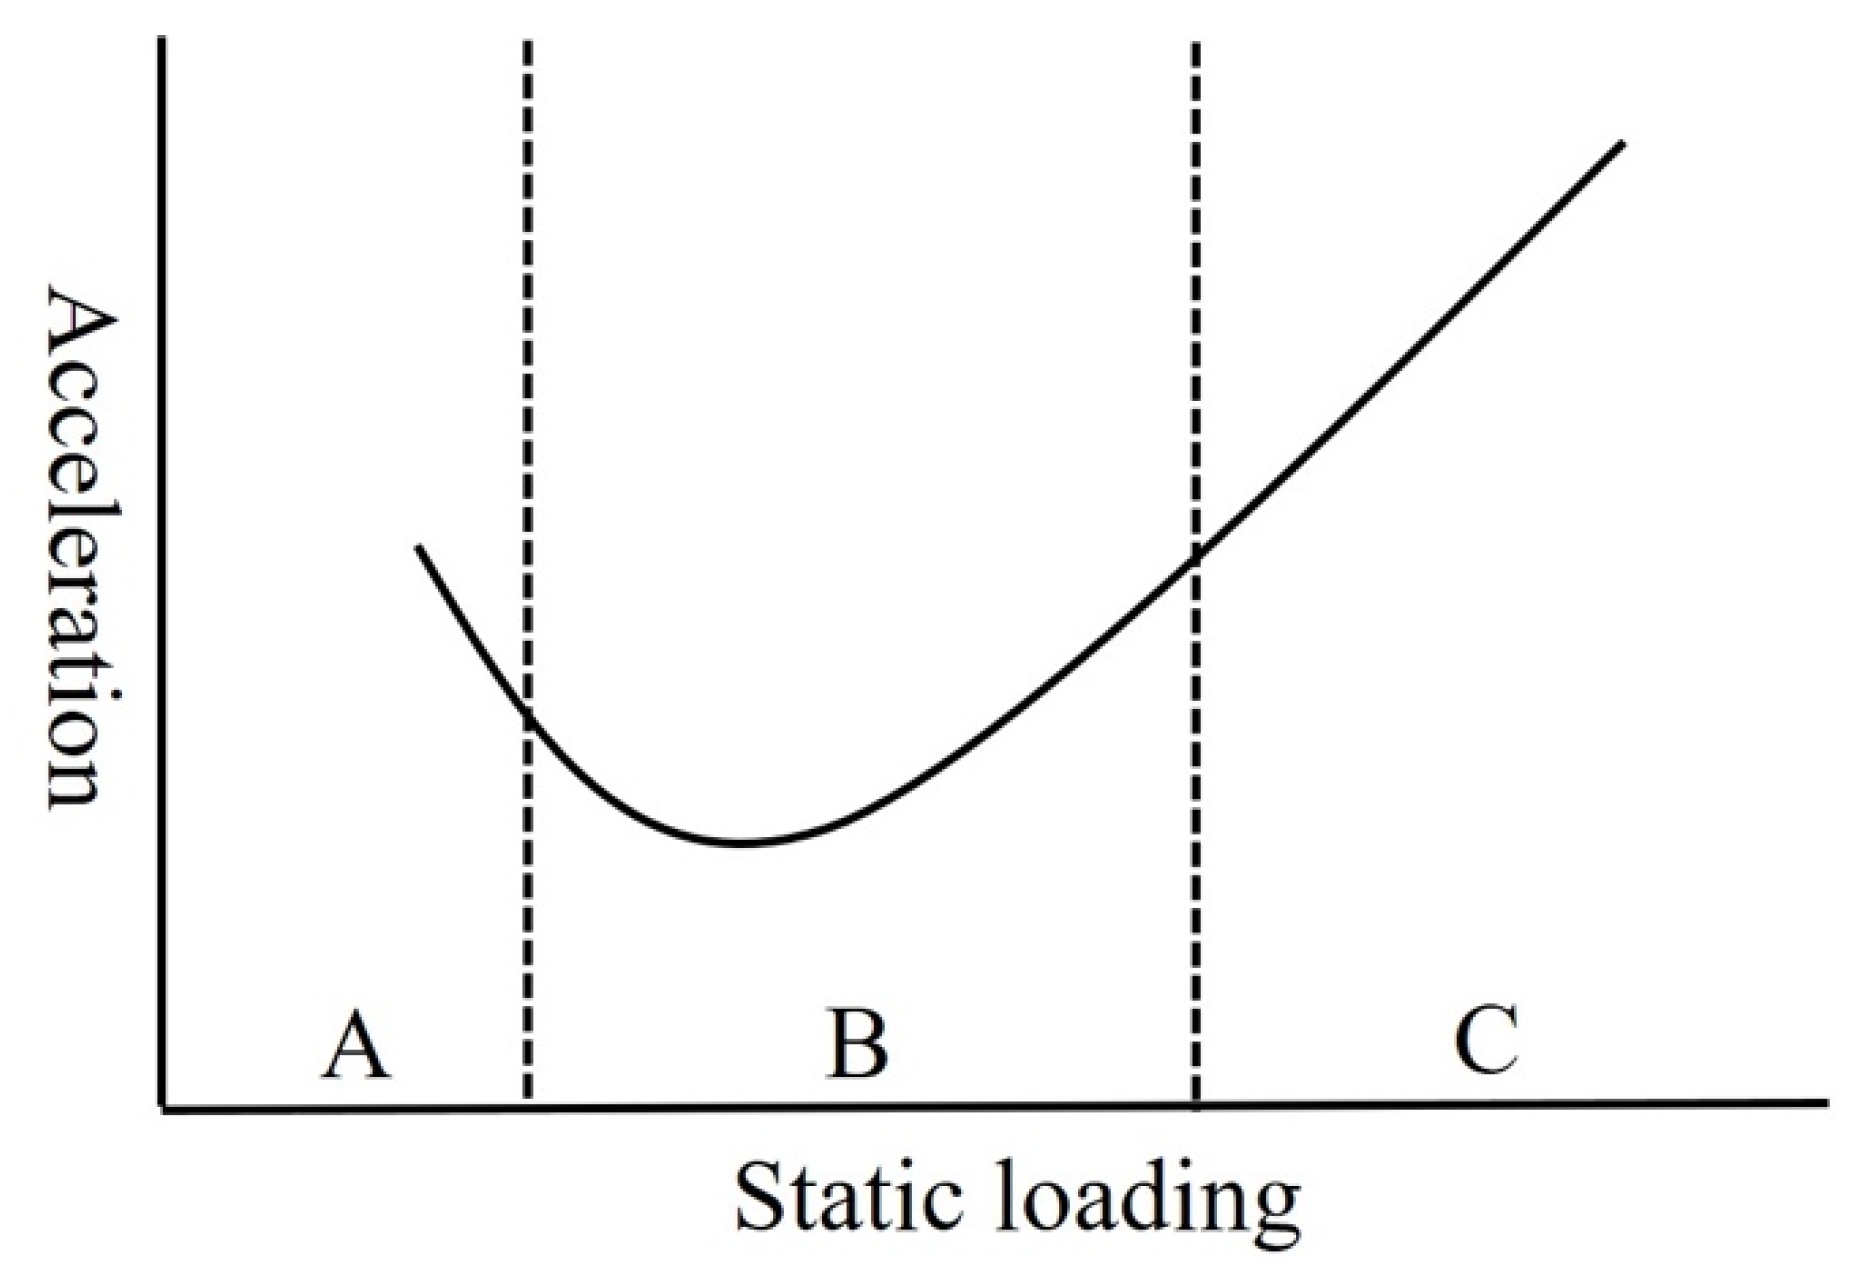
The dynamic buffer curve is usually U-shaped (
Figure 1). Zone A refers to the weight of the heavy hammer being relatively light. When an impact is applied to the cushioning material, the impact force fails to deform the cushioning material but generates a high acceleration. Zone B refers to the heavier weight of the heavy hammer. The cushioning material is deformed upon the application of the impact, prolonging the impact time and greatly reducing the acceleration. Zone B is the most suitable area for cushion design. Zone C refers to the fact that the heavy hammer is too heavy to bear the impact, and a cushion bottom out occurs when the hammer falls. Currently, the cushion material has no buffering effect. A dynamic cushion curve can be used to determine the thickness and area of the cushioning material to avoid cost increases or product damage caused by excessive or insufficient packaging. However, this curve is obtained by the ASTM D1596 [
9] test under a specific combination of buffer material type, thickness, and drop height and can only be used to describe the shock absorption characteristics of the buffer material under that specific combination. When conditions change, time-consuming experiments must be repeated to obtain the curve.
Thus far, Taiwanese buffer material manufacturers have not provided dynamic buffer curve data, although they have been widely used in other countries. The cost of test equipment is high, and only large institutions such as the Industrial Research Institute have such equipment. Generally, the industry or design units do not have such equipment, and obtaining the required information by self-testing is challenging. Since a series of tests have to be performed, it is costly and time-consuming for small- and medium-sized enterprises (SMEs) to obtain the required dynamic buffer curve data. Therefore, cushion packaging designs often rely on the experience of the designer.
In practice, the methods for establishing dynamic buffer curves are ASTM D1596 for thick plate materials and ASTM D4168 [
10] for foam-in-place materials. There are relevant method applications to evaluate the dynamic cushioning performances of packaging materials [
11,
12,
13]. However, no dynamic buffering curve test method exists for laminated corrugated buffering materials. Research on the impact absorption characteristics of corrugated cardboard has mostly used ASTM D1596, and only a specific combination of conditions could be studied, such as the corrugated cardboard of a specific material, material thickness, and drop height. Since different manufacturers adopt different standards in corrugated board designs, the existing dynamic buffer curve cannot be directly applied to a buffer packaging design. Therefore, methods that can truly reflect the real packaging situation need to be developed so that packaging designers can predict the characteristics of cushioning materials. Gorman improved ASTM D4168 and proposed an in-package test method for a polyethylene foam buffer [
14]. The impact testing results obtained using ASTM D1596 were closer to the actual packaging method.
In addition, Wang and Sun [
15] investigated the bending fatigue behavior of flute types B and C corrugated paperboard samples under cyclic loading. The results can be applied to the dynamic design and accelerated vibration test of stacked corrugated boxes. Mills et al. [
16] used an ABAQUS implicit analysis to obtain force–deformation curves for foam liners and corrugated cartons and concluded that a finite element analysis could predict the cushioning performance of complex-shaped liners better than the liner curve design method. Numerical methods are often used to calculate the strength of boxes. The finite element method has been successfully applied in many studies on the numerical analysis of boxes made of corrugated cardboard, such as the transverse shear stiffness of corrugated cardboard [
17,
18,
19,
20,
21]. Rami et al. [
17] applied finite element methods for the finite element analysis of nonlinear materials and structures. Nordstrand [
19] proposed a panel compression test rig, which was built to achieve accurately defined load and boundary conditions. The analysis results showed a difference in the order of 15–20% between experimentally estimated and analytically predicted critical buckling loads for orthotropic plates. Garbowski et al. [
20] proposed mixed analytical/numerical methods for estimating the strength of boxes with openings of various dimensions and locations. Moreover, together with practical guidelines, the homogenization method can be used to obtain stiffness properties of corrugated cardboard shell structures and any periodic shell structures [
21].
3. Experimental Analysis
The experiments were conducted using corrugated board and equipment provided by our partner companies. First, the factors affecting the impact absorption characteristics of the laminated corrugated board were summarized from the literature, including the flute height, thickness of Kraft paper, percentage of recycled pulp, hardness of the corrugated board, thickness of the cushioning material, humidity, static stress, and drop height. After discussing with field experts and the actual exploration of the experimental environment, we set the drop height and static stress (product weight/cushion area) at 76.2 cm and 14 g/cm
2, respectively. The experimental factors were the caliper (liner), flute height, cushion thickness, and basis weight (medium). However, the experiment could not be completed in one day, so the day and relative humidity were used as the blocking factors.
Table 1 gives the information of the experimental and blocking factors.
3.1. Empty Box Drop Test
In this stage, the 2
4 blocking of full-factorial resolution V designs with two block factors were adopted [
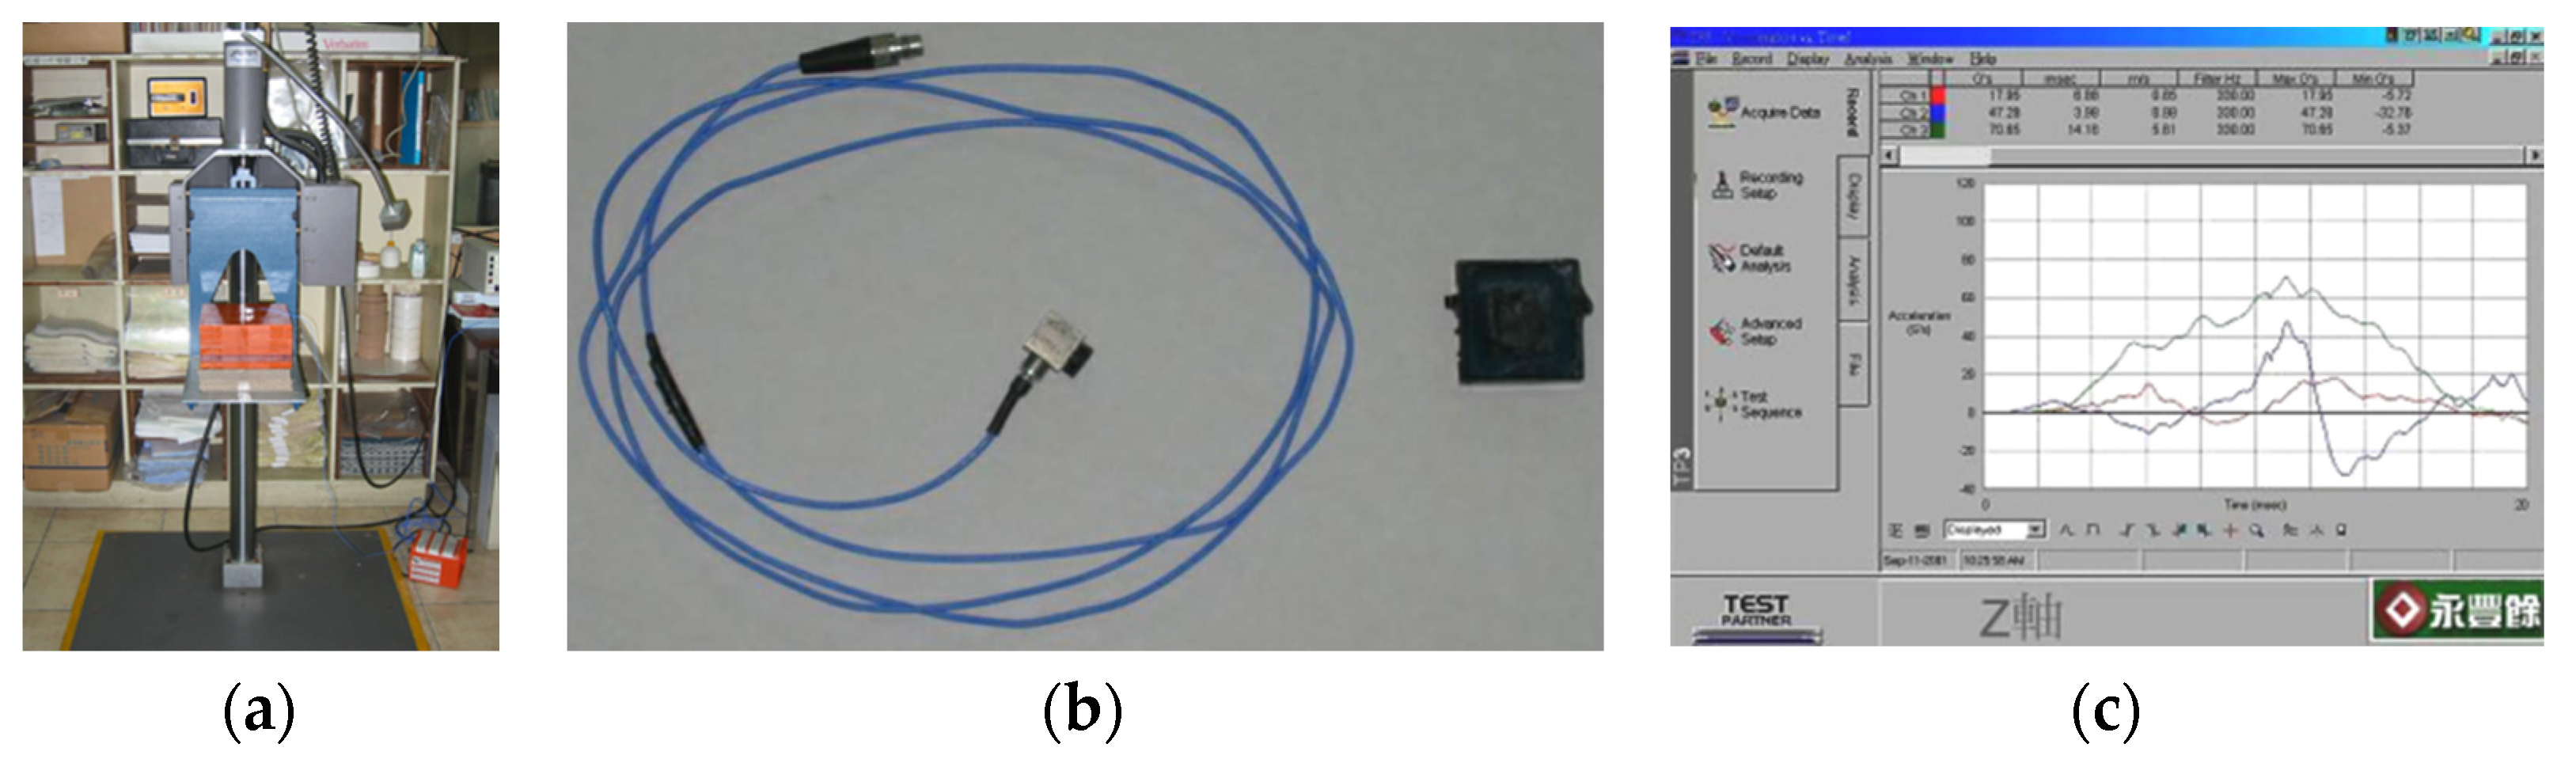
27]. Ten repetitions were set to reduce the experimental error, and a total of 160 experiments were conducted. During the experiment, two block factors were considered, so the entire experiment was divided into four blocks, and the sequence of experiments in the blocks was completely random. The response was the maximum acceleration (G value, impact strength) measured by the accelerometer fixed on the product at the time of the fall impact.
After completing the experiments according to the designed experimental sequence, an ANOVA was applied to determine the significant factors. The significant factors from the normal probability plot of the factor effects were B, C, BC, BD, CD, ABC, ACD, and BCD. The ANOVA showed that the effect of the blocking factor was not significant and that the subsequent analysis would pool the error term with the insignificant factors. Then, the residual analysis of the pattern check was performed.
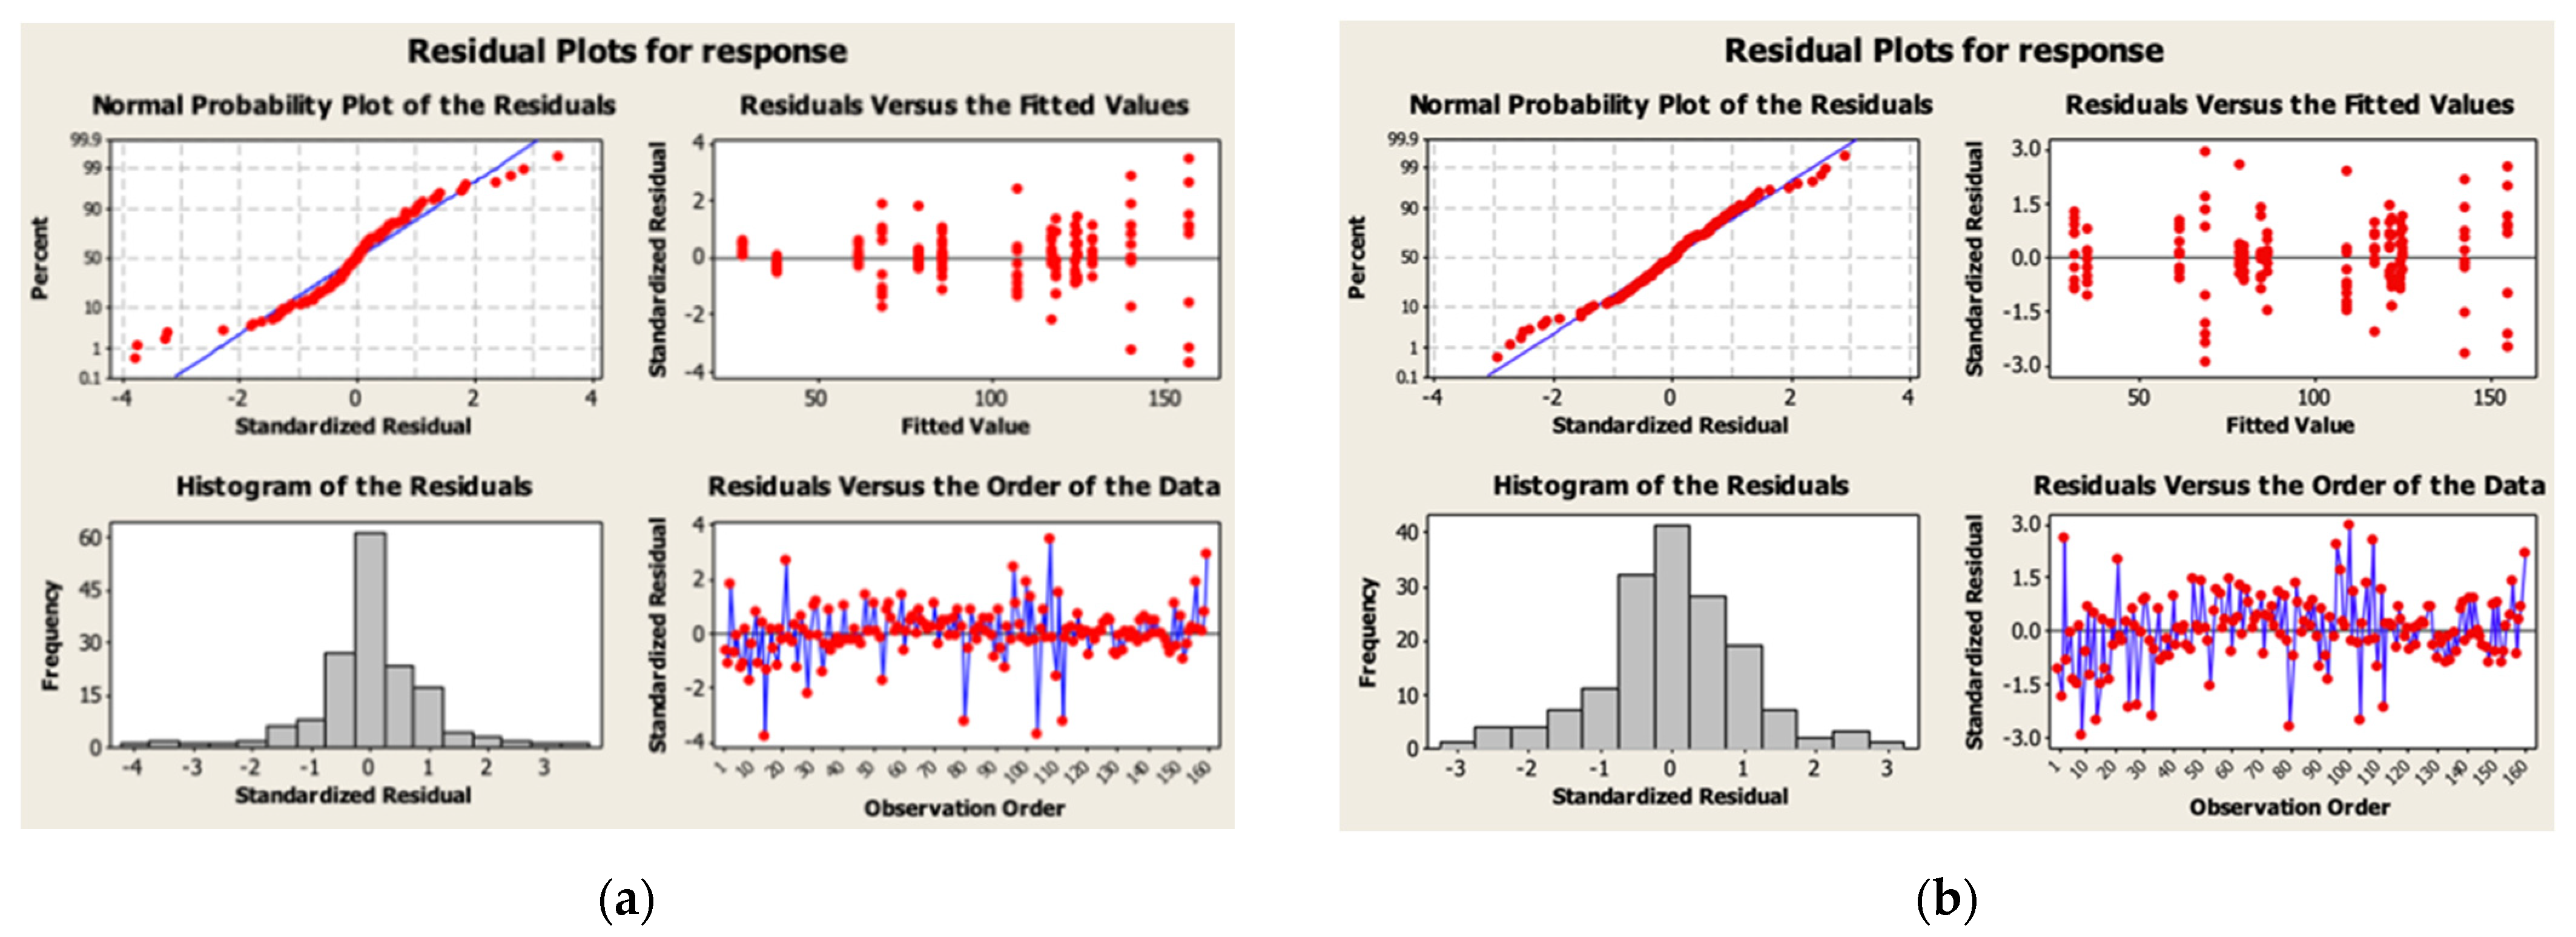
Figure 5a shows the relationship between the predicted values and residuals (top-right). The graph gradually expands from left to right, which is not consistent with the assumption of equal variance, so data transformation is necessary. The data were transformed by weighted least-squares regression and reanalyzed. The factors B, C, BC, BD, CD, ABC, ACD, and BCD were significant at a type I error of 0.05. Finally, a residual analysis was performed on the transformed model.
Figure 5b shows that the data were consistent with normality, equal variance, and independence.
The results of both the pre-transformation and post-transformation analyses showed that the main factors affecting the impact absorption characteristics of the laminated corrugated board were the flute height and thickness (number of layers): the higher the flute height, the better the cushioning effect. A-flute is the highest among all flute types and, therefore, has the best cushioning performance. Due to its good buffering property, A-flute is mostly used as a buffering material in the industry. Therefore, only A-flute cardboard was used as the target of the subsequent experiment. The higher the thickness (number of layers), the greater is the amount of deformation and impact. The effect of relative humidity was not significant and differed from that reported in the literature, probably because of the characteristics of the paperboard. Since the moisture absorption of the corrugated medium and Kraft paper used by different manufacturers varies, the degree of influence of relative humidity also varies. In subsequent experiments, the samples were processed under the temperature and humidity conditions specified by the relevant test standards to reduce the experimental variations. In the screening experiment, the thickness of the Kraft paper and the base weight of the core paper were not significant; thus, considering the costs, the subsequent experiment was conducted using Kraft paper and a core paper of lighter base weight.
3.2. In-Package Experiment
We collected data on the impact strength (G value) of the corrugated cardboard cushioning material from the first drop. The purpose of the in-package test was to ensure the applicability of the results to the actual cushioned packaging design. The equipment used in this phase was the same as that used in the screening test, except that the simulated product was replaced by a weight-adjustable test chamber. The test chamber was made according to ASTM D4168, with a length and width of 25 cm each and a height of 21 cm and was made of a stainless-steel plate with a weight of 3.125 kg. The static stress was 5 g/cm
2 when the sample size of the laminated corrugated board was 25 cm in length and width, and the weight of each piece was 1.563 kg; the static stress could be increased by 2.5 g/cm
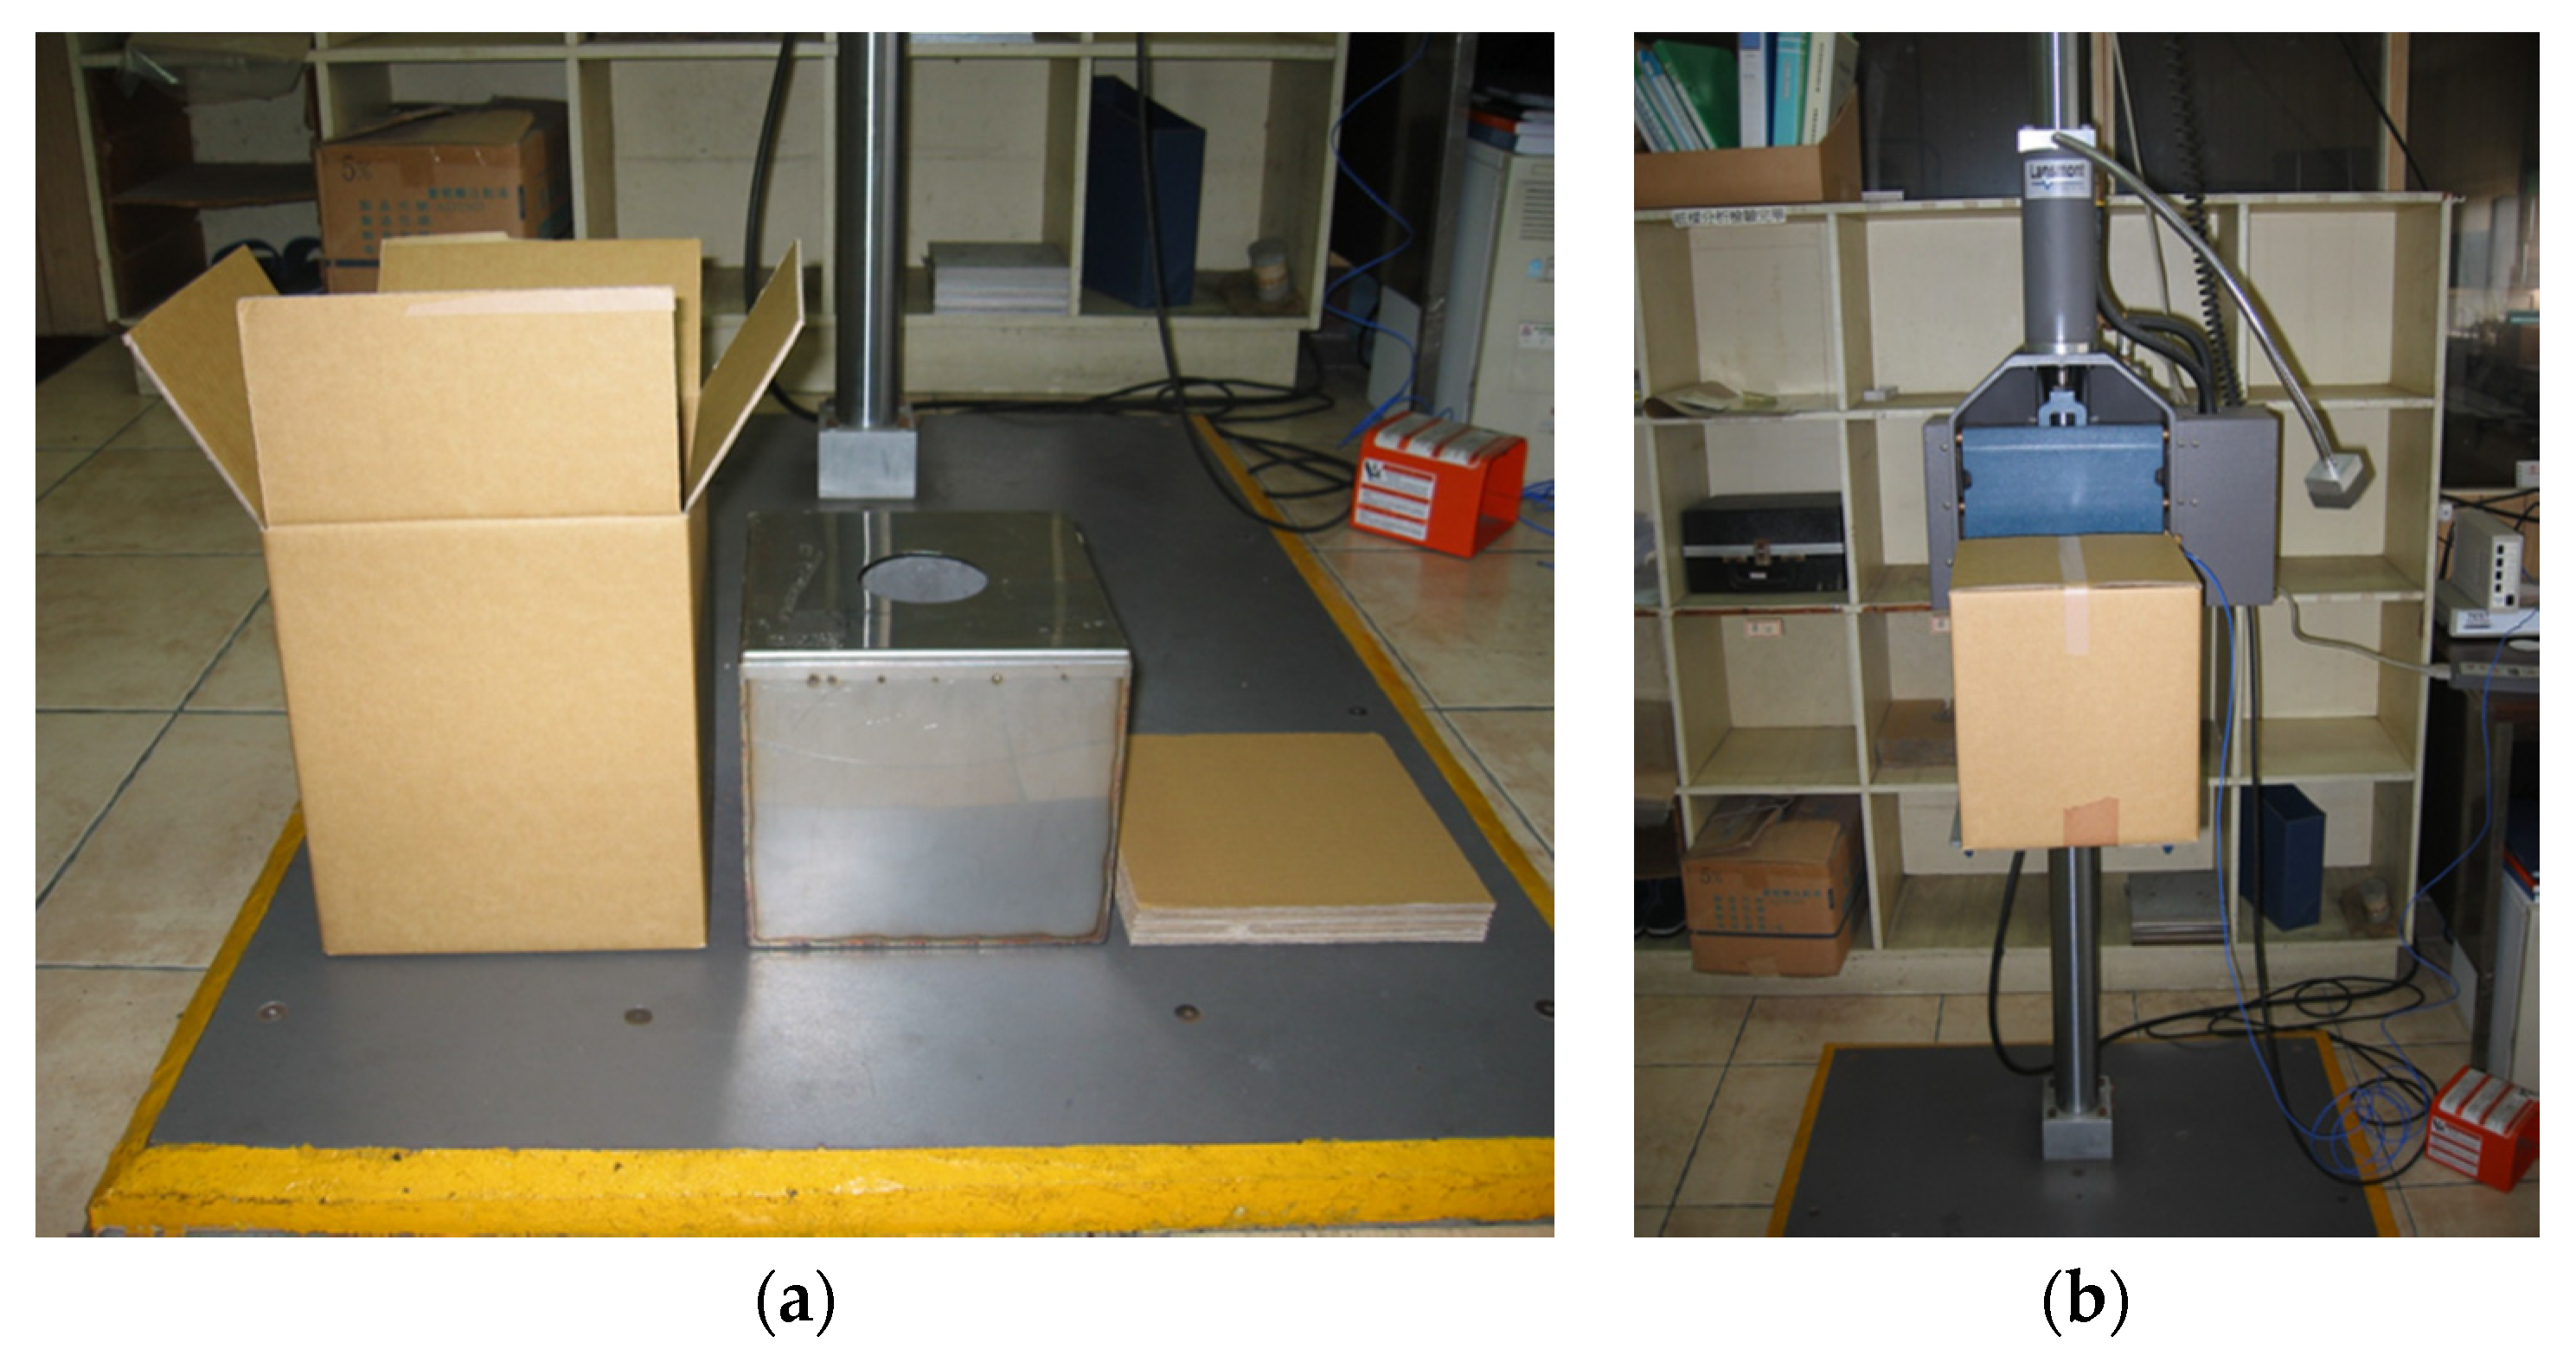
2 for each piece to adjust the weight of the box to meet the specific static stress requirements of the experiment. The configurations of the experimental and assembled samples are shown in
Figure 6a,b, respectively.
This phase initially used seven candidate experimental factors for the investigation:
- (1).
Static stress: Static stress is an important parameter in cushion packaging design and is determined by the weight and size of the product. At present, most of the products using corrugated cardboard as a cushioning material are 3C products, so thin and light is the mainstream of design, with a weight below 10 kg and static stress below 35 g/cm2.
- (2).
Falling height: The standards of the falling height vary for each packaging test. Before designing cushion packaging, it is necessary to understand the standards and their falling heights quoted by customers during acceptance tests. The highest and second-highest drop heights of the drop test-related standards are listed in
Table 2.
- (3).
Humidity: Although the influence of humidity in the screening test is not significant, the temperature and humidity of buffer test specimens are still regulated in the relevant standards to reduce experimental variations. In ASTM D1596 and D4168, the required temperature is 23 °C ± 2 °C, and the relative humidity is 50% ± 2%; in CNS 14615 [
32], it is stipulated that the specimens should be placed at a temperature of 20 °C ± 2 °C and relative humidity of 65% ± 5% for more than 16 h, and the hygroscopic specimens should be placed for more than 24 h. Corrugated cardboard is a hygroscopic material, so the pretreatment time should be more than 24 h. In this stage, the samples were treated according to CNS 14615.
- (4).
Kraft paper thickness: The effect of Kraft paper thickness in the screening test was not significant; therefore, considering the costs, Kraft paper with a basis weight of 130 g/m2 and a thickness of 0.186 mm was used in the subsequent experiment.
- (5).
Corrugated height: The A-flute cardboard is more commonly used as a buffering material, because it has the best buffering characteristics. Hence, only A-flute cardboard was tested in the subsequent tests.
- (6).
Thickness (number of layers): In practice, the thickness (number of layers) of corrugated cardboard is more than four layers and less than 10 layers.
- (7).
Base weight of the corrugated medium: The effect of the Kraft paper thickness was not significant in the screening test; therefore, the base weight of the corrugated medium of 100 g/m2 was used in the follow-up test.
The abovementioned factors were reviewed by experts, and three main factors (drop height, static stress, and cushion thickness) were used, with each factor taking four levels for the 3
4-factor experimental configuration. The experimental order was completely randomized, and the number of repetitions was set to five to reduce the experimental error; a total of 320 experiments were required. The information of the experimental factors is given in
Table 3. The experimental fixation factors are described below. The sample pretreatment temperature and humidity were set at 20 °C ± 2 °C, 65% ± 5% relative humidity, and 24 h, according to CNS 14615. The thickness of the Kraft paper was 0.186 mm, with a basis weight of 130 g/m
2. A corrugated flute board with a height of 4.7 mm and a corrugated medium with a basis weight of 100 g/m
2 were used.
Experimental Data Analysis
The analysis procedure started with a least-squares method to estimate the created cubic multiple models. Then, the initial model was obtained by variable filtering. The residual analysis was performed, and if it passed, the model capability was evaluated, and if it failed, the model and residual analysis were recreated after conversion until the residual analysis was passed. JMP Pro
® 16 was used to perform the analysis.
Figure 7a shows the results of the effect summary analysis, where the variables with a
p-value less than 0.05 were filtered out, the model was recreated, and the residual analysis was performed.
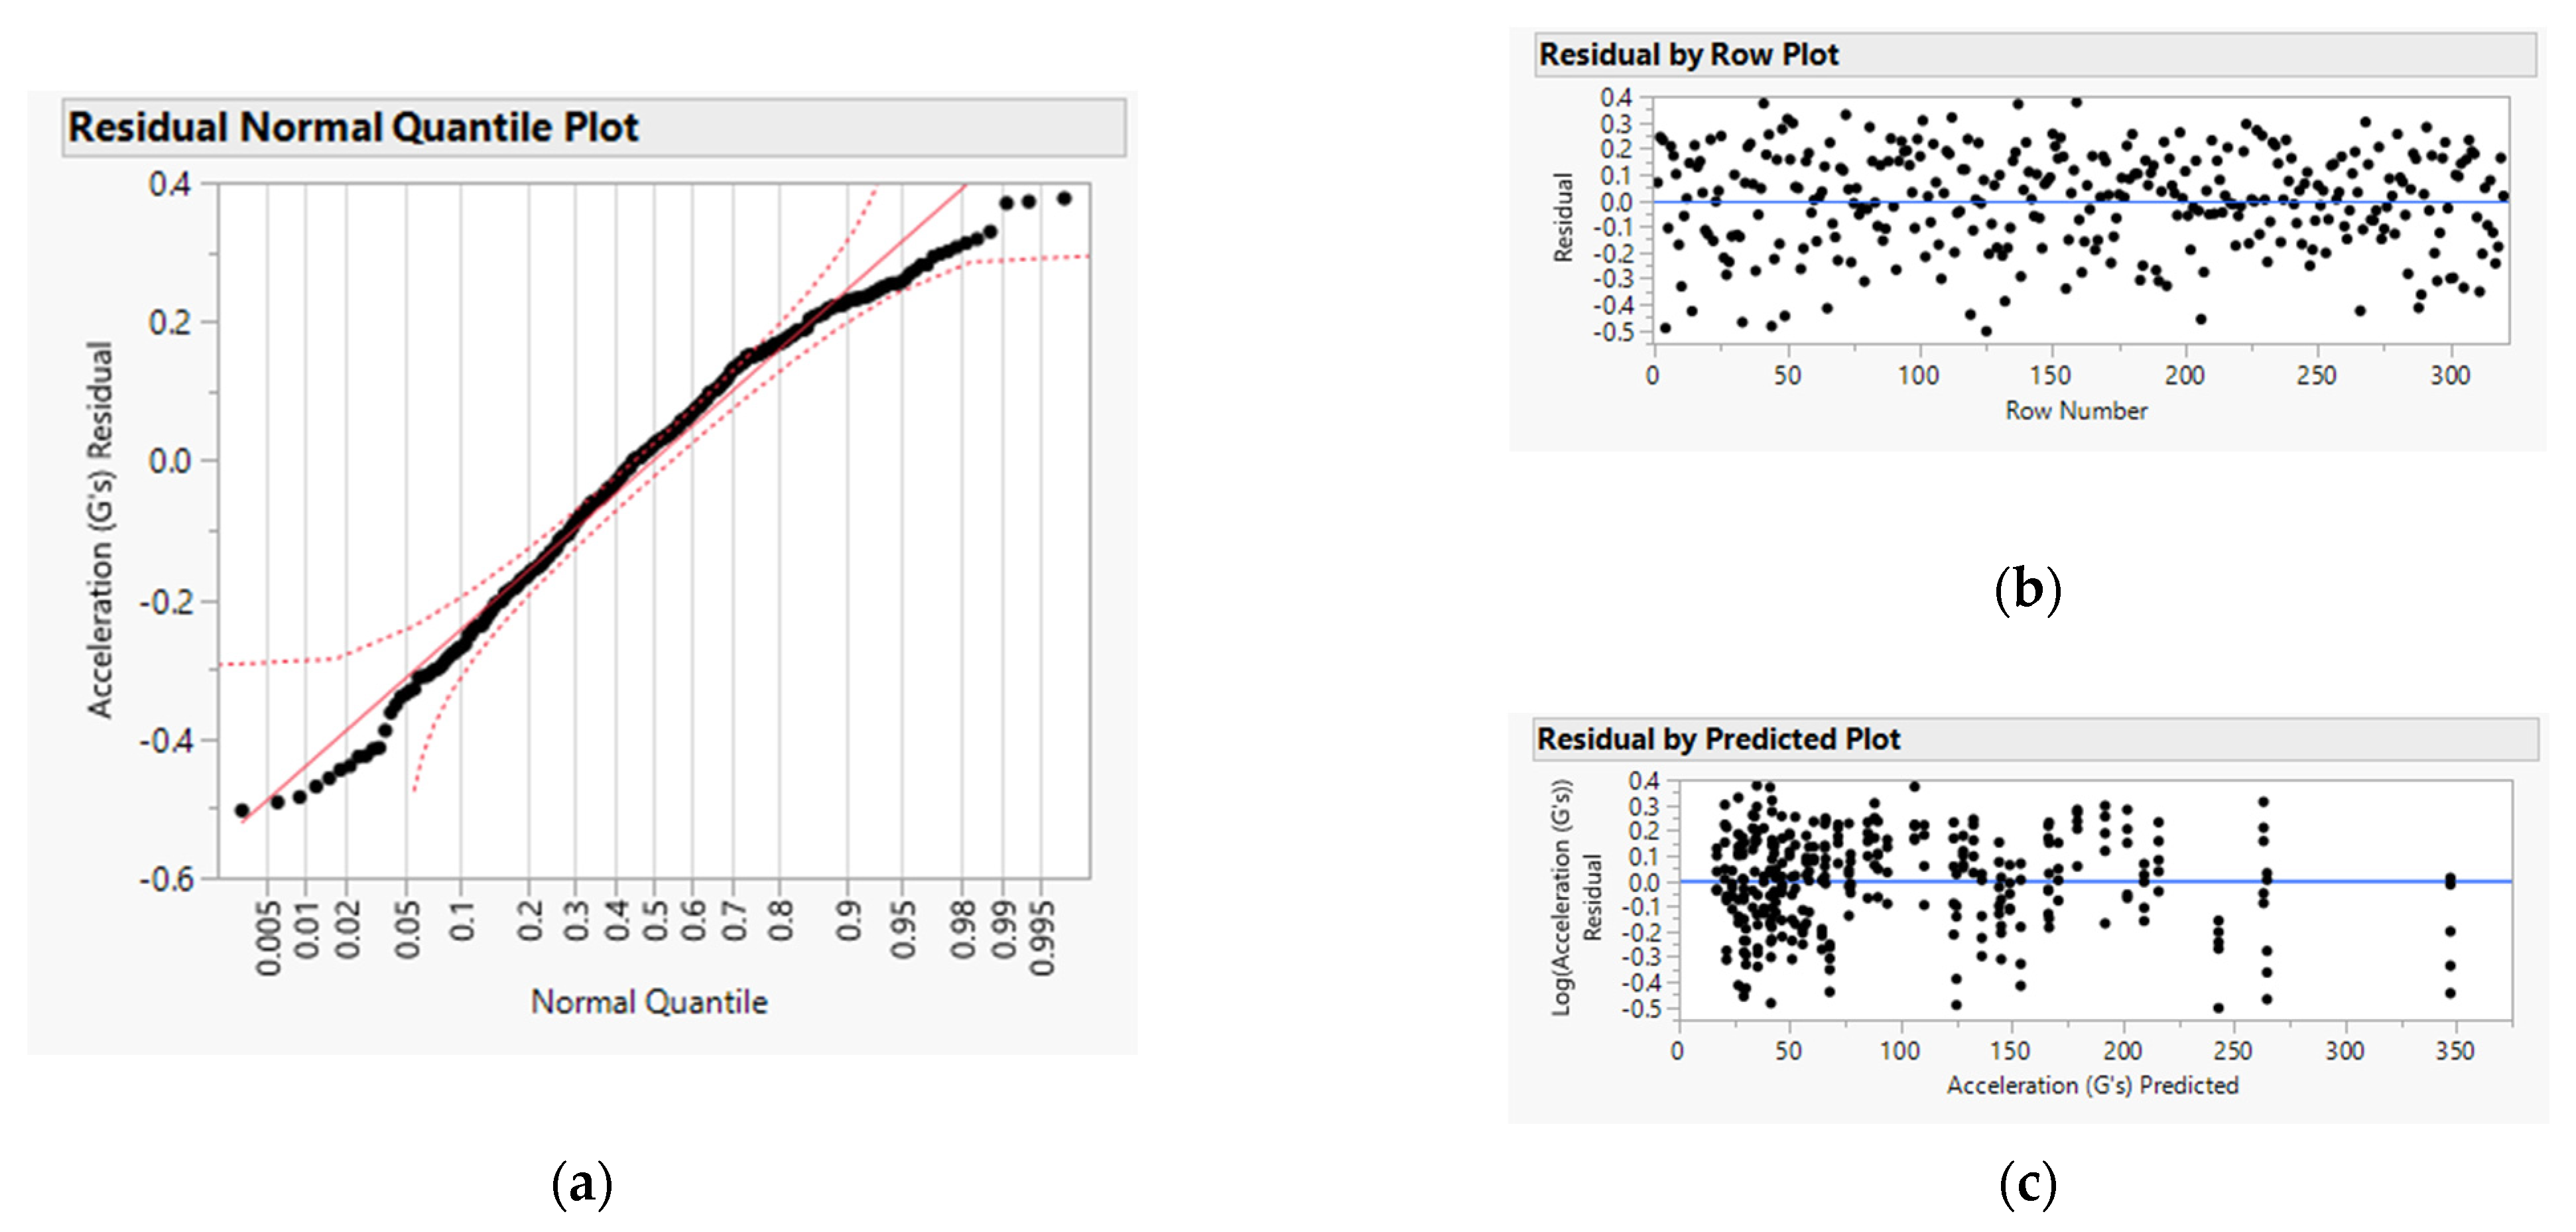
Figure 7b shows the residual by the predicted plot in the residual analysis; since the plot was extrapolated, the assumption of consistent variance was not passed. Therefore, a transformation was required to recreate the model.
The most-used log transformation was used, and then, the model was recreated.
Figure 8a–c shows the results of the normality, equal variance, and independence evaluations. The absence of abnormal patterns indicates that the established pattern is consistent with the assumptions.
The optimal model for the established the impact strength
is as follows:
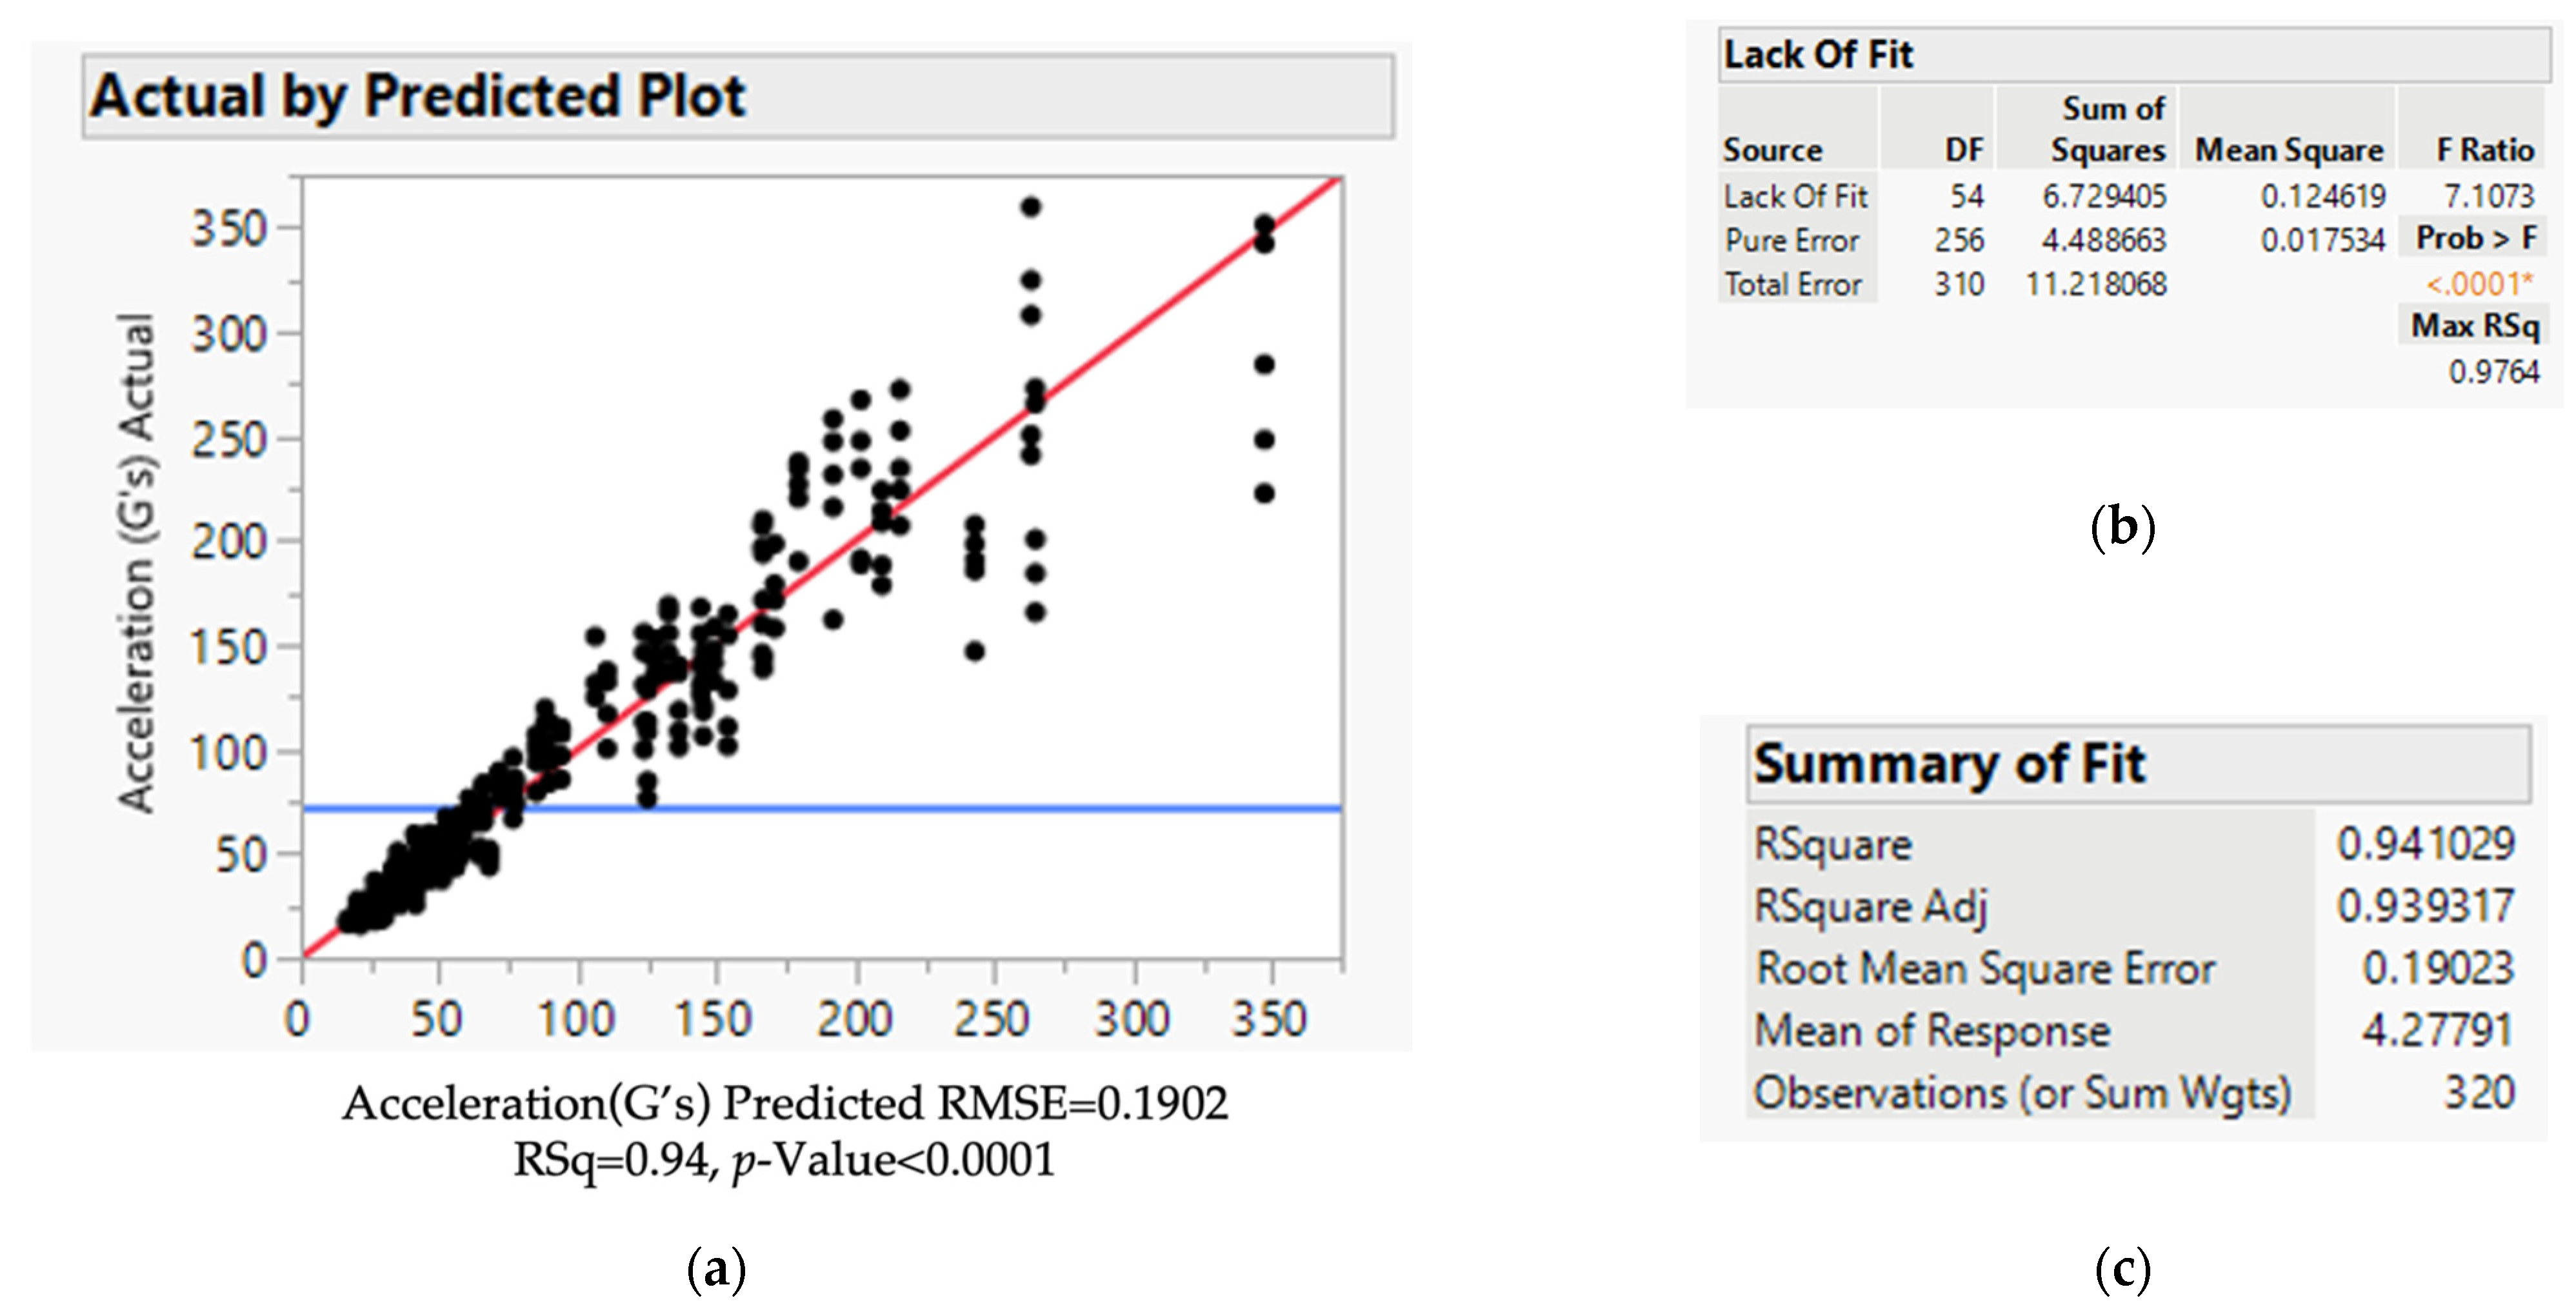
Figure 9 shows the results of the model evaluation.
Figure 9a shows the results of the actual and predicted models, which are positively correlated. The
p-value in
Figure 9b is <0.0001, indicating that the model is appropriate. R
2 = 0.941029 in
Figure 9c is very close to the adjusted R
2 = 0.939313 and is greater than 0.9, indicating that the model is representative.
3.3. Summary of the Analysis Results
In this study, a predictive model of the impact strength was developed based on the experimental design to replace the traditional dynamic cushioning curve and provide the optimal cushioning design for corrugated boards.
In the empty box drop test, the four experimental factors used were caliper (liner), flute height, cushion thickness, and basis weight (medium) to collect the data using the 24 blocking of the full-factorial design. From the results of the screening experiment, the main factors affecting the impact absorption characteristics of the laminated corrugated board were the flute height and cushion thickness. The higher the flute height, the better was the cushioning effect. A-flute was the highest among all the flute types, so only A-flute cardboard was used as the target of the subsequent experiment. The higher the cushion thickness (number of layers), the greater was the amount of deformation and impact. The effects of the Kraft paper thickness, the base weight of the core paper, and relative humidity were insignificant.
In the in-package test, three experimental factors—drop height, static stress, and cushion thickness—and five fixed factors—temperature, humidity, the thickness of the Kraft paper, corrugated flute board with a height, and corrugated medium with a basis weight—were used to design the experiment for data collection. By analyzing the results, the statistical model of the impact strength established by the drop height, static stress, and cushion thickness could be used to design the best-corrugated board.
4. Verification
In the validation experiment, the cushioned package design was implemented using the actual product to verify the applicability of the developed model to the actual cushioned package design. During the design, the model was used to estimate the impact strength of the drop test, and the drop test was performed on the actual product. The impact strength obtained from the actual test was compared with the estimated value of the regression. The test products were designed using a desktop PC as the test product, and the cushioning package was designed according to three acceptance standards: MIL-HDBK-304C, CNS 10033, and the customer requirements. The regression estimation formula was used to calculate the static stress or thickness (number of layers) required for the drop test acceptance criteria. The test product specifications and the three acceptance standards are listed in
Table 4. The standard or the customer determined the drop height; the fragility of the impact strength in the MIL-HDBK-304C computer equipment was 40–59 Gs, and the design standard was set at 50 Gs or less; for the CNS 10033 standard, it was set at 60 Gs or less.
Buffer Packaging Design
The cushioning package design mainly determines the length, width, and thickness of the cushioning material. Once the length and width of the cushioning material are determined, the static stress is determined. Since the impact strength prediction of the model is a function of the main factors, when the model is used in the cushioning package design, the cushioning effect can be calculated from the design parameters, and the optimal design parameters can be calculated by combining different conditions.
To verify the usability of the established regressions, two buffer designs were evaluated for each of the three acceptance criteria. Design 1 was used to calculate the required thickness (number of layers) at a fixed static stress, while design 2 was used to calculate the appropriate static stress with a fixed thickness (number of layers according to design 1) and then calculate the length and width of the buffer from the static stress obtained (
Table 5). After completing the cushion packaging design, the A-flute corrugated cardboard produced by the partner company was used to produce laminated corrugated cardboard and corrugated boxes for outer packaging according to the design results.
The test equipment used at this stage was the same as that of the screening test, except that the sample was changed to the actual product. Before packaging, the accelerometer was fixed on the hard disk of the PC. After packing, the specimens were placed in a humidity chamber for pretreatment. The temperature and humidity were set at 20 °C ± 2 °C and 65% ± 5%, respectively, according to CNS 14615. The samples tested after processing are shown in
Figure 10. The drop test was performed according to CNS 2999, and a drop tester measured the impact strength of the product at the bottom of the drop.
The products were packaged with manufactured cushioning materials, corrugated cartons, and drop tests to compare the measured results with the predicted values. The measured impact strengths of the six cushioned packaging designs are given in
Table 6, with all the values within the 95% confidence interval (CI) of the predicted values.
The validation experiment results showed that the proposed model can be used in the actual packaging buffer design. Therefore, in practice, the proposed model can effectively shorten the design time and cost by eliminating the trial-and-error method. In addition, although the thicknesses (number of layers) of A2, B2, and C2 were the same as those of A1, B1, and C1, they not only saved the area of the cushioning material under higher static stress but also had a better cushioning effect than A1, B1, and C1.
5. Discussion
The dynamic cushion curve provides useful information for not only selecting the appropriate cushioning material, thickness, and area but also predicting the cushioning effect and avoiding the use of the trial-and-error method, shortening the time and cost of packaging design. However, owing to the limitations of the test equipment and high costs, it is not widely used in Taiwan, and the industry mostly uses the trial-and-error method for packaging design. The dynamic cushion curve can determine only the application range of the static stress and cannot be accurately estimated. Further, the design using the trial-and-error method can determine whether the design meets customers’ requirements but cannot provide an optimal design.
Table 7 shows a comparison of this study with other studies [
10,
14], and the different highlights are described and discussed below.
In terms of test methods, this study used the in-package method to perform the drop test, while the other studies used ASTM D1596. In terms of test equipment, the drop test machine and the test chamber were used in this study, while the cushion test machine was used in other studies. However, cushioning testers are limited to cushioning material testing and are very rare in Taiwan, so drop testers offer an inexpensive and easily accessible alternative. In terms of specimens and test conditions, this study conducted multilevel tests on corrugated A-flute board in terms of the drop height, static stress, thickness, and other factors, so the results apply to a wide range of applications.
Our study was based on the idea of data decision-making and established the model by experimental design, which can be widely applied to design practice. By contrast, other studies were conducted for specific conditions, and the results can be applied to designs with the same conditions, limiting their applicability.


