Abstract
Behaviors of the pile foundation due to groundwater level rising were analyzed by a series two-dimensional finite element analyses with fully coupled flow-deformation analysis. The different numerical models of single bore pile depth and diameter in Bangkok subsoil were represented with the parametric study. The pile–soil movement due to groundwater levels rising between numerical simulation and a previous experiment of the centrifuge test as the same condition are in good agreement. With rising groundwater level, the reduction of pile capacity can be evidently performed by the increase of pile settlement relative to soil surface. Moreover, the development of the plastic point captured by the finite element analysis revealed the mechanism behind the reduction of pile capacity. In this study, the evaluation of pile stability due to groundwater level rising for preliminary guidelines to protect existing structures are proposed.
1. Introduction
A decrease in groundwater extraction due to industrial decentralization and the restriction or prohibition of groundwater pumping has led to rising groundwater levels. It has been observed in several cities, including London (England) [1], Jeddah (Saudi Arabia) [2], Naples and Milan (Italy) [3,4], Wuxi (China) [5] and Bangkok (Thailand) [6] for half of a century. The rising groundwater levels can change the water pressure in the aquifer, and effective stresses in the soil layers can be reduced. An upward movement of the ground [7,8], underground structures [1,9] and a loss in foundation bearing capacity [10,11] were then observed.
Several studies investigated the pile–soil behavior and the capacity change of pile foundations with rising groundwater level. For example, the full-scale tests on ten driven piles in sand and gravel under controlled water pressure within neighborhoods of wells were proposed by Armishaw and Cox [11]. The results showed that the ground movements corresponded to the water level fluctuations, whereas pile movements with the working load of more than 50% of the ultimate load continuously settled with increasing pore pressures. The behavior of four driven piles in clay with increasing pore water pressure was investigated by small scale model test measured. A 25 mm diameter pile at 230 mm depth was installed in compacting clay in a test container for investigating stresses and movement of the pile. A significant loss in pile load capacity resulted from an increase in soil moisture content (comparable to a reduction in effective stress) and the movement of a floating unloaded pile increased with soil movement (Challa and Poulos [12]). In a series of centrifuge model experiments, Morrison and Taylor examined the effect of increasing pore water pressures on the behavior of pile foundations buried in reconstituted Speswhite kaolin clay. The results showed that the pile foundations moved less than the surrounding ground surface and reduced the ultimate capacity [13,14].
Bangkok, Thailand experienced land subsidence from 1960 to 1997 due to excessive groundwater extraction [15,16]. Consequently, the government strictly controlled groundwater pumping and the groundwater level in the underlying aquifers, slightly recovered [6]. The rising groundwater led to reduction in effective stress, which affected existing deep pile foundations, installed prior to groundwater recovery. Some research investigated the changing of pile capacity, due to rising groundwater levels in Bangkok subsoils, for example simple static analytical methods evaluated the loss in pile capacity, due to the reduction in effective stress [6,17]. Intui and Soralump tested the load distribution of a single pile in the centrifuge test, and found that it was less than manual calculations, but it still showed the same trend. Due to complicated multiple many boundary values, it was not possible to derive closed form solutions and numerical methods, within a theoretical framework, were used [18].
Roh et al., using numerical methods for evaluating capacity in deep foundations, with change in groundwater level, derived the load–settlement curve and the axial load capacity of the piled–raft foundation, indicating that the static groundwater level affected the depth at which piled rafts were controlled [19]. Although the capacity in a deep foundation was evaluated, the soil deformation and the groundwater levels did not take into account changes in time, as in real situations. Recently, Saowiang and Huy used fully coupled finite element (using Abaqus code [20]) to simulate land deformation, pore water pressure and effective stress change induced by long term groundwater drawdown and recovery in the Bangkok aquifers, but the pile structure was not integrated into their numeric model. However, these analyses demonstrated the changes in pore water pressure and effective stress with time, as well as the correlation between effective stress and undrained shear strength, used to predict the reduction in pile capacity [21].
Here, we analyzed a fully coupled flow deformation analysis using PLAXIS 2D CE V20 [22] to study the pile–soil movement, stress distribution along with the pile and plastic point of surrounding soil and pile capacity in Bangkok subsoil, and took into account the simultaneous development of deformations and pore pressures in partially saturated and fully saturated soils as a result of changes with time of the hydraulic boundary conditions [23]. In this study, the evaluation of pile stability due to groundwater level rising for preliminary guidelines to protect existing structures is proposed.
2. Study Area
Bangkok, which is a key economic center in Thailand and subject to intensive groundwater pumping, leading to water resource sustainability concerns, was selected for this study (Figure 1a). Groundwater pumping has been banned in this area since 1997, after the groundwater overdraft and land subsidence was recognized. Then, the groundwater level increase presented an opportunity to identify the values of effective stress and to monitor the pile capacity.
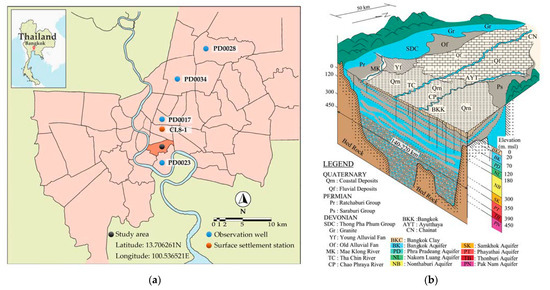
Figure 1.
Location and Geology of Bangkok area: (a) Map showing study area in Bangkok and sampling points; (b) stratigraphy of Lower Central Plain basin.
2.1. Geology and Hydrogeology of Bangkok Area
Bangkok is located in the Lower Central Plain of Thailand (Figure 1b), which is composed of thick deposits of marine clays and alluvial soils. The subsoils were complex and non-uniform in texture. To a depth of 35 m, the subsoil consists of soft clay (Bangkok clay), stiff clay and sand, but below that, it is stiff to hard clay and dense sand layers. The hydrogeology of Bangkok area shows an aquifer system, consisting mainly of Pliocene–Pleistocene–Holocene fluvial and deltaic sands, gravels and fine-grained deposits (silts and clays). From a detailed electrical and lithological logs of groundwater wells, the Japan International Cooperation Agency [24] identified and named eight aquifers with thicknesses of 30–70 m each, including the Bangkok (BK, ~50 m), Phra Pradeang (PD ~100 m), Nakorn Luang (sNL ~150 m), Nonthaburi (NB ~250 m), Sam Khok (SK ~300 m), Phayathai (PT ~350 m), Thonburi (TB ~450 m), and Pak Nam (PN ~550 m) aquifers. The maximum thickness of the basin near the Gulf of Thailand is about 2000 m, but it has been studied only to a depth of ~600 m. The top of the BK aquifer from the Gulf of Thailand to Ayutthaya has Bangkok clay, a soft clay, 12–20 m below ground level, so building foundations were built on piles to protect the settlement.
However, the pile foundations were constructed at ~70 m in the PD aquifer, and groundwater was considered the major influence on the PD aquifer.
2.2. Bangkok Subsoil and Pile Foundation
From several reports, the subsoil profiles of the Bangkok area have been established [24,25,26,27]. Generally, it consists of layers from the ground surface in order:
- (1)
- Weathered crust of backfill material, 0 m to 2 m thick. The high soil density layer was usually affected by human activities.
- (2)
- Very soft clay, Soft Bangkok Clay, low strength and highly compressible clay, from 2 m to 14 m. The color varies from medium gray to dark gray. The natural water content of the soil layer varies from 60 to 105%.
- (3)
- Medium clay, 14 m to 20 m thick. The color is dark gray to brownish gray. The natural water content ranges from 31 to 62%.
- (4)
- Stiff to very stiff clay (referred to as Stiff Bangkok Clay), usually 5 m to 10 m, but extending up to the depth of 20 m to 30 m. The water content is relatively low, 15 to 32%.
- (5)
- First sand layer, 8 m to 16 m thick, generally found at 20 m to 30 m. It can be fine to medium sand and occasionally contains traces of clay or silt. The color is yellowish to grayish brown. The water content varies from 12 to 25%.
- (6)
- Very stiff to hard clay layer, found below the medium to dense sandy layer, color varying from light gray to grayish brown, about 10 m to 15 m thick, extending to a depth of 30 m to 40 m. The water content ranges from 15 to 22%. It should be noted that the hard clay layer at some location appears below the second sand layer, a depth greater than 65 m.
- (7)
- Second sand layer (very dense sand layer) is found below the very stiff to hard clay layer, all the way down to the end of the borehole, at 50 to 65 m. The sand is silty, yellowish brown to brownish gray in color. Most of the large bore piles for the high–rise buildings require pile tips to be based in this layer to yield their maximum capacities.
The piled foundations are deep foundations, that are a main part of a building structure to transferring its load to layers of soil below. The piled foundations are important for the construction of many building in the Bangkok area, since it is located on compressible soil at a shallow depth. Foundations in Bangkok are generally focused on deep piled foundations, which, with significant groundwater level rises, affect behavior between 0 m to 80 m below the ground. Usually, the pile foundations have a length of ~15–60 m, with lengths of 15–28 m and 0.20–0.60 m diameters for medium, and lengths of 30–60 m and 0.60–2.00 m diameters for high rise buildings.
2.3. Groundwater Levels Trend in the Bangkok Aquifer System
Figure 2 shows groundwater levels changing with time in Bangkok. In 1989–1997, groundwater level decreased to −30 m, because excessive groundwater usage exceeded the safe yield. That, resulted from urban growth, that expanded radially, and groundwater extraction for industrial use. Following strict government control of groundwater extraction, which included a policy for pricing groundwater and expansion of tap water supply network from surface water sources in the ‘thirsty’ industrial suburban areas. The plan slightly raised the price of groundwater to eventually appropriate the consumption costs of tap water. Then, in 1997, the groundwater level started to recover. The Thai Department of Groundwater Resources (DGR) [6] predicted that the groundwater will rise to the hydrostatic pressures (i.e., pressure from stationary columns of water at those depths) from 2025 to 2040. Despite, rate of groundwater level rise after 2010 was slower than before, the groundwater rise up to hydrostatic levels was slowed and the groundwater level still increases. The effect of groundwater level slightly increased after 1997. The soil pore water pressure was increased, which led to a decrease in the effective stress and strength of the soil. Due to those legislation, the rate of subsidence for some settled stations in the Bangkok area was reduced from over 100 mm/year [15,16] to about 10–20 mm/year.
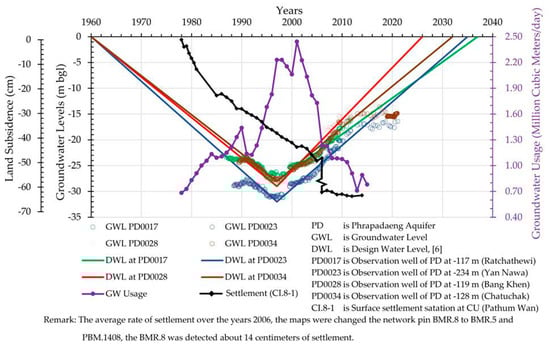
Figure 2.
Groundwater levels changed with time in Bangkok.
2.4. Reference Pile
Static pile test data were obtained from a test pile at Silom–Sathon, located in the inner city zone of Bangkok (13.706261 N, 100.536521 E). This 20 floor building was completed in 1999, during the period of maximum groundwater drawdown (1997–1999). The bored pile, constructed by using a wet process, had 1 m diameter and the pile tip was at −55 m (below ground level). This pile was used as reference for the simulations: it was labeled T55D1.0.
3. Numerical Modeling
Numerical modelling is a tool with computational simulation that was applied to tackle complex geological problems with mathematical models to represent the physical behaviors based on relevant hypothesis and simplifying assumptions. Numerical modelling was used to assist in the study with finite element analysis, which used the PLAXIS 2D CONNECT Edition V20 program (Delft, The Netherlands). It obtained a fully coupled flow deformation analysis that was took into account to investigate the pile behaviors due to groundwater level changes with time of the hydraulic boundary conditions. The numerical simulation was carried out for investigating the behaviors of pile head and surface soil movement due to changing groundwater levels with time. Load–settlement curves, stress distribution along with the pile, and plastic points of surrounding soil and pile capacity were calculated.
3.1. Geometric Model and Boundary Conditions
The model mesh covered a 100 m depth by 30 m width domain, much larger than the required distance of six times the pile diameter at the side and the pile base. The boundary condition for the mesh was constrained from moving in the horizontal direction for both side boundaries, and the bottom boundary was fixed in all directions. The mesh was used was symmetric across the axes and used 15–node triangular elements. PLAXIS 2D automatically generated the mesh. The mesh varied from coarse far from the pile to very fine close to the pile, see Figure 3b. The zone labeled ‘A’ extended to 2.5 m from the pile with coarseness factor 0.10, ‘B’ to 5 m, coarseness factor 0.20, ‘C’ to 10 m, coarseness factor 0.30, and ‘D’ to 30 m, coarseness factor 0.50. The total number of elements was 8313.
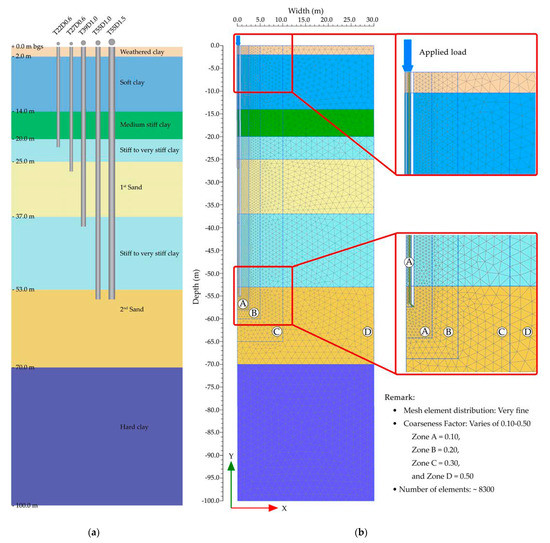
Figure 3.
Model and mesh used: (a) Pile dimensions and soil layers; (b) finite element mesh.
The five bored pile models are set out in Table 1 and an example of piled numerical modeling is shown in Figure 3. Each pile has a six character reference, e.g., TtDd, where t is the pile tip depth below ground level (e.g., 22 m) and d is the pile diameter (e.g., 0.6 m)—see examples in Figure 3a.

Table 1.
Model pile dimensions and soil at pile base.
3.2. Constitutive Model and Model Parameters
The piles were modeled as linear elastic (LE) materials and the soil model was defined Mohr–Coulomb (MC) and Hardening Small strain (HSsmall). Here, the constitutive model for all clay was based on the HSsmall model, an elastoplastic type of hyperbolic model. In addition, this model incorporated strain dependent stiffness moduli, simulating the different interactions of soils from small strains to large strains [28] (Figure 4). The HSsmall material data set, representing soft Kaolin clay for numerical modeling from Brinkgreve [29], is listed in Table 2 for verification of pile–soil movement. Using HSsmall model in the Bangkok subsoils condition, Tanapong et al. demonstrated the result of pile load test from finite element method (FEM), that gives high accuracy for the entire range of the observed pile settlement curves [30]. For this study, the soil parameters of Bangkok subsoil were taken from Likitlersuang et al. [31], who calibrated the model for Bangkok soils. All parameters are summarized in Table 3.
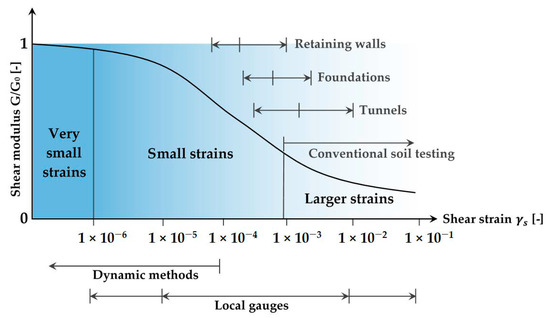
Figure 4.
Characteristic stiffness–strain behavior of soil with typical strain ranges for laboratory tests and structures.
Table 2.
Speswhite kaolin clay parameters for numerical method verification.
Table 3.
Model parameters used in analyses.
3.3. Head Function of Groundwater Level Change
Observed data at the PD0023 groundwater station were used to assign the change of groundwater level (GWL) in the simulation: Figure 2 shows the trends during drawdown and rising groundwater levels. The head functions of groundwater change were set to −0.75 m/year from years 1957 (GWL −0 m) to 1997 (GWL −30 m)—where GWL indicates the level below the ground and +0.75 m/year after 1997 (GWL −30 m) to 2037 (GWL −1 m) for groundwater level drawdown and rising states. Note that the maximum groundwater level in 2037 was set at GWL = −1 m, to prevent the groundwater seeping through the ground surface.
3.4. Fully Coupled Flow Deformation Analysis
A fully coupled flow–deformation was simulated to investigate the simultaneous development of deformations and pore pressures in partially and fully saturated soils together with changes with time of the hydraulic boundary conditions [23]. The suction behavior assigned for unsaturated soil layer located above the phreatic level was also considered. The general formulation of consolidation based on total pore pressure follow Biot’s theory [33]. The formulation is based on small strain theory and Darcy’s law for groundwater flow is assumed. Additionally, Bishop’s effective stress [34] is employed and is defined as Equation (1):
where σ is the vector with total stresses (σ = {σxx σyy σzz σxy σyz σzx}T), σ′ is the effective stresses, m is a vector containing unity terms for normal stress components and zero terms for the shear stress components (m = {1 1 1 0 0 0}T), pw is the pore water pressure, pa is the pore air pressure, and χ is an effective stress parameter called matric suction coefficient and varies from 0 to 1 covering the range from dry to fully saturated conditions. Usually equal to 1 in the saturated state (χ = 1) and equal to 0 in dry state (χ = 0).
σ = σ′ + m(χpw + (1 − χ)pa)
4. Numerical Analysis
4.1. Verification
The pile–soil movements obtained from numerical analysis were compared with the experimental data for a centrifugal model test by Morrison and Taylor [13,14]. They studied pile foundations in reconstituted Speswhite kaolin clay, during a rising groundwater event. A typical centrifuge model is shown in Figure 5a. The numeric model was created using the same dimensional centrifuge model scale Figure 5b. The parameter of the proportion of gravity was defined equal to 100 (ΣMweight = 100), the pile foundations, at the prototype scale (1:100), corresponded to actual piles with 1.6 m diameter and 15 m depth. The materials data set and groundwater property representing Speswhite kaolin clay for the model are shown in Table 2. In steps of the simulated calculation, that were followed by the centrifugal model test.
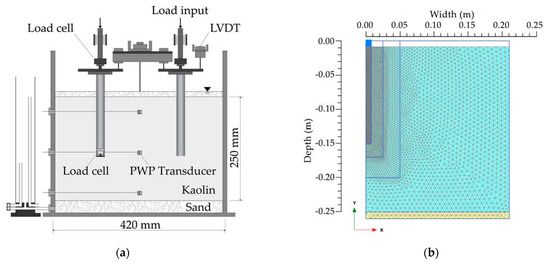
Figure 5.
Experimental setup for centrifugal model test: (a) 1:100 scale model of two piles, placed in the centrifuge; (b) mesh model for centrifugal model verification.
The axial pile load–settlement curves from the centrifuge test and simulations are compared in Figure 6a. Note that, in the simulations, the initial vertical effective stress for the groundwater level rise was set to correspond with values measured in the centrifuge tests. Although, this was slightly artificial, the vertical effective stress degradation at the pile base was correlated well with pile–soil up movement—see Figure 6b. Therefore, the model was considered appropriate for further numeric investigation.
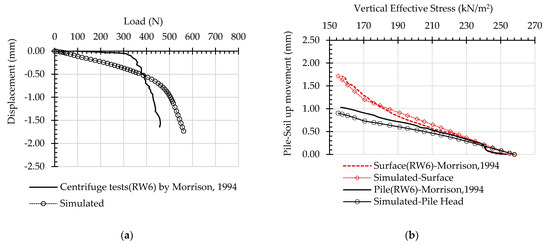
Figure 6.
(a) Axial pile load–settlement curves from the centrifuge test and simulation; (b) vertical effective stress degradation at pile base was positively correlated with pile–soil movement.
4.2. Applied Load on the Pile Head
Generally, the working pile load is designed to carry without exceeding the allowable settlement requirement. The working load is usually determined by applying a suitable safety factor to the ultimate load. Loads leading to a displacement of 10% of the pile diameter displacement (10%D) were defined as the ultimate load by Whitaker and Cooke [35]. For simulation with groundwater rising, the working load was uniformly distributed over the area of the head of each pile. A 2.5 safety factor was applied to the ultimate load to derive ‘safe’ working loads, shown in Table 4 (‘Applied load’ column).
Table 4.
Applied loads.
Figure 7 shows relation between the whole pile loads (evenly distributed over the pile head) and settlement in the Bangkok subsoil conditions, shown in Figure 3. For the pile load and settlement curve was calibrated using the full field pile load test (T55D1.0, Reference case, see Section 2.3), shown as the T55D1.0 solid line. The applied loads are summarized in Table 4.
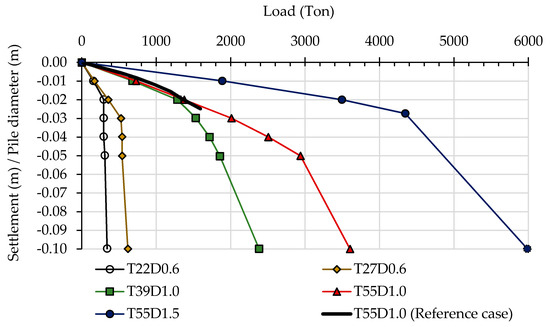
Figure 7.
Ultimate Loads vs. settlement.
4.3. Procedure of FE Simulation
The simulation was divided into five stages (Figure 8). Times are days from t = 0 in 1957 for 29,200 days to 2037.
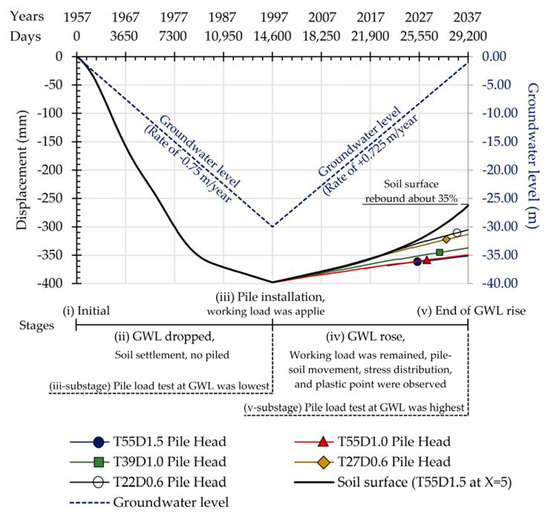
Figure 8.
Pile–soil movements with groundwater level change.
- (i.)
- Initial (In 1957, t = 0): This stage was the generation of initial distribution of vertical and horizontal stresses, the soil unit weight, and the coefficient of soil pressure was used to calculate the initial soil stress state. The initial pore water pressure was assigned assuming hydrostatic pressure only.
- (ii.)
- Groundwater levels dropped (t = 0 to 14,600 days): The fully coupled flow and deformation analysis was used for calculation. The groundwater head function was defined from −0.0 to −30.0 m, decreasing at a rate of −0.75 m/year. At the end of this step, the groundwater level was the lowest.
- (iii.)
- Pile installation (In 1997, t = 14,600 days): The piles were installed and loaded axially with the working load. The model assumed that no soil displacement occurred while the piles were installed. The pore water pressure was set as in the previous step. The piles were installed at a minimum groundwater level before rising. One sub-step (iii-substage) was included in this step: the piles were tested when the groundwater level was lowest, for comparing with the load settlement curve after the groundwater stopped rising.
- (iv.)
- Groundwater levels rose (t = 14,600 to 29,200 days): The fully coupled flows and deformations were calculated in this step. The groundwater level rose from −30.0 to −1.0 m at +0.725 m/year. Note that the groundwater level rise was constrained to 1.0 m to prevent groundwater seeping onto the surface. The working load of each pile remained constant. The pile head and soil surface movement, stress distribution along with the pile and the occurrence of plastic points in each time step, was registered.
- (v.)
- End of groundwater rise (In 2037, t = 29,200 days): The groundwater level was highest and close to the hydrostatic pressure. The ultimate load of piles was determined from the load settlement curve, using the pile diameter displacement (10%D), which was defined as the ultimate load [35]. For (v–substage), the pile load settlement curve was compared with the piles at the lowest groundwater level in (iii–substage). Pile load reduction in each pile settlement was computed.
5. Results and Discussion
The pile–soil movement, pile capacity, load distribution along with the pile and plastic point of pile–soil interaction, which took into account the simultaneous development of deformations and pore pressures in partially and fully saturated soils, with time-dependent changes of the hydraulic boundary conditions, are discussed in this section.
5.1. Pile–Soil Movement
Figure 8 shows the pile–soil movements during the groundwater drawdown and followed by a subsequent rise. The groundwater drawdown stage was involved to realistically simulate consolidated soil behavior. It indicated that the soil surface subsided during the drawdown period. Each of the piles was installed at the lowest groundwater level, and the working load was maintained during the groundwater level rise. The pile foundation (at pile head) and the soil (at X = 0.05 m from pile surface) moved. The largest soil movement was found near the surface. In our simulation, the soil surface rebounded about 35% of the total soil surface settlement. The rising groundwater level will cause both an upward movement of the ground and pile foundation.
Figure 9 shows the pile head settlements, relative to the soil surface, versus time. For piles loaded to working loads, settlements generally increased when the groundwater level rose. The analysis showed that pile settlements relative to the ground surface increased with groundwater level. Longer and larger piles settled more than shorter and smaller ones.
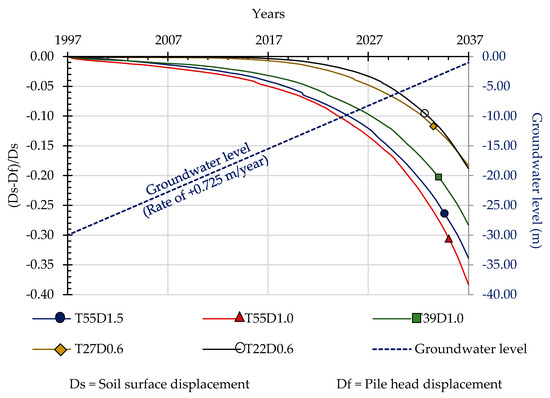
Figure 9.
Normalized displacements relative to the groundwater level vs. time.
Figure 10 shows the magnitude of pile and soil displacement, along the vertical axis, with the groundwater rise from 1997 to 2037. The pile foundation and the soil both moved. All the piles became shorter, i.e., pile head moved less than the base: this was caused by elastic shortening of pile shaft and by the displacement of pile toe. The largest soil movement was found near the soil surface. The differential displacement, between pile and soil around the pile, reduced the horizontal effective stress, that relative to reduction of earth pressure coefficient at pile shaft. Hence, the pile shaft friction was reduced. In addition, Figure 10 shows neutral points (marked NP in the figure), the levels of zero pile soil displacement. The relative displacement increased at points away from the neutral point [36]. These neutral points were found between 0.9 to 0.98 L, where L in the pile length.
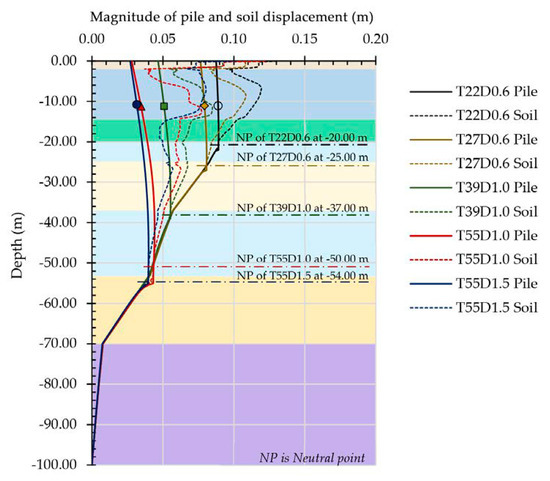
Figure 10.
Magnitude of pile and soil displacement along the vertical axis.
5.2. Stress Distribution along the Pile
The changes in vertical stress distribution along with the pile every 10 years from the year of groundwater rise (after 1997) were plotted as shown in Figure 11. When the groundwater level rose, the axial compressive stress for all piles reduced. For the small piles (T22D0.6 and T27D0.6), the stress decrease was distributed along the pile, whereas the large piles (T39D1.0, T55D1.0 and T55D1.5), stress changes were located nearer the pile tips. Alternatively, we note that the rate of the stress reduction was slower for the small piles than for the large pile.
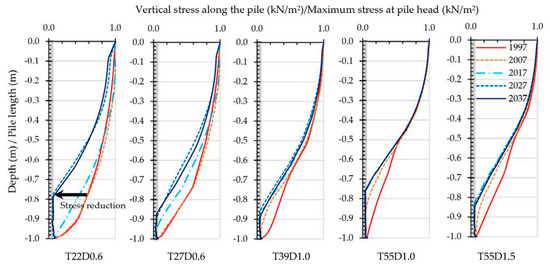
Figure 11.
Stress distribution along the pile.
The reduction of stress distribution along the pile, with groundwater level changes, was affected by soil swelling soil around the pile, as mentioned in Section 5.1. Although the working load remained on the pile head, the soil upward displacement forced the pile up, together with the soil–pile interaction force. Hence, the stress distribution along the pile reduced. In addition, some compressive forces were transferred to tension forces in the pile, as noted by O’Reilly and Al–Tabbaa [36], tension forces will be induced on piles in swelling ground.
5.3. Plastic Points
The plastic points represented the stress points are in a plastic state. In the model, the failure criteria were represented with failure points that were plastic in any step in the calculation. The failure points indicated that the stresses lie on the surface of the failure envelope. The failure point of the soils around the pile were further checked to understand the stress distribution caused by the plastic point. In Figure 12 the whole pile was constantly loaded with the working load. When the groundwater level rose, a plastic point ( red cube) was observed. In the year when the groundwater level was lowest (1997), the plastic points of the soils around the pile appeared in the first sand layer. When the groundwater level rose, plastic points developed. The plastic points expanded downwards in the first sand layer and simultaneously in the soft clay. For the pile through the first sand layer, a larger number of plastics points appeared surrounding the soil layer, because the groundwater level rise had most effect on the sand layer, around the pile, with deceasing effective stress. It is postulated that the permeability of sand layer is much greater than that of clay layer.
red cube) was observed. In the year when the groundwater level was lowest (1997), the plastic points of the soils around the pile appeared in the first sand layer. When the groundwater level rose, plastic points developed. The plastic points expanded downwards in the first sand layer and simultaneously in the soft clay. For the pile through the first sand layer, a larger number of plastics points appeared surrounding the soil layer, because the groundwater level rise had most effect on the sand layer, around the pile, with deceasing effective stress. It is postulated that the permeability of sand layer is much greater than that of clay layer.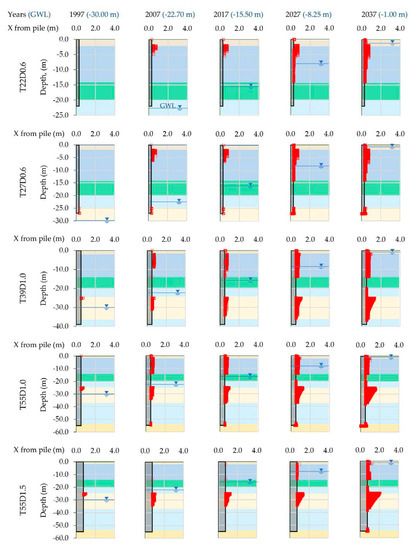
Figure 12.
Plastic points along the pile.
5.4. Reduction of Pile Capacity
Generally, the pile capacity or ultimate load of the pile was determined by the load-settlement curve [37]. Figure 13 shows the reduction of pile capacity with rising groundwater level with the pile load. The piles were evaluated for capacity when the groundwater level was lowest (marked ‘Low’ in the figure) in 1997 and highest (‘High’) in 2037. The whole pile load capacity was reduced with increasing groundwater level, which indicated that the effective stress in surrounding soil decreased with increasing pore water pressure. The fraction of pile load reduction in each pile settlement is shown in Figure 14. The largest reductions of pile load were found in pile T22D0.6 (−2.0%) and T27D0.6 (−3.0%). At the ultimate loads (defined by Whitaker and Cooke, when displacement was 10% of diameter [35]), the larger and longer piles had lower pile load reductions than the shorter and smaller piles.
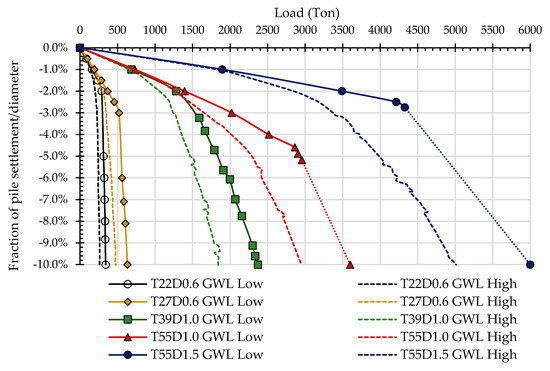
Figure 13.
Reduction of pile capacity with rising groundwater level.
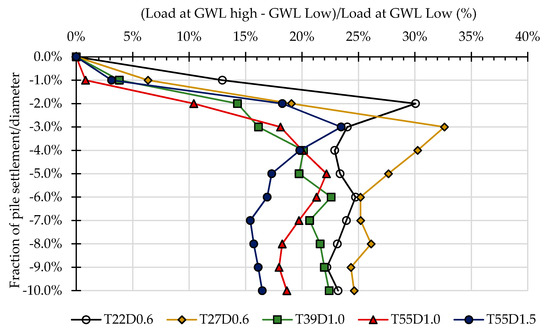
Figure 14.
Fraction of pile load reduction in each pile settlement.
6. Conclusions
Finite element analysis with fully coupled flow deformation was used to determine the pile–soil response with change of groundwater level. The change of pile capacity was explained by pile–soil interaction, stress distribution along the pile and development of plastic points. In summary:
- (1)
- Groundwater rises caused both an upward movement of the ground and the pile foundation. The pile settlement relative to the ground surface increased with groundwater level.
- (2)
- A reduction of stress distribution along with the pile with rising groundwater level was caused by soil swelling around the pile. The pile shaft friction was reduced It was accompanied by development of plastic points (failure points).
- (3)
- Groundwater rises caused a loss in pile foundation capacity. For any percentage of pile settlement/diameter in the analysis, the percentages of pile load reduction have not reach to 35%, the pile that was working load with factor of safety less than 2.0, the pile stability should be concerned when the groundwater level is changed. In this study, the evaluation of pile stability due to groundwater level rising for preliminary guidelines to protect existing structures are proposed.
Further study will be necessary by extending the scope of study to the magnitude of pile capacity reduction which may depend on rate of groundwater rising that related to various scenario of groundwater usage. Moreover, series of full field and physical model tests will provide the validity of the findings in this study.
Author Contributions
Conceptualization and methodology, H.P. and P.L.; numerical simulations, H.P.; validation, formal analysis, writing—original draft preparation, H.P. and P.L.; writing—review and editing, P.L. and U.S.; visualization, H.P.; supervision, project administration, U.S.; funding acquisition, H.P. and U.S. All authors have read and agreed to the published version of the manuscript.
Funding
This research was funded by the Thailand Science Research and Innovation (TSRI) under the “Research and Researchers for Industries (RRi) Grant No. PHD58I0003” collaborating with BMS construction Company Limited and King Mongkut’s Institute of Technology Ladkrabang Research Fund Grant No. KREF046012 for the financial sponsorship (PLAXIS Software).
Institutional Review Board Statement
Not applicable.
Informed Consent Statement
Not applicable.
Data Availability Statement
The data presented in this study are available on request from the corresponding author.
Acknowledgments
The authors would like to thank Pornkasem Jongpradist for numerical instructions for geotechnical and Phayom Saraphirom for recommendation of groundwater modeling.
Conflicts of Interest
The authors declare no conflict of interest.
References
- Cox, D.W. The effects of changing groundwater levels on construction in the City of London. In Groundwater Problems in Urban Areas; Thomas Telford: London, UK, 1994; pp. 263–277. [Google Scholar] [CrossRef]
- Al-Sefry, S.A.; Şen, Z. Groundwater rise problem and risk evaluation in major cities of arid lands—Jedddah case in Kingdom of Saudi Arabia. Water Resour. Manag. 2006, 20, 91–108. [Google Scholar] [CrossRef]
- Allocca, V.; Coda, S.; De Vita, P.; Iorio, A.; Viola, R. Rising groundwater levels and impacts in urban and semirural areas around Naples (Southern Italy). Rend. Online Soc. Geol. Ital. 2016, 41, 14–17. [Google Scholar] [CrossRef]
- Gattinoni, P.; Scesi, L. The groundwater rise in the urban area of Milan (Italy) and its interactions with underground structures and infrastructures. Tunn. Undergr. Space Technol. 2017, 62, 103–114. [Google Scholar] [CrossRef]
- Wang, G.-Y.; Zhu, J.-Q.; Zhang, D.; Wu, J.-Q.; Yu, J.; Gong, X.-L.; Gou, F.-G. Land subsidence and uplift related to groundwater extraction. Q. J. Eng. Geol. Hydrogeol. 2020, 53, 609–619. [Google Scholar] [CrossRef]
- Seven Associated Consultants, Co. Ltd. Study of the Effects on the Substructures due to the Recovery of Piezometric Pressure in the Aquifers in the Bangkok Area and Its Vicinity, Final Report; Department of Groundwater Resources DGR: Bangkok, Thailand, 1999. [Google Scholar]
- Nikos, S.; Ioannis, P.; Constantinos, L.; Paraskevas, T.; Anastasia, K.; Charalambos, K. Land subsidence rebound detected via multi-temporal InSAR and ground truth data in Kalochori and Sindos regions, Northern Greece. Eng. Geol. 2016, 209, 175–186. [Google Scholar] [CrossRef]
- Wang, G.Y.; Zhu, J.Q.; You, G.; Yu, J.; Gong, X.-L.; Li, W.; Gou, F.G. Land rebound after banning deep groundwater extraction in Changzhou, China. Eng. Geol. 2017, 229, 13–20. [Google Scholar] [CrossRef]
- Wilkinson, W. Rising groundwater levels in London and possible effects on engineering structures. In Hydrogeology in the Service of Man, Memoires of the 18th Congress of the International Association of Hydrogeologists; IAH: Cambridge, UK, 1985; pp. 145–157. [Google Scholar]
- Shahriar, M.A.; Sivakugan, N.; Urquhart, A.; Tapiolas, M.; Das, B.M. A Study on the Influence of Ground Water Level on Foundation Settlement in Cohesionless Soils. In Proceedings of the 18th International Conference on Soil Mechanics and Geotechnical Engineering, Paris, France, 2–6 September 2013; pp. 953–956. [Google Scholar]
- Cox, J.W.; Armishaw, D.W. 18. The effects of changes in pore water pressures on the carrying capacities and settlements of driven piles end bearing in a sand and gravel stratum. In Recent Developments in the Design and Construction of Piles; ICE: London, UK, 1979. [Google Scholar]
- Challa, P.K.; Poulos, H.G. Behaviour of single pile in expansive clay. J. Southeast Asian Soc. Soil Eng. 1992, 22, 189–216. [Google Scholar]
- Morrison, P.R.J.; Taylor, R.N. 17. Foundations in a rising groundwater environment. In Groundwater Problems in Urban Areas; Thomas Telford: London, UK, 1994; pp. 342–354. [Google Scholar] [CrossRef]
- Morrison, P.R.J.; Taylor, R.N. Modelling of foundations in a rising groundwater environment. In Proceedings of the International Conference on Soil Mechanics and Foundation Engineering, New Delhi, India, 5–10 January 1994; pp. 655–658. [Google Scholar]
- Nutalaya, P.; Rau, J.L. Bangkok: The sinking metropolis. Episodes 1981, 1981, 3–8. [Google Scholar] [CrossRef][Green Version]
- Phien-Wej, N.; Giao, P.H.; Nutalaya, P. Land subsidence in Bangkok, Thailand. Eng. Geol. 2006, 82, 187–201. [Google Scholar] [CrossRef]
- Intachai, K. The Thesis of Analytical Assessment on Pile Capacity in View of Effects of Groundwater Drawdown and Rebound Associated with Deep Well Pumping in Bangkok. Master’s Thesis, Asian Institute of Technology, Pathum Thani, Thailand, May 2016. [Google Scholar]
- Intui, S.; Soralump, S. The Vertical Bearing Capacity Behavior of Single Pile by Geotechnical Centrifuge. Kasetsart Eng. J. 2018, 31, 55–68. [Google Scholar]
- Roh, Y.; Kim, I.; Kim, G.; Lee, J. Comparative Analysis of Axial Load Capacity for Piled-Raft Foundation with Changes in Groundwater Level. KSCE J. Civ. Eng. 2019, 23, 1–9. [Google Scholar] [CrossRef]
- Dassault; Systemes Simulia Corporation Province ABAQUS/CAE User’s Manual 6.13. Available online: http://130.149.89.49:2080/v6.13/books/usi/default.htm (accessed on 11 September 2020).
- Saowiang, K.; Huy, P. Numerical analysis of subsurface deformation induced by groundwater level changes in the Bangkok aquifer system. Acta Geotech. 2020, 8, 1265–1279. [Google Scholar] [CrossRef]
- Brinkgreve, R.; Vermeer, P.A. PLAXIS 2D Reference Manual CONNECT EDITION V20; Delft University: Delft, The Netherlands, 2019. [Google Scholar]
- Galavi, V. Internal Report Groundwater flow, fully coupled flow deformation and undrained analyses in PLAXIS 2D and 3D Vahid Galavi Research department. Plaxis Rep. 2010. [Google Scholar] [CrossRef]
- Japan International Cooperation Agency (JICA). The Study on Management of Groundwater and Land Subsidence in the Bangkok Metropolitan Area and Its Vicinity; JICA: Tokyo, Japan, 1995; pp. 1-1–11-5. [Google Scholar]
- Tanachaichoksirikun, P.; Seeboonruang, U.; Fogg, G.E. Improving Groundwater Model in Regional Sedimentary Basin Using Hydraulic Gradients. KSCE J. Civ. Eng. 2020, 24, 1655–1669. [Google Scholar] [CrossRef]
- Nutalaya, P.; Rau, J.L. Structural framework of the Chao Phraya basin, Thailand. In Proceedings of the Symposium on Cenozoic Basins Thailand: Geology and Resources, Chiang Mai, Thailand, 24 October 1984; pp. 106–129. [Google Scholar]
- Prust, R.; Davies, J.; Hu, S. Part 6: Tunnels and Underground Structures: Pressuremeter Investigation for Mass Rapid Transit in Bangkok, Thailand. Transp. Res. Rec. J. Transp. Res. Board 2005, 1928, 205–217. [Google Scholar] [CrossRef]
- Atkinson, J.H.; Sallfors, G. Experimental determination of soil properties. Proc. ECSMFE 1991, 3, 915–956. [Google Scholar]
- Brinkgreve, R.B.J.; Kappert, M.H.; Bonnier, P.B. Hysteretic damping in a small-strain stiffness model. In Numerical Models in Geomechanics—NUMOG X; Taylor & Francis Group: London, UK, 2007; pp. 737–742. [Google Scholar] [CrossRef]
- Rukdeechuai, T.; Jongpradist, P.; Wonglert, A.; Kaewsri, T. Influence of Soil Models on Numerical Simulation of Geotechnical works in Bangkok subsoil. Res. Dev. J. Vol. 2009, 20, 17–28. [Google Scholar]
- Likitlersuang, S.; Teachavorasinskun, S.; Surarak, C.; Oh, E.; Balasubramaniam, A. Small strain stiffness and stiffness degradation curve of Bangkok Clays. Soils Found. 2013, 53, 498–509. [Google Scholar] [CrossRef]
- Kamchoom, V.; Leung, A.K. A simplified modelling method of seasonal tree root-water uptake effects on pore-water pressure and ground subsidence. In Proceedings of the 7th International Conference on Unsaturated Soils, HKUST, Hong Kong, China, 3–5 August 2018. [Google Scholar]
- Biot, M.A. General theory of three dimensional consolidation. J. Appl. Phys. 1941, 12, 155–164. [Google Scholar] [CrossRef]
- Bishop, A.W.; Blight, G.E. Some aspects of effective stress in saturated and partly saturated soils. Geotechnique 1963, 13, 177–197. [Google Scholar] [CrossRef]
- Whitaker, T.; Cooke, R.W. An investigation of the shaft and base resistance of large bored piles in London Clay. In Large Bored Piles; Institution of Civil Engineers: London, UK, 1966; pp. 7–49. [Google Scholar]
- Al-Tabbaa, A.; Arup, O. Heave induced pile tension: A simple one-dimensional analysis. Int. J. Rock Mech. Min. Sci. Geomech. Abstr. 1990, 27, 366. [Google Scholar] [CrossRef]
- Hirany, A.; Kulhawy, F.H. Conduct and Interpretation of Load Tests on Drilled Shaft Foundations; Detailed Guidelines: Final Report; Electric Power Research Institute: Palo Alto, CA, USA, 1988; Volume 1, p. 376. [Google Scholar]
Publisher’s Note: MDPI stays neutral with regard to jurisdictional claims in published maps and institutional affiliations. |
© 2021 by the authors. Licensee MDPI, Basel, Switzerland. This article is an open access article distributed under the terms and conditions of the Creative Commons Attribution (CC BY) license (https://creativecommons.org/licenses/by/4.0/).