Article

Automatic Actin Filament Quantification and Cell Shape Modeling of Osteoblasts on Charged Ti Surfaces

1
Department of Cell Biology, Rostock University Medical Center, 18057 Rostock, Germany
2
Department of Computer Science and Electrical Engineering, Institute of General Electrical Engineering, University of Rostock, 18059 Rostock, Germany
3
Physics of Surfaces and Interfaces, Institute of Physics, University of Rostock, 18059 Rostock, Germany
4
Soft Matter and Biophysics, Institute of Physics, University of Greifswald, 17489 Greifswald, Germany
5
Leibniz Institute for Plasma Science and Technology e.V. (INP), 17489 Greifswald, Germany
6
Interdisciplinary Faculty, University of Rostock, 18059 Rostock, Germany
*
Author to whom correspondence should be addressed.
Appl. Sci. 2021, 11(12), 5689; https://doi.org/10.3390/app11125689
Submission received: 21 April 2021 / Revised: 27 May 2021 / Accepted: 16 June 2021 / Published: 19 June 2021
(This article belongs to the Special Issue Biosystem–Material Interactions)

Abstract

:

Featured Application

In medical implantology the human biosystem interacts with the artificial biomaterial. For permanent implants, e.g. titanium, it is of importance that cells immediately accept and occupy the material surface. To get deeper insights into molecular mechanisms of the cell behavior at the interface is of great importance. The future aim is to find an optimum in material surface design for tissue-integrated, long living implants.

Abstract

Surface charges at the cell–biomaterial interface are known to determine cellular functions. Previous findings on cell signaling indicate that osteoblastic cells favor certain moderately positive surface charges, whereas highly positive charges are not tolerated. In this study, we aimed to gain deeper insights into the influence exerted by surface charges on the actin cytoskeleton and the cell shape. We analyzed surfaces with a negative, moderately positive, and highly positive zeta (ζ) potential: titanium (Ti), Ti with plasma polymerized allylamine (PPAAm), and Ti with a polydiallyldimethylammonium chloride (PDADMA) multilayer, respectively. We used the software FilaQuant for automatic actin filament quantification of osteoblastic MG-63s, analyzed the cell edge height with scanning ion conductance microscopy (SICM), and described the cellular shape via a mathematical vertex model. A significant enhancement of actin filament formation was achieved on moderately positive (+7 mV) compared with negative ζ-potentials (−87 mV). A hampered cell spreading was reflected in a diminished actin filament number and length on highly positively charged surfaces (+50 mV). Mathematical simulations suggested that in these cells, cortical tension forces dominate the cell–substrate adhesion forces. Our findings present new insights into the impact of surface charges on the overall cell shape and even intracellular structures.

1. Introduction

In bone tissue engineering, chemical [1,2,3] and topographical [4,5,6] surface modifications have been proven to be a powerful tool in optimizing implant designs for clinical applications in dental and orthopedic surgery in terms of interaction with osteoblastic cells. Biomaterial surface properties such as chemistry, roughness, stiffness, wettability, and surface charge are key driving forces controlling the cell–material interaction from the onset [7,8,9]. During the implantation of a biomaterial in the body, the cells and tissues immediately face the material surfaces, which are artificial for the biosystem. These artificial surfaces, e.g., metals, are without any ligands for cellular adhesion, and the cells have to find a way to adhere and grow in the initial contact phase.
Extracellular matrix and cell adhesion: In the physiological surroundings, cells adhere to molecules of the extracellular matrix (ECM) via their transmembrane heterodimeric integrin receptors [10]. Thus, α2β1 integrin is the target for collagen I, α5β1 is the target for fibronectin, and αvβ3 is the target for bone sialo protein, molecules i.a. localized in the organic bone matrix. The immediate occupation of the implanted surface by the surrounding cells is of importance, since a permanent implant should be integrated as strongly as possible and accepted by the biosystem, e.g., the bone. Finally, the osteoblasts should synthesize the bone matrix on the implant surface in the same quality as in their physiological environment. However, because osteoblasts are physiologically adherent cells, they need support via the implanted artificial surface for their initial attachment. One way is to provide vital biological cues for the specific adhesion by coating metal surfaces with molecules of the ECM including collagen I, fibronectin, peptides, and glucosamines [11,12,13]. However, these techniques are expensive, and the storage time of the final implant product is reduced due to these complex organic components.
New design strategies come from the recognition that in the initial adhesion phase, a nonspecific adhesion of cells on the metal surface could occur through van der Waals, ionic, and electrostatic forces [11,14]. For the first cell encounter, electrostatic forces between the material surface and the cells play an important role. These forces originate from the negatively charged pericellular hyaluronan coat around the osteoblasts, resulting in an overall net negative cell charge of −15.6 mV as measured by zeta potential (ζ) in single cells [15]. Cohen et al. identified different thicknesses of the hyaluronan coat in epithelial cells (2.2 µm) and chondrocytes (4.4 µm) in vitro and found that only when the hyaluronan brush collapses is the cell drawn to the surface, and integrin-mediated binding becomes possible in an advanced adhesion step [14]. In vivo, this pericellular matrix substance lies between the plasma membrane and the ECM to absorb secreted collagen molecules and to provide a scaffold for the final assembly of the ECM fibrils such as collagen [16].
Electric fields, currents, and charges in tissues: In their natural niche, many tissues in different areas, such as the brain, skin, muscles, heart, and bones not only generate but also are exposed to different levels of currents and electrical fields [17,18]. Endogenous electric fields and currents occur e.g., during embryogenesis, as wound potential, as dynamic transmembrane potentials, or by piezoelectric effects in bone [19]. Piezoelectricity is the electric charge that originates from spatial shifts of ions in biological matter but also in solid materials such as crystals in response to applied mechanical stress [20]. Recent studies have shown that bone piezoelectricity may be associated with the piezoelectric properties of bone hydroxyapatite [21]. Although the currents generated in a single micro-crystal of bone hydroxyapatite are negligible, the combination of currents generated by moist collagen fibers may probably add up [22], resulting in stronger currents and higher voltages at the ends of the collagen fibers, in whole trabeculae, and even on the surface of bone [21]. These generated “bone” currents can also affect bone collagen itself, especially the binding between collagen and hydroxyapatite. Currents generated during dynamic stress (during walking) could promote stability of these bonds [21]. However, also, the collagen molecules and fibrils itself generate piezoelectric effects. Minary-Jolandan isolated individual Col-I fibrils (approximately 100 nm in diameter) from bovine Achilles tendons and revealed that the Col-I fibrils exhibit a piezoelectric coefficient of d14 ≈ 1 pC/N by nanoscale characterization via piezo-response force microscopy [23,24]. During body movements, bones are under dynamic strain. Such deformations induce a fluid flow in the channels of bone with negative surface charges leading to streaming potentials of the order of a few 10 mV, under typical physiologic loads [25]. The electrical conductivity of bone was characterized via impedance measurements using a voltage of 10 mV [26]. This voltage is below the typical cell membrane potential of 60 to 80 mV [27] and should not disrupt cellular membrane or kill cells in the tissue [26]. In physiological solution, there are no free electrons to carry the current. Thus, electric currents are carried by charged ions [18]. As mentioned above, in the extracellular matrix of tissues and around cells, the glycosaminoglycan hyaluronan molecules possess carboxyl groups (C(= O)OH) that are negatively charged.
Thus, the development of new surface modification strategies for implant materials can benefit from these physiological phenomena of endogenous fields and charges of the biosystem.
Bioactivation of biomaterial surfaces: Due to the aforementioned electrostatic forces between cells and materials at the interface, it was imaginable that positive surface charges could trigger the cell adhesion. Indeed, a chemical surface modification with a nanometer thin plasma polymer layer [28] is sufficient to push the cells’ initial adhesion (already after 2 min), as this nanolayer provides positively charged amino groups. This effect is to a greater extent than binding of the ECM protein collagen to the material surface [29].
The early stages of cell–substrate interaction involve cellular attachment, adhesion, and spreading [30], whereby the cell shape changes from spherical to elongated, resulting in a decreased cell height and an increased cell contact area with strengthened adhesion force [31]. This process is critical for normal cell function and successful osseointegration [32], as further cell activities are triggered thereafter.
Our previous research showed that material surface charges at the interface, deduced from the ζ-potential, possess a remarkable influence on diverse cellular functions, among them spreading [33], morphology, membrane integrity, proliferation, and intracellular calcium signaling [34]. According to the cell behavior, three categories of ζ-potential were described: negative, moderately positive, and highly positive [34]. Positive charges at the material surface provide unique cues that initiate an intensive cell response. However, it was revealed that these cell reactions occur in a so-called dose-dependent manner. Cells favor only a certain range of moderately positive material surface charges and cannot tolerate high charges around +50 mV [34]. Figure 1 summarizes our current knowledge on cell spreading and cell shape as a response to material surface charge. Here, the cellular behavior on 12 differently charged surfaces is averaged and depicted (see further information in the Supplementary Material for all layers used). For the first cell encounter, electrostatic forces between the material surface and the cells play an important role. These forces originate from the negatively charged pericellular hyaluronan coat around the osteoblasts, resulting in an overall net negative cell charge of −15.6 mV [15]. Therefore, rapid cell attachment can be mediated especially by a positive material surface charge. Our results show a strong correlation between the material surface charge and cell spreading within 24 h, which is optimal between +1 and +10 mV (ζ-potential). As the cell physiology is adversely affected on highly positively charged material surfaces [33,34], cells exhibit on these surfaces also an impaired cell spreading course and retain their circular morphology.
In this context, it is of interest to take a closer look at the cell shape. For this, the present study aimed to focus on the actin cytoskeleton as a stabilizer of the cell shape. Actin organization is essential for adhesion, cell contact formation and migration, as well as for directed cytoplasmic trafficking, such as signal transduction [35,36,37]. In particular, it is reported that the arrangement of the actin cytoskeleton is pivotal for cellular spreading as for the cell length control [38,39]. Several studies highlight a surface topography-dependent shift in actin filament formation in osteoblasts [40,41]. Hence, micropillar structures induce actin formation on the plateau of the pillars in a mimicry fashion. Is the charge of a surface also capable of affecting the actin arrangement and thus cell shape? To answer this question, we used three differently charged titanium surfaces, one from each ζ-potential category based on Gruening et al. [34]. We quantified the actin filament number and length of MG-63 osteoblasts after growing 1 and 24 h on the substrates in an automated approach using our FilaQuant software, which is freely available (version 2011, University of Rostock, Institute of Mathematics, Mathematical Optimization, Rostock, Germany) [40]. Additionally, we wanted to gain a deeper understanding of the influence that surface charges exert on the cells′ morphology. To this end, we measured the cell edge height via scanning ion conductance microscopy (SICM) and developed a mathematical vertex model to explain how actin rearrangement, caused by different surface charges, influences the cell shape.

2. Materials and Methods

2.1. Applied Titanium Arrays and Their Properties

Planar silicon arrays sputtered with 100 nm titanium (Ti) were obtained from the Center for Microtechnologies (ZFM, Norbert Zichner, University of Technology Chemnitz, Germany) at 1 × 1 × 0.075 cm in size (length × width × depth). Ti is covered by a natural oxide layer. The Ti specimens exhibited a negative ζ-potential of −87.5 mV at pH 7.4, a water contact angle (WCA) of 87.4°, and a surface free energy (SFE) of 37.6 mN/m [34]. On the one hand, these Ti substrates were coated with the plasma polymerized allylamine (PPAAm) nanolayer by a low-pressure plasma reactor [34,42] and were acquired from the Leibniz Institute for Plasma Science and Technology e.V. (INP). They displayed a moderately positive ζ-potential in the physiological range (+7.1 mV), a WCA of 66.9°, an SFE of 46.2 mN/m, and a layer thickness of 24.5 nm [34]. On the other hand, the substrates were modified by a polyelectrolyte multilayer (consisting of 10.5 polycation/polyanion pairs) terminated with polydiallyldimethylammonium chloride (PDADMA) by dip coating oppositely charged polyelectrolytes with a deposition robot (Riegler & Kirstein, Potsdam, Germany) [34,43]. They featured the following characteristics: +51.4 mV ζ-potential at pH 7.4 (0.15 bar), 38.7° WCA, 62.0 mN/m SFE, and 38.0 nm layer thickness [34]. The positive charge originates from weakly bound polycation chains, which can protrude into the solution under suitable conditions [43]. For a detailed description of surface preparations and characteristics, please refer to Gruening et al. [34]. Briefly, concerning characteristics, the ζ-potentials of the Ti samples were determined with the SurPASSTM system (Anton Paar, Ostfildern, Germany) by analyzing the streaming potentials at pH 6.5–8.0 in a 1 mM KCl solution. The exact values at pH 7.4 (physiological conditions for the cells in vitro) were calculated via a linear regression (GraphPad Prism version 6.05) [34]. The WCA and the SFE of the substrate/air interface were determined by the sessile drop method (distilled water and diiodomethane) using the Drop Shape Analyzer-DSA25 (Krüss, Hamburg, Germany) [34].

2.2. Cell Biological Investigations

For all experiments, human osteoblast-like MG-63 cells (American Type Culture Collection ATCC, CRL1427TM, Bethesda, MD, United States) [44] were cultured in Dulbecco’s Modified Eagle Medium (DMEM, 21063-029, Life Technologies Limited, Paisley, United Kingdom) with 10% fetal calf serum (Biochrom FCS Superior, Merck, Darmstadt, Germany) and 1% antibiotics (gentamicin, Ratiopharm, Ulm, Germany).

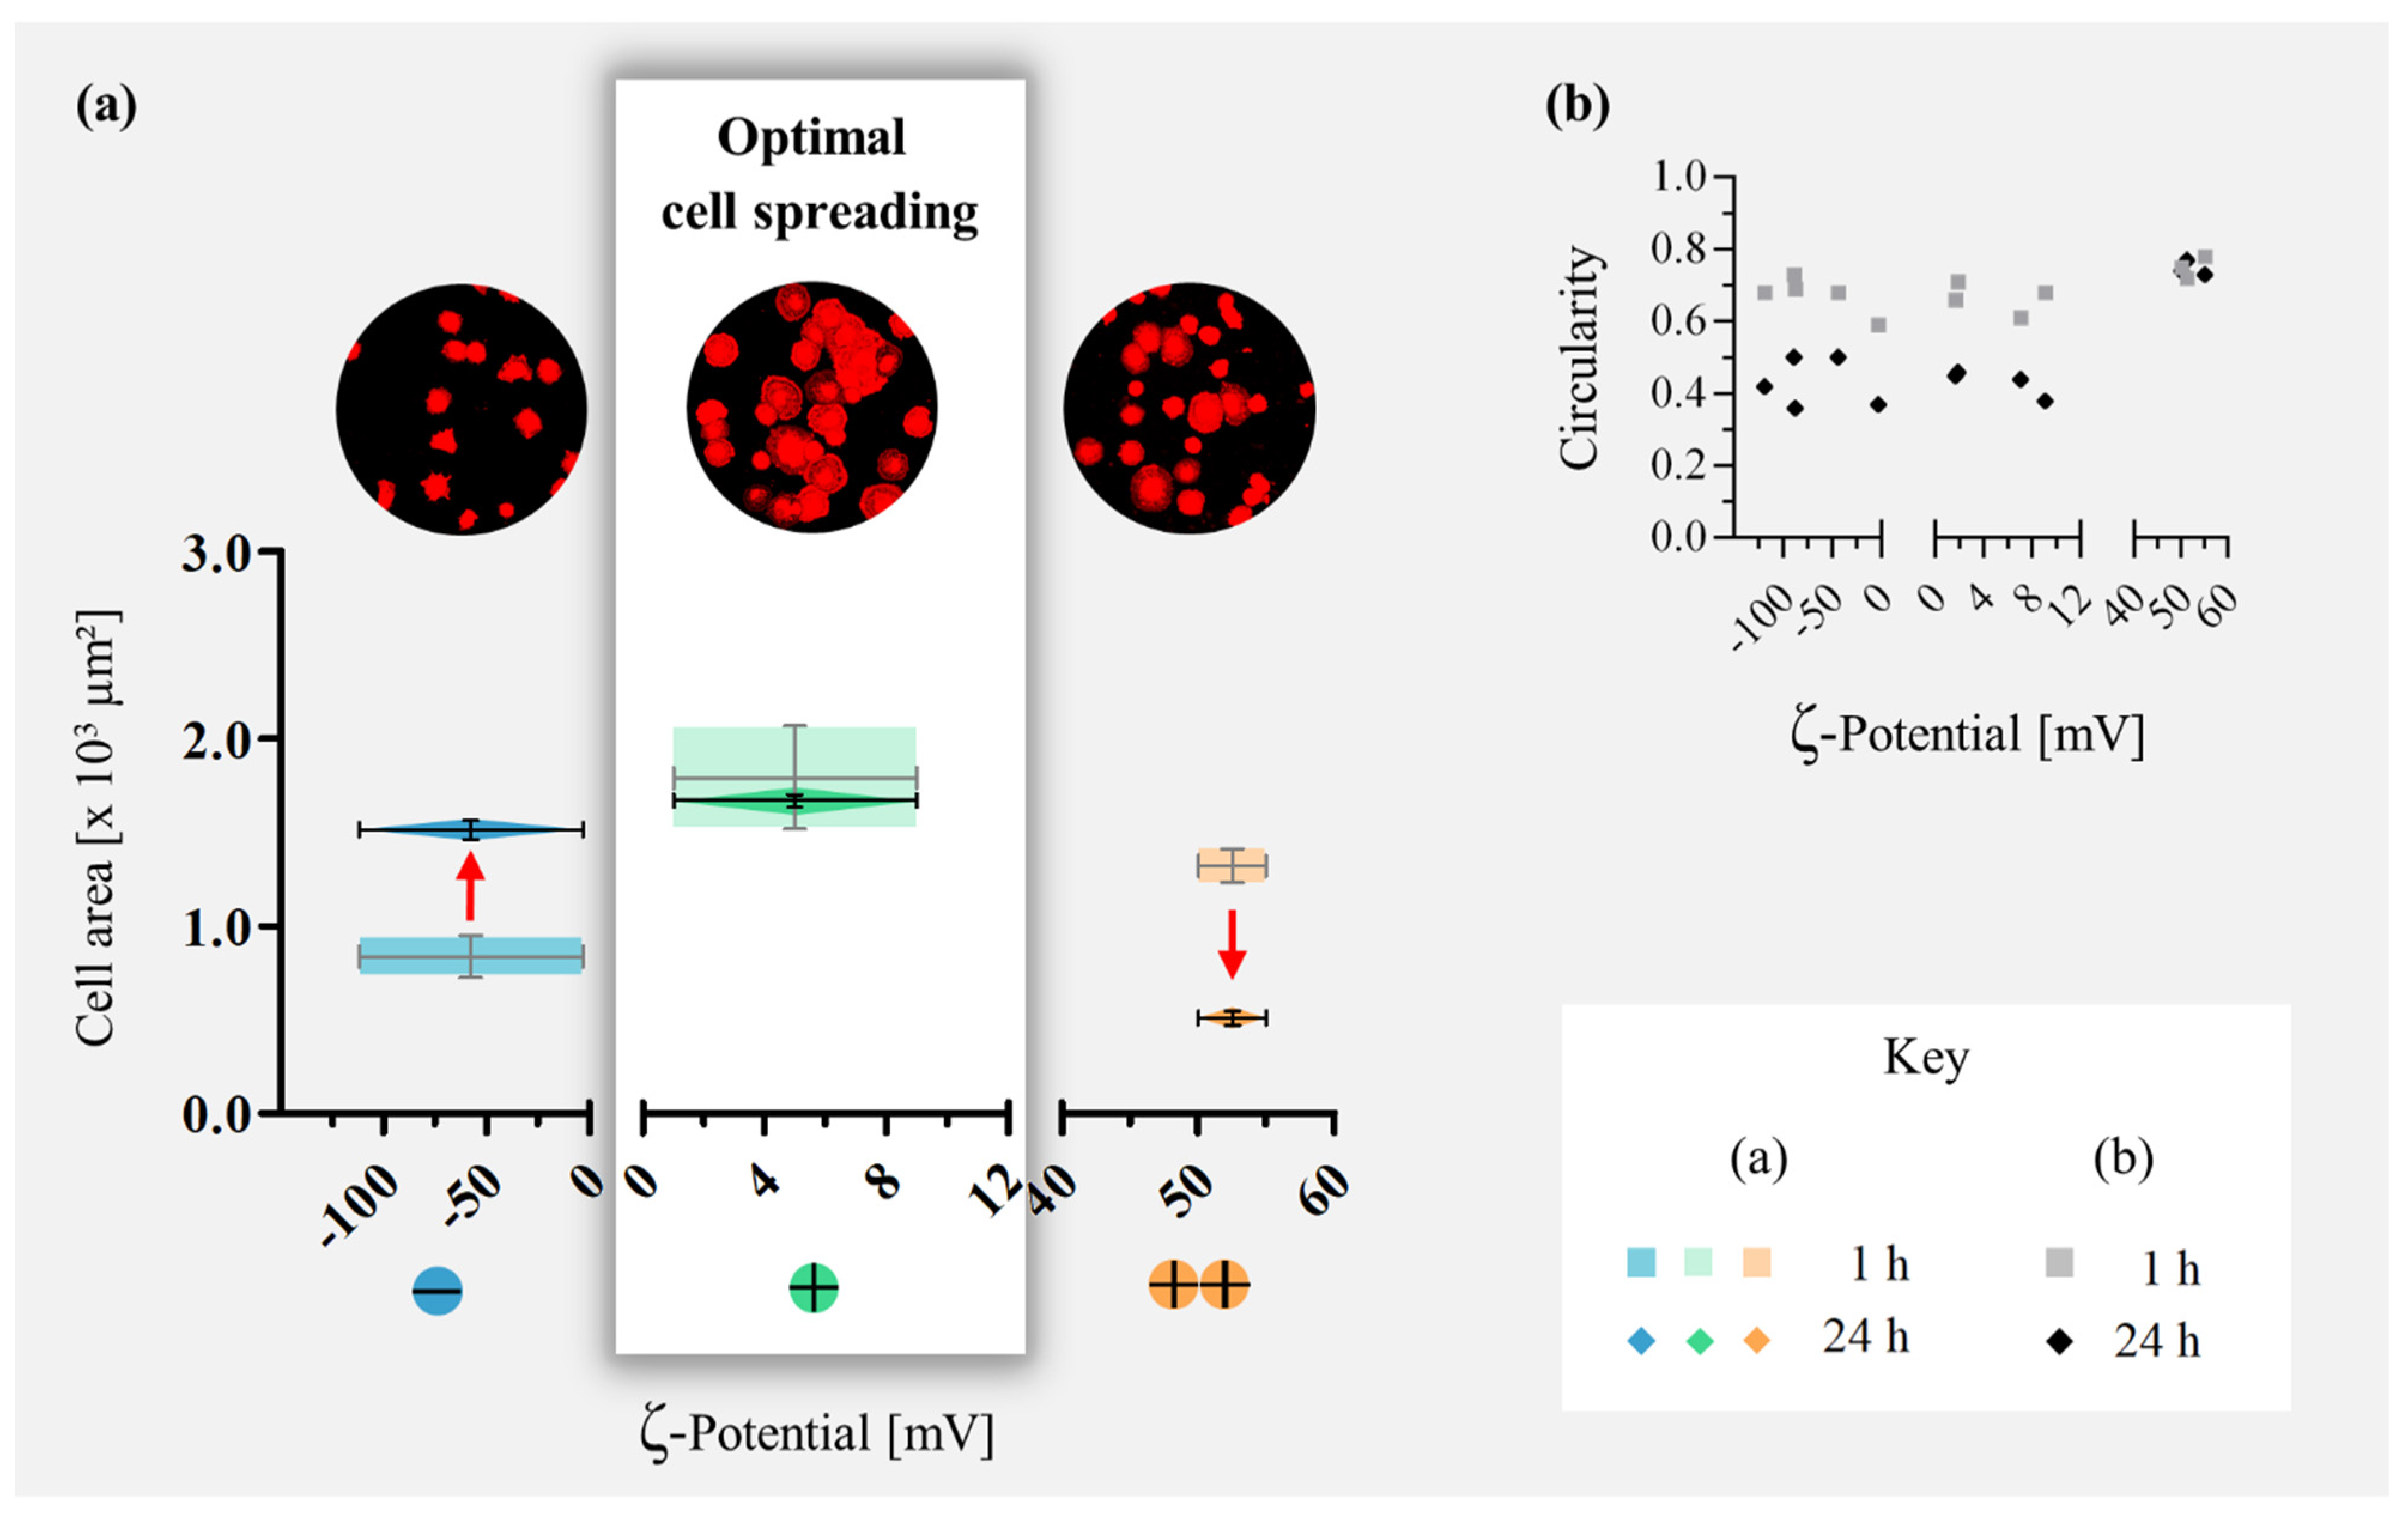
2.2.1. Plasma Membrane Staining and Cell Area Quantification

The membranes of the MG-63 cells were stained with the PKH-26 General Cell Linker Kit (Sigma-Aldrich Chemie, Taufkirchen, Germany) for 5 min at 37 °C in suspension [45]. Then, cells were seeded for 1 h on the substrates (50,000 cells/cm2) and fixed with 4% paraformaldehyde (PFA, 10 min, room temperature (RT)) after cultivation. Cell areas after 24 h were determined by vital fluoro-3-acetoxymethyl ester-stained cells (fluo-3, Life Technologies Corporation, Eugene, Oregon, US) [34]. Microscopic images were obtained using a confocal laser scanning microscope LSM780, a C-Apochromat 40x/1.20 W Korr M27 objective, and the ZEN black software 2011 SP4 (Carl Zeiss, Jena, Germany). The cell area in μm2 and the circularity of 45 cells per surface was assessed using the ‘‘measurement report’’ of the software Photoshop CC 2017 (Adobe, San Jose, CA, USA) (n = 3 independent experiments). The software calculates the circularity C according to Equation (1):
C = 4   π × A P 2  
where A is the cell area and P is the cell perimeter. A perfect circle is described by a value of 1.0 and an increasingly elongated polygon by a value converging to 0.

2.2.2. Scanning Electron Microscopy (SEM)

MG-63s (20,000 cells/cm2) were cultured for 1 h on the PPAAm-modified Ti arrays as previously described [34]. Briefly, after fixing with 2.5% glutardialdehyde (Merck, Darmstadt, Germany) at 4 °C overnight and rinsing with 0.1% sodium phosphate buffer (according to Sørensen, Merck, Darmstadt, Germany), the samples were dehydrated through an ethanol series of 30, 50, 75, 90, and 100% (for 5, 5, 15, 10, and 10 min, respectively) and dried in a critical point dryer (K 850, EMITECH, Taunusstein, Germany). The samples were sputtered with gold for 50 s (15 nm, SCD 004, BAL-TEC, Wetzlar, Germany). Field emission scanning electron microscopy (FE-SEM, ZEISS Merlin VP compact, Carl Zeiss, Oberkochen, Germany) was conducted with a high efficiency secondary electron detector HE-SE2 at magnifications of 2000× and 5000× (5 kV, 5.1 mm working distance).

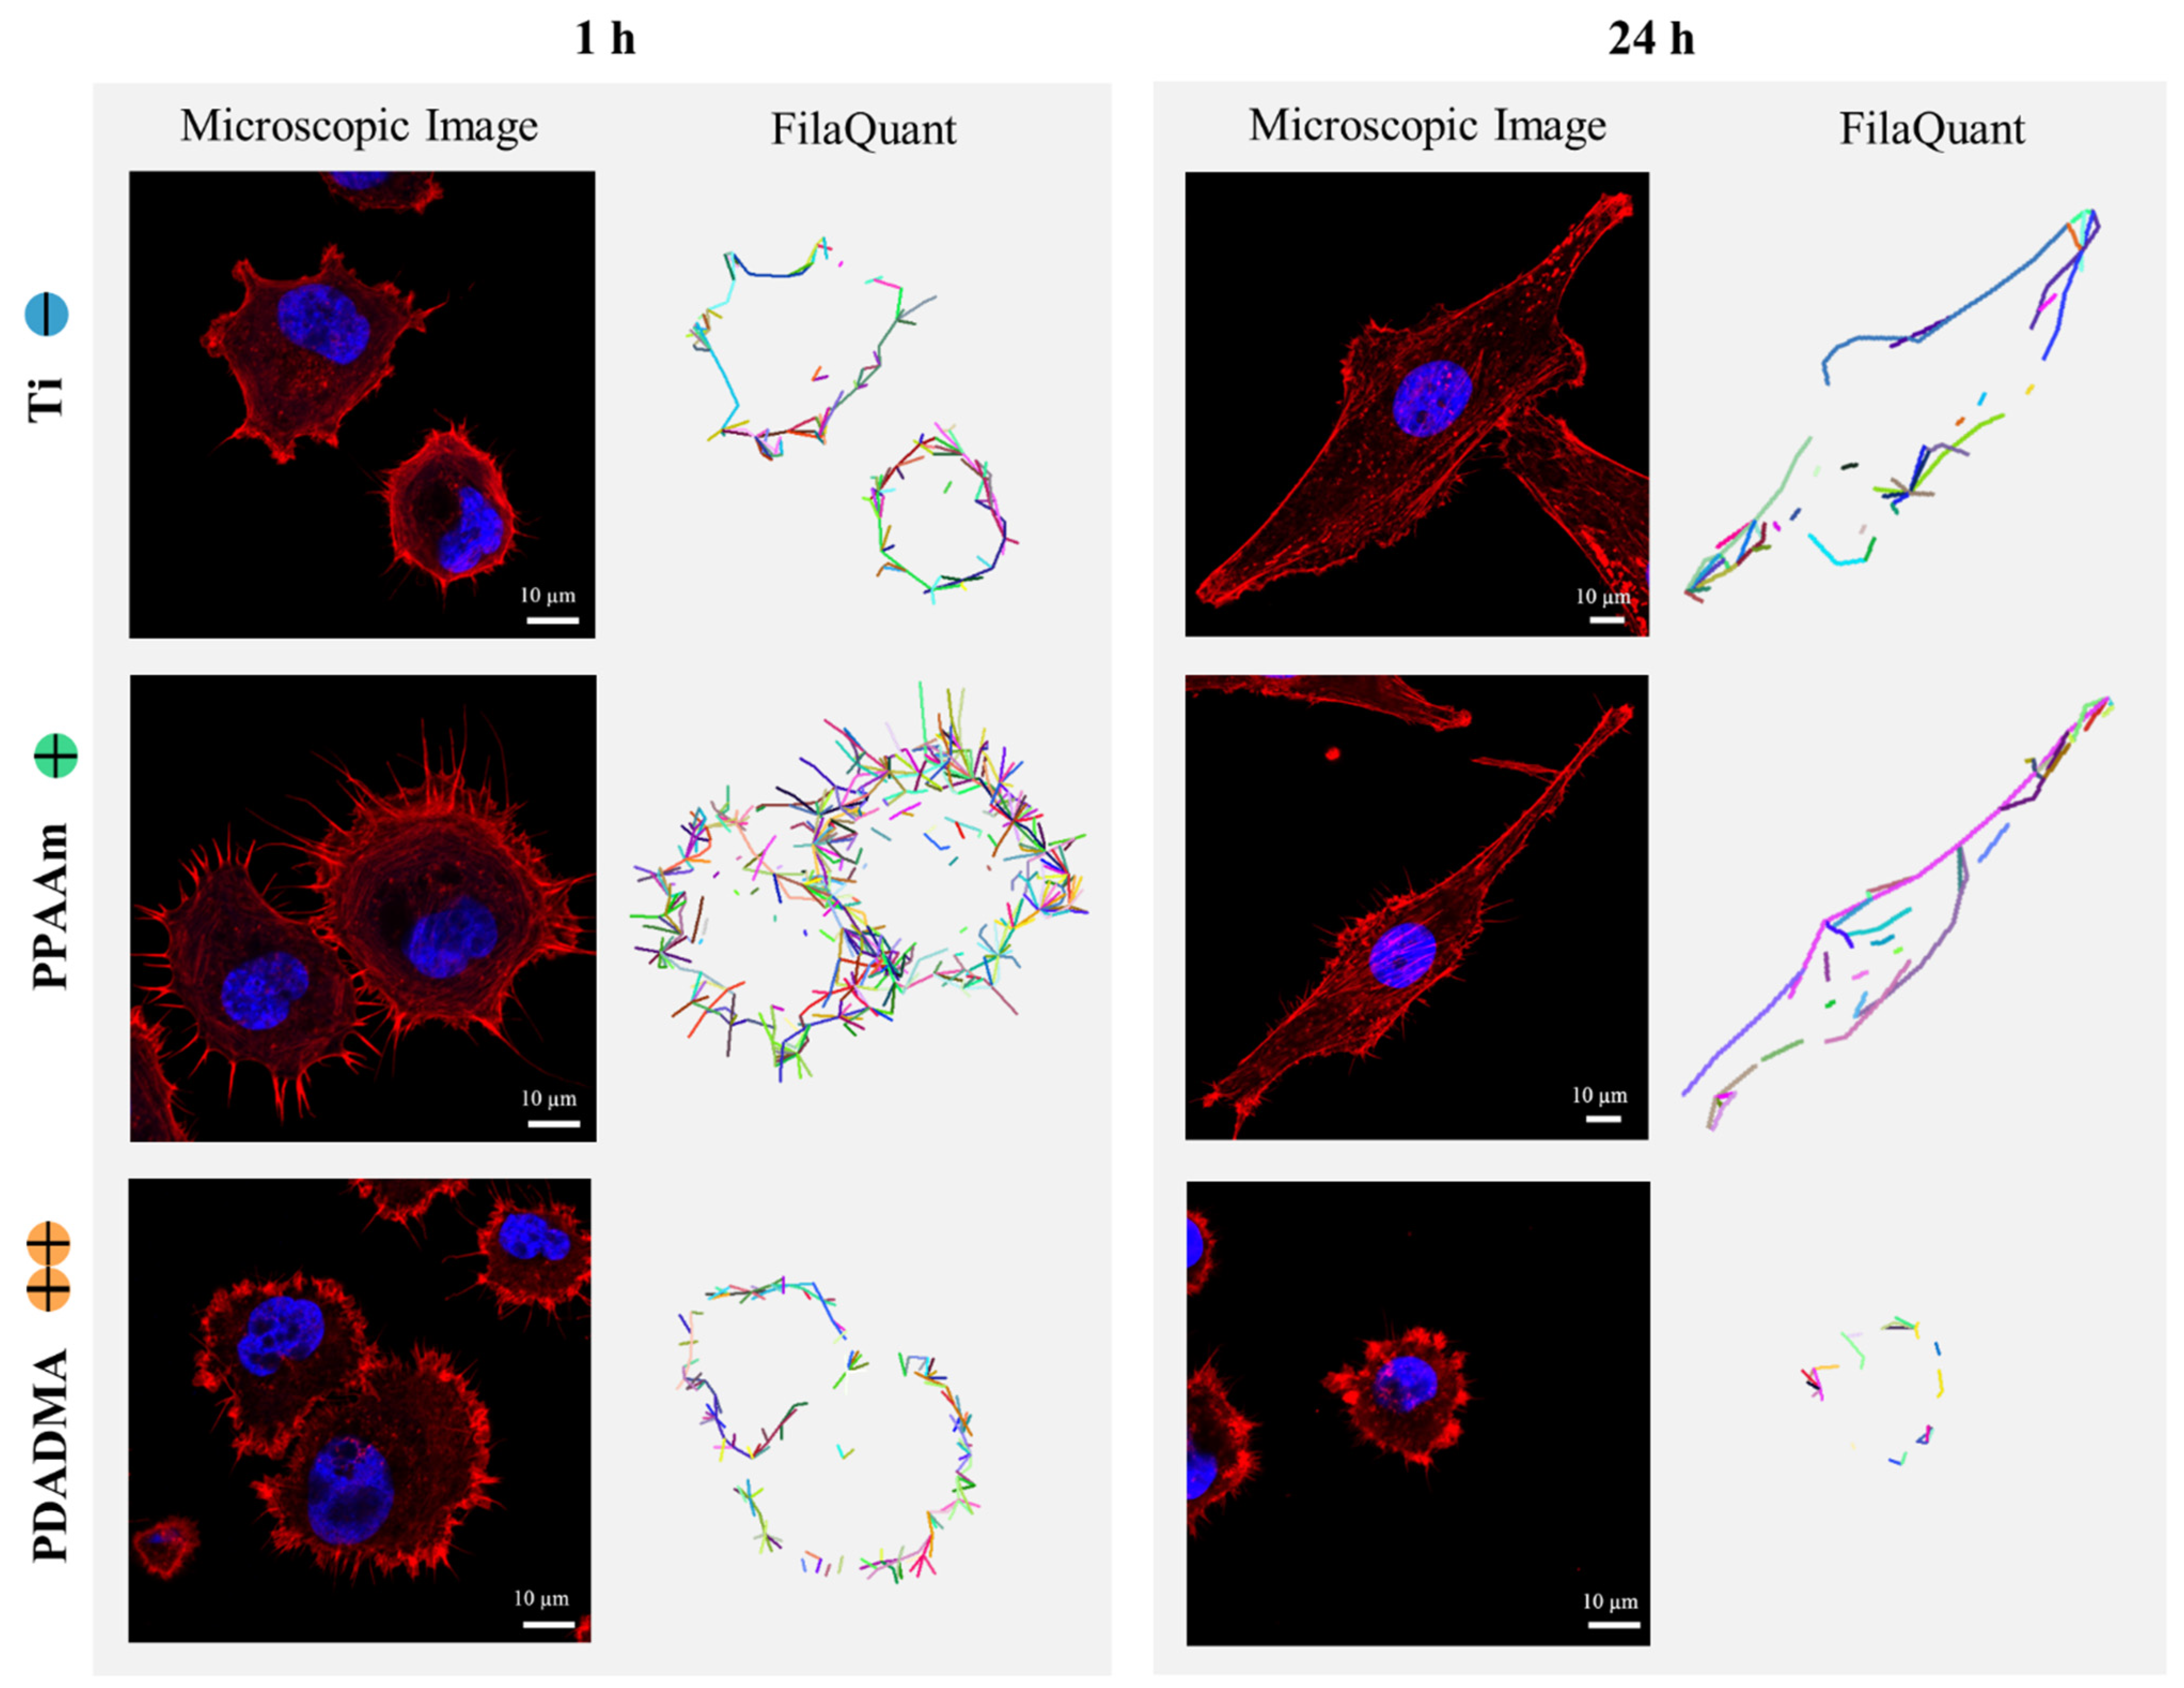
2.2.3. Actin Staining and FilaQuant Software

Actin staining: 20,000 MG-63 cells/cm2 were cultured on the Ti arrays for 1 and 24 h. After fixing them with 4% PFA, cells were washed twice with phosphate-buffered saline (PBS, Sigma-Aldrich Chemie, Taufkirchen, Germany) and permeabilized with 0.1% Triton X-100 (5 min, RT) (Merck, Darmstadt, Germany). Afterwards, cells were incubated with Alexa 546-phalloidin (diluted 1:100, Invitrogen, Germany) for 30 min in the dark at RT, washed twice, and embedded with a cover slip in FluoroshieldTM with 4′,6-diamidino-2-phenylindole (DAPI, Sigma-Aldrich Chemie, Taufkirchen, Germany). Actin was examined using the LSM780 with a Plan-Apochromat 63x oil immersion objective (Carl Zeiss; zoom 0.6 and 2) and the ZEN software (ZEISS efficient navigation, ZEN 2011 SP4, black edition, Carl Zeiss). Microscope images were converted to 8 bit and a size of 512 × 512 pixels using the software ImageJ 1.51f (Wayne Rasband, National Institutes of Health, USA).
FilaQuant analysis: Contrast and brightness settings were adjusted identically for all LSM images. Subsequent actin filament quantification via mathematical image processing was conducted by the software FilaQuant 2011 (University of Rostock, Institute of Mathematics, Mathematical Optimization) [46]. The main algorithm is based on a relaxation of the analytical criterion for a ridge, which is expressed in terms of a ridgeness measurement (line detection and line tracking). The parameters filament number, total filament length, maximum filament length, and mean filament length were evaluated for single cells (n = 10 cells per surface). Software settings were as follows: top-hat radius 10–12, noise penalizer 0.2–0.3, min. edge-length 4.4–5, max. edge-length 30–34.7.

2.2.4. Edge Height Measurement via Scanning Ion Conductance Microscopy

First, 4000 MG-63 cells/cm2 were cultured on pristine glass cover slides (Thermo Fisher Scientific, Waltham, MA, USA) as well as plasma polymer (PPAAm)-coated cover slides for 1 and 3 h. After fixation with 4% PFA, cells were washed thrice with PBS before measuring their nanomorphology in PBS with a Scanning Ion Conductance Microscope (SICM) (NX-bio, Park Systems, Korea) [47]. The measurements were performed with borosilicate glass nanopipettes exhibiting opening diameters below 80 nm. They were pulled from capillary tubes (inner diameter 0.58 mm) using a CO2 laser puller (Sutter P-2000, Sutter Instrument, Novato, CA, USA) with the following parameters: Heat: 260, Filament: 4, Velocity: 50, Delay: 225, Pull: 140. Topography images were acquired in approach–retract–scheme mode (ARS mode), which is often referred to as dynamic or hopping mode. The ion current setpoint was 98% of the base current (i.e., current far away from the sample, corresponding to ca. 1 nA). For each cell (n = 6 cells per surface after 1 h, n = 18 cells per surface after 3 h), 3 topography images (10 × 10 µm2, 128 × 128 pixels) at randomly chosen spots at the cell edges were taken. Cell edge heights were exemplarily measured with the open-source software Gwyddion (gwyddion.net, accessed on 17.03.2021) at 5 representative locations for each topography image.

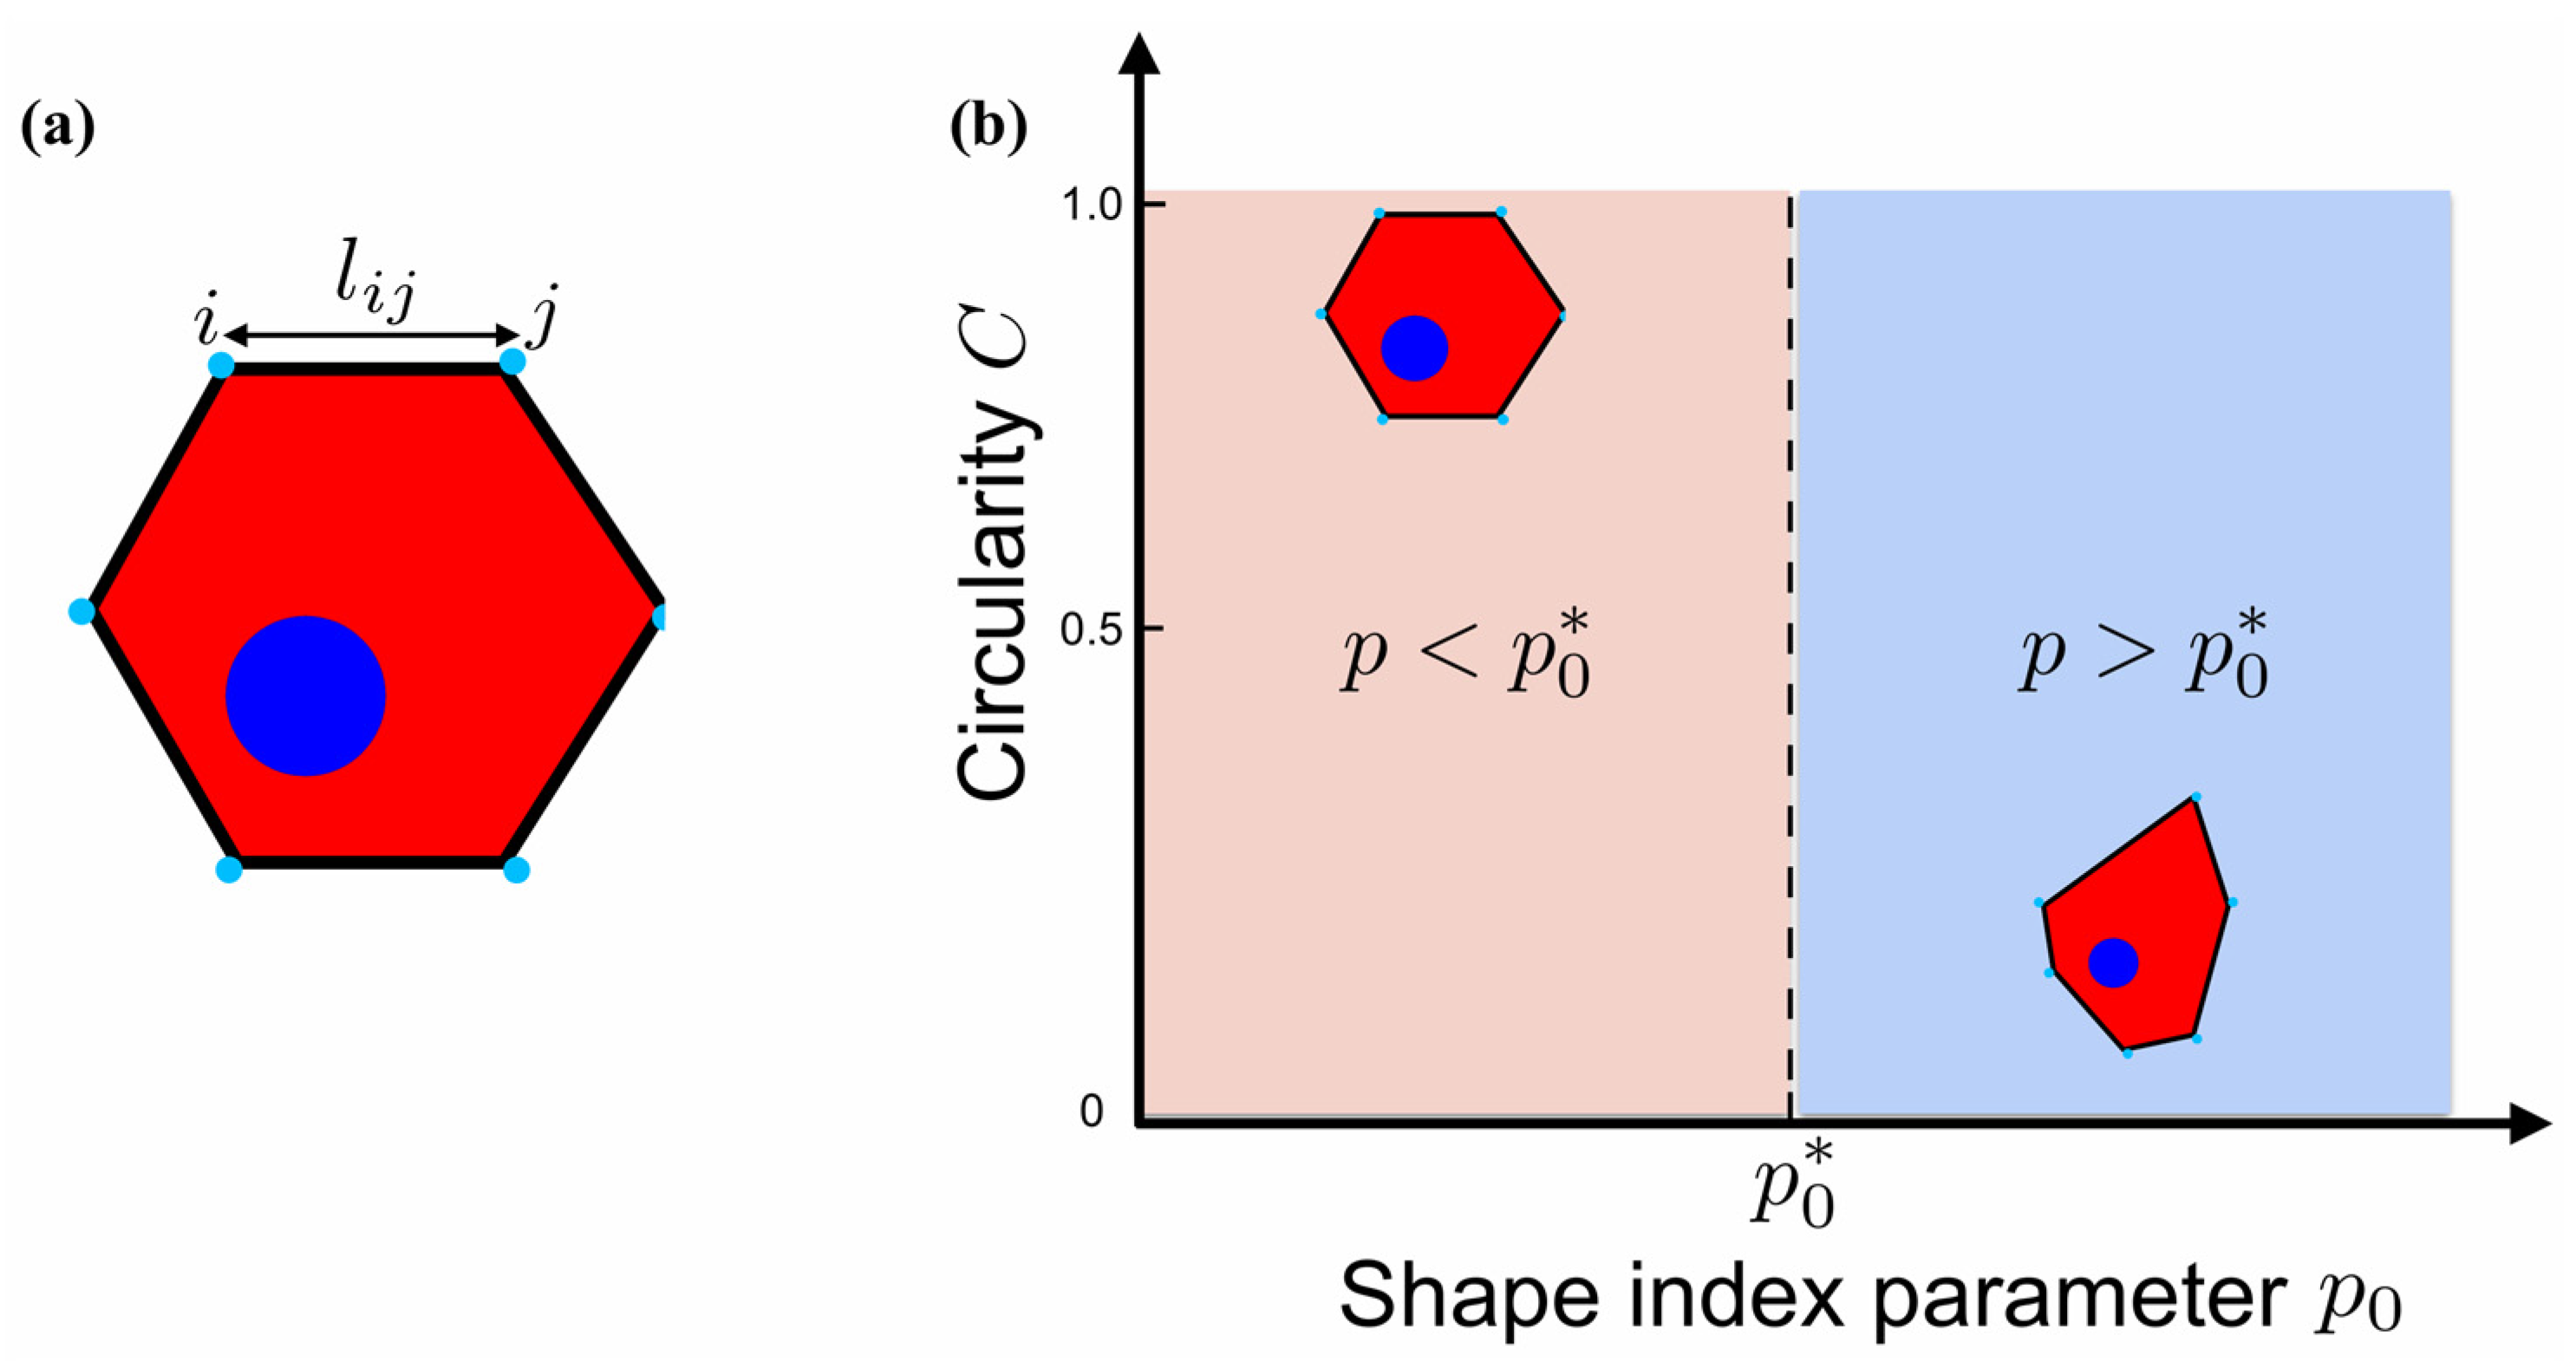
2.3. Mathematical Model for the Description of Cell Shape Changes

In order to study the influence of actin filament dynamics on the shape of cells placed on differently charged substrates, we simulated a mathematical vertex model for cell shapes [48,49,50]. The two-dimensional cross-section of a cell in this model is represented as a polygon specified by surrounding vertices (Figure 2a) [49,51,52]. The cell mechanical properties in stationary conditions are described by an energy function whose functional form is given by:
E = K A ( A A 0 ) 2 + K P ( P P 0 ) 2
where A is the cross-sectional area and P is the perimeter of the cell. A 0 is the preferred area that the cell strives to attain such that any deviation from it, i.e., A 0 , corresponds to cellular pressure, the magnitude of which depends on the deviation ( A A 0 ) and the constant K A , which denotes the strength of resistance to cell area changes. The second term represents the tensile properties of the cell membrane and consists of two terms, one quadratic in perimeter and the other linear in perimeter. The term that is quadratic in perimeter describes bond tension due to the actomyosin ring in the subcellular cortex. In contrast, the term that is linear in perimeter describes an effective cell membrane tension due to focal adhesions arising from cell–substrate interaction. The net contribution to cell membrane tension comes from cortical tension, due to actin filaments, that resists an increase in cell perimeter, and cell–substrate adhesion that tends to increase the cell perimeter by growing actin filaments. K P captures the effective resistance offered by the cell to any changes in the cell perimeter length. By introducing L , which is the typical diameter of an osteoblastic cell and has the dimension of length (μm), and dividing the whole equation by K P L 2 , Equation (2) can be expressed in the non-dimensional form as:
E ˜ = K ˜ A ( A ˜ A ˜ 0 ) 2 + ( P ˜ P ˜ 0 ) 2
where E ˜ = E / ( K P L 2 ) , K ˜ A = K A L 2 K P , A ˜ = A / L 2 , A ˜ 0 = A 0 / L 2 , P ˜ = P / L , and P ˜ 0 = P 0 / L . Various parameters of the model, as described by Equation (3), and their meaning are listed in Table 1. The shape of the cell is determined by quasi-static simulations in which, for a given set of parameter values of the energy function given by Equation (3), the system is relaxed to a force-balanced state using a Monte Carlo-based minimization algorithm.
The vertex models described by Equation (2) have been successful in predicting cell shapes due to mechanical interactions between cells in a confluent tissue [48,49,50]. Here, we use this model for studying shape changes in single cells. In our model, an osteoblastic cell is represented by a polygon with six sides, as shown in Figure 2a. A dimensionless shape index parameter can be defined as p 0 = P 0   / A 0   . Earlier studies of the vertex model for confluent tissues given by Equation (2) showed that a transition takes places at a critical value of p 0 = p 0 * . When p 0 < p 0 * , the stable configuration of a polygon with six sides is given by the ground state and has the shape of a regular hexagon, which is characterized by a higher circularity value (Figure 2b). However, when p 0 > p 0 * , the ground state is degenerate, and the polygon has an irregular shape which is characterized by a lower circularity value. For a regular hexagon, this transition has been shown to occur at p 0 * ~ 3.71 [53,54,55]. Based on this knowledge, we use the vertex model to understand what changes in the cell mechanical properties can induce experimentally observed changes in the morphology of single osteoblastic cells seeded on substrates with different charge properties.

2.4. Statistics

Non-parametric Kruskal–Wallis followed by Dunn’s multiple comparisons test and Mann–Whitney-U test with the software GraphPad Prism version 6.05 for Windows (GraphPad Software, La Jolla, CA, United States) were conducted on the p-values < 0.05. Results are presented in mean ± sem (standard error of the mean) for actin filament (Table 2) and cell area values (Figure 1). An unpaired t-test was performed for cell edge height values (Section 3.3) presented in mean ± SD (standard deviation).

3. Results

As the major component of the cellular cytoskeleton, actin is known to play a crucial role in diverse cellular processes which control the cell shape and thus the functional behavior of the cells. Cellular spreading requires the extension of the plasma membrane in association with the assembly of actin in filaments [56,57]. As shown in Figure 3, membrane protrusions occur at the growth zone of the cell, the lamellipodia, as thin finger-like structures called filopodia that sense their surroundings. They extend outward from the perimeter of the cell with a stabilizing and forward-growing effect pushed by actin filaments.

3.1. Actin Cytoskeleton and Quantification of Filaments

We focused on the quantification of the cellular actin filament organization on the three differently charged surfaces: Ti (−), PPAAm (+), and PDADMA (++). Confocal microscopy was applied to visualize the actin cytoskeleton after 1 and 24 h and the quantification was carried out by the software FilaQuant (Figure 4).
When regarding actin distribution after 1 h, considerable rearrangements were revealed, in particular on PPAAm. Here, the cells are extremely well developed with numerous, long, filopodial protrusions in comparison with uncoated Ti. Compared with PPAAm, filopodia on PDADMA surfaces are considerably shorter. In detail, the resulting data quantification via FilaQuant revealed a significantly shorter mean filament length on PDADMA (4.3 µm, compared with 6.2 and 6.6 µm on Ti and PPAAm, respectively), whereas the total filament length on PPAAm surfaces (1050.0 µm) tripled as a result of the threefold increase in the actin filament number (148.3) after 1 h in contrast to Ti (filament number: 62.3, total filament length: 386.5 µm) and PDADMA (filament number: 51.4, total filament length: 241.6 µm) (Figure 5, Table 2). The advantage of this moderately positively charged surface for cell occupation is clearly evident.
After 24 h, actin is organized typically as a network of well-defined stress fibers, spanning the entire cell body on negatively charged Ti and moderately positively charged PPAAm surfaces (Figure 4). On highly positively charged PDADMA surfaces, the actin formation is still confined to the outer cell edge and is presented in a clustered form. Here, the cells could neither spread nor form stress fibers, remaining round in shape, and having also shrunk in size. The total filament length shortened by about 6 times with respect to cells on Ti and PPAAm (Figure 5, Table 2). Similarly, the mean and maximum filament length decreased significantly by approximately 4.5 and 6 times, respectively.

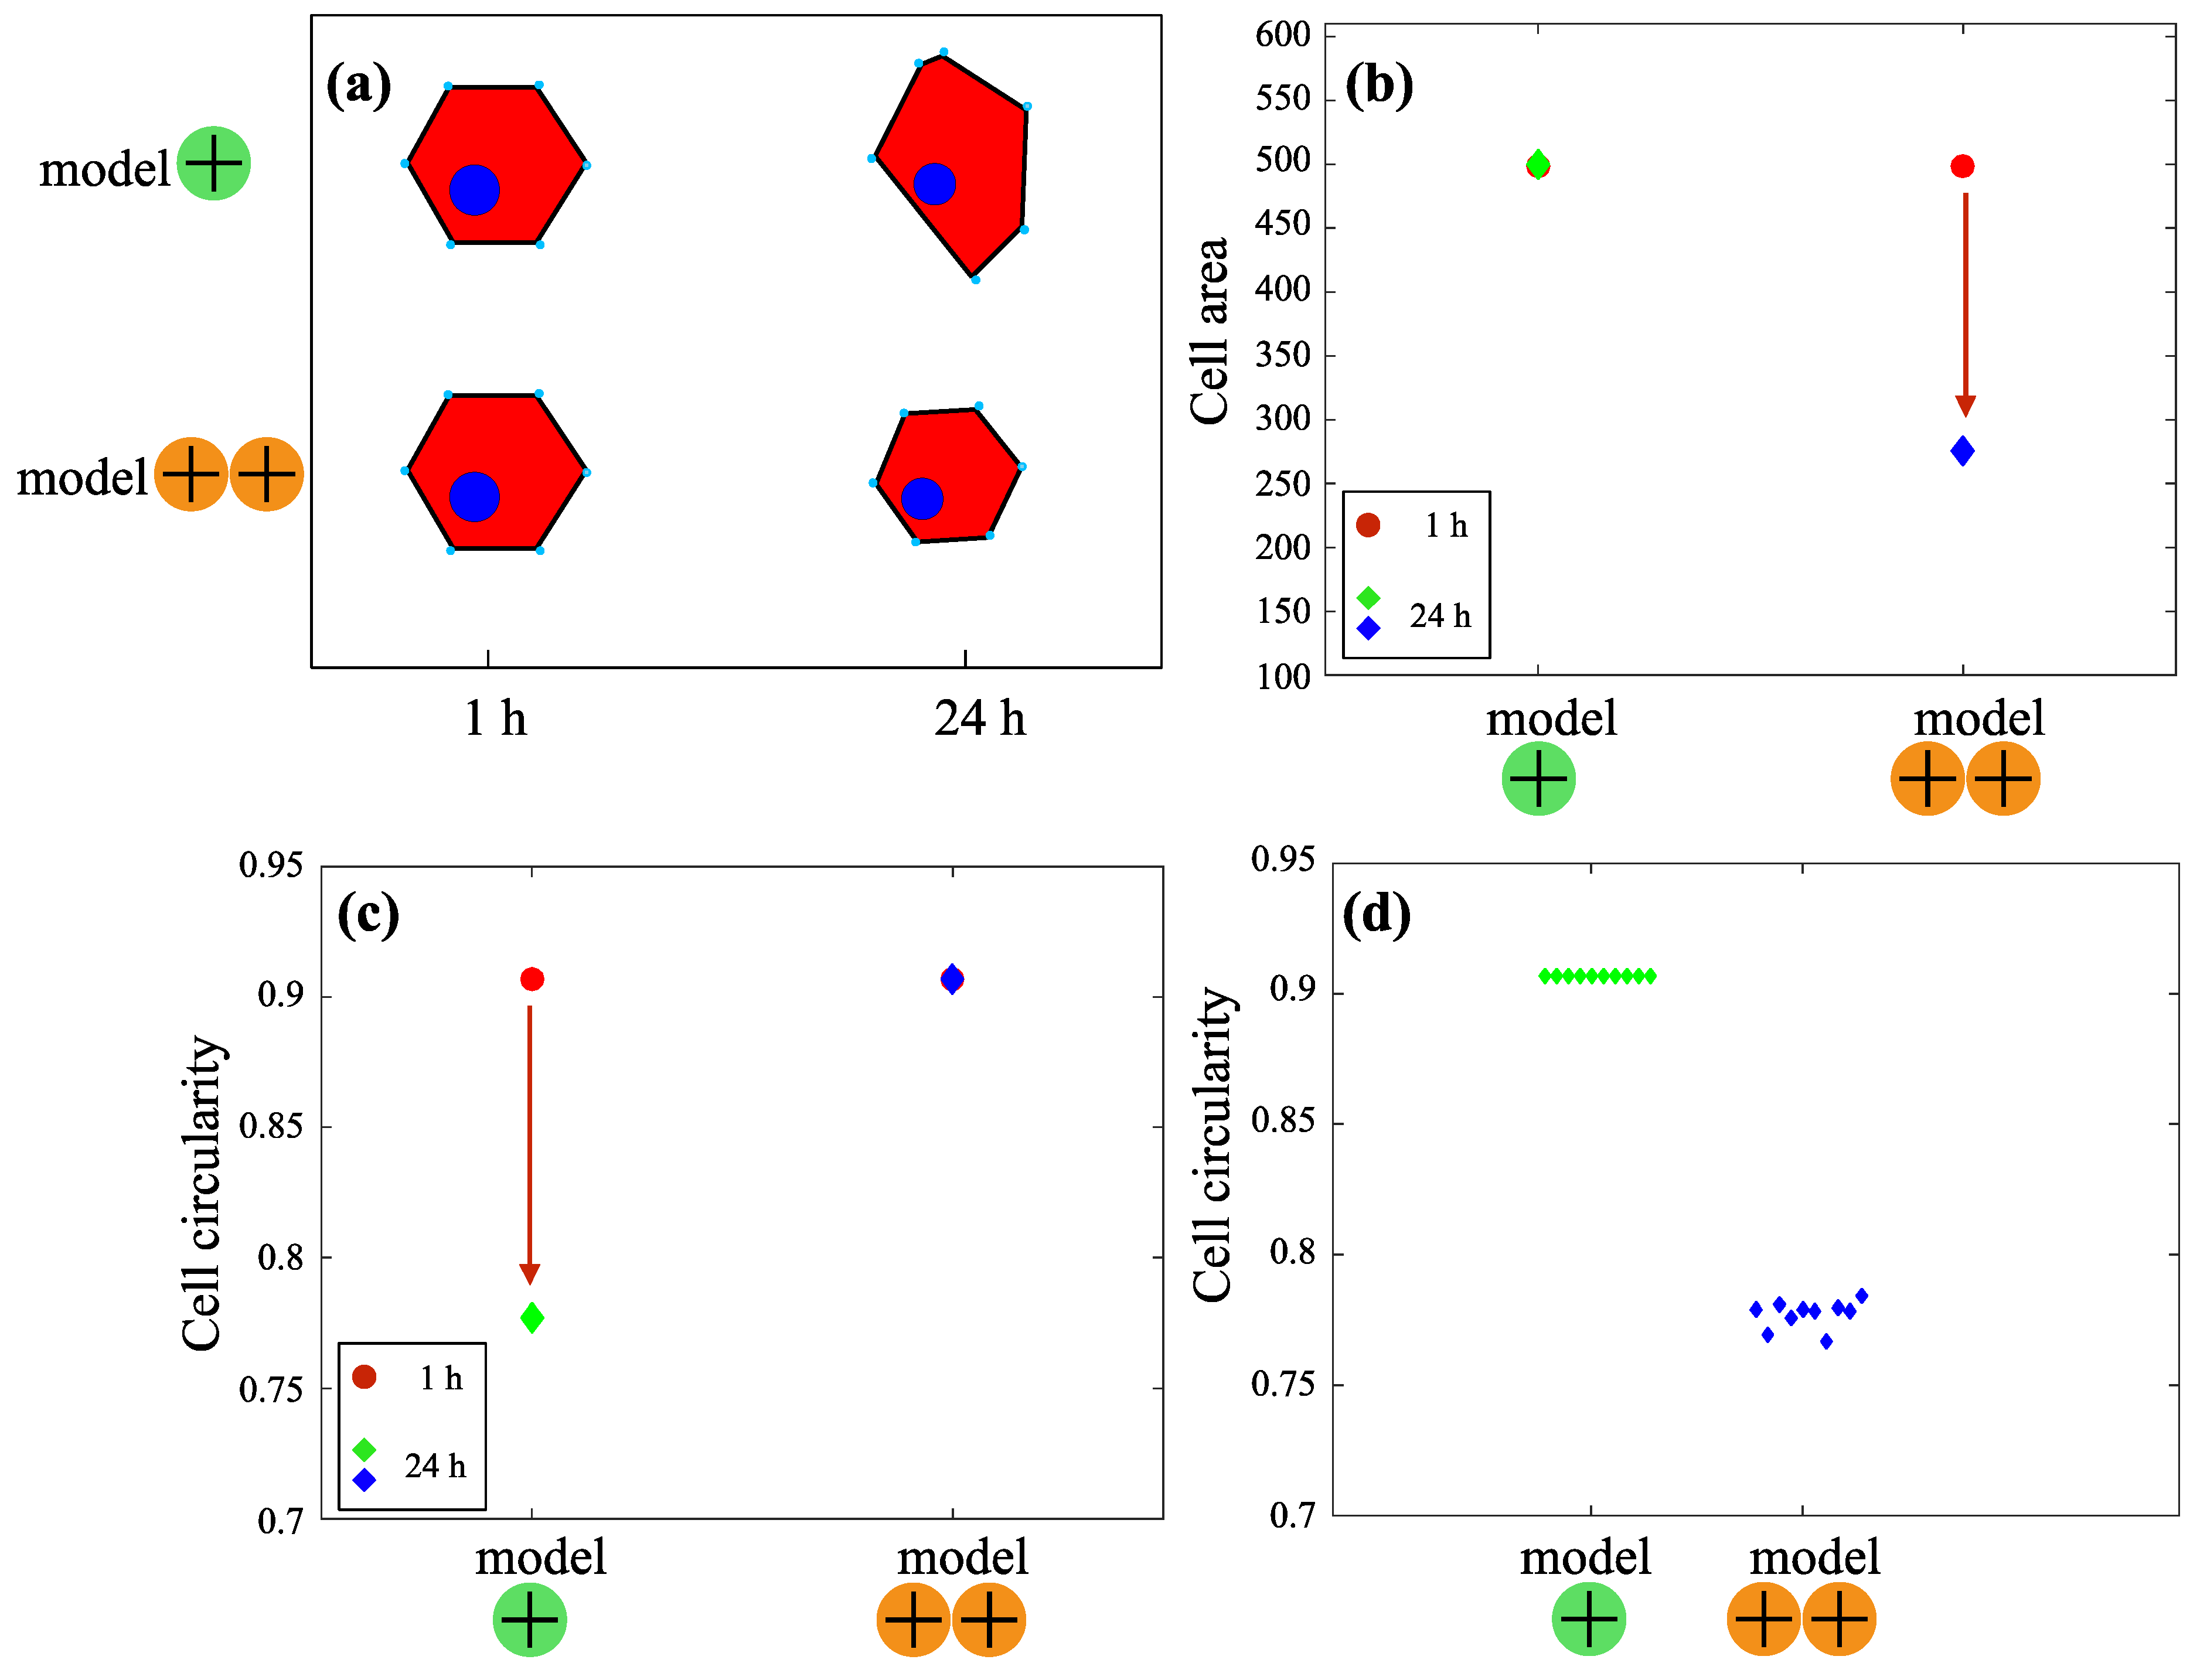
3.2. Mathematical Modeling of the Cell Shape

Experiments show that the changes in the cell shape, characterized by cell area and circularity measurements, are associated with changes in the length of cortical actin filaments. In order to understand how actin dynamics affects the shape of single cells placed on differently charged substrates, we developed a vertex-based model as described in Section 2.3. Here, we focus only on surfaces with PPAAm (moderately positive charges) and PDADMA (highly positive charges).
Experiments show that irrespective of the substrate charge, cells initially, i.e., 1 h after seeding on the substrate, have a higher circularity, i.e., closer to 1. Therefore, in our simulations, for the initial state of the cell, we used the values for parameters listed in Table 1 such that the cell shape has a circularity close to 1 (Figure 6a). We chose a high ratio of K A   L 2 / K P , where L , as described in Section 2.3, is the typical diameter of an osteoblastic cell, so that the cell cross-sectional area at the initial time point is fixed at the value A 0   . In our simulations, we did not consider the full time-dependent evolution of the cell shape, but only the final force-balanced state resulting from a change in the model parameter values. The cell morphology in the final state is defined by its area and circularity. Cell circularity is calculated using the relation given by Equation (1).

3.2.1. Model +: Cell Morphology on the Substrate with Moderately Positive Surface Charge

Studies on the rigidity transition observed in vertex models show that the cell shape change from a regular polygon, with circularity close to 1, to an irregular elongated polygon with no significant change in the cell area can be obtained by changing the parameter p 0 , as defined in Section 2.3 (Figure 6b,c). In our simulations, the experimentally observed shape changes are obtained when P 0 83.18 , since we chose A 0   = 500 . By increasing the value of P 0 = 90 , our simulations show that the circularity drops from an initial value of 0.9 to 0.7, whereby the area is conserved, i.e., A 500 in the final state (Figure 6b,c). This suggests that a moderately positively charged substrate promotes cell–substrate adhesion such that adhesive forces dominate the cell cortical tension.

3.2.2. Model ++: Cell Morphology on a Substrate with Highly Positive Surface Charge

Experimentally observed cell shape changes in this case can be reproduced by keeping the initial value of P 0 , i.e., 20 and increasing only the value K P   . By increasing the value of K P   t o   48 , 000 , our simulations show that the circularity remains at the initial value of 0.9, but the cell area reduces to A 300 in the final state, similar to experiments (Figure 6b,c). This suggests that in the case of highly positively charged substrates, cell cortical tension dominates cell–substrate adhesion and tends to shrink the cells but keep the overall initial circularity.
Multiple independent simulation runs of the model show that the variation in the value of cell circularity is quite insignificant when P 0 < 83.18 , which corresponds to the case of cells on a moderately positively charged substrate, i.e., PPAAm (Figure 6d). However, the circularity value shows a significant spread when P 0 83.18 , which corresponds to the case of cells on a highly positively charged substrate, i.e., PDADMA (Figure 6d). Similar behavior of a higher variation in the circularity values of individual cells on negatively and moderately positively charged substrates compared with cells on highly positively charged surfaces was observed in the experiments (Figure 1b).

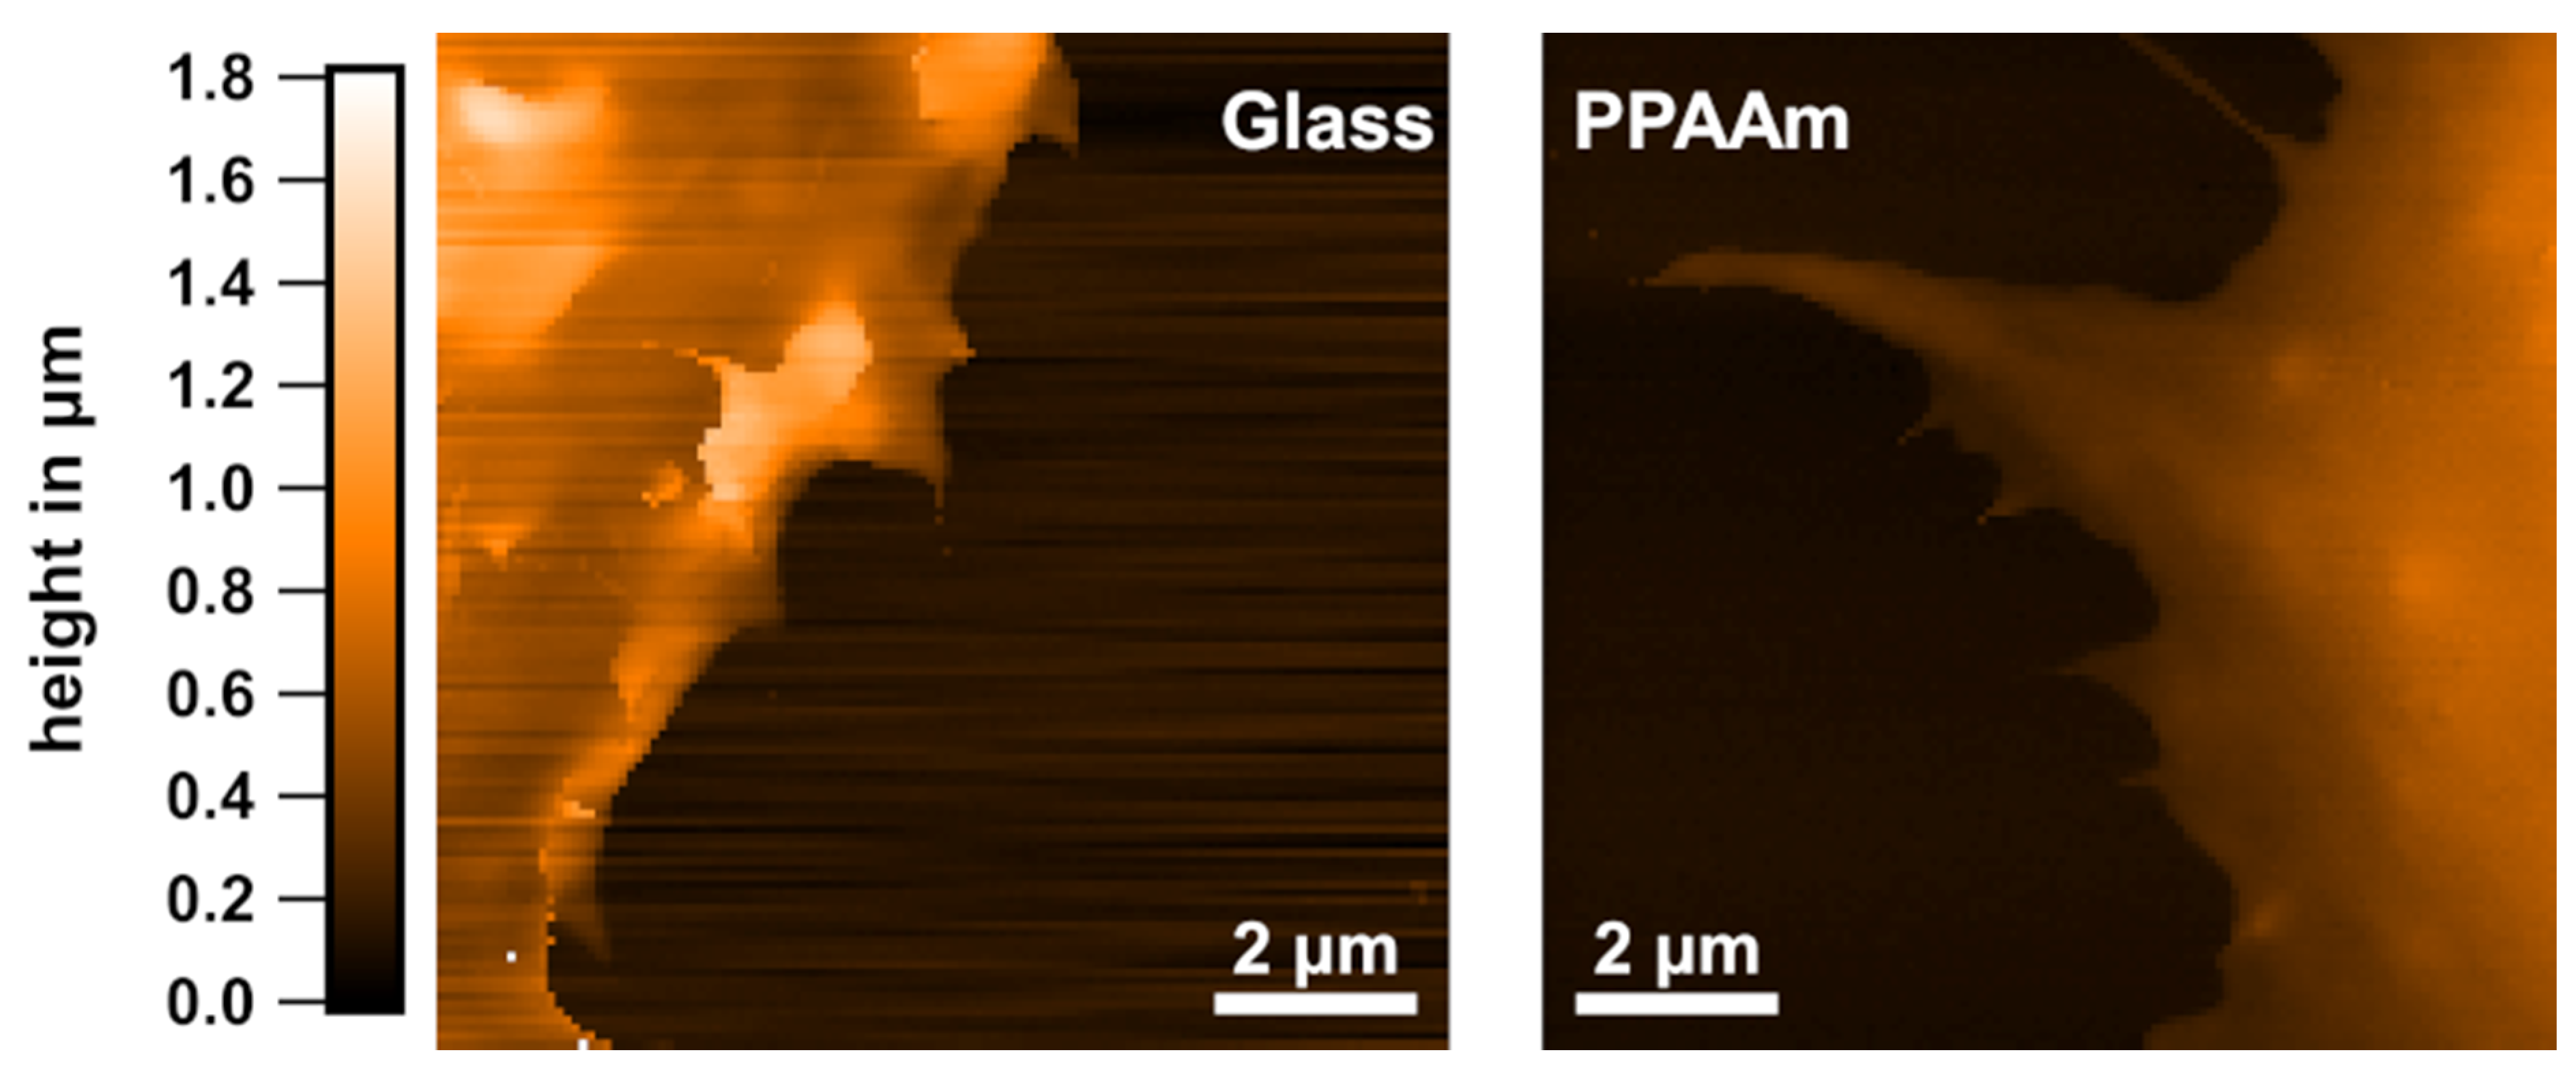
3.3. Edge Height of Cells on Moderately Positively Charged PPAAm

The edge height at the border of cells can be helpful to judge adhesion performance. At the edge of the cell, the height inheres in strongly curved or folded membrane regions and adjustment of the cleft distance between the basal membrane and the materials surface. An interesting parameter is the cell height, which represents the sum of the cleft and the curved region of the membrane, including the extracellular matrix (ECM). This height is directly accessible by SICM, a scanning probe microscopy method, largely avoiding forces on cells. As we pointed out earlier [47], the cell edge height is a strongly varying quantity (between 100 nm and 1 µm) when measuring around the whole perimeter of the cell. Therefore, we took average values for each cell. For cells after only 1 h culturing on the substrate, the average cell edge heights were 227 nm ± 18 nm on glass and 164 nm ± 7 nm on PPAAm, i.e., the cell edge is significantly ≈30% smaller on PPAAm, indicating a higher cell–substrate contact (Figure 7). Upon culturing for 3 h on the surfaces, this difference has already vanished (on glass 171 nm ± 11 nm, on PPAAm 150 nm ± 8 nm). However, if we consider regions of peripheral ruffles, we find again a significant difference between 246 nm ± 17 nm on glass and 174 nm ± 10 nm on PPAAm. Note: This type of ruffle is a loosened and folded-back membrane and it can originate from membrane excess, which was more pronounced on glass [47]. The ruffles need to be excluded for this analysis, because they would lead to overestimation of the edge height in the case of glass.

4. Discussion

Most clinical implant failures occur during the early healing phase [58]. Therefore, the development of new bioactive coatings for dental and orthopedic implants, for example, is fundamental to promote biological interfacial responses. In order to produce suitable coatings, it is important to know how the cells interact with the surface properties.
Our previous research revealed that osteoblasts are sensitive to the surface charge of a biomaterial and exhibit a specific physiological response, involving individual, phenotypical traits of viability, intracellular calcium ion signaling, and morphology depending on the materials’ charge level [33,34]. However, more detailed investigations on the formation of the cell shape in response to material surface charges are hardly found in the literature. Therefore, in this study, our focus was to elucidate the role of the surface charge on the osteoblastic actin cytoskeleton organization and cell shape. We summarized our previous findings concerning the cell area and circularity during the spreading course of 24 h and could show an overall relation of material surface charge and morphological cell changes. In particular, osteoblasts that were grown on highly positively charged surfaces displayed hampered cell spreading and a maintenance of the round cell shape, which is accompanied by functional alterations as shown by Gruening et al. [34].
Cellular spreading is a complex process involving various biological components such as the integrin adhesion receptors and the actin cytoskeleton, which are connected via adapter proteins in functional units called focal adhesions. In cultured cells, beside actin stress fibers throughout the cell, the actin cytoskeleton is presented in lamellipodia, the growth zone of the cell, and filopodia, which protrude from the lamellipodial actin network serving as anchor points for actin stress fibers spanning between two cell–matrix contacts [59,60,61,62]. Through its connection with the focal adhesion complexes of the cell, the actin cytoskeleton mediates the transduction of extracellular signals and mechanical forces into the cell [63,64]. The multitude of functions renders the actin filament network a highly significant and central key component in cell shape, anchorage, and motility [59,65]. In consequence, we assumed a rearrangement of the actin cytoskeleton to be the cause of the priorly observed individual phenotypic changes dependent on the ζ-potential [33,34].
As expected, we could find a well-spread cell morphology on negatively charged Ti surfaces, which is dominated by prominent actin stress fibers after 24 h. The more filigree appearance of the actin cytoskeleton with long filopodia on moderately positively charged PPAAm after 1 h can be explained by a higher level of cellular activity [34,66]. However, after 24 h, cells on PPAAm are also well expanded and display stress fibers. There was no difference in actin filament number between Ti and PPAAm at this time point, as was also indicated by Kunz et al. [67] and Matschegewski et al. [45]. In contrast, highly positive surface charges on PDADMA resulted in a drastically diminished filament number and length after 24 h. The remaining high cell circularity and decrease in cell area was accompanied by a clustered actin formation still confined to the outer cell edge. Similar to this cell behavior on highly positively charged surfaces, studies with respect to surface topography as an external stimulus demonstrated phenotypic changes of actin organization such as clustering of the actin filaments, which in turn resulted in functional changes in the cell [45,68]. Osteoblasts with a reorganization of the actin cytoskeleton on pillar [40] and groove structures [40,69] exhibited a decreased cell area after 24 h as well.
In addition, the cell edge height is lower on moderately positively charged PPAAm compared with negatively charged borosilicate glass after 1 h. Since we measured the sum of both cleft and cell height at the cell edge, we cannot directly compare with work addressing the cleft only. However, our results are compatible with reported cleft thicknesses of about 60 nm, as measured by metal-induced energy transfer [70] and about 40 nm by interferometric photo-activated localization microscopy [71].
Interestingly, after 3 h, there is no significant difference in cell edge height on PPAAm and glass. However, taking into account regions of peripheral ruffles, we observe a higher average cell edge height on glass. This indicates that either the region of peripheral ruffles is higher on glass i.e., specifically at the edges, the cell is not well attached to the substrate, or that if the edges fold back, they fold back further, leading to longer peripheral ruffles and therefore higher edge heights.
In the initial phase of adhesion, physicochemical interactions dominate over the slow cellular responses requiring biosynthesis. The difference in ζ-potentials of material surface (−60 mV for glass and +7 mV for PPAAm [34]) and cell surface (for MG-63 osteoblasts −16 mV [15]) amounts to ≈(−60 mV) − (−16 mV) = −44 mV for glass and to ≈(+7 mV) − (−16 mV) = +23 mV for PPAAm substrates. Thus, electric fields or Coulomb forces, if not fully screened by the double layer, would be stronger with respect to the glass substrate. The interaction of medium or ECM protein with the surface might be of relevance. Due to its amine content, protein tends to exhibit slightly positive ζ-potentials. Upon adsorption on a surface, the delicate protein folding will be least disturbed or best preserved on surfaces exhibiting low ζ-potentials in terms of absolute value [72] e.g., −1 mV or +1 mV (just immobilizing, hardly deforming). Hence, probably just the difference to the ζ-potential of the cell membrane is decisive. It is conceivable that cells prefer sites with adsorbed intact protein or with weak field gradients, leaving their ECM protein structure largely intact. Otherwise, MG-63 cells exhibit negative charges on their outer surface due to their hyaluronan coat; this is responsible for the cells’ attachment on positively charged material surfaces via electrostatic forces [42].
To further study the changes in the shape of single cells placed on charged substrates, we adopted a vertex-based model originally developed to investigate cell shape changes in confluent tissues. The model shows that different cell shapes, characterized by cell area and circularity, as observed in experiments, arise due to changes in cell mechanical properties, such as area elastic modulus governing cell area compressibility, bond tension due to actomyosin contractility, and mechanics of cell–substrate adhesion. Here, we used the knowledge of the well-known rigidity transition studied in vertex models for confluent tissues to understand cell shape changes due to intracellular actin cytoskeleton remodeling on differently charged surfaces. On negatively and moderately positively charged substrates, cell shape change is associated with a drop in the value of cell circularity but no significant change in the cell area. The choice of model parameter values for which the experimental observations could be reproduced suggest that negatively and moderately positively charged substrates promote cell–material adhesion after a longer time for growth (24 h). In the case of cells seeded on a highly positively charged substrate, the choice of model parameter values suggests that the forces due to cell cortical tension dominate the forces due to cell–substrate adhesion. As a result, cells decrease their cross-sectional area but retain their initial, higher circularity value. The model also shows that the circularity value of cells placed on a moderately positively charged substrate is more dispersed than in the case of cells placed on highly positively charged surface, as also observed in experiments. Taken together, our analysis indirectly suggests that the charge of the substrate exerts an influence on the cell mechanical properties, causing a transition in the mechanical behavior of the cells from a fluid-like to a more solid-like state.
The measured changes in cell shape and actin cytoskeleton could be explained by the following ideas: Gruening et al. [34] reported that in the presence of highly positive surface charges, the membrane integrity was compromised; i.e., the membranes displayed holes. This could be attributed to the incomplete formation of small membrane vesicles around the high charges, as described before for dendrimer structures by Mecke et al. [73]. It might be possible that the high charges increase the cortical membrane tension, as suggested by the model.
For micrometer-sized pillar structures, it is known that osteoblasts try to phagocytize them [74]. Since nanoparticles with highly positive surface charges are commonly used for drug delivery due to their strong interaction with the membrane’s proteoglycans, it could be speculated that the cells also try to take up the interfering high surface charges of biomaterials, resulting in clustered actin filaments. As for the reduced cell viability on highly positively charged material coatings [34], a great cytotoxicity has been also described for these nanoparticles [75].
A question still open involves exactly how negative and positive charges at the material interface affect the actin filament growth. Here, further in vitro experiments with Cytochalasin D causing the disruption of actin filaments and inhibition of actin polymerization could be helpful. In the study by Kunz et al. [67], the application of 1 µM Cytochalasin D to cells on Ti surfaces induced a decrease in cell area after 3 h compared with the untreated control. Controversially, the cells were able to overcome this decrease on PPAAm in most parts. The authors suggested a more membrane-driven cell spreading. However, the substrate-generated electric fields apparently play a role and regulate intracellular signaling pathways, subsequently influencing the actin dynamics. It could be potentially interesting to investigate the Rho signaling pathways, as changes in the balance of the Rho protein family activity are known to be sufficient to achieve rearrangements in the actin cytoskeleton and thus link the cell shape and function [59,76]. Lamellipodia are induced via Rac, filopodia are induced via Cdc42, and actin stress fibers are induced via Rho [59,77]. As Moerke et al. [78] indicated, the integrin downstream signaling of RhoA/ROCK plays a major role in the recognition of microtopographies and hence, the adaption of actin filaments to a surface by osteoblasts. The authors revealed an attenuated actin clustering on pillar structures by the inhibition of ROCK (Rho-associated kinase).
In this study, surface charges were shown to profoundly affect the organization of the actin cytoskeleton and the resulting cell shape. Highly positive surface charges caused a significant decline in cell area and actin filament number and length, which underlines the importance of an intact actin cytoskeleton for changes in cell shape during the spreading process. Using the mathematical model, it was shown that different organizational behaviors of the actin cytoskeleton give rise to different cell shapes, as observed in the experiments. However, in order to understand how the surface charges regulate actin cytoskeleton organization in the first place, a mathematical multi-scale model linking actin dynamics and the electric field generated from the surface charges with the overall cell shape is needed.

5. Conclusions

Osteoblasts are sensitive to the surface charge of a biomaterial and exhibit a specific physiological and morphological response depending on the charge level. In this study, we focused on the influence of negative, moderately and highly positive surface charges on the osteoblastic actin cytoskeleton organization and cell shape. We could show an overall relation of surface charges to morphological cell changes. While cells on moderately positively charged PPAAm surfaces exhibited a high number of long actin filaments and a minor cell edge height after 1 h, promoting cell–material adhesion, osteoblasts on highly positively charged PDADMA surfaces displayed a drastically diminished filament number and length after 24 h. Our mathematical simulation suggests that in these cells, forces due to cell cortical tension dominate the forces due to cell–substrate adhesion.

Supplementary Materials

The following are available online at https://www.mdpi.com/article/10.3390/app11125689/s1, Figure S1: Spreading course of MG-63s on modified Ti surfaces dependent on the ζ-potential, Table S1: Cell spreading data of 1 and 24 h dependent on the ζ-potential.

Author Contributions

Conceptualization, M.G. and J.B.N.; methodology, M.G., J.E.D., C.V., S.N. and K.F.; software, J.E.D.; validation, J.B.N., U.v.R., S.S. and C.A.H.; formal analysis, M.G., J.E.D. and C.V.; investigation, M.G., J.E.D. and C.V.; resources, J.B.N., U.v.R., S.S. and C.A.H.; data curation, M.G., J.E.D. and C.V.; writing—original draft preparation, M.G., J.E.D. and C.V.; writing—review and editing, J.B.N., U.v.R., S.S. and C.A.H.; visualization, M.G., J.E.D. and C.V.; supervision, J.B.N., U.v.R., S.S. and C.A.H.; project administration, J.B.N., U.v.R., S.S. and C.A.H.; funding acquisition, J.B.N., U.v.R., S.S. and C.A.H. All authors have read and agreed to the published version of the manuscript.

Funding

This research was funded by the Deutsche Forschungsgemeinschaft (DFG, German Research Foundation)–SFB 1270/1-299150580.

Institutional Review Board Statement

Not applicable.

Informed Consent Statement

Not applicable.

Data Availability Statement

Data is contained within the article or Supplementary Material.

Acknowledgments

We acknowledge the cooperation with the Center for Microtechnologies (TU Chemnitz, Norbert Zichner) concerning the production of the titanium-coated materials and thank Regina Lange and Ingo Barke (Institute of Physics, University of Rostock) for their help with the SICM experiment and discussion. We also thank Marcus Frank from the Electron Microscopy Center of the Rostock University Medical Center for the SEM support.

Conflicts of Interest

The authors declare no conflict of interest. The funders had no role in the design of the study; in the collection, analyses, or interpretation of data; in the writing of the manuscript, or in the decision to publish the results.

References

  1. Kokubo, T.; Yamaguchi, S. Growth of Novel Ceramic Layers on Metals via Chemical and Heat Treatments for Inducing Various Biological Functions. Front. Bioeng. Biotechnol. 2015, 3, 176. [Google Scholar] [CrossRef] [PubMed]
  2. Muderrisoglu, C.; Saveleva, M.; Abalymov, A.; Van der Meeren, L.; Ivanova, A.; Atkin, V.; Parakhonskiy, B.; Skirtach, A.G. Nanostructured Biointerfaces Based on Bioceramic Calcium Carbonate/Hydrogel Coatings on Titanium with an Active Enzyme for Stimulating Osteoblasts Growth. Adv. Mater. Interfaces 2018, 5, 1800452. [Google Scholar] [CrossRef]
  3. Devgan, S.; Sidhu, S.S. Evolution of surface modification trends in bone related biomaterials: A review. Mater. Chem. Phys. 2019, 233, 68–78. [Google Scholar] [CrossRef]
  4. Wennerberg, A.; Albrektsson, T. Effects of titanium surface topography on bone integration: A systematic review. Clin. Oral. Implants Res. 2009, 20, 172–184. [Google Scholar] [CrossRef] [PubMed]
  5. Nikkhah, M.; Edalat, F.; Manoucheri, S.; Khademhosseini, A. Engineering microscale topographies to control the cell–substrate interface. Biomaterials 2012, 33, 5230–5246. [Google Scholar] [CrossRef] [PubMed] [Green Version]
  6. Kumar, P.S.; KS, S.K.; Grandhi, V.V.; Gupta, V. The Effects of Titanium Implant Surface Topography on Osseointegration: Literature Review. JMIR Biomed. Eng. 2019, 4, e13237. [Google Scholar] [CrossRef]
  7. Felgueiras, H.P.; Antunes, J.C.; Martins, M.C.L.; Barbosa, M.A. Fundamentals of protein and cell interactions in biomaterials. Pept. Proteins Biomater. Tissue Regen. Repair 2018, 1–27. [Google Scholar] [CrossRef]
  8. Ferrari, M.; Cirisano, F.; Morán, M.C. Mammalian Cell Behavior on Hydrophobic Substrates: Influence of Surface Properties. Colloids Interfaces 2019, 3, 48. [Google Scholar] [CrossRef] [Green Version]
  9. Chen, S.; Guo, Y.; Liu, R.; Wu, S.; Fang, J.; Huang, B.; Li, Z.; Chen, Z.; Chen, Z. Tuning surface properties of bone biomaterials to manipulate osteoblastic cell adhesion and the signaling pathways for the enhancement of early osseointegration. Colloid Surface B 2018, 164, 58–69. [Google Scholar] [CrossRef]
  10. Ekblom, P.; Timpl, R. Cell-to-cell contact and extracellular matrix. A multifaceted approach emerging. Curr. Opin. Cell Biol. 1996, 8, 599–601. [Google Scholar] [CrossRef]
  11. Gao, C.; Peng, S.; Feng, P.; Shuai, C. Bone biomaterials and interactions with stem cells. Bone Res. 2017, 5, 17059. [Google Scholar] [CrossRef]
  12. Agarwal, R.; García, A.J. Biomaterial strategies for engineering implants for enhanced osseointegration and bone repair. Adv. Drug Deliv. Rev. 2015, 94, 53–62. [Google Scholar] [CrossRef] [Green Version]
  13. Tzoneva, R.; Groth, T.; Altankov, G. Remodeling of fibrinogen by endothelial cells in dependence on fibronectin matrix assembly. Effect of substratum wettability. J. Mater. Sci. Mater. Med. 2002, 13, 1235–1244. [Google Scholar] [CrossRef] [PubMed]
  14. Cohen, M.; Joester, D.; Geiger, B.; Addadi, L. Spatial and Temporal Sequence of Events in Cell Adhesion: From Molecular Recognition to Focal Adhesion Assembly. ChemBioChem 2004, 5, 1393–1399. [Google Scholar] [CrossRef]
  15. Rebl, H.; Finke, B.; Schmidt, J.; Mohamad, H.S.; Ihrke, R.; Helm, C.A.; Nebe, J.B. Accelerated cell-surface interlocking on plasma polymer-modified porous ceramics. Mater. Sci. Engin. C 2016, 69, 1116–1124. [Google Scholar] [CrossRef] [PubMed]
  16. Lee, G.M.; Johnstone, B.; Jacobson, K.; Caterson, B. The dynamic structure of the pericellular matrix on living cells. J. Cell Biol. 1993, 123, 1899–1907. [Google Scholar] [CrossRef] [PubMed]
  17. Ercan, B.; Webster, T.J. Greater osteoblast proliferation on anodized nanotubular titanium upon electrical stimulation. Int. J. Nanomed. 2008, 3, 477–485. [Google Scholar] [CrossRef] [Green Version]
  18. Hunckler, J.; de Mel, A. A current affair: Electrotherapy in wound healing. J. Multidiscip. Healthc. 2017, 10, 179–194. [Google Scholar] [CrossRef] [Green Version]
  19. Glaser, R. Biophysics: An Introduction, 2nd ed.; Springer: Berlin, Germany, 2012; ISBN 978-366249596-4. [Google Scholar]
  20. Holler, F.J.; Skoog, D.A.; Crouch, S.R. Principles of Instrumental Analysis, 6th ed.; Thomson Brooks/Cole; Belmont, C.A., Ed.; Cengage Learning: Boston, MA, USA, 2007; p. 9. ISBN 978-0-495-01201-6. [Google Scholar]
  21. Pawlikowski, M. Electric Phenomenon in Bones as a Result of Piezoelectricity of Hydroxyapatite. Arch. Clin. Biomed. Res. 2017, 1, 132–139. [Google Scholar] [CrossRef]
  22. Anderson, J.C.; Eriksson, C. Electrical properties of wet collagen. Nature 1968, 21, 166–168. [Google Scholar] [CrossRef]
  23. Minary-Jolandan, M.; Yu, M.F. Nanoscale characterization of isolated individual type I collagen fibrils: Polarization and piezoelectricity. Nanotechnology 2009, 20, 085706. [Google Scholar] [CrossRef]
  24. Zheng, T.; Huang, Y.; Zhang, X.; Cai, Q.; Deng, X.; Yang, X. Mimicking the electrophysiological microenvironment of bone tissue using electroactive materials to promote its regeneration. J. Mater. Chem. B 2020, 8, 10221. [Google Scholar] [CrossRef] [PubMed]
  25. Liu, J.; Hou, Z.; Qin, Q.-H.; Fu, D.; Pan, S. Variation of Streaming Potentials with Time under Steady Fluid Pressure. Bone Appl. Sci. 2019, 9, 3726. [Google Scholar] [CrossRef] [Green Version]
  26. Balmer, T.W.; Vesztergom, S.; Broekmann, P.; Stahel, A.; Büchler, P. Characterization of the electrical conductivity of bone and its correlation to osseous structure. Sci. Rep. 2018, 8, 8601. [Google Scholar] [CrossRef]
  27. Hammond, C. Ionic gradients, membrane potential and ionic currents. In Cellular and Molecular Neurophysiology, 4th ed.; Elsevier Ltd.: Amsterdam, The Netherlands, 2015; pp. 39–54. [Google Scholar] [CrossRef]
  28. Meyer-Plath, A.A.; Schroeder, K.; Finke, B.; Ohl, A. Current trends in biomaterial surface functionalization—Nitrogen-containing plasma assisted processes with enhanced selectivity. Vacuum 2003, 71, 391–406. [Google Scholar] [CrossRef]
  29. Nebe, B.; Finke, B.; Luethen, F.; Bergemann, C.; Schroeder, K.; Rychly, J.; Liefeith, K.; Ohl, A. Improved initial osteoblast functions on amino-functionalized titanium surfaces. Biomol. Eng. 2007, 24, 447–454. [Google Scholar] [CrossRef]
  30. von der Mark, K.; Park, J. Engineering biocompatible implant surfaces: Part II: Cellular recognition of biomaterial surfaces: Lessons from cell-matrix interactions. Prog. Mater. Sci. 2013, 58, 327–381. [Google Scholar] [CrossRef]
  31. Khalili, A.; Ahmad, M. A Review of Cell Adhesion Studies for Biomedical and Biological Applications. Int. J. Mol. Sci. 2015, 16, 18149–18184. [Google Scholar] [CrossRef] [Green Version]
  32. Yang, S.; Kim, H.-M. The RhoA-ROCK-PTEN pathway as a molecular switch for anchorage dependent cell behavior. Biomaterials 2012, 33, 2902–2915. [Google Scholar] [CrossRef] [PubMed]
  33. Gruening, M.; Neuber, S.; Fricke, K.; Helm, C.A.; Nebe, B. Cell-Material Interaction - Spreading Course Correlates with Surface Charge. Am. J. Biomed. Sci. Res. 2020, 9, 4–6. [Google Scholar] [CrossRef]
  34. Gruening, M.; Neuber, S.; Nestler, P.; Lehnfeld, J.; Dubs, M.; Fricke, K.; Schnabelrauch, M.; Helm, C.A.; Müller, R.; Staehlke, S.; et al. Enhancement of Intracellular Calcium Ion Mobilization by Moderately but Not Highly Positive Material Surface Charges. Front. Bioeng. Biotechnol. 2020, 8, 1016. [Google Scholar] [CrossRef]
  35. Ingber, D.E. Tensegrity II. How structural networks influence cellular information processing networks. J. Cell Sci. 2003, 116, 1397–1408. [Google Scholar] [CrossRef] [PubMed] [Green Version]
  36. Brakebusch, C.; Fässler, R. The integrin-actin connection, an eternal love affair. EMBO J. 2003, 22, 2324–2333. [Google Scholar] [CrossRef]
  37. Stricker, J.; Falzone, T.; Gardel, M.L. Mechanics of the F-actin cytoskeleton. J. Biomech. 2010, 43, 9–14. [Google Scholar] [CrossRef] [PubMed] [Green Version]
  38. Mooney, D.J.; Langer, R.; Ingber, D.E. Cytoskeletal filament assembly and the control of cell spreading and function by extracellular matrix. J. Cell Sci. 1995, 108, 2311–2320. [Google Scholar] [CrossRef]
  39. Kharitonova, M.A.; Vasiliev, J.M.; Rovensky, Y.A.; Vasiliev, J.M. Length control is determined by the pattern of cytoskeleton. J. Cell Sci. 2004, 117, 1955–1960. [Google Scholar] [CrossRef] [PubMed] [Green Version]
  40. Matschegewski, C.; Staehlke, S.; Birkholz, H.; Lange, R.; Beck, U.; Engel, K.; Nebe, J.B. Automatic actin filament quantification of osteoblasts and their morphometric analysis on microtextured silicon-titanium arrays. Materials 2012, 5, 1176–1195. [Google Scholar] [CrossRef] [Green Version]
  41. Lüthen, F.; Lange, R.; Becker, P.; Rychly, J.; Beck, U.; Nebe, J.B. The influence of surface roughness of titanium on β1- and β3-integrin adhesion and organization of fibronectin in human osteoblastic cells. Biomaterials 2005, 26, 2423–2440. [Google Scholar] [CrossRef] [PubMed]
  42. Finke, B.; Luethen, F.; Schroeder, K.; Mueller, P.D.; Bergemann, C.; Frant, M.; Ohl, A.; Nebe, B.J. The effect of positively charged plasma polymerization on initial osteoblastic focal adhesion on titanium surfaces. Biomaterials 2007, 28, 4521–4534. [Google Scholar] [CrossRef] [PubMed]
  43. Mohamad, H.S.; Neuber, S.; Helm, C.A. Surface Forces of Asymmetrically Grown Polyelectrolyte Multilayers: Searching for the Charges. Langmuir 2019, 35, 15491–15499. [Google Scholar] [CrossRef] [PubMed]
  44. Staehlke, S.; Rebl, H.; Nebe, B. Phenotypic stability of the human MG-63 osteoblastic cell line at different passages. Cell Biol. Int. 2019, 43, 22–32. [Google Scholar] [CrossRef] [Green Version]
  45. Matschegewski, C.; Staehlke, S.; Loeffler, R.; Lange, R.; Chai, F.; Kern, D.P.; Beck, U.; Nebe, B.J. Cell architecture–cell function dependencies on titanium arrays with regular geometry. Biomaterials 2010, 31, 5729–5740. [Google Scholar] [CrossRef] [PubMed]
  46. Birkholz, H. Extracting the Ridge Set as a Graph for Quantification of Actin Filament Images Obtained by Confocal Laser Scanning Microscopy; Pinoli, J.-C., Debayle, J., Gavet, Y., Gruy, F., Lambert, C., Eds.; International Society for Optics and Photonics: Bellingham, WA, USA, 2011; p. 800006. [Google Scholar] [CrossRef]
  47. Voelkner, C.; Wendt, M.; Lange, R.; Ulbrich, M.; Gruening, M.; Staehlke, S.; Nebe, B.; Barke, I.; Speller, S. The nanomorphology of cell surfaces of adhered osteoblasts. Beilstein J. Nanotechnol. 2021, 12, 242–256. [Google Scholar] [CrossRef] [PubMed]
  48. Alt, S.; Ganguly, P.; Salbreux, G. Vertex models: From cell mechanics to tissue morphogenesis. Philos. Trans. R. Soc. B Biol. Sci. 2017, 372, 20150520. [Google Scholar] [CrossRef] [PubMed]
  49. Dasgupta, A.; Merkel, M.; Clark, M.J.; Jacob, A.E.; Dawson, J.E.; Manning, M.L.; Amack, J.D. Cell volume changes contribute to epithelial morphogenesis in zebrafish Kupffer’s vesicle. eLife 2018, 7, e30963. [Google Scholar] [CrossRef] [PubMed]
  50. Koride, S.; Loza, A.J.; Sun, S.X. Epithelial vertex models with active biochemical regulation of contractility can explain organized collective cell motility. APL Bioeng. 2018, 2, 031906. [Google Scholar] [CrossRef]
  51. Farhadifar, R.; Röper, J.-C.; Aigouy, B.; Eaton, S.; Jülicher, F. The influence of cell mechanics, cell-cell interactions, and proliferation on epithelial packing. Curr. Biol. 2007, 17, 2095–2104. [Google Scholar] [CrossRef] [Green Version]
  52. Kneuper, I.; Teale, W.; Dawson, J.E.; Tsugeki, R.; Katifori, E.; Palme, K.; Ditengou, F.A. Auxin biosynthesis and cellular efflux act together to regulate leaf vein patterning. J. Exp. Bot. 2021, 72, 1151–1165. [Google Scholar] [CrossRef]
  53. Bi, D.; Lopez, J.H.; Schwarz, J.M.; Manning, M.L. A density-independent rigidity transition in biological tissues. Nat. Phys. 2015, 11, 1074–1079. [Google Scholar] [CrossRef] [Green Version]
  54. Merkel, M.; Manning, M.L. A geometrically controlled rigidity transition in a model for confluent 3D tissues. New J. Phys. 2018, 20, 022002. [Google Scholar] [CrossRef]
  55. Staple, D.B.; Farhadifar, R.; Röper, J.-C.; Aigouy, B.; Eaton, S.; Jülicher, F. Mechanics and remodelling of cell packings in epithelia. Eur. Phys. J. E 2010, 33, 117–127. [Google Scholar] [CrossRef] [PubMed]
  56. Raucher, D.; Sheetz, M.P. Cell spreading and lamellipodial extension rate is regulated by membrane tension. J. Cell Biol. 2000, 148, 127–136. [Google Scholar] [CrossRef]
  57. Mattila, P.K.; Lappalainen, P. Filopodia: Molecular architecture and cellular functions. Nat. Rev. Mol. Cell Biol. 2008, 9, 446–454. [Google Scholar] [CrossRef]
  58. Neoh, K.G.; Hu, X.; Zheng, D.; Kang, E.T. Balancing osteoblast functions and bacterial adhesion on functionalized titanium surfaces. Biomaterials 2012, 33, 2813–2822. [Google Scholar] [CrossRef] [PubMed]
  59. Small, J.V.; Rottner, K.; Kaverina, I. Functional design in the actin cytoskeleton. Curr. Opin. Cell Biol. 1999, 11, 54–60. [Google Scholar] [CrossRef]
  60. Small, J.V.; Stradal, T.; Vignal, E.; Rottner, K. The lamellipodium: Where motility begins. Trends Cell Biol. 2002, 12, 112–120. [Google Scholar] [CrossRef]
  61. Faix, J.; Breitsprecher, D.; Stradal, T.E.B.; Rottner, K. Filopodia: Complex models for simple rods. Int. J. Biochem. Cell Biol. 2009, 41, 1656–1664. [Google Scholar] [CrossRef]
  62. Partridge, M.A.; Marcantonio, E.E. Initiation of attachment and generation of mature focal adhesions by integrin-containing filopodia in cell spreading. Mol. Biol. Cell 2006, 17, 4237–4248. [Google Scholar] [CrossRef]
  63. Yamada, K.M.; Miyamoto, S. Integrin transmembrane signaling and cytoskeletal control. Curr. Opin. Cell Biol. 1995, 7, 681–689. [Google Scholar] [CrossRef]
  64. Clark, E.A.; Brugge, J.S. Integrins and signal transduction pathways: The road taken. Science 1995, 268, 233–239. [Google Scholar] [CrossRef] [PubMed]
  65. Pollard, T.D.; Cooper, J.A. Actin, a central player in cell shape and movement. Science 2009, 326, 1208–1212. [Google Scholar] [CrossRef] [PubMed] [Green Version]
  66. Nebe, J.B.; Rebl, H.; Schlosser, M.; Staehlke, S.; Gruening, M.; Weltmann, K.-D.; Walschus, U.; Finke, B. Plasma Polymerized Allylamine—The Unique Cell-Attractive Nanolayer for Dental Implant Materials. Polymers 2019, 11, 1004. [Google Scholar] [CrossRef] [Green Version]
  67. Kunz, F.; Rebl, H.; Quade, A.; Matschegewski, C.; Finke, B.; Nebe, J. Osteoblasts with impaired spreading capacity benefit from the positive charges of plasma polymerised allylamine. Eur. Cells Mater. 2015, 29, 177–189. [Google Scholar] [CrossRef] [PubMed]
  68. Eisenbarth, E.; Linez, P.; Biehl, V.; Velten, D.; Breme, J.; Hildebrand, H. Cell orientation and cytoskeleton organisation on ground titanium surfaces. Biomol. Eng. 2002, 19, 233–237. [Google Scholar] [CrossRef]
  69. Mörke, C.; Rebl, H.; Finke, B.; Dubs, M.; Nestler, P.; Airoudj, A.; Roucoules, V.; Schnabelrauch, M.; Körtge, A.; Anselme, K.; et al. Abrogated Cell Contact Guidance on Amino-Functionalized Microgrooves. ACS Appl. Mater. Interfaces 2017, 9, 10461–10471. [Google Scholar] [CrossRef]
  70. Gregor, I.; Chizhik, A.; Karedla, N.; Enderlein, J. Metal-induced energy transfer. Nanophotonics 2019, 8, 1689–1699. [Google Scholar] [CrossRef]
  71. Kanchanawong, P.; Shtengel, G.; Pasapera, A.M.; Ramko, E.B.; Davidson, M.W.; Hess, H.F.; Waterman, C.M. Nanoscale architecture of integrin-based cell adhesions. Nature 2010, 468, 580–584. [Google Scholar] [CrossRef] [Green Version]
  72. Bekard, I.; Dunstan, D.E. Electric field induced changes in protein conformation. Soft Matter 2014, 10, 431–437. [Google Scholar] [CrossRef]
  73. Mecke, A.; Majoros, I.J.; Patri, A.K.; Baker, J.R.; Banaszak Holl, M.M.; Orr, B.G. Lipid Bilayer Disruption by Polycationic Polymers: The Roles of Size and Chemical Functional Group. Langmuir 2005, 21, 10348–10354. [Google Scholar] [CrossRef] [PubMed]
  74. Moerke, C.; Mueller, P.; Nebe, B. Attempted caveolae-mediated phagocytosis of surface-fixed micro-pillars by human osteoblasts. Biomaterials 2016, 76, 102–114. [Google Scholar] [CrossRef] [Green Version]
  75. Fröhlich, E. The role of surface charge in cellular uptake and cytotoxicity of medical nanoparticles. Int. J. Nanomed. 2012, 7, 5577. [Google Scholar] [CrossRef] [Green Version]
  76. Boudreau, N.J.; Jones, P.L. Extracellular matrix and integrin signalling: The shape of things to come. Biochem. J. 1999, 339, 481–488. [Google Scholar] [CrossRef] [PubMed]
  77. Hall, A. Rho GTPases and the actin cytoskeleton. Science 1998, 279, 509–514. [Google Scholar] [CrossRef] [PubMed] [Green Version]
  78. Moerke, C.; Mueller, P.; Nebe, J.B. Sensing of micropillars by osteoblasts involves complex intracellular signaling. J. Mater. Sci. Mater. Med. 2017, 28, 171. [Google Scholar] [CrossRef] [PubMed] [Green Version]
Figure 1. Summary of our current knowledge of ζ-potential-dependent change in cell area and shape over time on functionalized Ti surfaces. Our previous research showed that surface charges at the interface deduced from the ζ-potential possess a remarkable influence on cellular spreading [33] and morphology [34]. Overall, 12 different top layers of the categories of amino polymers, extracellular matrix proteins/peptide motifs, polyelectrolyte multilayers, and metals were deposited on Ti substrates and analyzed corresponding to surface charge and spreading behavior. (a) Cell area: According to the cell spreading, these surfaces were categorized into three groups of ζ-potential, and the respective cell area values were averaged: negative (blue), moderately positive (green), and highly positive (orange). Note that cells favor only a certain range of moderately positive surface charges and cannot tolerate high charges of around +50 mV. Osteoblasts on the four moderately positive surfaces RGD, APTES, PPAAm, and PEI (+1 to +10 mV, green box) exhibit the highest cell area after 1 h (1791 ± 275 μm2). This cell area changes only slightly within 24 h (1669 ± 66 μm2). Cells on the five negatively charged surfaces Au, PSS, Ti, Matrigel, and Col I (−120 to −3 mV, blue box) initially have a smaller cell area after 1 h (838 ± 114 μm2) but spread within 24 h to reach the same level of cell area as on moderately positive surfaces (1513 ± 108 μm2 after 24 h, arrow). Cells on the three highly positively charged surfaces PPI-G2, PPI-G4, and PDADMA (+50 to +55 mV, orange box) show initially significantly increased spreading (1321 ± 89 μm2), but the cell area decreases dramatically within 24 h (510 ± 65 μm2 after 24 h, arrow). Plot: Microscopic images of PKH26 stained cells after 1 h on Ti, PPAAm, and PDADMA as representatives for each category. Cell area after 1 and 24 h in mean ± sem, ζ-potentials in mean ± SD, Mann–Whitney-U test, p < 0.05; significances after 1 h: − vs. + and − vs. ++; significances after 24 h: − vs. ++ and + vs. ++. (b) Circularity: A perfect circle is defined by a value of 1.0, and an increasingly elongated polygon is represented by a value converging toward 0. While the cell shape on negatively and moderately positively charged surfaces changes from circular to a more elongated shape within 24 h, cells on highly positively charged surfaces exhibit an impaired cell spreading and retain their circular morphology. Plot: ζ-potentials in mean; circularity after 1 and 24 h in medians (see detailed values in Table S1). Abbreviations: Au (gold), PSS (polystyrene sulfonate), Ti (titanium), Matrigel (basement membrane matrix), Col I (collagen type I), RGD (arginine–glycine–aspartate sequence), APTES (3-aminopropyltriethoxysilane), PPAAm (plasma polymerized allylamine), PEI (polyethyleneimine), PPI-G4 (polypropyleneimine dendrimer generation 4), PDADMA (polydiallyldimethylammonium chloride), and PPI-G2 (polypropyleneimine dendrimer generation 2).
Applsci 11 05689 g001
Figure 2. (a) In the vertex model, an osteoblastic cell is represented as a polygon with six sides and is specified by the surrounding vertices, where the length of the side between two neighboring vertices i and j is l i j . The cell shape is determined by quasi-static simulations in which a force-balanced state is achieved using an algorithm that performs a Monte Carlo-based minimization of Equation (3). In the final force-balanced state, the shape of the cell is defined by its area A 0   and perimeter P 0 . (b) Earlier studies of the vertex model have shown that when the shape index factor p 0 = P 0   / A 0     is below a critical value p 0 * , the stable configuration is the ground state and has the shape of a regular polygon, i.e., with higher circularity value. However, when the value of p 0 is higher than p 0 * , the ground state is degenerated and the polygon has an irregular shape, which is characterized by a lower circularity value.
Applsci 11 05689 g002
Figure 3. High-resolution SEM images showing the MG-63 cell morphology after 1 h on plasma polymer (PPAAm)-coated Ti. Note the multiple elongated filopodia protrusions (arrow) in the cells’ growth zone in order to probe the environment and facilitating cell adhesion (magnification from left to right 2000 and 5000×, scale bars 2 μm; FE-SEM Merlin VP compact, Carl Zeiss).
Applsci 11 05689 g003
Figure 4. Actin cytoskeleton in MG-63s after 1 h (left) and 24 h (right) on Ti (negative surface charge), PPAAm (moderately positive surface charge), and PDADMA (highly positive surface charge). Shown are confocal microscopic images as a precondition for the actin quantification (bars = 10 μm; LSM780, Carl Zeiss) and the resulting FilaQuant filament curve graphs of the actin filaments and stress fibers. Note the multiple elongated actin filament protrusions in cells’ filopodia after 1 h on PPAAm in contrast to shorter actin filament extensions on PDADMA. After 24 h, cells on Ti and PPAAm are equally well spread with long actin filaments throughout the cell. Cells on PDADMA have shrunk and remain round shaped. The actin filaments are short and clustered toward the leading edge.
Applsci 11 05689 g004
Figure 5. FilaQuant-based quantification of actin filaments in MG-63s after 1 and 24 h on negatively charged Ti (blue), moderately positively charged PPAAm (green), and highly positively charged PDADMA (orange). (a) Number of actin filaments. (b) Total filament length. (c) Mean filament length. (d) Maximum filament length. Note the significantly higher number of filaments on moderately positively charged PPAAm after 1 h and the resulting increased total filament length. Whereas the highly positively charged surface PDADMA leads to a drastically diminished filament number and length after 24 h, there are no significant differences in filament length and number between Ti and PPAAm. (Statistics are shown in Table 2, n = 10 cells per surface).
Applsci 11 05689 g005
Figure 6. Model to study the influence of actin dynamics on the shape of cells placed on charged surfaces. (a) Cells were initialized as hexagons with an area (in non-dimensional units) of 500 and a circularity of 0.9. The blue-colored circle inside the polygon represents a cell nucleus which is not part of the model and is only shown here for representative purposes. This state corresponds to the cells on a PPAAm (model +) and PDADMA (model ++) substrate after 1 h. The shape of the cells results from the energy minimization of Equation (3) for a given set of values of parameters listed in Table 1, using a Monte Carlo-based algorithm. (b) Cell area (in non-dimensional units) after 1 h (red circles) and 24 h (green diamond for model + and blue diamond for model ++). Each data point for cell area is the mean of cell areas obtained from ten individual simulation runs. (c) Cell circularity after 1 h (red circles) and 24 h (green diamond for model + and blue diamond for model ++). Each data point for cell circularity is the mean of cell circularities obtained from 10 individual simulation runs. In model +, the cell state at 24 h was obtained by changing only P 0   83.18 . All the other parameter values were kept the same as for the cell state at 1 h. This state is characterized by (b) an insignificant change in the cell area (value after 1 h shown as red circle and after 24 h shown as green diamond) and (c) a significant drop in the value of the cell circularity (value after 1 h shown as red circle and after 24 h shown as green diamond), compared with the cell area and circularity at 1 h. In model ++, the cell state at 24 h was obtained by changing only K P . In this case, K P was increased to a much higher value, compared with the initial state. All the other parameter values were kept the same as for the cell state at 1 h. This state is characterized by (b) a significant drop in the cell area (value after 1 h shown as red circle and after 24 h shown as blue diamond) and (c) an insignificant change in the value of the cell circularity (value after 1 h shown as red circle and after 24 h shown as blue diamond), compared with the cell area and circularity at 1 h. Each data point in the (b,c) is the average of 10 independent simulation runs. (d) When P 0 < 83.18 , the cell shape is characterized by a circularity close to 1. In this case, circularity values obtained from 10 independent simulation runs show a very small, insignificant difference and are seen aligned as a line. However, when P 0   83.18 , the ground state of the cell is degenerate, and therefore, although the circularity is much lower than 1, the values obtained from 10 independent simulation runs show noticeable fluctuations around the mean value and are seen as a point cloud. The model suggests that substrate charges influence the cell shape in an actin-dependent manner.
Applsci 11 05689 g006
Figure 7. SICM topography images (10 × 10 µm2) of fixed MG-63 osteoblast peripheries after 1 h adhesion on glass (left) and plasma polymer PPAAm (right). The color scale represents the height information. Note that the cells exhibit more and higher peripheral ruffles (bright, leaf-like structures on the cell rim) when cultured on glass compared with flat cell edges on PPAAm.
Applsci 11 05689 g007
Table 1. Summary of all the model parameters, in dimensionless form, and their meaning.
Model QuantitiesMeaning
A ˜ Dimensionless area of the cell
A ˜ 0 Dimensionless preferred area of the cell
P ˜ Dimensionless perimeter of the cell
P ˜ 0 Dimensionless preferred perimeter of the cell
K ˜ A = K A L 2 K P Dimensionless strength of resistance to area changes
Table 2. Quantification of actin filament formation in MG-63s on charged titanium surfaces after 1 and 24 h. Data are exported from FilaQuant software for automatic filament recognition, covering the majority of filaments (n = 10 cells per surface; mean ± sem; Kruskal–Wallis followed by Dunn’s multiple comparisons test).
1 hTiPPAAmPDADMA
Filament number62.3 ± 5.1 b148.3 ± 10.7 a51.4 ± 6.3 b
Total filament length [µm]386.5 ± 35.3 b1050.0 ± 150.3 a241.6 ± 29.4 b
Mean filament length [µm]6.2 ± 0.56.6 ± 0.34.3 ± 0.3 a,b
Maximum filament length [µm]27.6 ± 2.735.6 ± 3.119.3 ± 2.6 b
24 hTiPPAAmPDADMA
Filament number45.5 ± 4.948.9 ± 6.028.6 ± 4.9 b
Total filament length [µm]830.5 ± 70.0863.8 ± 99.0138.4 ± 33.1 a,b
Mean filament length [µm]19.0 ± 1.618.0 ± 1.94.3 ± 0.3 a,b
Maximum filament length [µm]88.8 ± 7.081.2 ± 9.114.1 ± 1.2 a,b
a p < 0.05 vs. Ti; b p < 0.05 vs. PPAAm.
Publisher’s Note: MDPI stays neutral with regard to jurisdictional claims in published maps and institutional affiliations.

