Article

Do Heavy Vehicles Always Have a Negative Effect on Traffic Flow?

1
Smart Mobility Research Center, Department of Future Technology and Convergence Research, Korea Institute of Civil Engineering and Building Technology, Goyang-si 10223, Korea
2
ITS Performance Evaluation Center, Korea Institute of Civil Engineering and Building Technology, Goyang-si 10223, Korea
3
Department of Urban Planning and Engineering, Yonsei University, Seoul 03722, Korea
*
Author to whom correspondence should be addressed.
Appl. Sci. 2021, 11(12), 5520; https://doi.org/10.3390/app11125520
Submission received: 13 April 2021 / Revised: 10 June 2021 / Accepted: 10 June 2021 / Published: 15 June 2021
(This article belongs to the Special Issue Risk Assessment in Traffic and Transportation)

Abstract

:
The purpose of this study is to analyze the effect of heavy vehicles on traffic flow on a two-lane highway. To achieve this goal, data was obtained from piezosensors on the Seoul–Chuncheon Expressway. Analysis of the data showed that, as everyone knows, the average speed of traffic flows decreases as the proportion of heavy vehicles increases. However, not only the speed decreased, but the speed deviation between vehicles decreased. In other words, it was found that within the traffic group that formed the same platoon, individual vehicles were forced to form similar speeds, resulting in a homogeneous rate. This means that heavy vehicles can be included in the traffic stream, reducing the chances of a vehicle-to-vehicle conflict. This kind of influence can be said to explain that heavy vehicles do not necessarily have a negative effect on traffic flow. In this way, we expect to be able to study ways to manage traffic flow by using the effects of low-speed vehicles.

1. Introduction

Generally, heavy vehicles are known to have a negative effect on traffic flow. In general, a vehicle defined as a heavy vehicle is a vehicle that is larger than a truck, and refers to a vehicle with a large body size. It can be considered that such a vehicle has a wider area for lane change than a passenger car, and has a different form from that of a passenger vehicle in vehicle behavior such as acceleration and deceleration. In addition, it is generally classified as a low-speed vehicle and recommended to be driven on the rightmost side of the road. These characteristics and regulations are judged equally in other countries as well as Korea where this study was conducted. This can also be checked through the following manual. This can be evidenced by the passenger car equivalents (PCEs) in both the Highway Capacity Manual (HCM) [1,2] and the Korea Highway Capacity Manual (KHCM) [3]. In the KHCM [3], PCEs are defined as the number of passenger cars that can be replaced by one heavy vehicle, as shown in Table 1. In a flat land setting, a medium-sized heavy vehicle corresponds to 1.5 passenger cars, and a large-sized heavy vehicle corresponds to two passenger cars. In other words, according to Fisk [4], if the impact of a heavy vehicle on traffic flow is interpreted on the basis of speed, one medium-sized heavy vehicle affects traffic flow as much as 1.5 times that of passenger cars, and a large-sized heavy vehicle as much as two passenger cars. This study analyzed the effects of heavy vehicles on traffic flow and investigated whether there are any positive effects in addition to the negative effects that are already known. In addition, this study also aimed to review and present a traffic management plan for heavy vehicles.
Data on two-lane expressways, which account for the largest share in Korea, were used for the analysis, and traffic flow data was collected from the Seoul–Chuncheon Expressway, which is equipped with an automatic vehicle classification (AVC) detector capable of classifying vehicle types. Data-collection points and periods are shown in Figure 1 and Table 2, respectively. Data-collection points are located within the basic section of the Seoul–Chuncheon Expressway. Data were collected during the same period as Table 2, and the acquisition year is 2011. Although it is past data, it was judged that there was no difficulty in carrying out this study, so it was carried out without collecting additional information. At that time, the road was constructed and the reliability of the vehicle detector was secured, and the influence of road changes other than the traffic flow was controlled, so it was judged that it was more appropriate to check only the traffic flow phenomenon.

2. Review Study

Table 1 shows the PCEs in the KHCM [3] and Table 3 shows the PCEs in the HCM [1]. It is clear that the greater the traffic volume of heavy vehicles, the greater the effect on the traffic flow. The PCEs for heavy vehicles under various traffic conditions have also been reported in other previous studies [5,6,7,8,9,10]. The effect of heavy vehicles on traffic flow varies depending on the traffic flow rate and the ratio of heavy vehicles (see Table 3 and Table 4). In addition, it indicates that the higher the traffic flow rate, the greater the PCE, but the higher the heavy vehicle ratio, the smaller the PCE.
In other words, it means that with the same traffic volume, if the proportion of heavy vehicles is high, their impact on the traffic flow is relatively small. In addition, the impact of heavy vehicles on traffic flow is greater when the traffic is congested than when it is not. This change in PCE according to the ratio of heavy vehicles is also seen in the oversaturated traffic regime, and PCEs were larger than the values presented in the study of uncongested conditions [10]. Webster and Elefteriadou [5] estimated the PCEs based on density; as it was difficult to measure the actual density data, density data was obtained through simulation.
In the study of Webster and Elefteriadou [5], PCEs were analyzed by considering all factors for grade, heavy vehicle ratio, and flow rate, but the study had a limitation that simulation data was used. To overcome this drawback, in the present study, the impact of heavy vehicles on traffic flow was investigated using the traffic flow data obtained along the Seoul–Chuncheon Expressway.
Heavy vehicles can induce a stable traffic flow by reducing the speed variation of the traffic flow, although one heavy vehicle affects the traffic flow rate more than one passenger car, as suggested in previous PCE-related studies. According to a study on the impact of truck proportion on traffic safety, when the speed variation coefficient was low and the truck proportion was above a certain level, the traffic flow was relatively safe [11,12]. Moreover, as the truck ratio of traffic flow increases, the frequency of the number of lane changing decreases [11]. This means that the impact of heavy vehicles, which was considered negative in terms of traffic volume, can act positively on traffic flow stability. This paper analyzes the impact of heavy vehicles on speed variation based on field data collected on real roads.

3. Characteristics of Traffic Flow

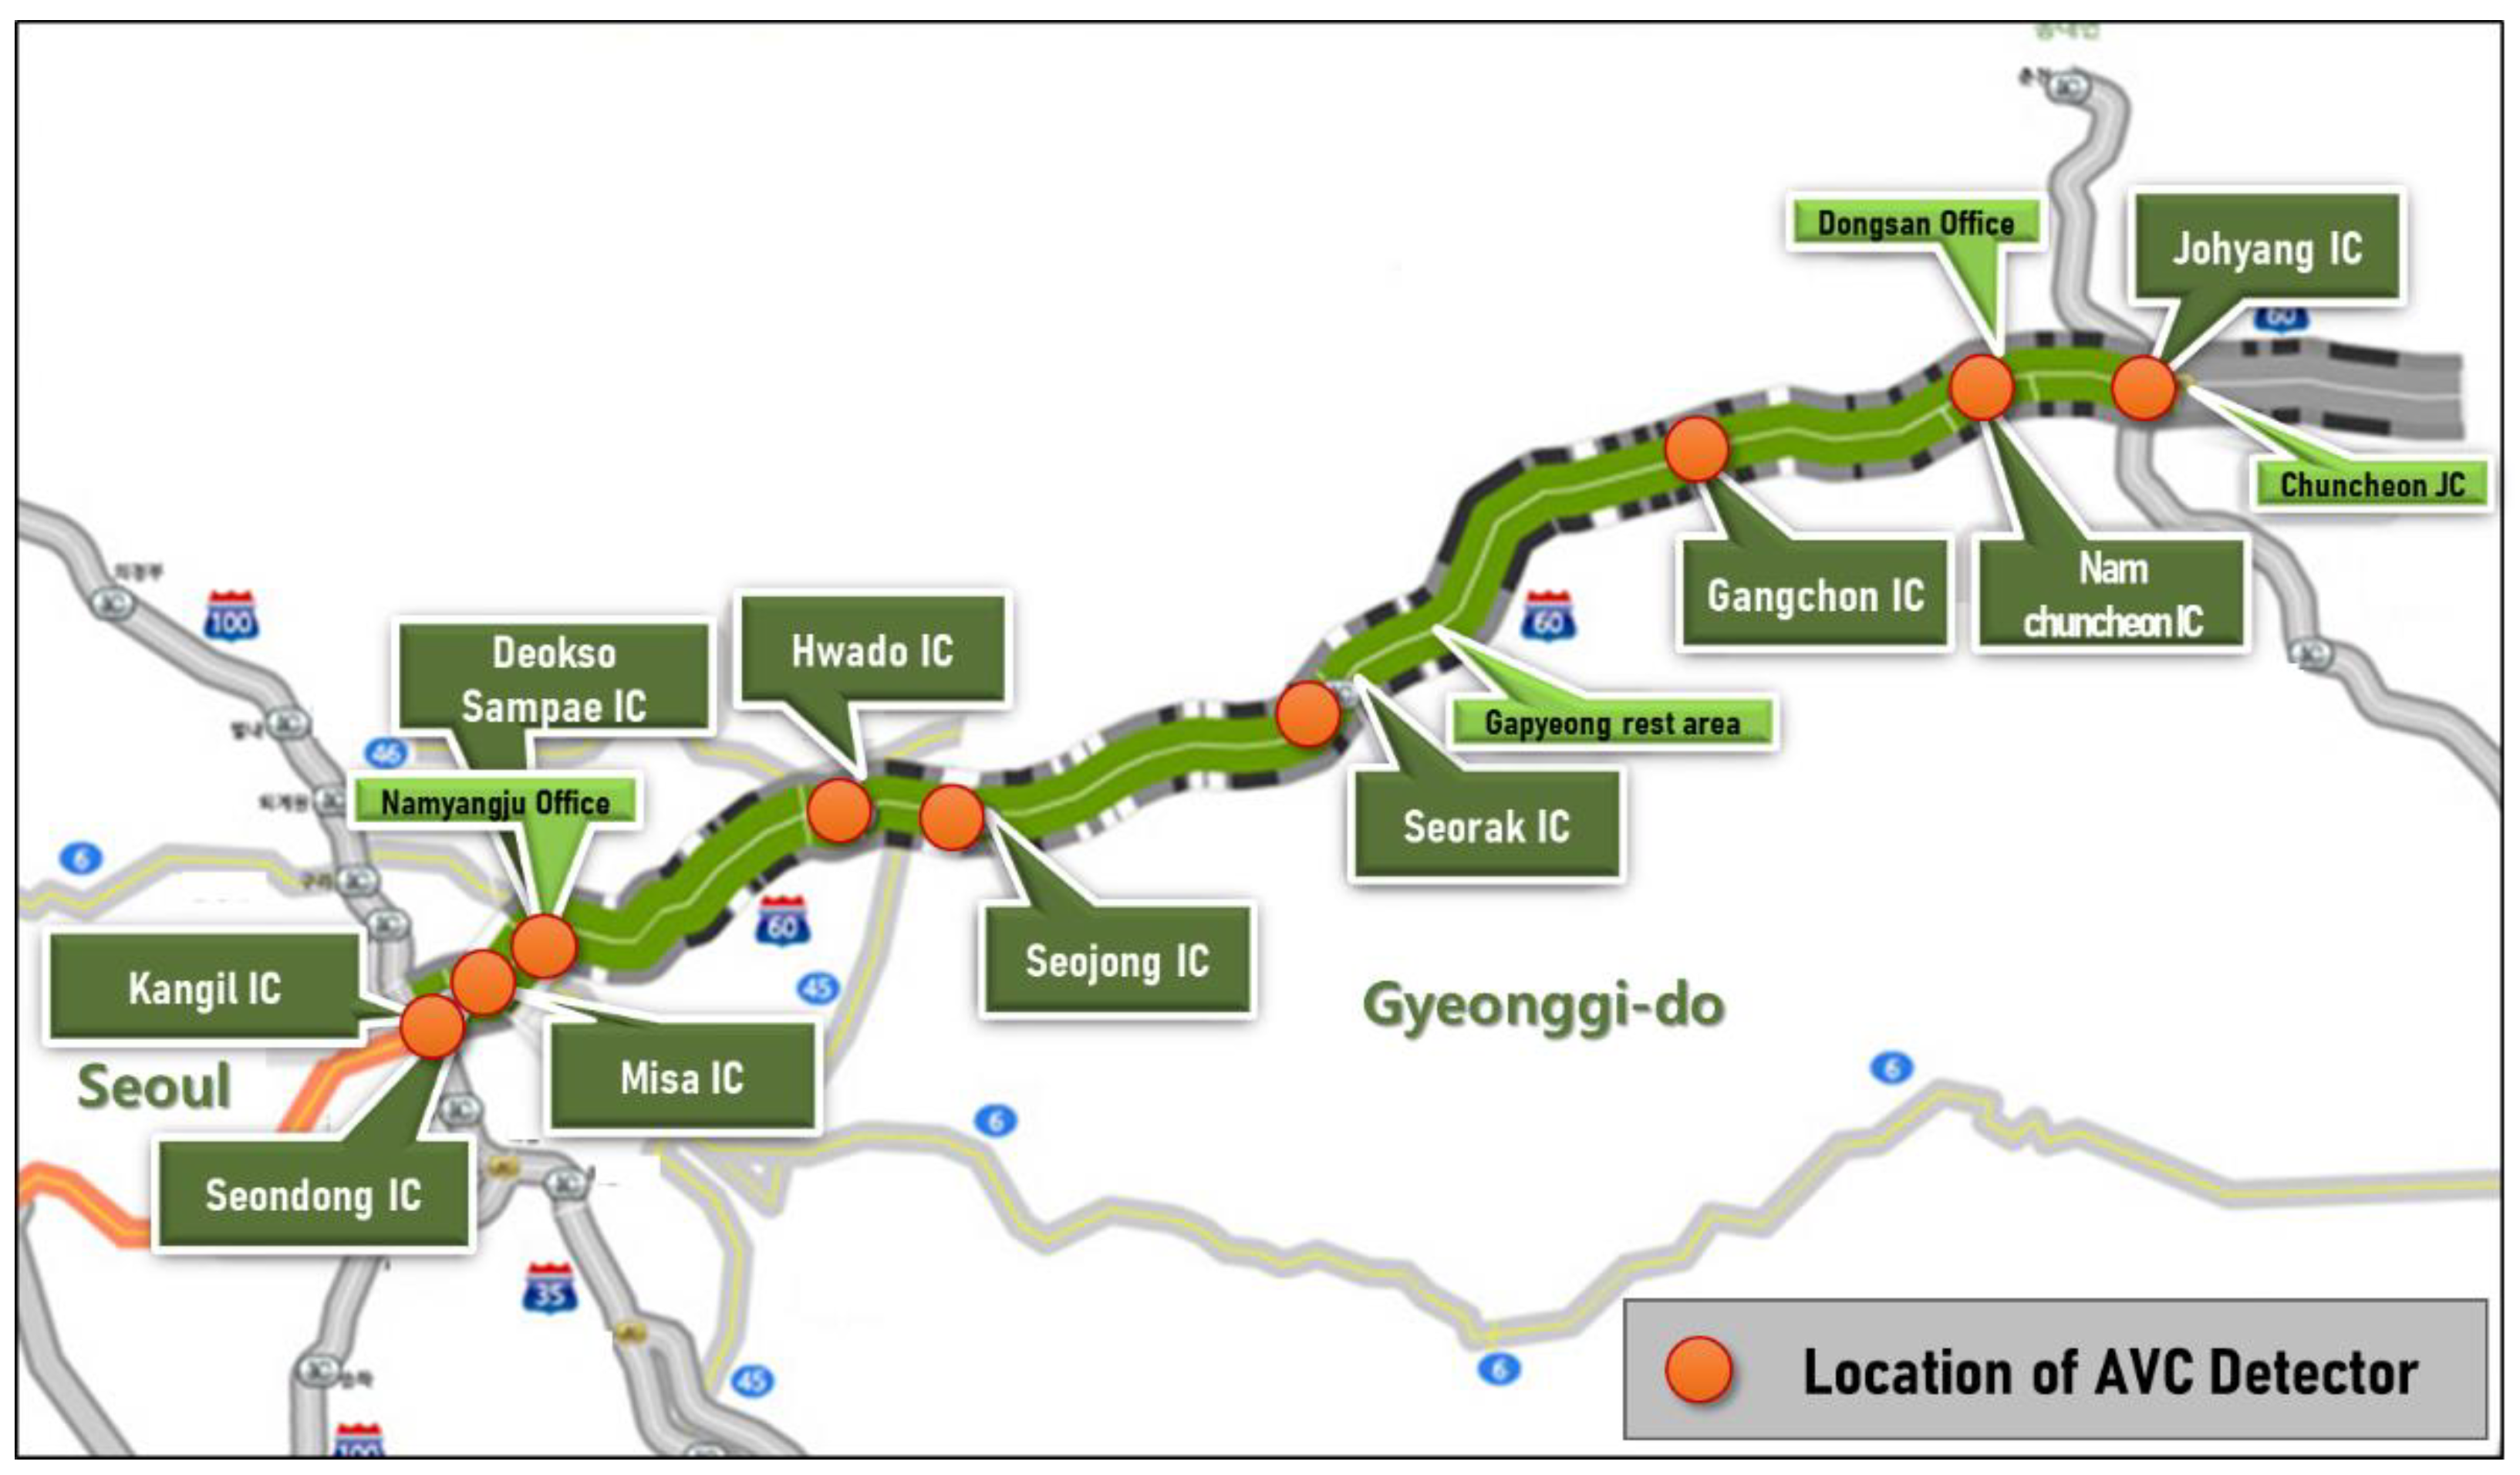
3.1. Data Collection and Description

A total of nine detectors were installed along a 61.4 km section of the Seoul–Chuncheon Expressway. Two types of detectors were installed: a vehicle detector equipped with a double-loop detector that collects traffic flow data such as traffic volume, speed, and occupancy; and an AVC detector equipped with piezosensors that are capable of classifying 12 types of vehicles (see Figure 2 for example).
The characteristics of the piezosensor, other than the loop detectors that are commonly found on the road, are as follows. According to the Korea Ministry of Land, Infrastructure, and Transport (MOLIT) report [13], this piezosensor measures the electrical signal generated as a result of the mechanical stress applied to the sensor by the axle of a car when it passes over the sensor embedded on the road. If two piezosensors are installed on the road at a certain distance from each other, they can be used to accurately measure a vehicle’s speed. They can also be used as weighing-in-motion apparatus, which is the measurement of a vehicle’s weight when the effect of temperature is compensated. These methods for measuring the number and weight of the axles are accurate and reliable; thus, these sensors are frequently used as traffic flow survey equipment. The reliability of these piezosensors is shown in Table 5.
The detectors along the Seoul–Chuncheon Expressway maintained accuracy above the level stipulated for the evaluation; performance evaluation inspections and calibrations are conducted at least once every two years by the Korea Highway Corporation, which is responsible for the management of the detectors. Advanced level is a grade that can be obtained when the accuracy of collected traffic information such as traffic volume and speed is ≥90%. In this study, the vehicle detectors satisfied the required accuracy for the advanced level, thereby ensuring reliable results. Examination of road geometry of the sections using the vehicle detectors showed that the maximum longitudinal slope and the cross slope were 2%. This indicates that the roads are flat, in agreement with the KHCM [3] standards. Therefore, it was assumed that the geometry of the data acquisition points would have a negligible impact on data analysis.
For an accurate analysis, raw data of individual vehicles must be continuously acquired, but actual raw data was collected and aggregated every 30 s for efficient storage and utilization of highway vehicle detection system data. Given that it is not feasible to obtain raw data for individual vehicles, raw data already collected along the Seoul–Chuncheon Expressway was used for the analysis in this study. The collected data are traffic volume and speed data for 12 types of vehicles. The data were organized as shown in Table 6. As shown in Table 7, 5 min of traffic volume and 5 min of average speed data weighted by traffic volume were calculated and used for the analysis.
As shown in Table 8, for the traffic data collected on the roads managed by the Korea Expressway Corporation, vehicles are classified into 12 types [13]. This is a regulation defined in the traffic survey vehicle classification guide published by MOLIT [14]. For road capacity and service level analysis, heavy vehicles are classified into three types: small, medium, and large-sized heavy vehicles. Small-sized heavy vehicles are small passenger cars and vans with a capacity of <16 passengers (Class 1) and trucks weighing <2.5 tons (Class 3). Medium-sized heavy vehicles are trucks weighing ≥2.5 tons (Class 4) and buses with a capacity of ≥16 passengers. The other vehicles were classified as large-sized heavy vehicles. During the data-collection period shown in Table 2, 4,375,420 datasets were selected from 5,114,950 datasets that had been collected on three dry and sunny weekdays (Tuesday, Wednesday, and Thursday). Using the method presented in Table 7, the data was processed to produce a total of 437,542 datasets with an interval of 5 min.

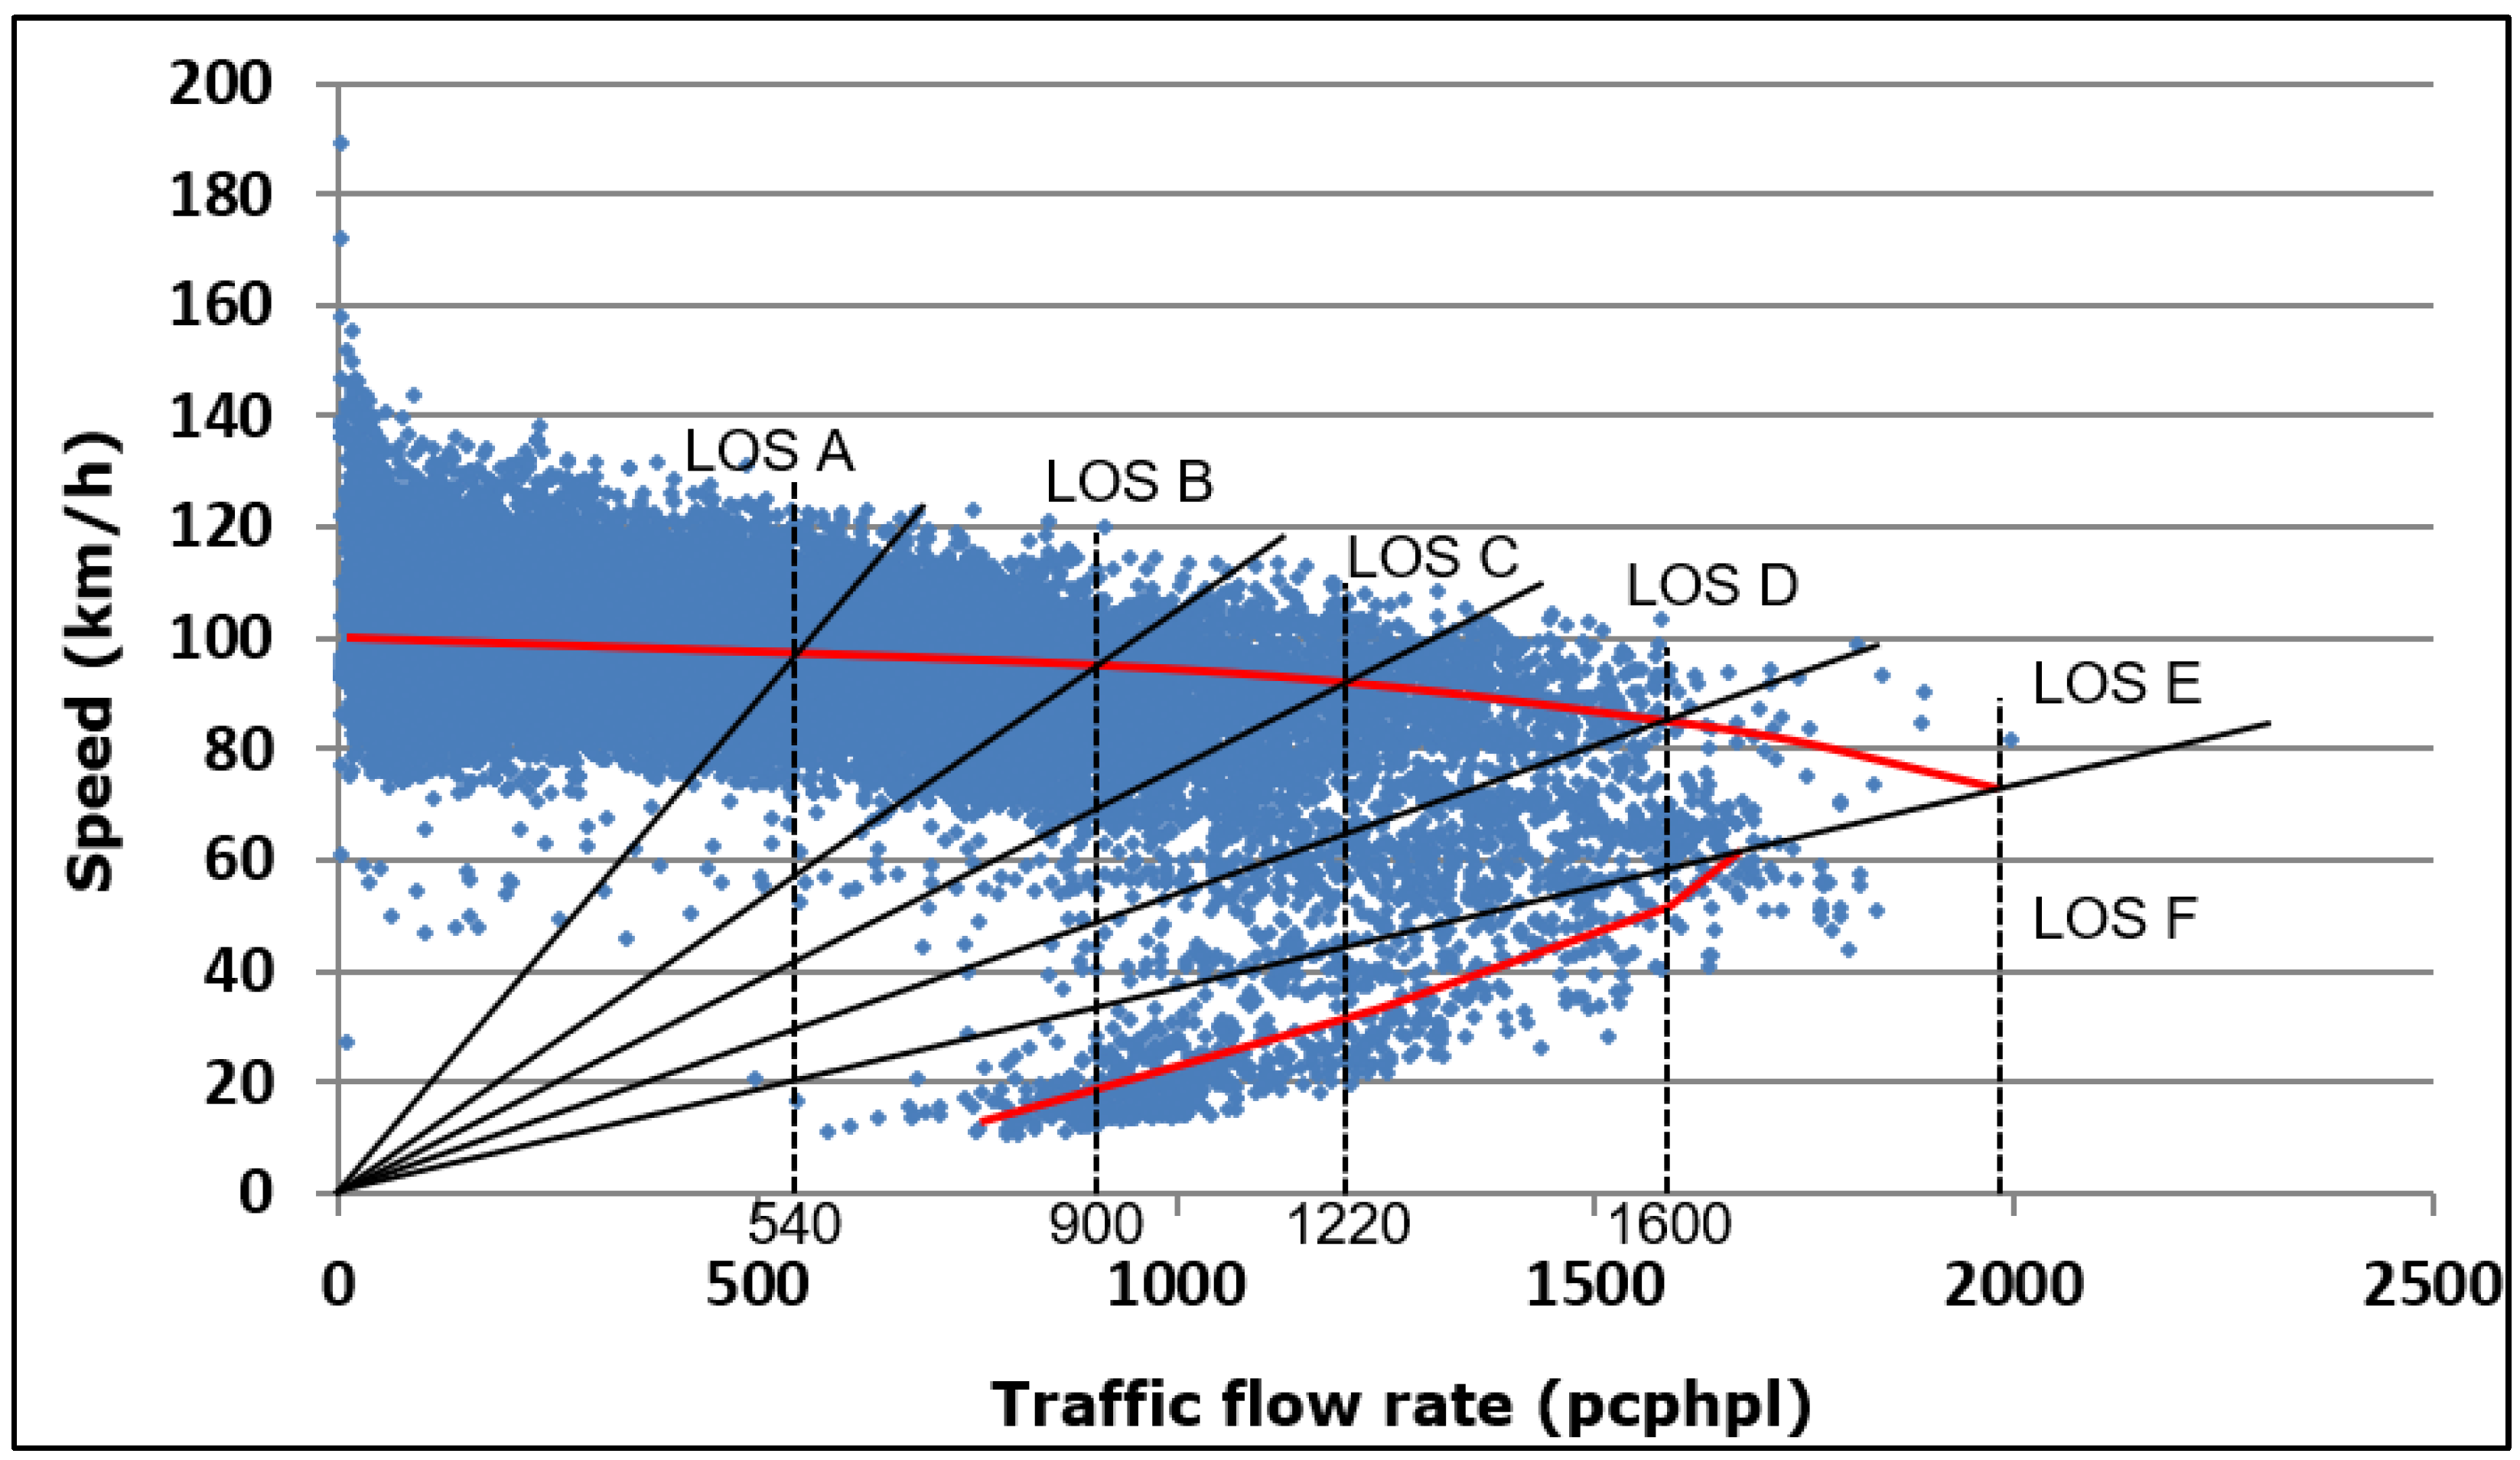
3.2. Characteristics Analysis Result of Traffic Flow

As shown in Figure 3 and Table 9, the traffic flow rate (converted from 5-min traffic volume to 1-h traffic flow rate) that distinguishes traffic jam from no traffic jam, and speed (average speed value of 5-min traffic flow) had a threshold of 2028 veh/h and 74.0 km/h, respectively. As shown in Table 9, when only passenger cars and small-sized heavy vehicles were included in the analysis, the thresholds were 2148 veh/h/ln for traffic flow rate and 79.8 km/h for speed, which were higher than when all vehicle types were included.
This might be due to the relatively poor quality of traffic—in which the road was occupied by different types of vehicles, causing conflicts among the vehicles. This characteristic was more apparent when it was compared with the characteristics of traffic flows in which only two vehicle types were present. Among the traffic having different vehicle types mixed, when small and medium-sized heavy vehicles were included, traffic volume and speed had a threshold of 2052 veh/h/ln and 74.0 km/h, respectively.
When small- and large-sized heavy vehicles were included, the corresponding values were 2100 veh/h/ln and 76.7 km/h. In both cases, the thresholds were higher than those measured when all vehicle types were included. Such differences can be attributed to the driving patterns of each vehicle type. As shown in Table 10, the analysis of the speed distributions of small, medium, and large-sized heavy vehicles shows that the average speed was the highest for small and medium-sized vehicles (including passenger cars), while the variance and standard deviation of their speeds were higher than those of other vehicle types. This can be confirmed in Table 9, which shows that volumes of traffic flow reached the highest threshold only for the small-sized heavy vehicles. However, the larger standard deviations and variances in speed indicate that in the case of small-sized heavy vehicles, there were many cases of acceleration and deceleration while driving. In addition, if this happened in the basic section of the continuous traffic flow, it means that the driver tried to overtake other vehicles. In other words, small-sized heavy vehicles try to overtake a relatively large number of other vehicles, and when this happens, acceleration and deceleration occur more frequently, thus affecting the traffic flow to a greater extent.
Medium-sized heavy vehicles have lower average operating speeds than that of small-sized heavy vehicles, but the standard deviation and variance of the speed distribution are relatively small. This means that when there is no external factor such as an unexpected situation, the vehicle is maintained at a constant speed, which leads to a relatively low standard deviation and variance in speed for the traffic mixed with only small and medium-sized heavy vehicles, as shown in Table 10. As presented by some studies about traffic safety [15,16,17,18], when the speed deviations of vehicles passing through points and sections are small, a stable traffic flow with a low accident risk is expected. Given these characteristics, it seems that traffic flows containing medium-sized heavy vehicles are more stabilized and the accident risk is lower than in traffic flows containing passenger cars and small-sized heavy vehicles maintaining a relatively high speed. These results indicate that the impact of medium-sized heavy vehicles on traffic flow considered in the existing vehicle correction factor and PCE is different from the actual effect on the traffic flow. In other words, heavy vehicles may stabilize the traffic flow and not significantly lower the service level.

4. Speed Changes According to Traffic Volume and Heavy Vehicles Ratios

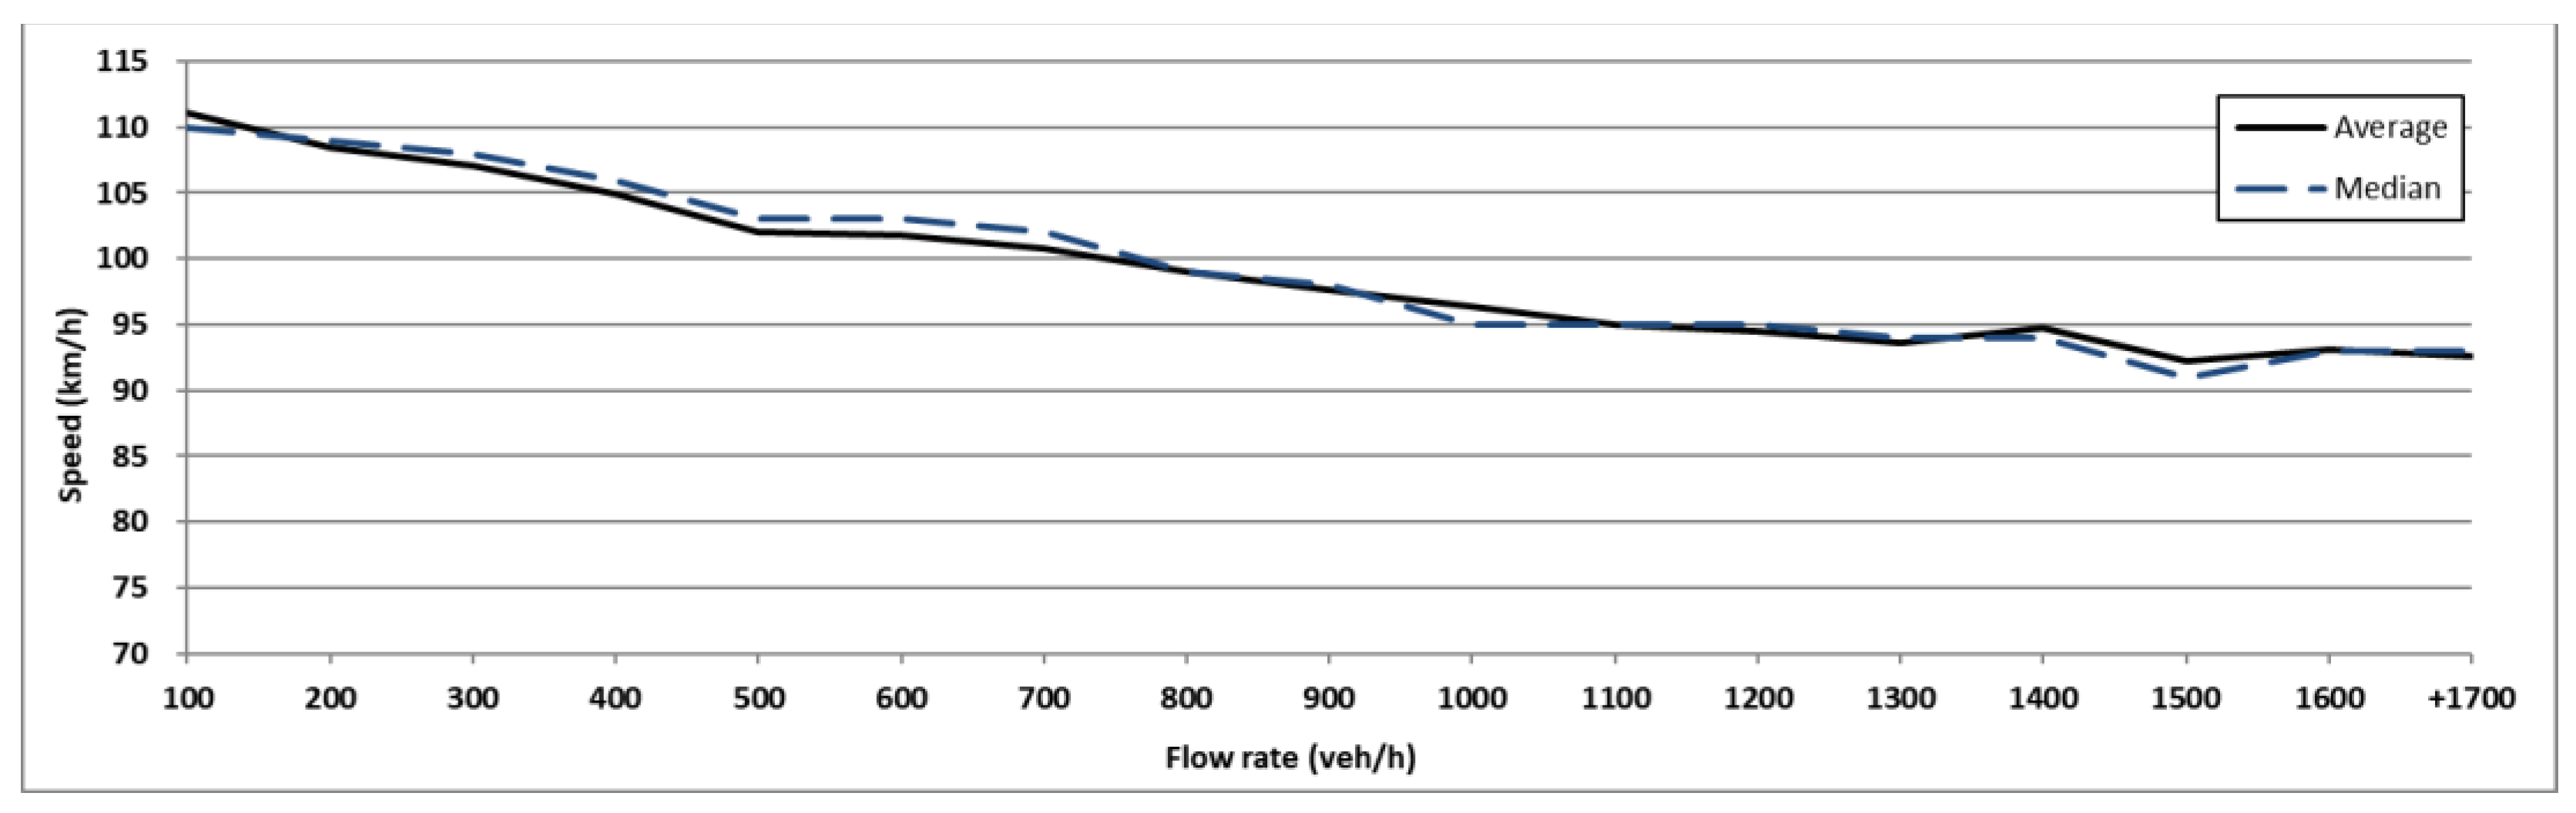
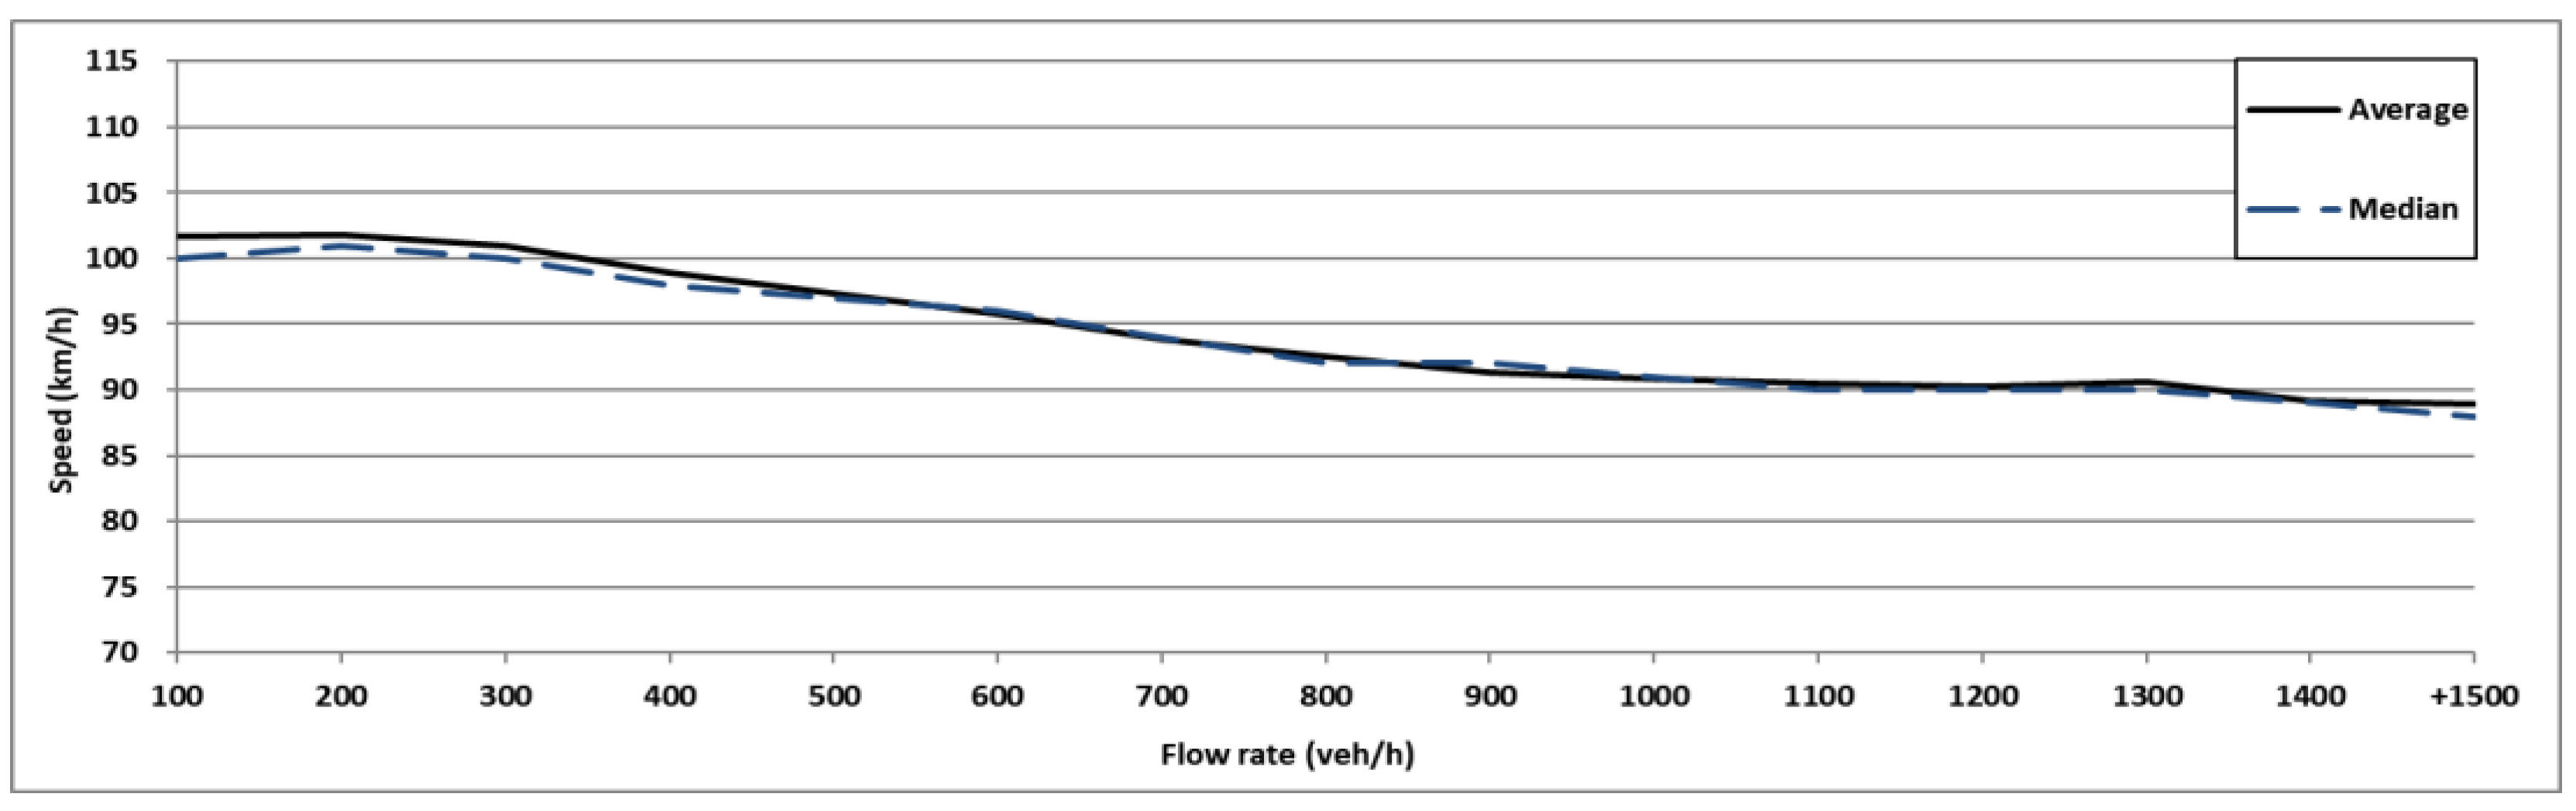
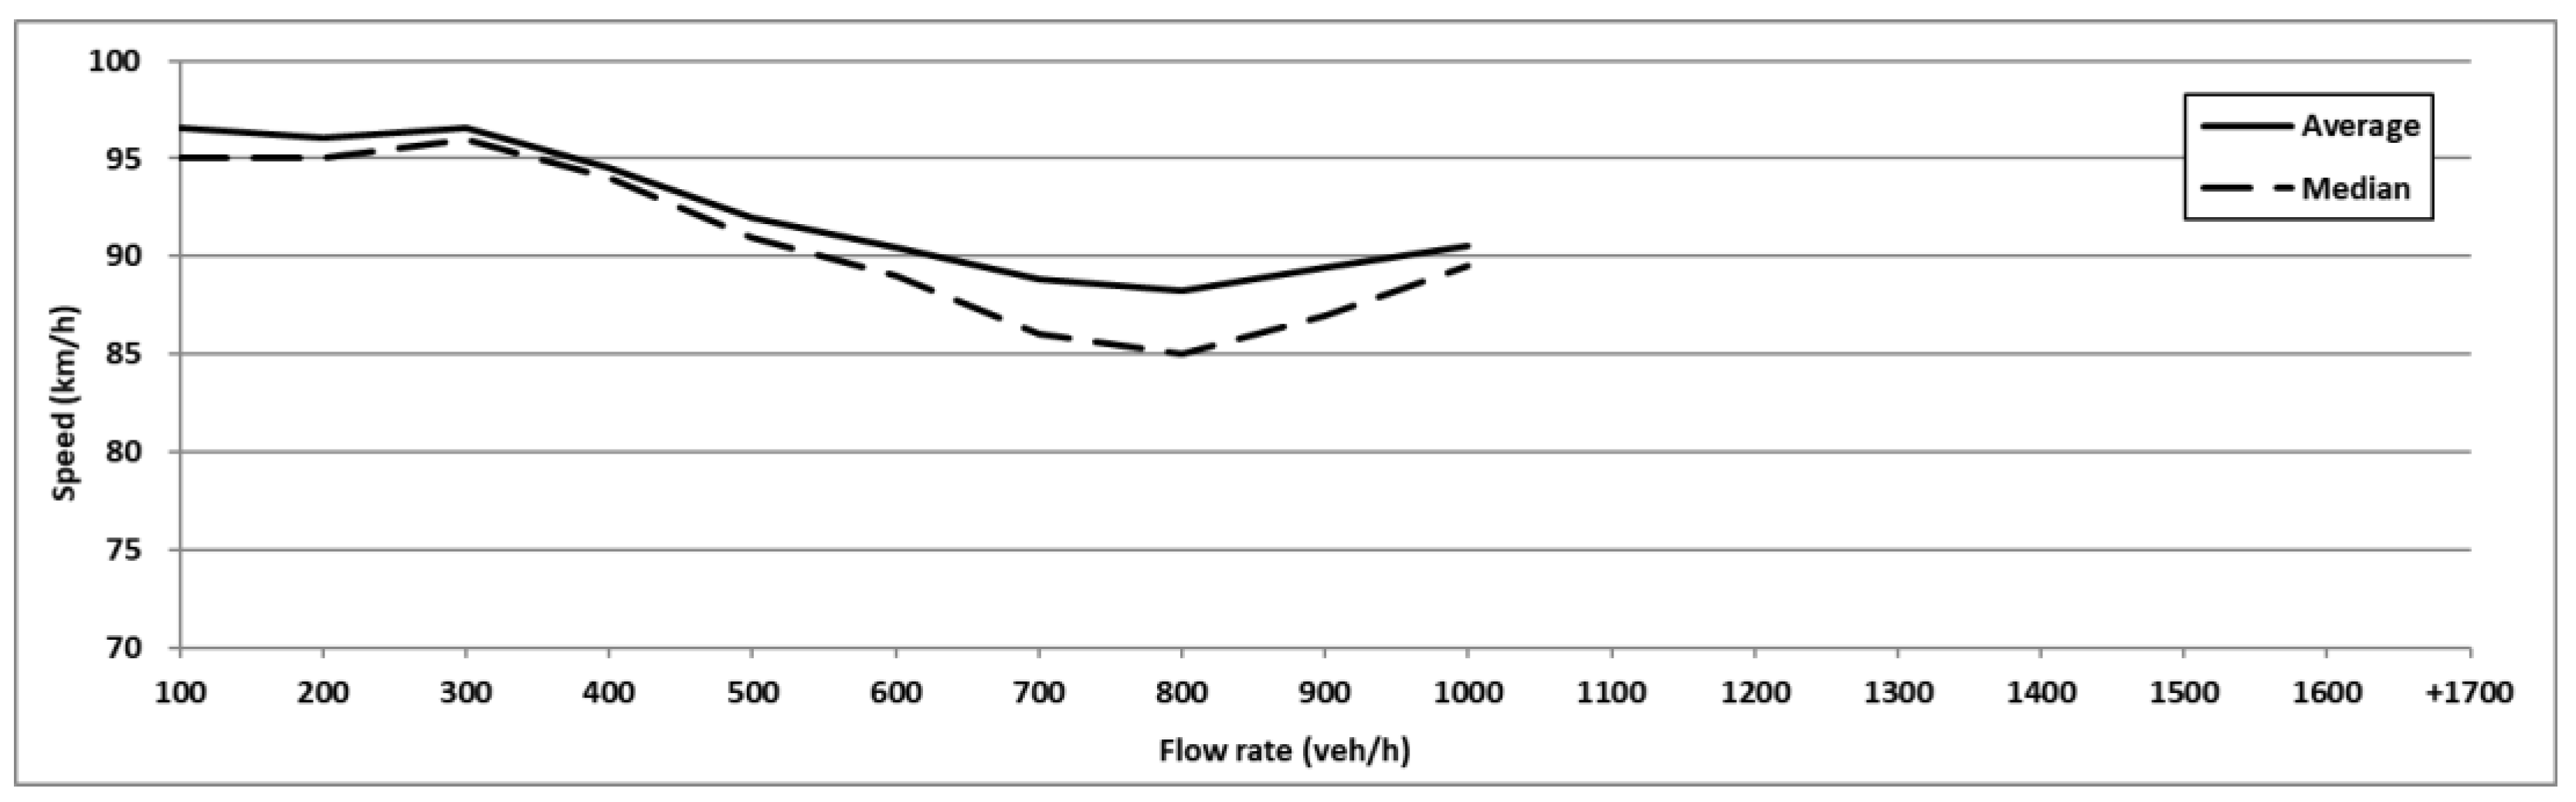
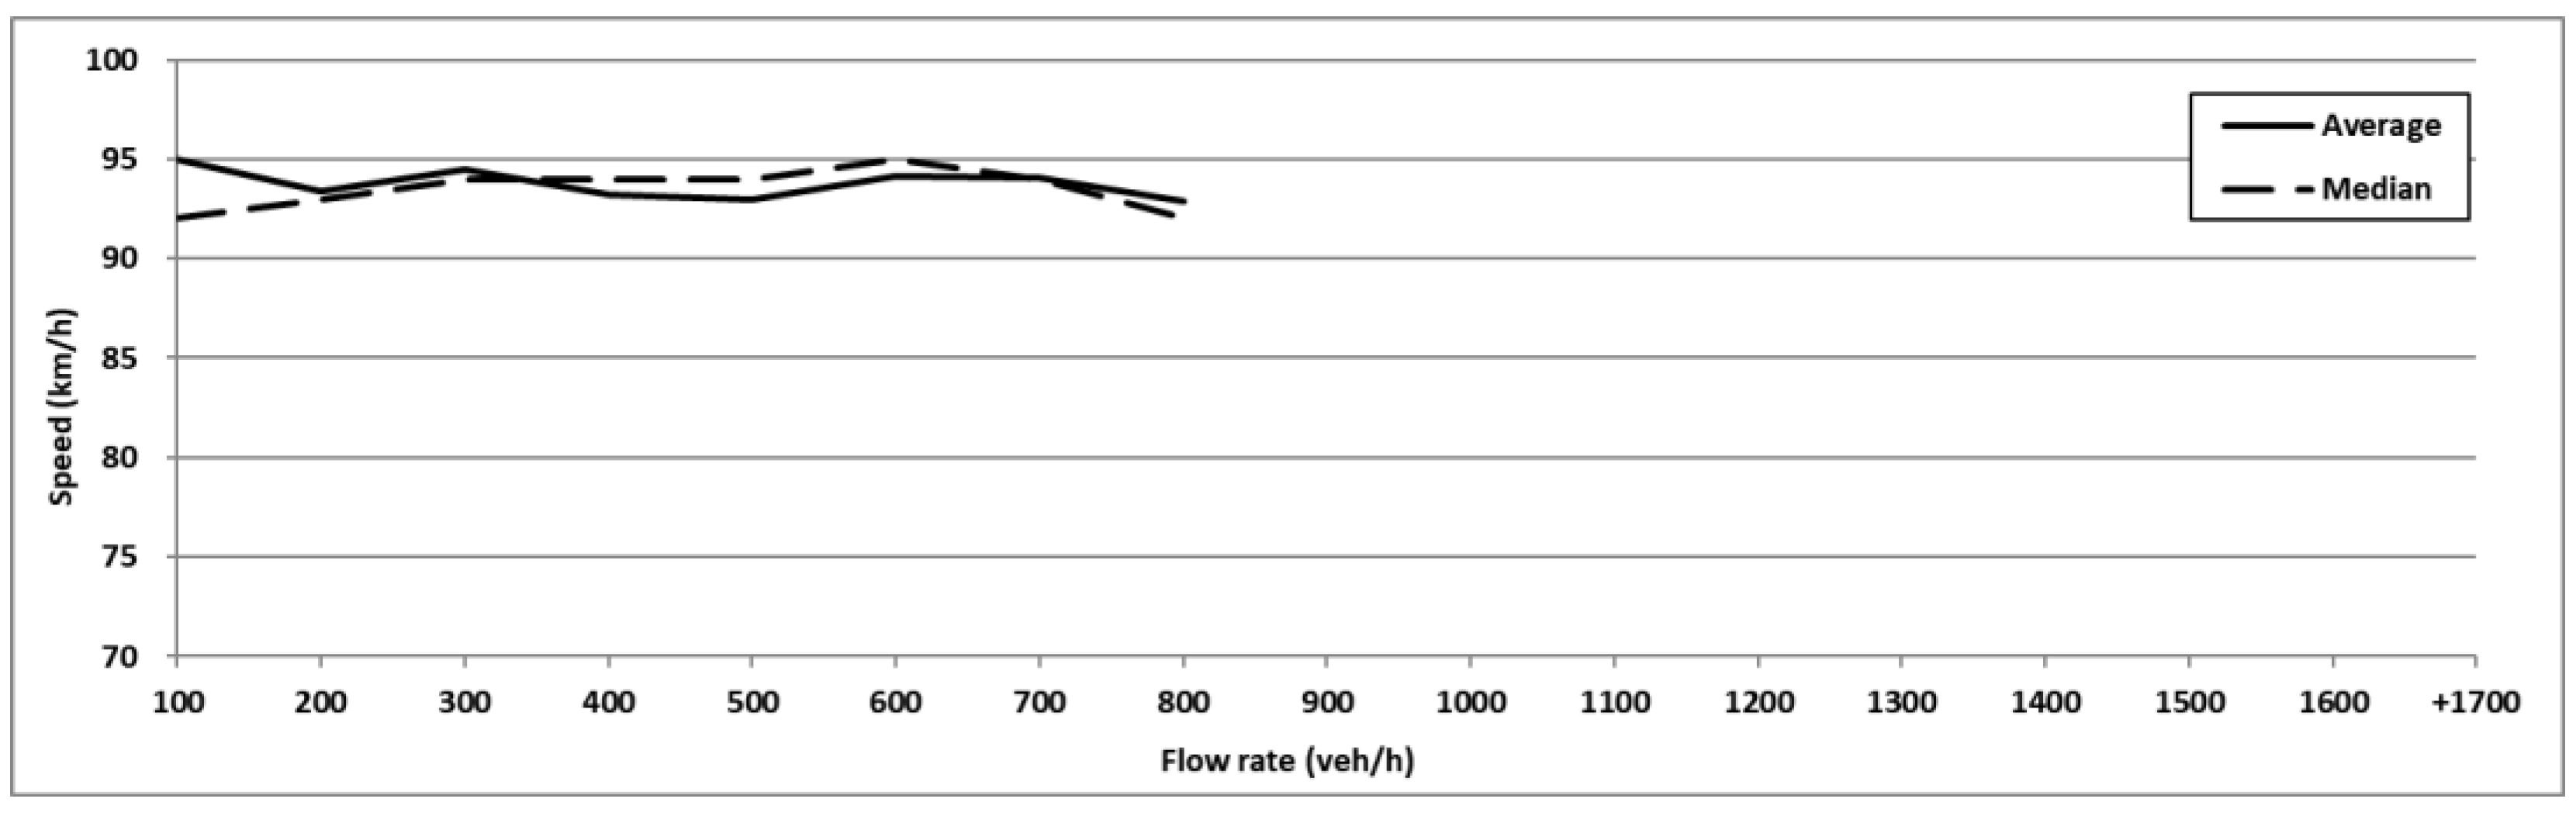
4.1. Changes According to Traffic Volume

The following plot shows the mean and median speeds altered by the traffic flow in which heavy vehicles are included in the same ratio. Figure 4 shows the changes in the mean and median speeds according to the traffic volume in a traffic flow with only small-sized vehicles. Figure 5, Figure 6 and Figure 7 show the speed changes in the traffic flow where the proportion of heavy vehicles is increased to 15%, 30%, and 50%, respectively. As shown in Figure 4, in the traffic flow that did not include heavy vehicles, the decrease in speed follows an almost constant slope. This is a downward slope similar to the one commonly seen in a typical traffic-speed graph. When the traffic flow rate in Figure 4 increases from 0 veh/h to 500 veh/h, it shows a very steep slope even though it is a section generally expected to have a small decrease in speed due to low traffic. This can be interpreted as a phenomenon that occurs due to the gradually decreasing proportion of vehicles that drive too fast as they ignore the speed limit of 100 km/h. Although these characteristics go against the road regulations, they are shown here as these are the actual data obtained.
This trend changed as the proportion of heavy vehicles increased. When the proportion of heavy vehicles increased, the decrease in speed was relatively small despite the increase in traffic volume. Table 11 shows the results when the first regression equation was applied to find the speed changes according to the changes in traffic volume in cases where the ratios of heavy vehicles were the same. For each case, a regression equation was calculated using two dependent variables, one set to speed v and the other set to traffic flow rate q . Here, the slope of the straight line indicates the relationship between traffic flow rate and speed. Because all slopes are negative, it can be concluded that the speed decreases as the traffic volume (or traffic flow rate) increases. As the proportion of the heavy vehicles increases, the absolute value of the slope gradually decreases. Thus, it indicates that even if the traffic volume (or traffic flow rate) increases, the degree to which speed decrease is relatively small. In other words, when the proportion of heavy vehicles increases, the impact of traffic volume on speed decreases. In addition, it is the basis on which the traffic flow becomes more stable as the degree to which speed increases or decreases becomes smaller, regardless of the changes in traffic volume. This study targeted the Seoul–Chuncheon Expressway, which is characterized by a continuous flow and high-speed movement. In this expressway, the traffic flow with a high proportion of heavy vehicles occurs during dawn and night time, when the total traffic volume is low. Therefore, it is difficult to interpret the results for cases in which the statistical valid sample number (n = 30) is satisfied (transport rate of 1100 veh/h/ln or less), as shown in Figure 6 and Figure 7.
In reality, it is extremely rare that the proportion of heavy vehicles (% of HV) is more than 50%. This is the reason why the model reliability in the case of % of HV = 50 in Table 11 is low. Efforts were made to acquire data corresponding to the corresponding part, but only the data set for the case where the condition was satisfied momentarily was formed, and the case of continuous acquisition could not be observed. Since % of HV = 50 is satisfied when the traffic volume is less than 10, it may be meaningless to form such a model. Nevertheless, the model formula was presented together with the aspect of informing the characteristics of the data.

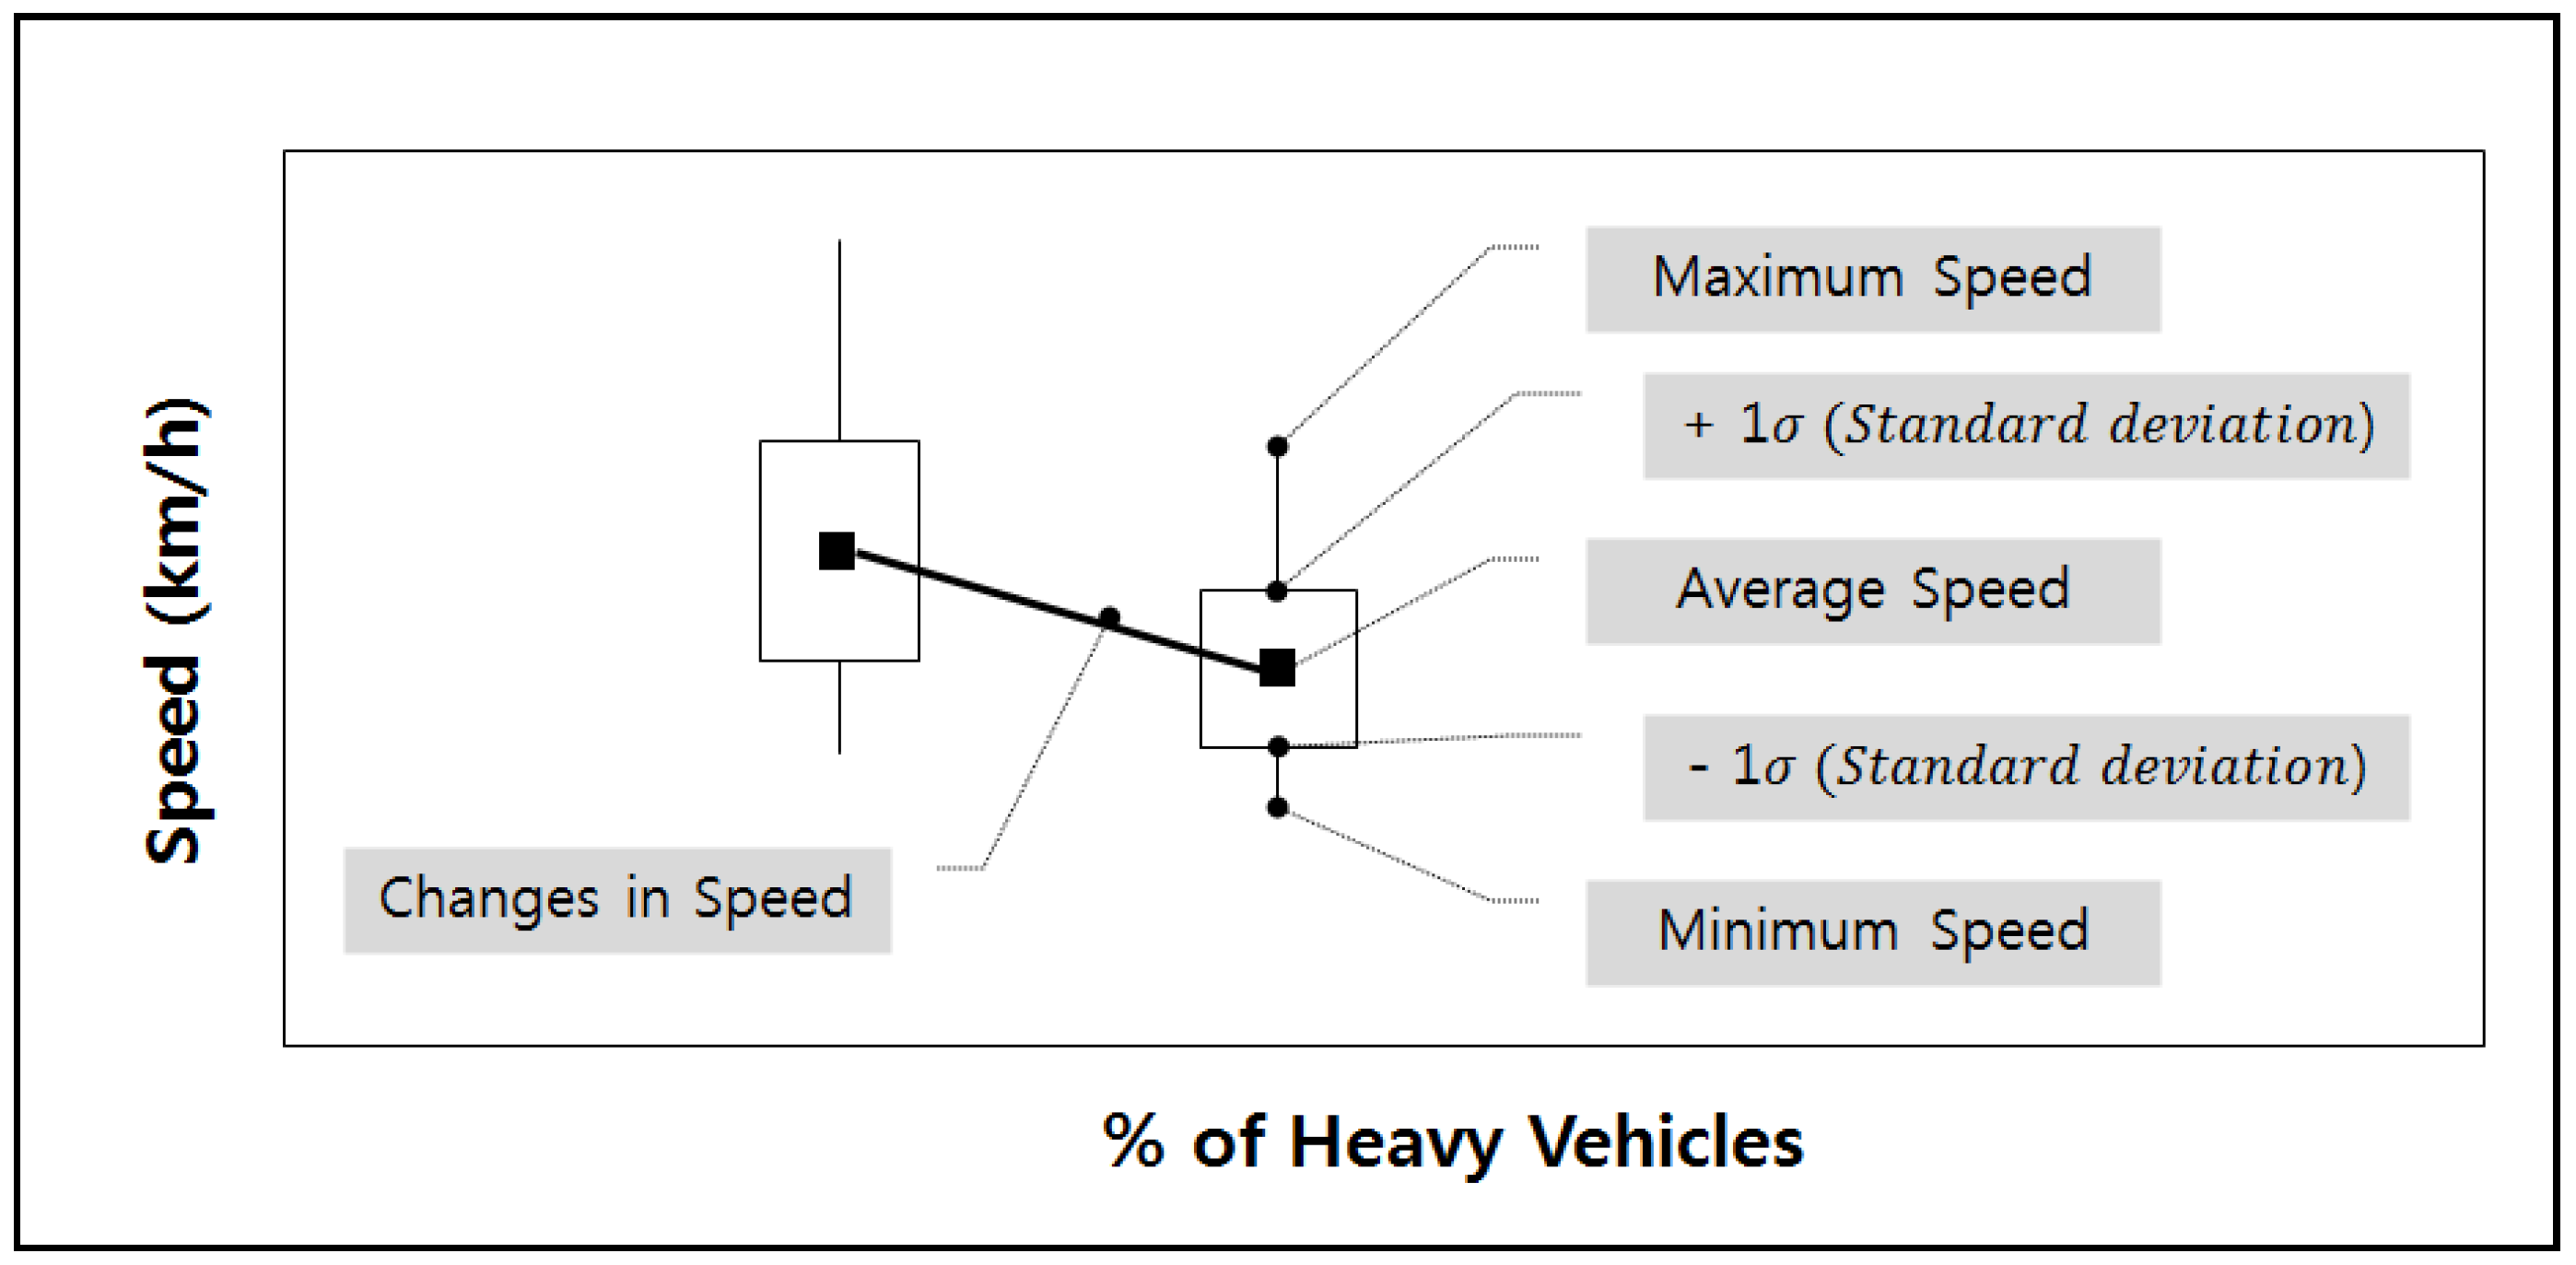
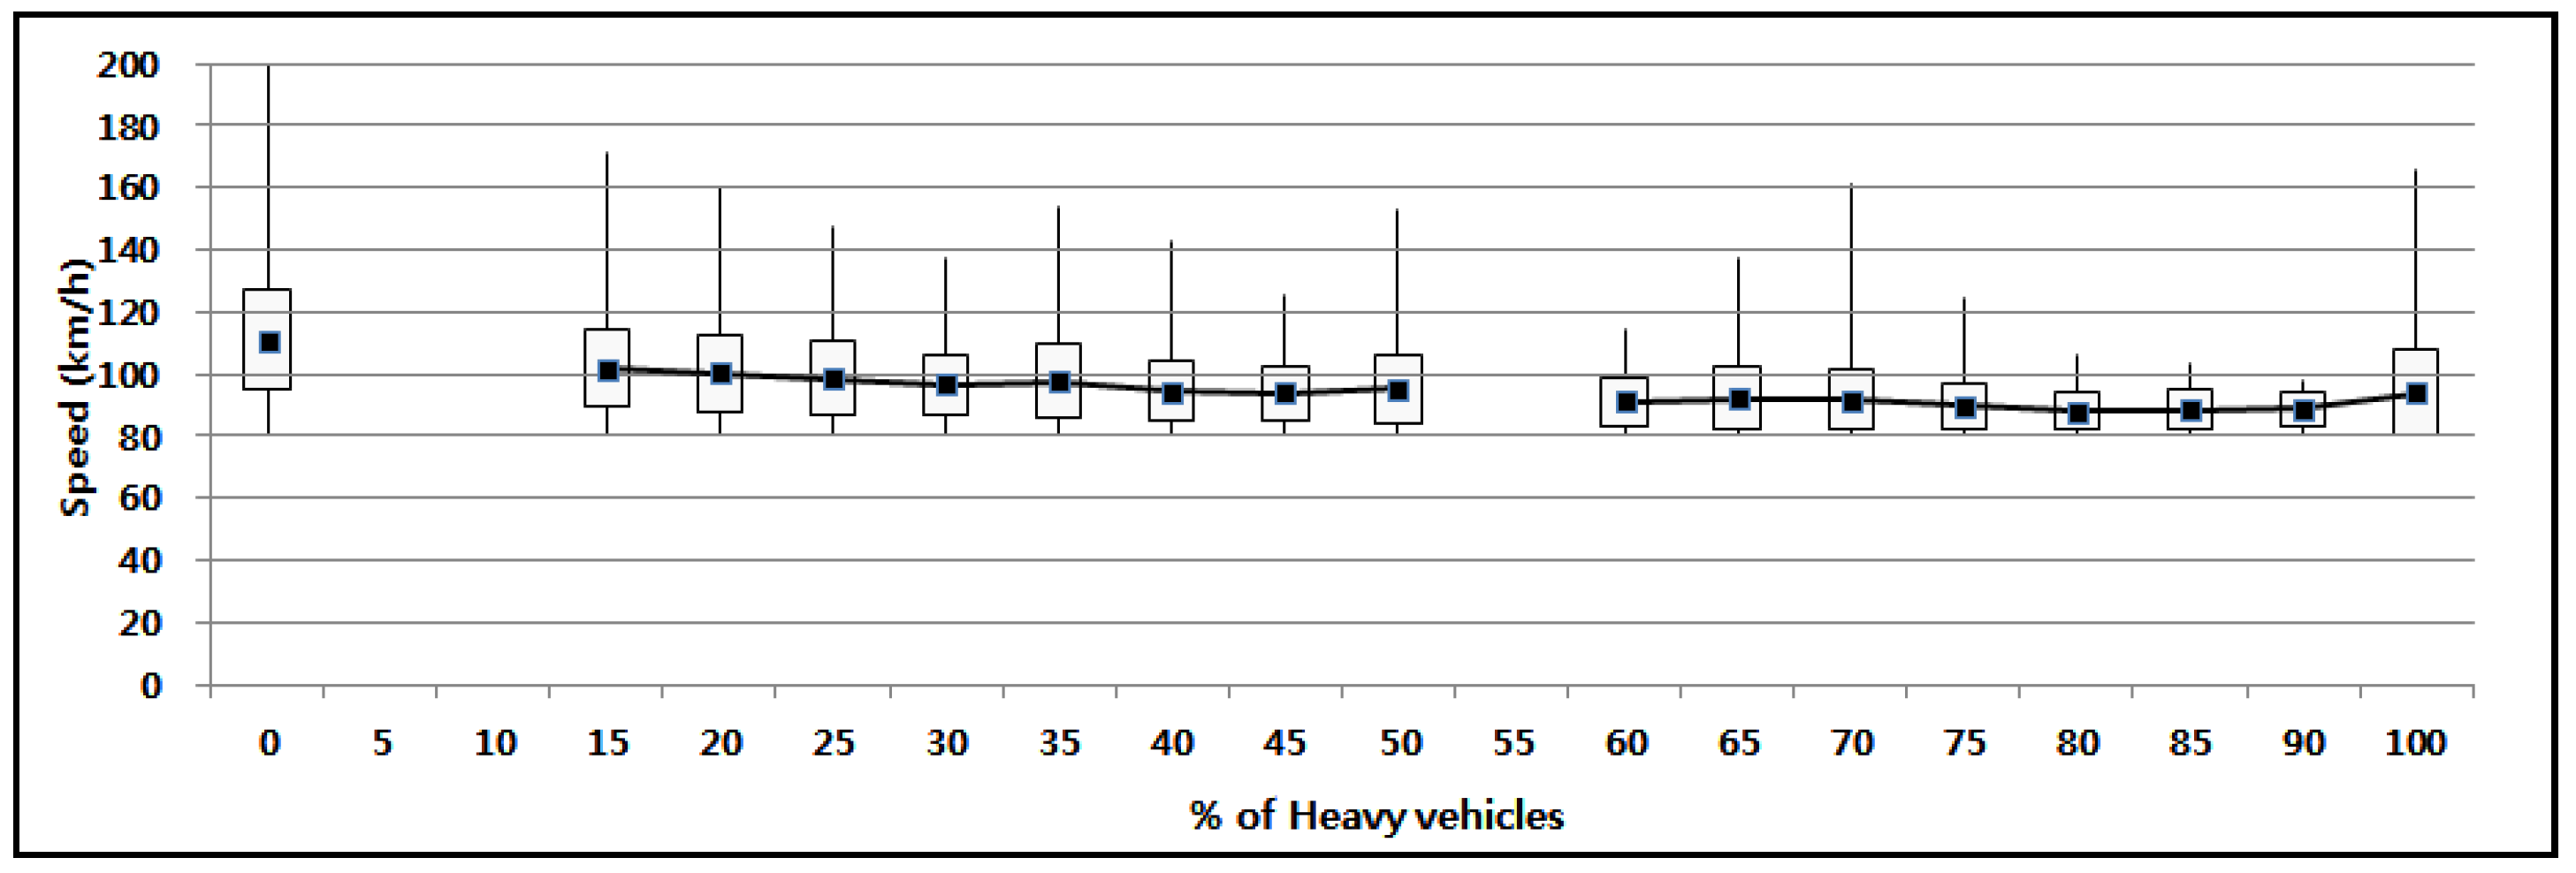
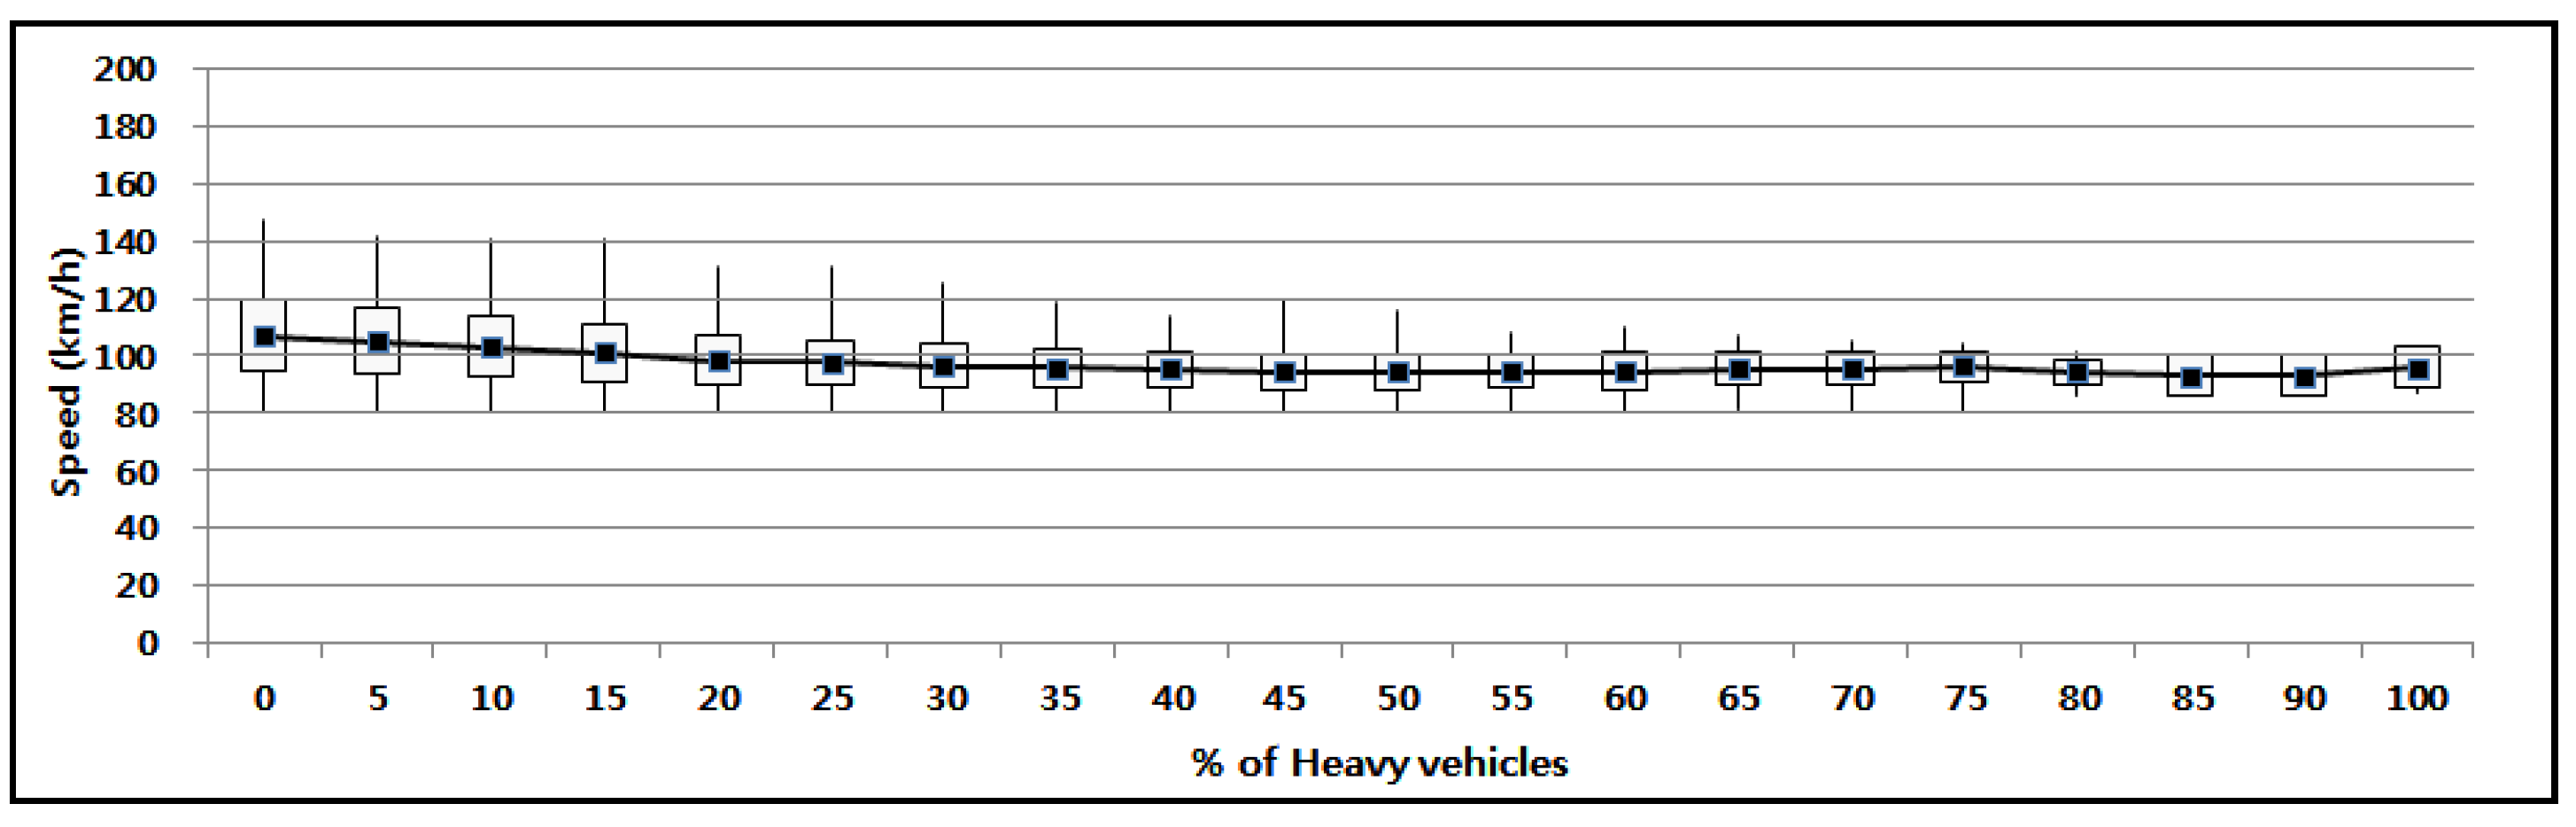
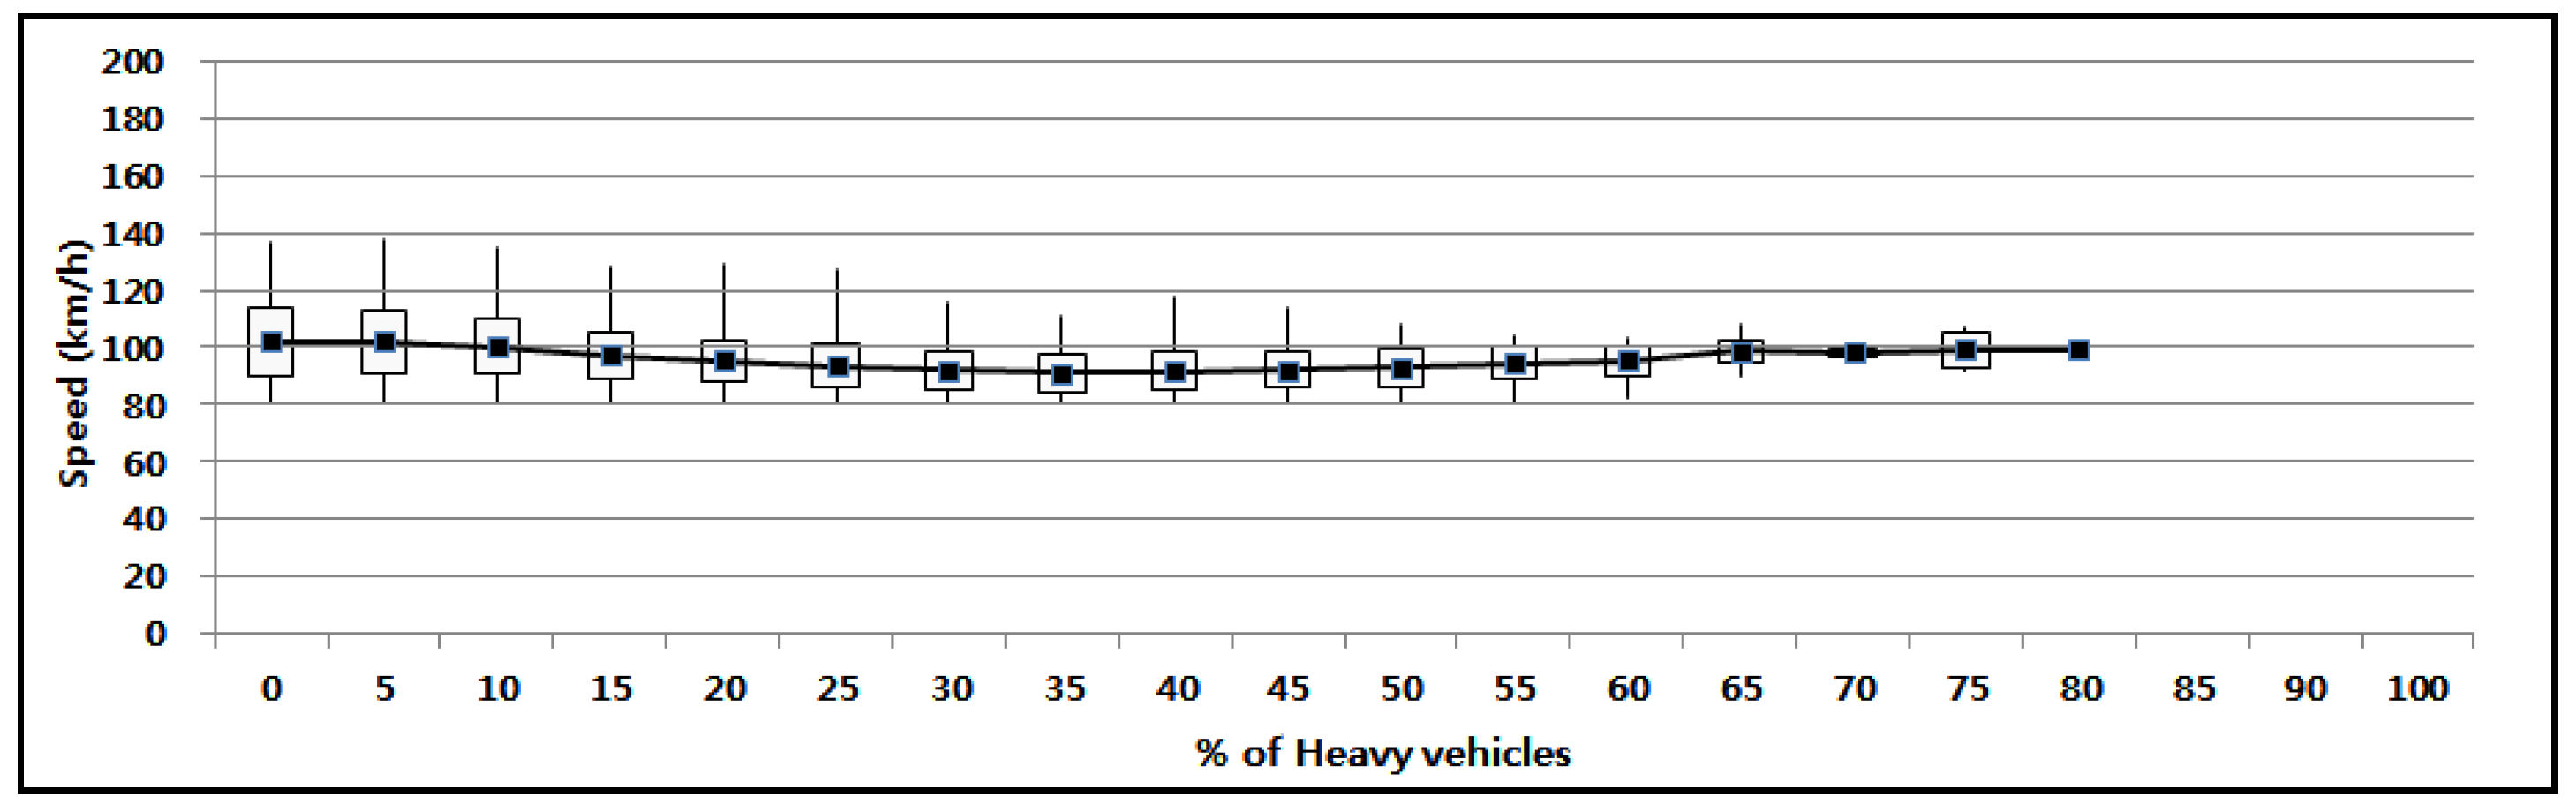
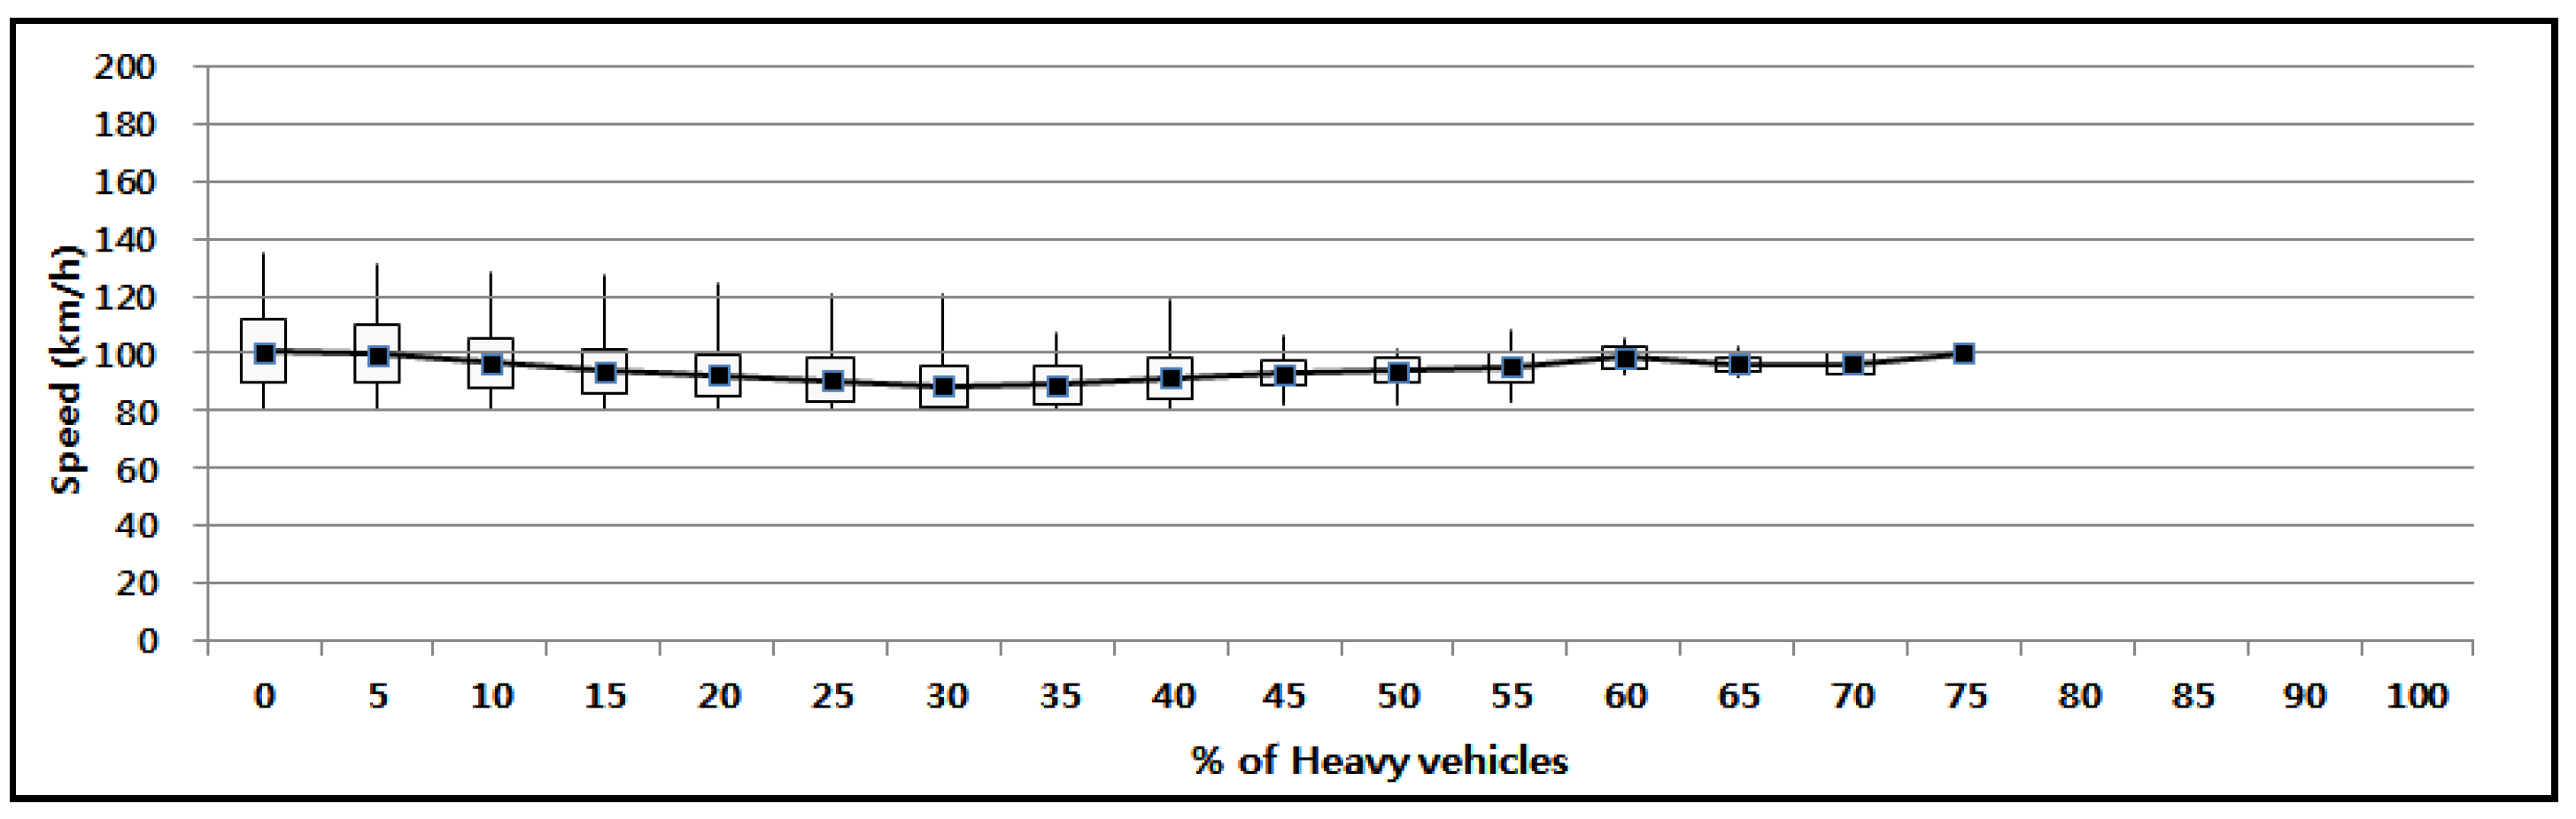
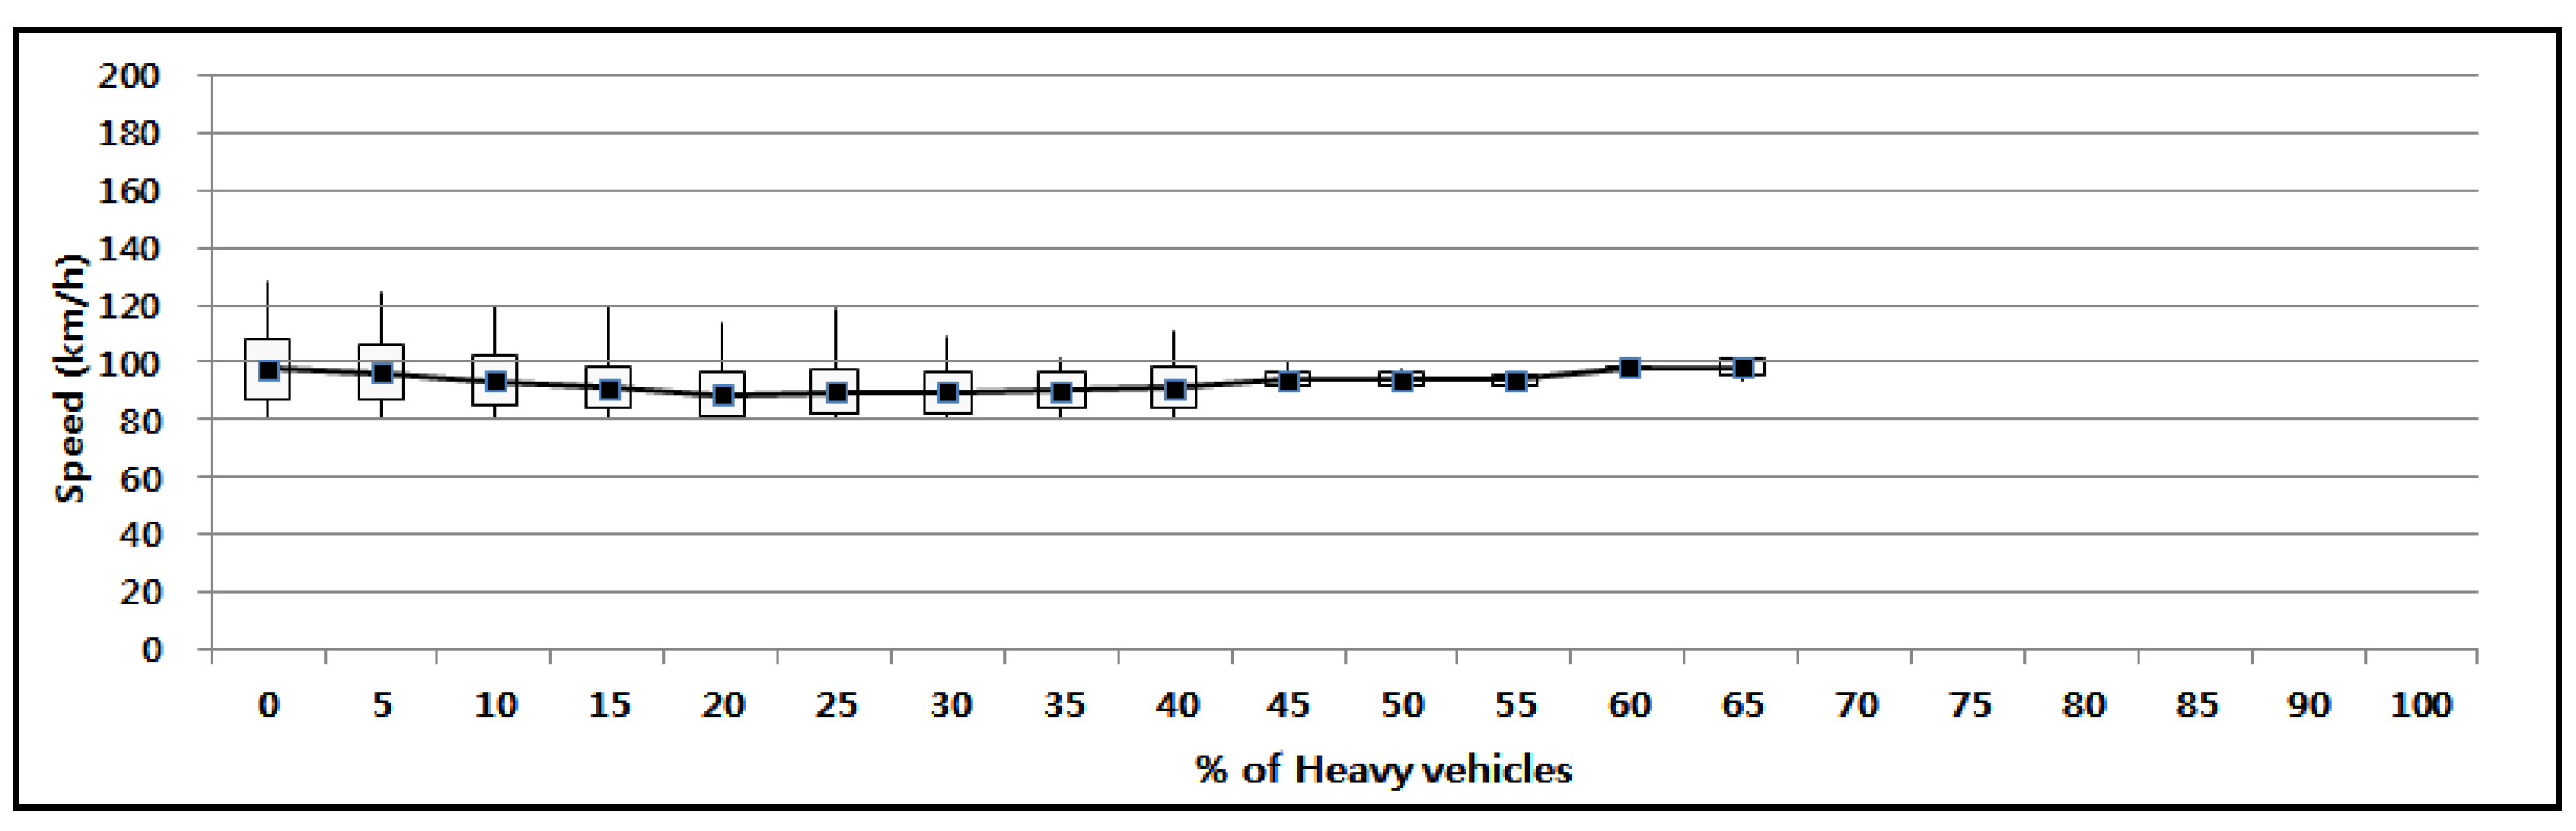
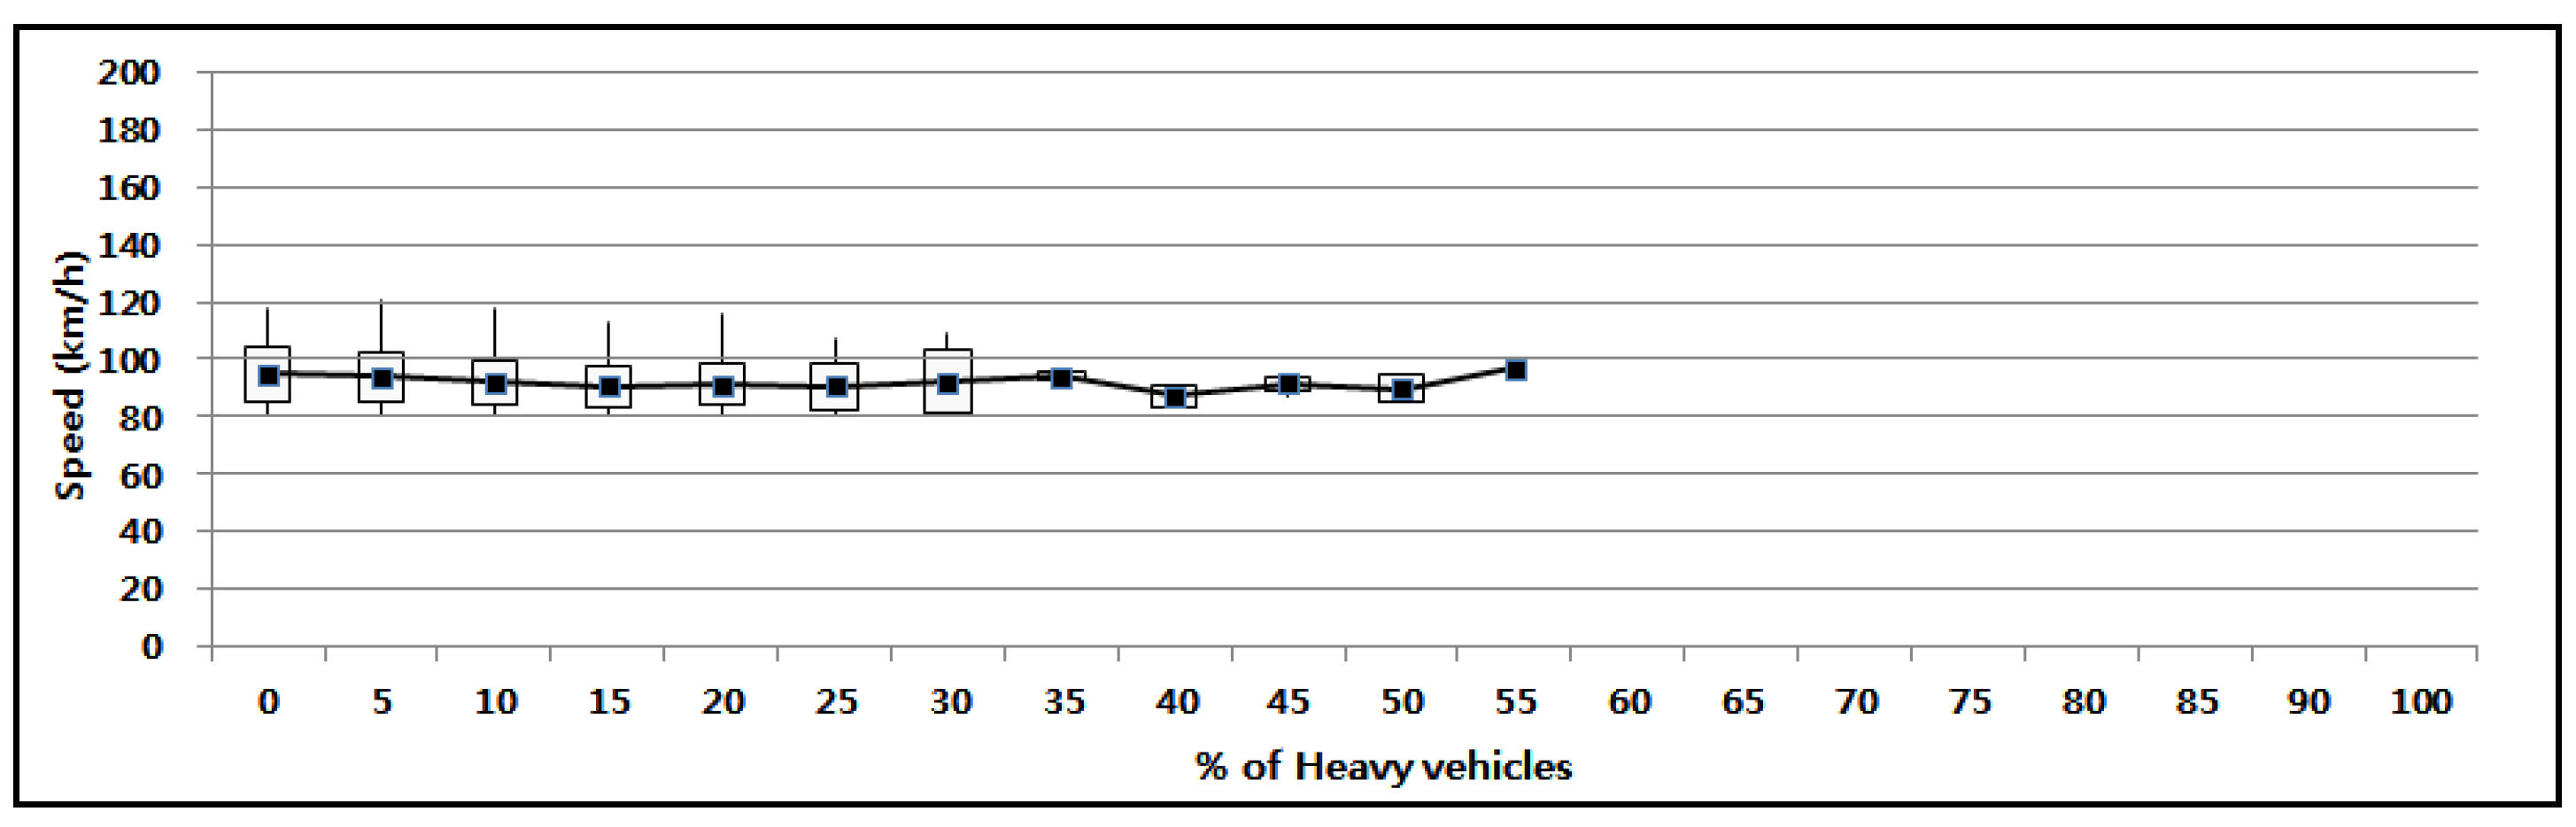
4.2. Changes According to the Proportion of Heavy Vehicles

The changes in speed based on the change in the ratio of the heavy vehicles were analyzed for the traffic flows with similar traffic volumes (or traffic flow rates). The speed variation is expressed as the difference between the maximum speed, minimum speed, average speed, and standard deviation of the speed with the legend shown in Figure 8. Using this legend, Figure 9, Figure 10, Figure 11, Figure 12, Figure 13 and Figure 14 show speed variations according to the weight of heavy vehicles for the traffic flows with similar traffic volumes. It is known that in the case of the traffic flows with similar traffic volumes, converted traffic volume increases due to the existing research results and the PCE when the proportion of heavy vehicles increases, resulting in a drop in the service level of traffic flow. Decreasing service levels of traffic flow lead to decreasing average speed and increasing density. Given these characteristics, Figure 9, Figure 10, Figure 11, Figure 12, Figure 13 and Figure 14 show a downward curve or line as the slope decreases toward the right side of the graph.
However, according to the actual data of the Seoul–Chuncheon Expressway, even though the proportion of heavy vehicles increases, the speed does not decrease significantly, but remains at a constant level. It is difficult to conclude that an increase in the proportion of heavy vehicles was not related to the decrease in service level, as speed is insensitive to changes in the service level of the road. However, it is possible to explain that the traffic flow was stabilized as the proportion of the heavy vehicles increased based on the phenomenon that the width of the speed change (the vertical line and the box size in Figure 9, Figure 10, Figure 11, Figure 12, Figure 13 and Figure 14) decreased as the proportion of the heavy vehicles increased. This is similar to the argument presented by Lee et al. [15], which is shown in the literature review section. In other words, even within the traffic flows with similar traffic volumes, as the proportion of heavy vehicles increases, the speed deviations among vehicles decrease, which leads to the stabilization of the traffic flow.

5. Impact of Heavy Vehicles on Traffic Flow

5.1. Heavy Vehicles That Determine the Characteristics of Traffic Flow

Heavy vehicles are generally larger in size than passenger cars. Therefore, it is more difficult to pass a heavy vehicle than a small vehicle. In other words, as the length of the section increases when passing, and the visibility is limited, the driver pays more attention when passing a heavy vehicle than a small car. Therefore, it is highly likely that a heavy vehicle will be located at the front of the vehicle group in a general road driving pattern in which the vehicles form a platoon of vehicles on the road.
The relationship between heavy vehicles and platoon formation has also been addressed in some previous studies [9,19]. According to Aerde and Vagar [19], the flow of vehicles in expressways is in the form of a vehicle group, and it is highly likely that a heavy vehicle will be at the front of the vehicle group. Therefore, the mean and variance of the speeds of small and heavy vehicles were analyzed, and used to interpret the results obtained from the analysis of speed changes according to the ratio of heavy vehicles. They suggested that as the proportion of heavy vehicles increases, the probability that they will become the leader of the vehicle group increases; as such, the traffic flow can be divided into two platoons centering on the heavy vehicles, leading to possible changes in the average speed of the traffic flow. Table 12 shows the probability of each vehicle type becoming the leader of a vehicle group. According to the presented values, the probability that a truck will become the leader of the vehicle group is approximately 1.8 times that of a passenger car.
The leading vehicle determines the characteristics of the traffic flow of the vehicle group. If the leading vehicle cannot be overtaken, the rest of the group will continue to move at a speed similar to that of the leading vehicle. Thus, the characteristics of traffic flow of the vehicle group become homogeneous. When a heavy vehicle is leading the vehicle group, it becomes difficult for passenger cars to get a chance to pass, so the rest of the vehicles move at the same speed and driving pattern as that of the heavy vehicle.

5.2. Effect of Heavy Vehicles on Traffic Flow

It is generally perceived that the traveling speed of a heavy vehicle is lower than that of a passenger car. However, due to an increase in driving performance of the heavy vehicles (horse power, torque, displacement, etc.), they can exhibit a driving performance which is superior, or similar, to that of a passenger car. Therefore, in a traffic flow where both heavy vehicles and passenger cars are mixed, the service level may not decrease significantly, such as a decrease in the overall speed of the traffic flow due to the effect of heavy vehicles.
As already discussed, as the probability of a heavy vehicle being positioned at the front of a vehicle group increases, the conflict between vehicles decreases. As shown in Figure 9, Figure 10, Figure 11, Figure 12, Figure 13 and Figure 14, these characteristics can appear in an actual traffic flow through a decrease in the speed variation. In other words, as the proportion of heavy vehicles increases, the speed variation (variance of speed) for each traffic flow rate decreases. Subsequently, the speed difference between the high-speed driving vehicles and the low-speed driving vehicles decreases. In this manner, heavy vehicles play a significant role in stabilizing the traffic flow, thereby reducing the risk of accidents. These results suggest that heavy vehicles can have a positive effect, unlike the existing paradigm in which the speed decreases and the effect on the traffic flow is 1.5 times or 2 times that of passenger cars, which negatively affects the service level.

6. Discussion and Conclusions

In this study, traffic data were collected for the Seoul–Chuncheon Expressway, which is a one-way, two-lane road, and the effect of heavy vehicles on traffic flow was analyzed. Although individual vehicle data should ideally be acquired and used for the analysis, there were some limitations in data collection, i.e., data were collected in 30-s cycles and used as raw data for an efficient storage and utilization of data. However, it was found that heavy vehicles had a positive effect on stabilizing traffic flows. In particular, these results had a positive effect on reducing the speed deviation of the vehicle group, which suggests that the probability of a conflict between vehicles can be reduced, so that the accident risk can be reduced when compared with traffic flows comprising only passenger cars. The conclusion that traffic safety is helpful when the speed deviation is small is also shown in the previous studies [20,21,22,23,24]. Furthermore, according to Park et al. [24], a reduction in speed variance and deviation is interpreted as stabilization of traffic flow. In addition, for stabilizing the traffic flow, when speed was decreased by 5.6 mph at Nottingham Road, England, there was a reduction of 40% in serious injuries and 30% in minor injuries. Studies conducted in Korea showed that by inducing speed reduction using a section speeding crackdown, there was a 3.2% decrease in the number of accidents per day on the West Coast Expressway and a 12.2% decrease on the Yeongdong Expressway [24]. This was achieved by speed reduction using the section speeding crackdown, as well as the decrease in speed variance and standard deviation by heavy vehicles, which is the result of this study. Thus, with effects such as stabilizing traffic flow and reducing traffic accidents, this can reasonably be interpreted as a positive intervention. Such modeling is expected to be able to follow the methodology of existing studies of heuristic verification and extended modeling studies using it [25] and traffic flow modeling [26].
This study used speed among traffic data to investigate the effect of heavy vehicles. If density measurement is possible in the future, the effect of heavy vehicles on traffic flow can be derived more accurately. Moreover, unlike in two-lane roads, the probability that the leading heavy vehicle of a vehicle group can be overtaken increases on roads with three or more lanes; thus, it may be possible to obtain results different from those obtained in this study. In particular, as there may be more conflicts between vehicles due to an increase in the possibility of overtaking, further analysis is required for traffic flows including various lanes, points, and crackdown flows.
It may not be enough to say that heavy vehicles have a positive effect on traffic flow alone. Nevertheless, as a result of analyzing the phenomena shown in the data, it was confirmed that heavy vehicles can have an effect on reducing the speed deviation of surrounding vehicles, thereby contributing to the homogenization of the traffic flow. This part was suggested as a positive effect of heavy vehicles on traffic flow. If the characteristics of low-speed and large-sized vehicles shown in this study are used, it is expected that they can be used to establish various operational strategies for traffic flow management. In addition, the contents of quantitative evaluation of the threat of heavy vehicles on surrounding vehicles or the impact on road structures should also be considered. We intend to present these contents as future research.
Furthermore, it is possible to compare the research results of the effect of platoons by heavy vehicles and platoon by connected and automated vehicles (CAV) on traffic flow after CAV is introduced. CAV causes lane changes of human-driven vehicles and forms platoons [27] that are similar to those of heavy vehicles [19]. Although the characteristics of the two vehicle types are similar in that they cause platoons, the influence of platoons caused by automobile technology development or those naturally formed by heavy vehicles could be different. Therefore, it is expected that traffic factors such as traffic flow rate and speed can be better analyzed by comparing the effects of different vehicle types on the traffic flow.

Author Contributions

Conceptualization, C.-G.R.; methodology, C.-G.R. and B.S.; formal analysis, C.-G.R.; investigation, C.-G.R. and H.J.; writing—original draft preparation, C.-G.R.; writing—review and editing, C.-G.R., H.J. and B.S. All authors have read and agreed to the published version of the manuscript.

Funding

This research was supported by research project “Development of Sustainable MaaS (Mobility as a Service) 3.0+ Technology in Rural Areas” funded by the Korea Institute of Civil Engineering and Building Technology (KICT).

Institutional Review Board Statement

Not applicable.

Informed Consent Statement

Not applicable.

Data Availability Statement

The data included in this study are available upon request by contact with the corresponding author.

Conflicts of Interest

The authors declare no conflict of interest.

References

  1. Transportation Research Board. Highway Capacity Manual 2010; Transportation Research Board of the National Academies: Washington, DC, USA, 2010. [Google Scholar]
  2. Transportation Research Board. Highway Capacity Manual, 6th ed.; Transportation Research Board of the National Academies: Washington, DC, USA, 2016. [Google Scholar]
  3. Korea Ministry of Land, Infrastructure and Transport. Korea Highway Capacity Manual; Korea Ministry of Land, Infrastructure and Transport: Sejong, Korea, 2013.
  4. Fisk, C.S. Effects of Heavy Traffic on Network Congestion. Transp. Res. Part B Meth. 1990, 24, 391–404. [Google Scholar] [CrossRef]
  5. Webster, N.; Elefteriadou, L. A Simulation Study of Truck Passenger Car Equivalents (PCE) on Basic Freeway Sections. Transp. Res. Part B Meth. 1999, 33, 323–336. [Google Scholar] [CrossRef]
  6. Al-Kaisy, A.F.; Hall, F.L.; Reisman, E.S. Developing Passenger Car Equivalents for Heavy Vehicles on Freeways during Queue Discharge Flow. Transp. Res. Part A Policy Pract. 2002, 36, 725–742. [Google Scholar] [CrossRef]
  7. Roess, R.P.; Prassas, E.S.; McShane, W.R. Traffic Engineering, Third Edition; Pearson Prentice Hall: Denver, CO, USA, 2004. [Google Scholar]
  8. Lu, P.; Zheng, Z.; Tolliver, D.; Pan, D. Measuring Passenger Car Equivalents (PCE) for Heavy Vehicle on Two Lane Highway Segments Operating Under Various Traffic Conditions. J. Adv. Transp. 2020, 2020, e6972958. [Google Scholar] [CrossRef] [Green Version]
  9. Zhou, J.; Rilett, L.; Jones, E. Assessing Passenger Car Equivalency Factors for High Truck Percentages; Nebraska Department of Transportation Research Reports; Nebraska Department of Roads: Lincoln, NE, USA, 2017.
  10. Al-Kaisy, A.; Jung, Y.; Rakha, H. Developing Passenger Car Equivalency Factors for Heavy Vehicles during Congestion. J. Transp. Eng. 2005, 131, 514–523. [Google Scholar] [CrossRef]
  11. Zhang, S.; Xing, Y.; Lu, J.; Zhang, H.M. Exploring the Influence of Truck Proportion on Freeway Traffic Safety Using Adaptive Network-Based Fuzzy Inference System. J. Adv. Transp. 2019, 2019, e3879385. [Google Scholar] [CrossRef]
  12. Chen, S.; Zhang, S.; Xing, Y.; Lu, J.; Peng, Y.; Zhang, H.M. The Impact of Truck Proportion on Traffic Safety Using Surrogate Safety Measures in China. J. Adv. Transp. 2020, 2020, e8636417. [Google Scholar] [CrossRef]
  13. Korea Ministry of Land, Infrastructure and Transport. The Development of the Traffic Monitoring System Applied by the Artificial Intelligence; Korea Institute of Civil Engineering and Building Technology: Goyang-si, Korea, 2000.
  14. Traffic Monitoring System (Table: 12 Types of Vehicles). Available online: http://www.road.re.kr/intro/intro_04.asp?pageNum=1&subNum=4 (accessed on 28 April 2021).
  15. Lee, C.; Hellinga, B.; Saccomanno, F. Evaluation of Variable Speed Limits to Improve Traffic Safety. Transp. Res. Part C Emerg. Technol. 2006, 14, 213–228. [Google Scholar] [CrossRef]
  16. Choudhary, P.; Imprialou, M.; Velaga, N.R.; Choudhary, A. Impacts of Speed Variations on Freeway Crashes by Severity and Vehicle Type. Accid. Anal. Prev. 2018, 121, 213–222. [Google Scholar] [CrossRef] [PubMed] [Green Version]
  17. Wang, X.; Zhou, Q.; Quddus, M.; Fan, T.; Fang, S. Speed, Speed Variation and Crash Relationships for Urban Arterials. Accid. Anal. Prev. 2018, 113, 236–243. [Google Scholar] [CrossRef] [PubMed] [Green Version]
  18. Garber, N.J.; Gadiraju, R. Factors Affecting Speed Variance and Its Influence on Accidents. Transp. Res. Rec. 1989, 1213, 64–71. [Google Scholar]
  19. Aerde, M.V.; Vagar, S. Capacity, Speed and Platooning Vehicle Equivalents for Two-Lane Rural Highways. Transp. Res. Rec. 1984, 58–67. [Google Scholar]
  20. Boyle, L.N.; Mannering, F. Impact of Traveler Advisory Systems on Driving Speed: Some New Evidence. Transp. Res. Part C Emerg. Technol. 2004, 12, 57–72. [Google Scholar] [CrossRef]
  21. Golob, T.F.; Recker, W.W. A Method for Relating Type of Crash to Traffic Flow Characteristics on Urban Freeways. Transp. Res. Part A Policy Pract. 2004, 38, 53–80. [Google Scholar] [CrossRef]
  22. Lee, C.; Hellinga, B.; Saccomanno, F. Real-Time Crash Prediction Model for Application to Crash Prevention in Freeway Traffic. Transp. Res. Rec. 2003, 1840, 67–77. [Google Scholar] [CrossRef]
  23. Oppe, S. The Use of Multiplicative Models for Analysis of Road Safety Data. Accid. Anal. Prev. 1979, 11, 101–115. [Google Scholar] [CrossRef]
  24. Park, J.-J.; Lee, Y.-M.; Park, J.-B.; Kang, J.-G. The Effect of Point to Point Speed Enforcement Systems on Traffic Flow Characteristics. J. Korean Soc. Transp. 2008, 26, 85–95. [Google Scholar]
  25. Zambrano-Martinez, J.L.; Calafate, C.T.; Soler, D.; Cano, J.-C. Towards Realistic Urban Traffic Experiments Using DFROUTER: Heuristic, Validation and Extensions. Sensors 2017, 17, 2921. [Google Scholar] [CrossRef] [Green Version]
  26. Hoogendoorn, S.P.; Bovy, P.H.L. State-of-the-Art of Vehicular Traffic Flow Modelling. Proc. Inst. Mech. Eng. Part I J. Syst. Control Eng. 2001, 215, 283–303. [Google Scholar] [CrossRef]
  27. Zhong, Z.; Lee, E.E.; Nejad, M.; Lee, J. Influence of CAV Clustering Strategies on Mixed Traffic Flow Characteristics: An Analysis of Vehicle Trajectory Data. Transp. Res. Part C Emerg. Technol. 2020, 115, 102611. [Google Scholar] [CrossRef] [Green Version]
Figure 1. Seoul–Chuncheon Highway and data-collection point.
Applsci 11 05520 g001
Figure 2. Examples of piezosensors.
Applsci 11 05520 g002
Figure 3. Traffic flow rate (veh/h)–speed curve (km/h).
Applsci 11 05520 g003
Figure 4. Relationship of flow rate–speed 1 (% of heavy vehicles: 0).
Applsci 11 05520 g004
Figure 5. Relationship of flow rate–speed 2 (% of heavy vehicles: 15).
Applsci 11 05520 g005
Figure 6. Relationship of flow rate–speed 3 (% of heavy vehicles: 30).
Applsci 11 05520 g006
Figure 7. Relationship of flow rate–speed 4 (% of heavy vehicles: 50).
Applsci 11 05520 g007
Figure 8. Legend of points and lines in relation figures.
Applsci 11 05520 g008
Figure 9. Relationship of ratio of heavy vehicles–speed 1 (flow rate: 0–100 veh/h/ln).
Applsci 11 05520 g009
Figure 10. Relationship of ratio of heavy vehicles–speed 2 (flow rate: 200–300 veh/h/ln).
Applsci 11 05520 g010
Figure 11. Relationship of ratio of heavy vehicles–speed 3 (flow rate: 400–500 veh/h/ln).
Applsci 11 05520 g011
Figure 12. Relationship of ratio of heavy vehicles–speed 4 (flow rate: 600–800 veh/h/ln).
Applsci 11 05520 g012
Figure 13. Relationship of ratio of heavy vehicles–speed 5 (flow rate: 800–900 veh/h/ln).
Applsci 11 05520 g013
Figure 14. Relationship of ratio of heavy vehicles–speed 5 (flow rate: ≥1000 veh/h/ln).
Applsci 11 05520 g014
Table 1. PCEs in general terrain segment.
Heavy Vehicle TypePCEs by Type of Terrain
LevelRollingMountainous
KHCM [3]Small-sized1.01.21.5
Medium-sized1.53.05.0
Full-sized2.0
HCM [1]Trucks and buses1.52.54.5
Recreational vehicles1.22.04.0
Table 2. Data collection.
Data-Collection
Period
Collection DataNumber of Data-Collection Points
August 1–19
September 1–29
Speed and volume
(according to the vehicle type (12 types))
9
Table 3. Estimated PCEs [1].
GradeLength of Grade (m)PCEs for Percent Trucks
5%15%25%
Level 0%8051.51.51.5
Upgrade 3%4021.51.51.5
8051.51.51.5
12071.51.51.5
Upgrade 6%4021.51.51.5
8053.52.52.5
12074.03.03.0
Downgrade section1.5–7.51.5–5.5
Table 4. PCEs for semi-trailers with five axles [5].
GradeLength of Grade (m)Flow Rate (vphpl) and Percentage of Trucks
500100015002000
51525515255152551525
Level 0%8051.01.01.01.01.01.01.01.01.01.51.52.0
Upgrade 3%4021.01.01.01.01.01.01.01.01.02.03.03.0
8051.01.01.01.51.51.51.51.51.02.52.51.5
12071.01.01.01.51.51.52.02.01.02.52.0
Upgrade 6%4021.01.01.01.51.51.51.52.02.0
8051.51.51.52.02.02.03.02.01.5
12072.02.02.03.52.52.04.02.51.5
Downgrade section1.01.01.01.01.01.01.01.01.01.01.01.0
Table 5. Reliability of piezosensors [13].
MeasurementReliability
Speed measurement errorLess than ±1.0%
Wheelbase measurement error
(for classification of vehicle type)
Less than ±5 cm
Vehicle-length measurement error
(for classification of vehicle type)
Less than ±2.5%
Table 6. Row data format.
DATETIMEDEVICE_IDE_VOL 1_1E_VOL 1_2 E_VOL 1_12
09/08000000060VD.....G0000
09/08000030060VD.....G0100
09/08000100060VD.....G0000
Table 7. Data processing procedures.
DATETIMEDEVICE_IDE_VOL 1_1E_SPD 1_1 (kph)
09/08000000060VD.....G000
09/08000030060VD.....G01124
09/08000100060VD.....G000
09/08000130060VD.....G01114
09/08000200060VD.....G01104
09/08000230060VD.....G000
09/08000300060VD.....G02104
09/08000330060VD.....G000
09/08000400060VD.....G01110
09/08000430060VD.....G01113
Volume∑(E_VOL 1_1) = 7
Average Speed∑(E_VOL 1_1 × E_SPD 1_1)/∑(E_VOL 1_1) = 110.4
Table 8. Classification and application of vehicle type [14].
ClassificationVehicle TypeExample VehiclesApplication
12-axis 1 unitPassenger carSmall
22-axis 1 unitBuses with ≥16 seatsMedium
32-axis 1 unitCargo trucks (≥1–2.5 tons)Small
42-axis 1 unitCargo trucks (≥2.5–5 tons)Medium
53-axis 1 unitCargo trucks (>5 tons)
64-axis 1 unitCargo trucks (tank lorry, dump, etc.)
75-axis 1 unitCargo trucks (tank lorry, dump, etc.)
84-axis 2 unitSemi-trailers (flatbed semi-, tank lorry-trailers)Large
94-axis 2 unitFull trailers
105-axis 2 unitSemi-trailers (flatbed semi-trailers, etc.)
115-axis 2 unitFull-trailers (cargo full-trailers, etc.)
126-axis 2 unitSemi-trailers (flatbed semi-trailers, etc.)
Table 9. Maximum flow rate and critical speed by vehicle classification.
ClassificationMaximum Flow RateCritical Speed
Small2148 veh/h/ln79.8 km/h
Mixed flow (Small + Medium)2052 veh/h/ln86.6 km/h
Mixed flow (Small + Large)2100 veh/h/ln76.7 km/h
All vehicles2028 veh/h/ln74.0 km/h
Table 10. Characteristics of speed data.
ClassificationSmallMiddleLarge
Average speed (km/h)105.497.295.1
Standard deviation (km/h)14.59.912.5
Variance211.798.9157.3
Count (vehicles)
(Proportion; %)
639,521
(79.1%)
113,811
(14.1%)
55,286
(6.8%)
Table 11. Relationship of flow rate–speed by the proportion of heavy vehicles.
% of HVRegression Model (First-Order Perimeter)R2Number of Datasets
0 v = −1.137 q + 109.340.932117,338
15 v = −0.012 q + 102.390.92746,734
30 v = −0.971 q + 97.660.7938590
50 v = −0.155 q + 94.460.2334433
Table 12. Vehicle type ratio of platoon’s leader [19].
Vehicle TypeRatio
Original aNormalized b
Total vehicles1.0001.056
Passenger cars0.9461.000
Trucks1.7161.813
Recreational1.3861.464
Other1.0231.082
a Original ratio = percentage of leads by vehicle type divided by percentage of total count by vehicle type; b Normalized ratio = original ratio for vehicle type divided by original ratio for passenger cars.
Publisher’s Note: MDPI stays neutral with regard to jurisdictional claims in published maps and institutional affiliations.

