Abstract
The mass properties of a vehicle play a decisive role in its dynamics and characteristics and are fundamental for vehicle dynamics models and controllers. These values are not yet known for the vehicle class of the ultra-light velomobiles and similar multi-track bicycle vehicles. In the future, however, such vehicles could play a role in reducing the CO2 emissions generated by individual transportation. As a basis for vehicle dynamics modeling, accident reconstruction, and controller development for this vehicle class, this paper investigated ranges of mass properties and their influence on vehicle stability considering driver influence. In total, 13 vehicles (10 velomobiles and 3 trikes) were examined using different experimental setups. It was shown that most vehicles exhibited understeering behavior based on the center of gravity position and calculations of the static stability factor showed significantly lower rollover stability compared with conventional vehicles. The measured moments of inertia were used to develop and examine different approximation approaches for the yaw moment of inertia using conventional approaches from the passenger car sector and stepwise regression. This created the basis for parameter estimation from easily measurable vehicle parameters and provided the possibility to generate realistic parameter sets for vehicle dynamic models. Existing tests do not consider the influence of driver movements, such as pedaling movements or possible inclination of the upper body. This offers the potential for further investigations of the dynamic influences on the investigated variables.
1. Introduction
In order to limit global warming, it is necessary to reduce the CO2 emissions produced by traffic. Bicycles and vehicle concepts based on them can serve as an important contribution to this objective [1,2]. A special type of bicycle vehicle is the velomobile. Velomobiles are recumbent bicycles with an aerodynamic and weather-protecting shell, and can be an alternative to the car for medium-distance travel, such as daily commutes to work [3]. Currently, the typically three-wheeled velomobiles and trikes are not very common. It is estimated that in 2017 there were about 1500 velomobiles in Germany and 7000 velomobiles in Europe generally [4,5]. There are no specific numbers for trikes and other multi-track bikes. Even though these vehicles are not very widespread at this time, it can be expected that the decarbonization of individual transport will lead to a larger number of such bicycle vehicles on the roads. Due to the low distribution, scientific studies on velomobiles are almost completely nonexistent. However, since velomobiles in particular reach high speeds of 50 km/h to 60 km/h on flat roads, knowledge of driving dynamics properties is essential for safe vehicle design and optimization of driving safety. In order to be able to carry out corresponding investigations using simulation models, it is necessary to know certain basic parameters of the vehicles. These include in, particular, mass data such as the center of gravity position and moments of inertia. The mass properties have a decisive influence on the vehicle dynamic behavior, such as the steering response and stationary steering characteristic or rollover probability, and thus directly affect the driving stability of a vehicle [6]. The longitudinal position of the center of gravity has a major influence on the self-steering behavior and thus on lateral stability. Oversteering behavior, favored by an unfavorable center of gravity position, can lead to the loss of vehicle control and thus to serious accidents. The height of the center of gravity significantly influences wheel-load transfer during longitudinal and lateral dynamic maneuvers and has a strong impact on rollover stability. Knowledge of the mass properties is thus required to make considerations on active and passive safety measures as summarized in source [7]. Currently, most of these values are hardly known for the vehicles under consideration. Therefore, there is a lack of basis for modeling, accident reconstruction, and controller development for this vehicle class. Examples of both vehicle categories (trikes and velomobiles) are shown in Figure 1.
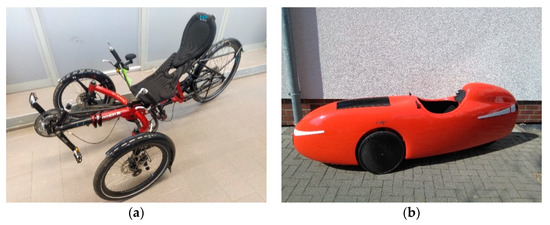
Figure 1.
(a) Trike; (b) Velomobile.
Both vehicle types are usually three-wheeled with two wheels at the front axle. In the context of this work, such vehicles are referred to as 2F1R according to the wheel configuration. A common name for this configuration is the tadpole configuration. The opposite configuration (one wheel in front, two in the back, 1F2R) is called the delta configuration. The position of the center of gravity and the vehicle inertia have a significant influence on the driving dynamics behavior and are required as basic parameters in many driving dynamics models. In the passenger car sector, the investigations of the NHTSA in particular form an essential basis for modelling and parameter estimation [8,9]. The measured values were used by Garrot et al. [10] to develop approximation formulae for the moments of inertia. In source [11], various approximation formulae were examined on the basis of the measured values with regard to their accuracy, leading to specified sets of inertia approximation formulae for different types of passenger cars. In addition to the classic test bench measurements, methods that enabled online calculation of the mass parameters while the vehicle is in motion were also used. Rozyn and Zhang [12], Gong et al. [13], and Deng et al. [14] presented methods for the online calculation of the sprung mass inertial properties by a combination of measurements of sprung mass responses to road inputs and simplified vehicle models. These methods require a certain level of vehicle-inbuilt sensor technology, which is usually available in conventional vehicles. Since these sensors are missing in the vehicles considered in this research, an application of these methods was not possible. Studies of the center of gravity locations of human-powered vehicles can be found in the research area of wheelchairs and similar vehicles. Cooper [15] presented a steering system for the wheelchair that is based on shifting the center of gravity. Extensive studies were carried out by Wieczorek et al. [16,17,18,19,20]. Based on anthropometric models and photographic analysis of movement, Wieczorek et al. [16] studied the influence of rider movement on the center of gravity of a wheelchair-rider system. In sources [17,18], a test bench was presented that allowed the determination of the center of gravity of a wheelchair-rider system, taking into account dynamic rider movements and the tilt of the wheelchair. The methodology described therein thus also allowed the determination of range values for the change in the center of gravity depending on the driver’s movement. This method was used in source [19] to investigate the deviation of the driver center of gravity from the wheelchair trajectory considering different driving maneuvers. In source [20], the influence of center of gravity motion on rolling resistance and the required propulsive force for a wheelchair were discussed. In addition to measurements, mass data were often determined from CAD models or approximated based on simple basic bodies, as in sources [21,22,23].
As has been shown, there is already a large number of studies on the mass properties of conventional vehicles as well as of some human-powered vehicles. This is not yet the case for a large number of recumbent bicycles and especially for velomobiles. The aim of this research work was, therefore, to describe the range of mass properties for the considered class of human-powered vehicles as a basis for vehicle dynamics simulations and the development of assistance systems. For this purpose, wheel-load measurements were used to determine the center of gravity positions of the vehicles considering the static driver influence. Measurements of the moment of inertia were performed on a rotational inertia test bench. Finally, the results of the inertia measurements were used to determine approximation models for yaw inertia. In summary, this research work yielded ranges of parameters relevant to vehicle dynamics for the vehicle class under investigation as input variables for future studies on vehicle dynamic models, sensitivity analyses, and controller development.
2. Materials and Methods
2.1. Center of Gravity Measurement
The procedure for the measurements of the center of gravity (COG) position corresponds to typical procedures for motor vehicles. By measuring all wheel loads in the horizontal position, the longitudinal (lf) and lateral (∆y) center of gravity position was determined. The front axle of the vehicle was then lifted. The resulting wheel-load shift was used to determine the vehicle’s center of gravity height. The experimental setup for determining the center of gravity position is shown in Figure 2.
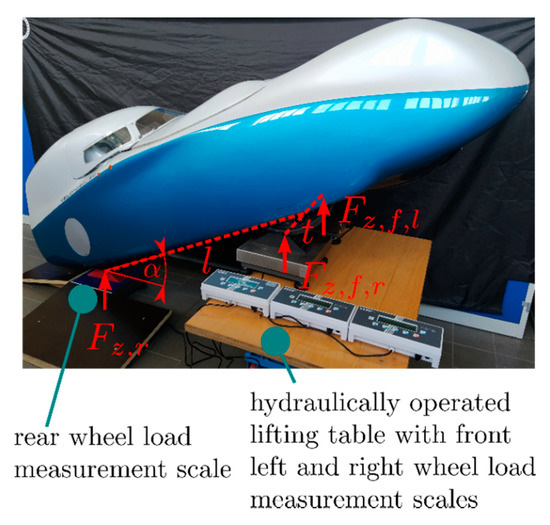
Figure 2.
Test arrangement for determining the position of the center of gravity based on the wheel loads , wheel base , track width and inclination angle .
The determination of the COG position of the vehicle was based on the equilibrium of forces and moments shown in Figure 3. The COG position parameters lf, lr, ∆y and hz can thus be determined using Equations (1)–(4).
with:
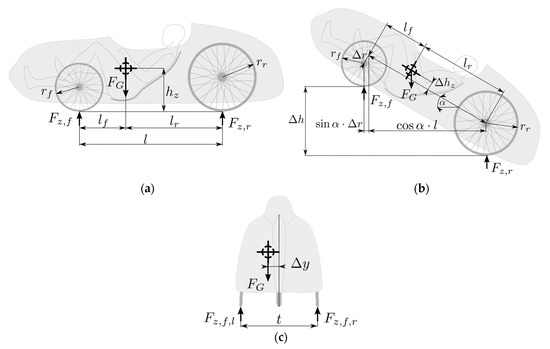
Figure 3.
(a) Horizontal equilibrium for determination of the COG longitudinal position lf, lr; (b) Tilted vehicle for the determination of COG height hz; (c) Horizontal equilibrium for the determination of the COG lateral position ∆y.
- —Distance of the COG to front/rear axle,
- —Vertical force or wheel load at the front/rear axle,
- —Vertical force or wheel load at the front left/right wheel,
- —Wheelbase,
- —Track width,
- —Total mass,
- —Total weight force,
- —COG height above ground,
- —COG height above rear wheel center,
- —Lateral deviation of the COG from the vehicle’s center plane,
- —Inclination angle,
- —Difference in wheel radius rear to front,
- —Rear wheel radius.
The wheel loads were measured with industrial scales (resolution 2 g, linearity 6 g). For each measurement, the weight values were averaged in a time interval of 5 s with an internal sampling rate of 10 Hz. The display value of the scales is the average value over the measurement interval. There was no access to the time-dependent values with the measuring system used. The driver did not move during this time. For all experiments, a sitting position as shown in Figure 4 was used. The right leg was stretched out and the left leg was bent. Possible changes of the COG position due to movements of the driver during the ride, as they were investigated for wheelchairs in [17], were not considered as the measurement system only supported static measurements. Investigations regarding the influences of driver movement might be an interesting consideration for further studies.
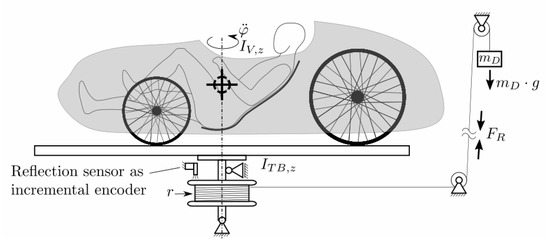
Figure 4.
Rotational inertia test bench.
2.2. Moment of Inertia Measurement
The focus of the investigations concerning the moments of inertia was the yaw moment of inertia which is needed for most vehicle lateral dynamic models such as single track models. The rotational test bench shown schematically in Figure 4 was developed for the determination of this value. The test bench and test object were driven via a rope drum by a driving mass . A photoelectric switch served as incremental encoder for the angle of rotation measurements. Neglecting frictional influences and the masses and inertias of rope and deflection pulleys, the equilibrium shown in Equation (5) resulted for the system.
The inertia is composed of the partial inertias of test bench () and vehicle or test object () and can be determined from the measured angular acceleration considering the drum radius and the drive mass . Tests with a geometrically defined test object have shown that frictional influences lead to an overestimation of the moment of inertia by about 10%. The effective driving torque is reduced by a frictional torque . As the measurement setup did not allow a direct measurement of the friction torque, it had to be estimated from a spin-out test. Considering the friction torque, Equation (6) applies to the driven test bench.
The spin-out tests were performed without drive mass and rope so that their frictional components were not included. It was assumed that they were negligible compared with the friction of the test bench bearings. Equation (7), therefore, applies to the spin-out test. It was assumed that the frictional torque would remain constant during driving and spin-out. By decoupling the drive mass, a spin-out test directly followed a driven test in each case.
Equations (5) and (6) can be used to obtain Equation (8) for determining the combined moment of inertia of the vehicle and test bench.
In cases where the center of gravity could not be positioned directly above the test bench axis of rotation due to spatial restrictions, the Steiner component was also taken into account. To determine the angular accelerations and , the measured angular-time curve was fitted to a second-order polynomial using a least-squares method. At higher rotation speeds, the nonlinear influence of the air/fan resistance increased strongly. The simplification to a constant friction torque was therefore only valid for low speeds. Each test was repeated five times. The mean values and were used to calculate the rotational inertia of the entire setup according to Equation (8).
Based on tests with various geometrically determined test bodies, the approach presented above showed errors of about 2% of the theoretical value for different test bodies.
2.3. Vehicle Lateral and Rollover Stability
The vehicle’s center of gravity has a particularly strong influence on its self-steering behavior. A basic distinction can be made between over-steering (unstable) and understeering (stable) driving behavior [24]. An oversteering vehicle is characterized by the fact that above a critical velocity the yaw amplification factor becomes infinitely large, so that small steering movements cause large and uncontrollable vehicle reactions. Based on a single track model as described in [25], the critical velocity can be calculated according to Equation (10) from the understeer gradient given in Equation (9). Equation (11) provides the characteristic velocity for understeering vehicles. and are the cornering stiffnesses of the rear and front axles.
According to Huston [26], stable driving behavior for a 2F1R-vehicle requires the COG to be in the front third of the vehicle (under the assumption of identical tire properties on the front and rear axles and neglection of longitudinal forces). For a four-wheeled (4W) vehicle, the COG must be in the front half. In addition to driving stability and steering sensitivity, the COG position also influences a vehicle’s rollover stability in particular. The static stability factor (SSF) can be used as a measure of rollover stability [27]. The SSF describes the maximum possible lateral acceleration of a vehicle, i.e., the lateral acceleration at which the wheel on the inside of the curve lifts off. Research shows that SSF is highly suitable as a measure of rollover stability and correlates with actual rollover accident occurrence for passenger cars [28]. According to Huston [26], the SSF for a three-wheeled vehicle in the tadpole configuration can be calculated according to Equation (12) with the maximum lateral acceleration , the gravitational constant g, the track width on the front axle tf, COG height hz and COG position lr, and wheelbase l. Influences of the wheel suspension are neglected for the SSF.
The static stability factor of a four-wheeled vehicle with different track widths on front (tf) and rear axle (tr) can be calculated according to Equation (13). In the case where tr = 0, Equation (12) is again obtained for the 2F1R vehicle. A derivation of Equation (13) can be found in Appendix A.
2.4. Vehicle and Driver Data
The measurements of the individual vehicles were performed at different times and with a larger or smaller number of different drivers depending on the duration of vehicle availability and the availability of the test persons. The test persons were selected in such a way that a wide range of drivers was achieved. Due to restrictions on the available test drivers, the spectrum was shifted towards male test subjects which mostly fell within the range of normal weight. Basic driver data is given in Table 1. All subjects provided their informed consent for inclusion before they participated in the study. The study was conducted in accordance with the Declaration of Helsinki, and the protocol was approved by the Ethics Committee of Ostfalia University of Applied Sciences (Project identification code 2021/1).

Table 1.
Driver data.
A total of 13 different vehicles were used for the experiments. Of these, ten were velomobiles and three were trikes. With the exception of a four-wheeled vehicle, all vehicles were three-wheeled with two wheels on the front axle (2F1R). Basic vehicle data can is shown in Table 2.

Table 2.
Vehicle data.
Table 3 provides an overview of the measured driver-vehicle combinations. In addition to the specified combinations, each vehicle was also measured empty. The aim of the investigations was to map the range of vehicle parameters and not to investigate the influence of a specific driver in different vehicles. Therefore, care was taken to measure each vehicle with drivers of high differences in stature, but not to measure the same drivers in all vehicles. During the tests, it was not possible to ensure that each vehicle could also be measured with drivers of each gender.

Table 3.
Measured vehicle-driver combinations.
3. Results
3.1. Longitudinal Center of Gravity and Lateral Stability
Figure 5 shows the determined longitudinal (lf) and lateral (∆y) positions of the COG for all vehicle driver combinations. The individual measured values are listed in Appendix B. Since the movements of the driver could not be considered with the setup shown, the center of gravity determined represents only one point of a possible range of center of gravity positions depending on the driver’s movement. Studies such as [17] could be used in the future to determine the influence of motion on the center of gravity position for the vehicles considered herein in more detail.
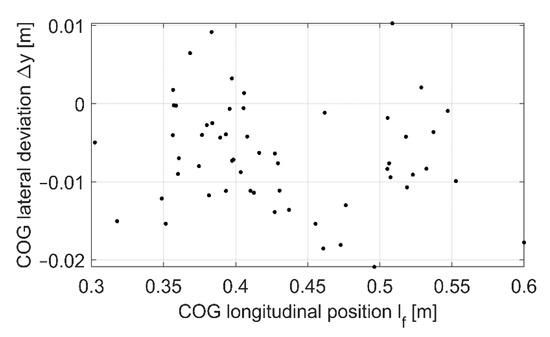
Figure 5.
Measurement results for the COG longitudinal and lateral positions for all vehicles.
As can be seen in Figure 5, the center of gravity position in the longitudinal direction of the vehicle showed a high degree of dispersion, as expected, due to the design differences in seat position and wheelbase of the various vehicles. When considering the lateral center of gravity position, only minor deviations of the center of gravity from the center plane of the vehicle were observed under the static conditions of the test. The lateral center of gravity position tended toward negative values, which corresponds to a shift of the center of gravity toward the right side of the vehicle. This was caused by the drive components, such as chains and sprockets, which typically run on the right side of the vehicle.
Figure 6 shows the determined longitudinal positions of the COG (lf) in relation to the wheel base l. In all vehicles, the COG was in the front half of the vehicle. The influence of the driver on the COG varied from vehicle to vehicle. This was partly due to the various options for adapting to the driver. Depending on the vehicle, this was done by adjusting the seat (strong influence on COG), adjusting the crankset (weak influence) or a combination of both. The empty mass also had an impact. The greater the empty mass of the vehicle, the less the effect of changes of the driver and their seat position.
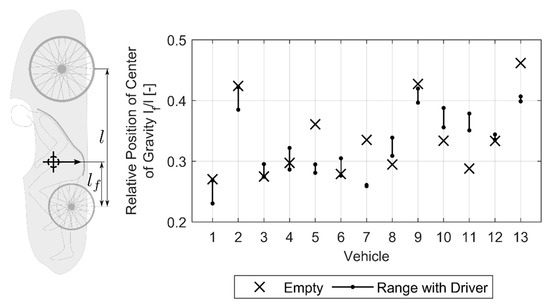
Figure 6.
Measurement results for the COG longitudinal position in relation to the wheelbase for the different vehicles.
As mentioned, the center of gravity must be in the front third of a 2F1R vehicle for stable handling. As shown in Figure 6, not all vehicles met this stability criterion. Vehicles 1 to 7 were in the stable range (note that vehicle 2 had 4 wheels and was therefore stable in a wider range). Vehicle 4 was only just in the stable range, so unfavorable payloads could also result in an oversteering driving behavior. Similarly, the longitudinal COG position of vehicle 8 might have been below or above the stability limit, depending on the driver, so oversteering behavior might have also resulted here. The oversteering vehicles might have become unstable above the critical speed. Table 4 provides the understeer coefficient and ranges of the characteristic or critical speed for the different vehicle combinations using Equations (10) and (11). The cornering stiffness curve provided in Appendix C was used for the calculation. The curve was based on measurements of a bicycle tire under different wheel loads on a real road surface. It was assumed that the vehicles had the same tires on the front and rear axle. Equations (10) and (11) show that characteristic and critical speeds are inversely proportional to the understeer gradient . Thus, a small understeer gradient results in high values of critical or characteristic velocity. For the vehicles investigated herein, there are predominantly very low absolute values of the understeer gradients and thus little influence of the lateral acceleration on the steering angle demand. For this reason, both the characteristic and critical velocities were well outside the range of velocities that the vehicles under consideration can achieve.

Table 4.
Ranges of critical and characteristic velocity.
In the passenger car sector, an understeering behavior is desired according to [24,29]. Typical values of understeer gradients related to the wheel steering angle are in the range of 4 × 10⁻³ rad/(m/s2) ([29], 2–9 × 10⁻³ rad/(m/s2) in [24]). For the vehicles considered herein, an understeering design was not always present. The values determined for the understeer gradient were, in most cases, an order of magnitude smaller than for passenger cars and much closer to a neutral steering design. During cornering, a wheel-load transfer in a 2F1R vehicle occurrs only on the front axle. A reduction in the effective cornering stiffness at the front axle follows from the degressive characteristic of the cornering stiffness over wheel-load curve. The cornering stiffness of the rear axle remains constant. The vehicles, therefore, become increasingly understeering with more lateral acceleration. Vehicles with a slightly oversteering basic design thus could also understeer depending on lateral acceleration.
3.2. Center of Gravity Height and Rollover Stability
Figure 7a shows the range of detected CG heights for the different vehicles. The SSFs derived from this according to Equations (12) and (13) are shown in Figure 7b. With regard to COG height, there are conflicting goals in vehicle development. To achieve a small frontal area for aerodynamics and high rollover stability, the COG should be as low as possible. This usually means low vehicle height and seating position, which limits visibility of these vehicles behind obstacles or other road users. The low seating position also restricts the driver’s own view.
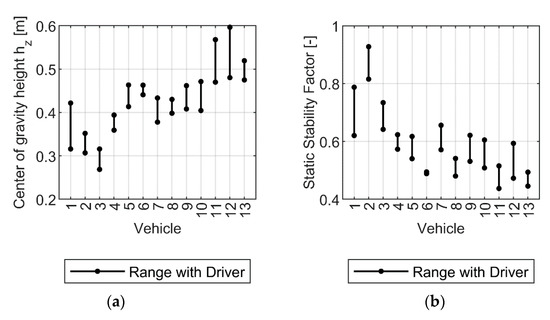
Figure 7.
(a) Center of gravity height (b) Calculated static stability factor.
The observed COG heights for the velomobiles (vehicles 1–10) were in the range of 0.28 m to 0.47 m. According to the data in [30], the COG heights for passenger cars (sedans) typically range from about 0.5 m to 0.58 m. Velomobiles, therefore, showed significantly lower center of gravity heights. The COG heights of the three trikes (vehicles 11–13) were in a comparable range to those of passenger cars. Despite low center of gravity, no three-wheeled vehicle achieved a static stability factor above 0.8 due to narrow track width and three-wheeled chassis. Most driver-vehicle combinations were still well below this value, in the range between 0.4 and 0.7. The average SSF (mean value of the mean values per vehicle) was 0.59 (SD: 0.11). The values determined for the SSF corresponded approximately to values for heavy goods vehicles [31,32]. For passenger cars, values in the range of around 1.4 are common (average value of new American models in 2003 according to [33]). Values lower than one are very uncommon according to [33]. The NCAP rollover rating, which was based solely on the SSF until 2004, provides the worst possible rating of one star for SSFs lower than 1.04 [28].
The maximum achievable lateral acceleration during driving depends on the coefficient of friction µ between road surface and tire. As a simplification, it can be assumed that the maximum achievable lateral acceleration due to tire forces is limited by the coefficient of friction in accordance with Equation (14).
As long as the static stability factor is less than µ, the lateral acceleration limit for vehicle rollover is below the lateral acceleration limit for skidding. Since the observed SSF values were below the usual friction values for tire-road contact, an imminent risk of tipping of these vehicles can be assumed on dry roads. In many vehicles, the SSF is so low that, even with reduced coefficients of friction, the roll-over limit is likely to be reached earlier than the maximum traction of the tires.
3.3. Inertia Measurements
Figure 8 shows the results of the inertia measurements. The underlying measurement data are listed in Appendix B. The determined inertias for the vehicles including the driver were in a range between 19 kgm2 and 43 kgm2 for the velomobiles. Compared with the velomobiles, trikes had a lower inertia of about 12 kgm2 to 23 kgm2. The observed standard deviations in the vehicle measurements were in the range of 1% to 4% (mean 2.7%) of the measured value.
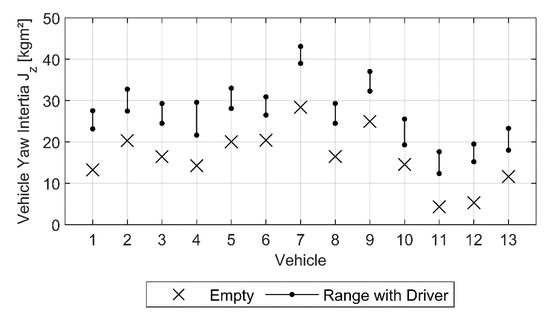
Figure 8.
Yaw inertia measurement results.
A comparability of the determined values with other vehicle types was achieved via the radius of inertia (Equation (15)) and the related radius of inertia (Equation (16)). The radius of inertia provides information about the mass distribution or compactness of the mass. A small value indicated a higher mass concentration at the COG. Since vehicles with larger wheelbases usually have larger radii of inertia, a relativization can be made using the related radius of inertia.
The radius of inertia and the related radius of inertia of the vehicles are shown in Figure 9. The radii of inertia for velomobiles were typically in the range of 0.44 m to 0.55 m except for vehicle 7, which showed slightly higher values. Trikes were below this range with values between 0.36 m and 0.43 m. The wheelbase-related radii of inertia ranged from 0.32 to 0.42, whereby the lower values were more typical of trikes and the medium and higher values were more typical of velomobiles. Values for wheelbase-related radii of inertia for passenger cars are given as 0.43 to 0.53 by [24]. A smaller related radius of inertia essentially indicates higher yaw agility of the vehicles in comparison with passenger cars (neglecting e.g., the tire characteristics).
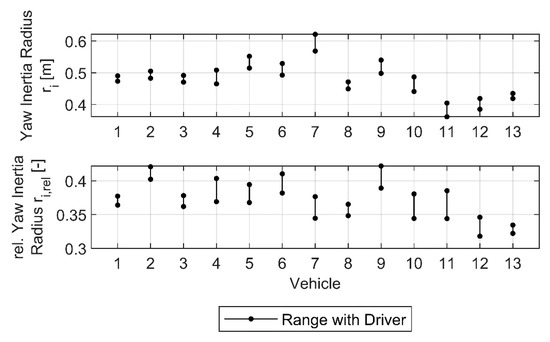
Figure 9.
Yaw inertia radius (top) and related yaw inertia radius (bottom) of the vehicles.
Figure 10 shows the relative shares of the vehicle empty mass in the total mass and the vehicle empty moment of inertia in the total moment of inertia. According to the measurements, the vehicle accounted for about 18% to 40% of the total mass of the vehicle-driver combination. Due to the electric drive, the heavy vehicle 9 had a slightly higher mass ratio for light drivers. The vehicle mass was, in any case, lower than the mass of the driver. In contrast to mass, inertia showed a much larger relative influence on the vehicle. The shares of vehicle inertia in the total inertia ranged between 48% and 78% for velomobiles and between 25% and 35% for the trikes without electric drive (vehicles 11 and 12). So while the empty vehicle exerted less influence on the mass, the inertia was more influenced by the vehicle. Therefore, it seems possible to significantly influence the total moment of inertia of the vehicle-driver combination by changes of the vehicle design for velomobiles.
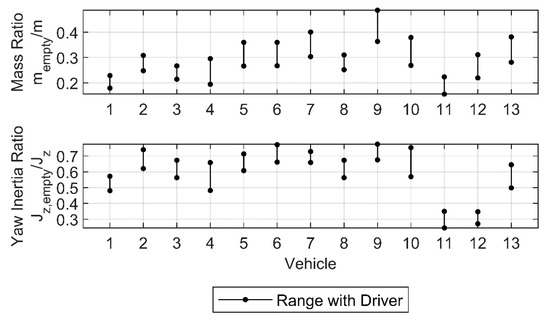
Figure 10.
Mass ratio (top) and yaw inertia ratio (bottom) between empty vehicles and vehicles with drivers.
3.4. Inertia Estimation
3.4.1. Inertia Estimation Based on Correlation Analysis and Conventional Approaches
The inertia data obtained was used to create approximations for the determination of the moment of inertia. The background to this was that most of the other vehicle parameters required for vehicle dynamics models (e.g., single-track models) can be determined more easily. The determination of the vehicle inertia, however, is associated with greater experimental effort and special test benches. The aim of this approximation formula was to enable an estimation of the moment of inertia on the basis of vehicle parameters that could be measured easily for the purpose of model building, simulation, crash analysis, and controller development. To determine the main factors influencing the inertia, a correlation analysis was carried out first. The correlation analysis was performed for a total of three different input sets. These groups were: only velomobiles (vehicles 1–10), only trikes (vehicles 11–13), and all vehicles. Correlation analysis is only suitable for determining linear dependencies. To prevent a bias towards vehicles for which a larger number of measurements had been taken, a maximum of three measurements were considered for each vehicle. The measurements of the lightest driver, the heaviest driver, and the driver closest to the mean value of the two were used. The results of the correlation analysis are shown in Table 5. Parameters with a high correlation coefficient and a low p-value (<0.05) showed a significant influence on yaw inertia.

Table 5.
Correlation coefficients and p-values regarding the yaw inertia.
Across all vehicle groups, the correlation analysis showed a significance of the following parameters: wheelbase, total length, empty mass, and total mass. For the group of all vehicles, there also appeared to be a negative weaker correlation with respect to track width. This correlation was not causally traceable and could be attributed to superimposition by other effects. It can be seen, that in some of the vehicles, long wheelbases occurred with short track widths. This resulted in a non-causal correlation between short track widths and high inertias. For driver mass, the analysis showed no significant correlation. Looking at the individual values of each vehicle, it can nevertheless be seen that larger driver masses generally led to greater inertias. Therefore, a partial correlation analysis was performed for the group of all vehicles to detect superposition effects and masked correlations for selected variables. In partial correlation analysis, the individual effects of certain variables were determined by removing the expected effects of the control variables. The target variable continued to be yaw inertia. Table 6 shows the results of the partial correlation analysis.

Table 6.
Partial correlation coefficients and p-values.
With the wheelbase as a control variable, there was no longer a significant correlation for the track width based on the partial correlation analysis. The previously recognized correlation was therefore due to overlaps with effects of the wheelbase. The influence of the distance of COG to rear axle lr was also an effect of the dependence on wheelbase and no longer showed a significant influence on inertia. For the driver’s mass, on the other hand, there was a significant influence on inertia when the empty mass was used as a control variable. For a single vehicle, a higher driver mass therefore indicated an increase in inertia, in accordance with the expectations. In the correlation analysis, this effect was masked by other relationships. Therefore, for the approximation of the moment of inertia, the parameters wheelbase, overall length, empty mass, and driver mass were mainly taken into account.
Table 7 provides some approaches from the passenger car sector as a starting point for the definition of approximation formulae.

Table 7.
Formulae for estimating the yaw moments of inertia of passenger cars.
Based on the existing equations from the passenger car sector and taking into account the findings from the correlation analysis, the mathematical models provided in Table 8 were examined for their suitability to represent an approximation formula for the yaw moment of inertia. To keep the approximation formulae simple and avoid overfitting, the number of parameters for the equations was limited to two. Table 9 shows the fitted parameters for the different groups and models.

Table 8.
Yaw inertia approximation models and results. Values in parentheses apply to the velomobiles without the four-wheeled vehicle.

Table 9.
Parameter values (for the purpose of simplicity, the unit of the respective parameters is not displayed, SI units apply to all calculations). Values in parentheses apply to the velomobiles without the four-wheeled vehicle.
As can be seen from Table 8, the different vehicle groups can be described with the different approximation models to varying degrees. For trikes, the models 2, 3, and 5 provided good approximations. Model 3 was also the best choice if all vehicles were considered together. The calculated coefficient c1 was about half as large as for passenger cars. For velomobiles, model 5 provided good approximation results.
3.4.2. Stepwise Regression
In addition to manual definition, stepwise regression is an algorithmic approach for defining approximation formulae. Starting from a basic model that contains variables and interactions up to a certain degree, variables that do not contribute significantly to the accuracy of the description are removed. For the considerations of a model that contains all variables, their powers up to the third degree and interactions up to the third degree (e.g., x1, x12, x13, x12, x12 x2, x1 x2 x3, …) are used. The value of the adjusted R2 serves as a quality criterion. Based on the algorithm, an interaction of two variables is only included in the model if these two parameters are also present in linear form in the model [34]. For the models, a physically meaningful description does not necessarily result on the basis of the stepwise regression. Thus, the formulae describe the observations, but do not fundamentally imply physical relationships or causalities. Table 10 shows the results of the stepwise regression for the group of all vehicles for different numbers of parameters and with and without interception terms.

Table 10.
Formulae and results of stepwise regression for the group of all vehicles.
Stepwise regression thus also led to equations that essentially provided a good approximation of the observed values. Compared with the manually created models, however, there existed the disadvantage that the syntax was less flexible and interactions were only taken into account if the basic variables were also part of the approximation. Furthermore, parameter results partly contradicted the physical background. In order to achieve comparably good approximations such as the manually created formulae, considerably more parameters were necessary here.
4. Summary and Discussion
It is known from the literature that the mass properties have a significant influence on the vehicle dynamics and are necessary for vehicle dynamics modeling and the development of assistance systems. As a basis for corresponding investigations, this study examined a larger number of non-conventional three-wheeled bicycle vehicles in terms of their mass properties. The measurement of the centers of gravity was based on a method frequently used in vehicle technology via the determination of wheel loads. In contrast to the method used by Wieczorek et al. [17] for dynamic determination of the center of gravity position, only static measurements could be performed in this case. The center of gravity values determined thus represent only one point in a possible range of center of gravity coordinates in dependence of the driver movement. The static investigations showed that the vehicles were rather front-heavy and mostly stable according to the stability criterion in [26]. Some of the vehicle-driver combinations exhibited oversteering and thus had a tendency toward unstable handling. However, investigations of the critical speed showed only slightly oversteering driving behavior for these vehicles, with the critical speed being outside the relevant range for this class of vehicle. Based on the determined center of gravity heights and the corresponding values of the static stability factors, it can be concluded that the vehicles investigated here had significantly lower static rollover stability compared with passenger cars (≈0.6 vs >1.0). The investigation of the moments of inertias showed a stronger relative contribution of the vehicle to the total inertia in contrast to the total mass. From the inertia data, approximation approaches for the moment of inertia could be determined for the different vehicle groups. In this study, 13 vehicles were measured in 44 vehicle-driver combinations, of which 39 measurements were considered for the definition of the approximation formulae. Compared with the relatively limited number of velomobile models, this covered a large cross-section of vehicles. Compared to the investigations of MacInnes et al. [11], the number of individual measurements remained relatively small. MacInnes’ measurements from 134 vehicles, divided into five categories, could be used for the studies. Due to the smaller amount of measurement data, no further classification by vehicle type (e.g., sporty or everyday vehicle) was made for this study, with the exception of the classification into trikes and velomobiles.
5. Conclusions and Future Works
In the context of the investigations presented here, ranges of parameters relevant to driving dynamics were determined for a class of bicycle vehicles that has been little considered to date. The determined ranges of vehicle mass parameters are to be used in the future within the framework of vehicle dynamics models to investigate the vehicle dynamics characteristics of the vehicle class under consideration. It is obvious and confirmed by the experience of the drivers of these vehicles that rollover accidents can already occur in everyday driving situations. The research conducted here supported this experience. Each of the vehicle-driver combinations investigated was very likely to reach the rollover point on a dry and even road before the vehicle began to slide. Investigations of the exact rollover circumstances may thus represent an interesting field for future studies to improve the driving safety of these vehicles. Possibilities for improving stability could include design measures such as reducing the height of the center of gravity, increasing the track width, or changing the vehicle concept to a four-wheeled vehicle. These measures are, of course, subject to design limits and are in conflict with other requirements (visibility, overview, weight, etc.). The use of active or passive assistance systems to prevent rollover is also conceivable and might be an interesting area for future research.
From the inertia data, approximation approaches for the moment of inertia were determined for a large number of vehicle-driver combinations. This made it possible to estimate the yaw inertia on the basis of basic vehicle parameters in order to realistically parameterize vehicle dynamics models such as the single-track model. Further measurements could help to improve the quality of the developed models in the future. In summary, it can be stated that the investigations carried out here provided the basis for vehicle dynamics modeling and the development of assistance systems with the availability of realistic parameter sets and ranges of vehicle mass parameters for this vehicle class. In future studies, these parameter sets will serve as the basis for a more in-depth examination of the vehicle dynamics characteristics of ultralight three-wheeled human-powered vehicles. Based on the investigations carried out, additional dynamic tests as described in the literature should be carried out in the future to determine the dynamic influence of driver movements on the center of gravity positions and vehicle dynamics.
Author Contributions
Conceptualization, T.W.; methodology, T.W.; data acquisition, T.W., formal analysis, T.W.; data curation, T.W.; writing—original draft preparation, T.W.; writing—review and editing, V.D. and F.G.; visualization, T.W.; supervision, V.D. and F.G.; project administration, V.D.; funding acquisition, T.W. and V.D. All authors have read and agreed to the published version of the manuscript.
Funding
This research was funded by the European Regional Development Fund and by the state Lower Saxony, grant number ZW6-85027763.
Institutional Review Board Statement
All subjects gave their informed consent for inclusion before they participated in the study. The study was conducted in accordance with the Declaration of Helsinki, and the protocol was approved by the Ethics Committee of Ostfalia University of Applied Sciences (Project identification code 2021/1, 19 April 2021).
Informed Consent Statement
Informed consent was obtained from all subjects involved in the study.
Data Availability Statement
The data collected in this study are available from the corresponding author upon request.
Acknowledgments
The authors would like to thank all participants of the study for their time and willingness to contribute to improving the driving safety of the considered vehicles.
Conflicts of Interest
The authors declare no conflict of interest. The funders had no role in the design of the study; in the collection, analyses, or interpretation of data; in the writing of the manuscript, or in the decision to publish the results.
Appendix A. Derivation of Rollover Stability for Four-Wheeled Vehicle (Equation (12))
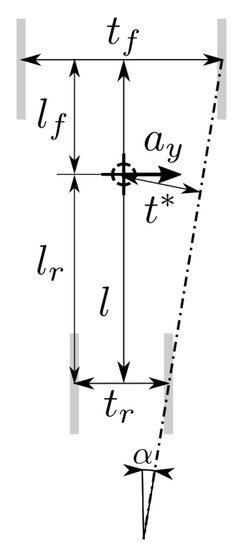
Figure A1.
Determination of SSF for the four-wheeled vehicle (top-view).
From the moment equilibrium around the tilting axis it follows for the case that both wheels inside the curve are just lifted off:
From the geometry, the lever arm t* of the weight force results in:
Substituting (A2) into (A1) and converting to ay/g yields for the SSF.
Appendix B. Measurement Results

Table A1.
Measurement values.
Table A1.
Measurement values.
| Vehicle | Driver | COG-Position | COG-Position | COG-Height | Yaw Intertia * [kgm2] | Vehicle | Driver | COG-Position | COG-Position | COG-Height | Yaw Intertia * [kgm2] |
|---|---|---|---|---|---|---|---|---|---|---|---|
| 1 | 0 | 0.35 | −0.015 | 0.25 | 13.23 0.42 | 8 | 0 | 0.38 | −0.003 | 0.32 | 16.47 0.54 |
| 1 | 1 | 0.35 | −0.012 | 0.32 | 23.17 0.52 | 8 | 1 | 0.44 | −0.014 | 0.43 | 24.50 0.72 |
| 1 | 8 | 0.32 | −0.015 | 0.38 | 27.55 0.62 | 8 | 8 | 0.41 | −0.011 | 0.40 | 29.30 0.57 |
| 1 | 9 | 0.30 | −0.013 | 0.42 | 26.10 0.53 | 8 | 9 | 0.40 | −0.007 | 0.40 | 25.27 0.66 |
| 2 | 0 | 0.51 | 0.010 | 0.21 | 20.32 0.47 | 9 | 0 | 0.55 | −0.001 | 0.34 | 25.00 0.51 |
| 2 | 1 | 0.51 | −0.008 | 0.31 | 27.47 0.64 | 9 | 1 | 0.52 | −0.009 | 0.43 | 32.73 0.81 |
| 2 | 8 | 0.46 | −0.001 | 0.35 | 32.77 0.65 | 9 | 4 | 0.53 | −0.008 | 0.46 | 37.04 0.93 |
| 2 | 9 | 0.51 | −0.002 | 0.32 | 28.64 0.59 | 9 | 5 | 0.54 | −0.004 | 0.41 | 32.30 0.78 |
| 3 | 0 | 0.36 | 0 | 0.30 | 16.47 0.43 | 9 | 6 | 0.51 | −0.009 | 0.41 | 32.50 0.67 |
| 3 | 1 | 0.38 | −0.003 | 0.27 | 24.50 0.67 | 10 | 0 | 0.43 | −0.014 | 0.38 | 14.53 0.53 |
| 3 | 8 | 0.36 | 0.002 | 0.28 | 29.30 0.72 | 10 | 1 | 0.47 | −0.018 | 0.47 | 21.27 0.74 |
| 3 | 9 | 0.36 | 0 | 0.32 | 25.27 0.63 | 10 | 4 | 0.50 | −0.021 | 0.45 | 25.56 0.74 |
| 4 | 0 | 0.37 | −0.001 | 0.31 | 14.25 0.47 | 10 | 5 | 0.48 | −0.013 | 0.42 | 20.47 0.81 |
| 4 | 1 | 0.38 | −0.012 | 0.38 | 23.27 0.61 | 10 | 6 | 0.46 | −0.015 | 0.40 | 21.87 0.79 |
| 4 | 2 | 0.38 | 0.009 | 0.39 | 21.65 0.53 | 10 | 7 | 0.46 | −0.018 | 0.43 | 19.31 0.77 |
| 4 | 3 | 0.41 | −0.001 | 0.36 | 26.98 0.59 | 11 | 0 | 0.30 | −0.005 | 0.25 | 4.32 0.21 |
| 4 | 8 | 0.36 | −0.007 | 0.38 | 27.61 0.66 | 11 | 1 | 0.39 | −0.004 | 0.47 | 12.36 0.34 |
| 4 | 9 | 0.40 | −0.007 | 0.39 | 29.58 0.59 | 11 | 4 | 0.40 | 0.003 | 0.55 | 17.62 0.46 |
| 5 | 0 | 0.51 | −0.008 | 0.30 | 20.03 0.49 | 11 | 5 | 0.37 | 0.007 | 0.57 | 12.76 0.43 |
| 5 | 1 | 0.40 | −0.001 | 0.44 | 29.70 0.60 | 12 | 0 | 0.40 | −0.009 | 0.33 | 5.29 0.27 |
| 5 | 2 | 0.39 | −0.011 | 0.41 | 28.10 0.72 | 12 | 1 | 0.41 | 0.001 | 0.55 | 15.38 0.86 |
| 5 | 3 | 0.41 | −0.011 | 0.46 | 33.00 0.75 | 12 | 4 | 0.42 | −0.006 | 0.60 | 19.50 0.48 |
| 6 | 0 | 0.36 | −0.009 | 0.35 | 20.42 0.37 | 12 | 5 | 0.41 | −0.004 | 0.48 | 15.22 0.51 |
| 6 | 1 | 0.38 | −0.004 | 0.45 | 28.13 0.42 | 13 | 0 | 0.60 | −0.018 | 0.33 | 11.60 0.52 |
| 6 | 2 | 0.36 | −0.005 | 0.46 | 26.50 0.44 | 13 | 1 | 0.52 | −0.011 | 0.50 | 21.63 0.54 |
| 6 | 3 | 0.39 | −0.004 | 0.44 | 30.91 0.51 | 13 | 4 | 0.52 | −0.004 | 0.48 | 23.29 0.61 |
| 7 | 0 | 0.55 | −0.010 | 0.34 | 28.38 0.57 | 13 | 5 | 0.53 | 0.002 | 0.52 | 18.01 0.72 |
| 7 | 1 | 0.43 | −0.006 | 0.40 | 40.76 0.63 | ||||||
| 7 | 2 | 0.43 | −0.008 | 0.38 | 39.02 0.62 | ||||||
| 7 | 9 | 0.43 | −0.006 | 0.43 | 43.12 0.69 |
* the standard deviations of yaw inertia for each vehicle-driver-combination are calculated from the standard deviations of the measured angular accelerations and the law of error propagation with respect to Equation (8).
Appendix C. Cornering Stiffness vs. Vertical Load for a Bicycle Tire
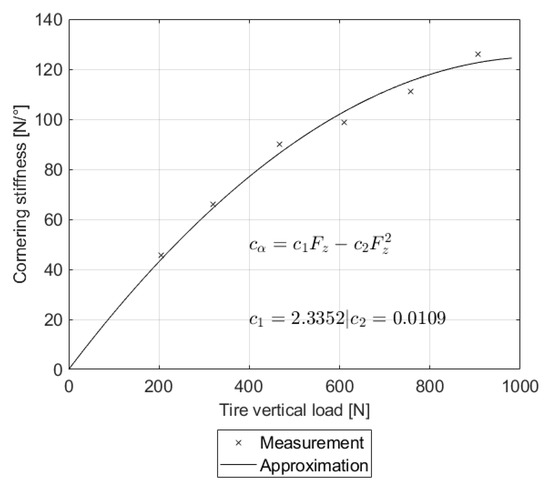
Figure A2.
Cornering stiffness vs. vertical load for a bicycle tire.
References
- Massink, R.; Zuidgeest, M.; Rijnsburger, J.; Sarmiento, O.L.; van Maarseveen, M. The Climate Value of Cycling. Nat. Resour. Forum 2011, 35, 100–111. [Google Scholar] [CrossRef]
- Ahrens, G.-A.; Becker, U.; Böhmer, T.; Richter, F.; Wittwer, R. Potenziale des Radverkehrs für den Klimaschutz—Kurzfassung [Potentials of Cycling for Climate Protection—Short Version]. 2013. Available online: https://www.umweltbundesamt.de/publikationen/potenziale-des-radverkehrs-fuer-den-klimaschutz (accessed on 30 October 2020).
- Van de Walle, F. The Velomobile as a Vehicle for more Sustainable Transportation: Reshaping the Social Construction of Cycling Technology. Master’s Thesis, KTH Royal Institute of Technology, Stockholm, Sweden, 2004. [Google Scholar]
- Lohmeyer, D. Velomobile: Hocheffiziente Fahrräder für das Ganze Jahr [Velomobile: Highly Efficient Bikes for the Whole Year]. Available online: https://www.velostrom.de/velomobile-hocheffiziente-fahrraeder-fuer-das-ganze-jahr/ (accessed on 30 October 2020).
- Lohmeyer, D. Velomobile: Schnelle Fahrräder mit Wetterschutz [Velomobiles: Fast Bikes with Weather Protection], 1st ed.; LD-Verlag: Windeck, Germany, 2018; ISBN 978-3-9806385-7-9. [Google Scholar]
- Allen, R.; Klyde, D.; Rosenthal, T.; Smith, D. Estimation of Passenger Vehicle Inertial Properties and Their Effect on Stability and Handling. SAE Trans. 2003, 1032–1050. [Google Scholar] [CrossRef]
- Mikusova, M. Crash avoidance systems and collision safety devices for vehicle occupants. MATEC Web Conf. 2017, 107, 24. [Google Scholar] [CrossRef]
- Garrott, W.R. Measured Vehicle Inertial Parameters—NHTSA’s Data through September 1992. In SAE Technical Paper Series; International Congress & Exposition, MAR. 01, 1993; SAE International: Warrendale, PA, USA, 1993. [Google Scholar]
- Heydinger, G.; Bixel, R.; Garrott, W.R.; Pyne, M.; Howe, J.; Guenther, D. Measured Vehicle Inertial Parameters-NHTSA’s Data Through November 1998. SAE Trans. 1999, 2462–2485. [Google Scholar] [CrossRef]
- Garrott, W.; Monk, M.; Chrstos, J. Vehicle Inertial Parameters—Measured Values and Approximations. SAE Technical Paper 881767. SAE Trans. 1988. [Google Scholar] [CrossRef]
- MacInnis, D.; Cliff, W.; Ising, K. A Comparison of Moment of Inertia Estimation Techniques for Vehicle Dynamics Simulation. SAE Technical Paper 970951. SAE Trans. 1997, 106, 1557–1575. [Google Scholar]
- Rozyn, M.; Zhang, N. A method for estimation of vehicle inertial parameters. Veh. Syst. Dyn. 2010, 48, 547–565. [Google Scholar] [CrossRef]
- Gong, X.; Suh, J.; Lin, C. A novel method for identifying inertial parameters of electric vehicles based on the dual H infinity filter. Veh. Syst. Dyn. 2020, 58, 28–48. [Google Scholar] [CrossRef]
- Deng, Z.; Chu, D.; Tian, F.; He, Y.; Wu, C.; Hu, Z.; Pei, X. Online estimation for vehicle center of gravity height based on unscented Kalman filter. In Proceedings of the 2017 4th International Conference on Transportation Information and Safety (ICTIS), Banff, AB, Canada, 8–10 August 2017; IEEE: Piscataway, NJ, USA, 2017; pp. 33–36, ISBN 978-1-5386-0437-3. [Google Scholar]
- Cooper, R.A. An international track wheelchair with a center of gravity directional controller. J. Rehabil. Res. Dev. 1989, 26, 63–70. [Google Scholar] [PubMed]
- Wieczorek, B.; Górecki, J.; Kukla, M.; Wojtokowiak, D. The Analytical Method of Determining the Center of Gravity of a Person Propelling a Manual Wheelchair. Procedia Eng. 2017, 177, 405–410. [Google Scholar] [CrossRef]
- Wieczorek, B.; Kukla, M.; Warguła, Ł. Methods for measuring the position of the centre of gravity of an anthropotechnic human-wheelchair system in dynamic conditions. In IOP Conference Series: Materials Science and Engineering; IOP Publishing: Bristol, UK, 2020. [Google Scholar]
- Wieczorek, B.; Kukla, M.; Warguła, Ł. The Symmetric Nature of the Position Distribution of the Human Body Center of Gravity during Propelling Manual Wheelchairs with Innovative Propulsion Systems. Symmetry 2021, 13, 154. [Google Scholar] [CrossRef]
- Wieczorek, B.; Kukla, M. Biomechanical Relationships between Manual Wheelchair Steering and the Position of the Human Body’s Center of Gravity. J. Biomech. Eng. 2020, 142. [Google Scholar] [CrossRef] [PubMed]
- Wieczorek, B.; Kukla, M.; Warguła, Ł.; Rybarczyk, D.; Giedrowicz, M.; Górecki, J. The Impact of the Human Body Position Changes during Wheelchair Propelling on Motion Resistance Force: A Preliminary Study. J. Biomech. Eng. 2021, 143. [Google Scholar] [CrossRef] [PubMed]
- Gawade, T.R.; Mukherjee, S.; Mohan, D. Six-degree-of-freedom three-wheeled-vehicle model validation. Proc. Inst. Mech. Eng. Part D J. Automob. Eng. 2005, 219, 487–498. [Google Scholar] [CrossRef]
- Challener, S.; Chan, K.; Lock, G. Simulations of Three and Four Wheeled Vehicles; Health and Safety Executive (HSE), Frazer-Nash Consultancy Limited: Dorking, UK, 2000. [Google Scholar]
- Raman, A.; Rao, J.S.; Kale, S.R. Overturning Stability of Three Wheeled Motorized Vehicles. Veh. Syst. Dyn. 1995, 24, 123–144. [Google Scholar] [CrossRef]
- Mitschke, M.; Wallentowitz, H. Dynamik der Kraftfahrzeuge [Vehicle Dynamics], 5th ed.; Springer Vieweg: Fachmedien/Wiesbaden, Germany, 2014; ISBN 978-3-658-05067-2. [Google Scholar]
- Pacejka, H.B. Tire and Vehicle Dynamics, 3rd ed.; Elsevier: Amsterdam, The Netherlands, 2012; ISBN 9780750669184. [Google Scholar]
- Huston, J.C.; Graves, B.J.; Johnson, D.B. Three Wheeled Vehicle Dynamics. SAE Trans. 1982. [Google Scholar] [CrossRef]
- Han, X.; Mourioux, G.; Stephant, J.; Meizel, D. About the prediction of all-terrain vehicles rollover. In Proceedings of the 2012 9th France-Japan & 7th Europe-Asia Congress on Mechatronics (MECATRONICS)/13th Int’l Workshop on Research and Education in Mechatronics (REM), Paris, France, 21–23 November 2012; pp. 56–63. [Google Scholar]
- Boyd, P.L. Nhtsa’s Ncap Rollover Resistance Rating System. In Proceedings of the 19th International Technical Conference on the Enhanced Safety of Vehicles (ESV), Washington, DC, USA, 6–9 June 2005. [Google Scholar]
- Reif, K.; Dietsche, K.-H. Kraftfahrtechnisches Taschenbuch: Kfz-Fachwissen Kompakt [Motor Vehicle Handbook: Motor Vehicle Knowledge in Compact Form], 27th ed.; Vieweg + Teubner: Wiesbaden, Germany, 2011; ISBN 978-3834814401. [Google Scholar]
- Bixel, R.A.; Heydinger, G.J. Measured Vehicle Center-of-Gravity Locations—Including NHTSA’s Data through 2008 NCAP. SAE Tech. Pap. 2010. [Google Scholar] [CrossRef]
- Berrington, K.; Pitt, R.; Porteous, H. Transport at Work: Rollover of Lorries Transporting Paper Reels; Health and Safety Executive (HSE): London, UK, 2003. [Google Scholar]
- Macnabb, M.J.; Brewer, E.; Baerg, R.; Billing, J.R. Static and Dynamic Roll Stability of Various Commercial Vehicles. In SAE Technical Paper Series; International Truck & Bus Meeting & Exhibition, NOV. 18, 2002; SAE International: Warrendale, PA, USA, 2002. [Google Scholar] [CrossRef]
- Walz, M.C. Trends in the Static Stability Factor of Passenger Cars, Light Trucks, and Vans; National Highway Traffic Safety Administration (NHTSA): Washington, DC, USA, 2005.
- Mathworks. Stepwiselm. Available online: https://de.mathworks.com/help/stats/stepwiselm.html (accessed on 26 March 2021).
Publisher’s Note: MDPI stays neutral with regard to jurisdictional claims in published maps and institutional affiliations. |
© 2021 by the authors. Licensee MDPI, Basel, Switzerland. This article is an open access article distributed under the terms and conditions of the Creative Commons Attribution (CC BY) license (https://creativecommons.org/licenses/by/4.0/).