Abstract
The damage that occurs around the tire bead region is one of the critical failure forms of a tire. Generally, the prediction of tire durability is carried out by the experimental method. However, it takes a lot of money and time to conduct experiments. Therefore, to determine the fatigue life of radial tire bead, a reasonable prediction method is proposed in this paper. Fatigue testing of bead rubber compounds to determine the ΔSED-number of the cycle (Nf) was applied. The maximum strain energy density range (ΔSEDmax) of several bead compounds was obtained by steady-state rolling analysis with a finite element method. This quantity is then inserted into a fatigue life equation to estimate the fatigue life. The experimental results of the 175/75R14 tire were compared with the estimated value, which showed a good correlation. It is concluded that the method can be effectively applied to the fatigue life prediction of the tire bead.
1. Introduction
As the only contact component between a vehicle and the road, the tire has an important influence on the operating characteristics of a vehicle. The durability of tire performance is one of the most important indicators for evaluating vehicle safety performance. In addition, if the tires have premature fatigue failure from market feedback, it will also affect the reputation and economic benefits of tire manufacturers. In recent years, as the energy crisis has increasingly become a global issue, tire durability problems have been magnified in the tire industry [1]. Therefore, a method to evaluate the durability of a tire is of great importance.
The finite element analysis method to predict tire performance has been used widely. Many scholars and experts have done a lot of scientific research on tire fatigue simulation. KIM et al. [2] used the cracking energy density (CED) proposed by Mars [3] and virtual crack closure technology (VCCT) to calculate the energy release rate of the crack. The fatigue life for tires was predicted by using Paris’ law. Wedam et al. [4] computed local crack driving forces from strain history loads, obtained via the cracking energy density (CED) fatigue predictor with a finite element method, to predict the fatigue life of the components of an off-the-road (OTR) tire. Dongwoo Lee [5] applied a deterministic analysis method to evaluate the fatigue life of the tire belt on the basis of finite element analysis, and proposed a probabilistic analysis method by the Monte Carlo simulation of test statistics to predict the life. The results are consistent with each other. Yang [6] utilized the finite element method and combined the average response analysis method to explore the influence of the bead reinforcement layer on tire durability. Based on the results, the structure of tire bead for the formula racing tire was optimized and the expected effect was achieved.
From a survey of the literature, the research on tire durability finite element analysis and prediction methods primarily uses stress, strain, and energy [7,8], or is combined with fracture mechanics to predict the actual fatigue life [9,10]. Indoor durability testing has been used to evaluate the durability of a tire; however, this method is still time-consuming. Moreover, even for some ultra-large tires, the size and weight make them unsuitable for drum endurance tests. In order to shorten the development period and improve the quality of tires, it is necessary to develop a reliable and valid approach to predict the fatigue life for the bead region of tires.
The aim of this paper is to propose a method that applies the finite element method and the fatigue life equation of bead rubber compounds to predict the fatigue life of indoor durability testing of tires. In this process, a new fatigue parameter—maximum strain energy density range—was presented to analyze fatigue characteristics, and a controlling factor of durability for the tire bead was suggested. Compared with experimental results, this method has good correspondence with predicting fatigue life.
2. Fatigue Life Prediction Method
The fatigue life prediction method applied here is based on the strain energy density range (ΔSED) proposed in reference [11]. The ΔSED value is defined by the difference between maximum SED and minimum SED in the circumferential direction of the bead region. It can characterize the intensity of the energy change for tire bead in the circumferential direction more conveniently, so the strain energy density range is selected as the evaluation index of tire bead fatigue. The ΔSED can be expressed as Equation (1).
In this study, in order to predict the fatigue life of the tire bead, the steady-state rolling analysis of the finite element method and the fatigue test of the rubber compound in the bead area were used. The specific forecasting steps are as follows:
- (1)
- According to the test standard, carry out the uniaxial tensile fatigue test of rubber compounds, and obtain the fatigue life equations of the curves;
- (2)
- Use finite element analysis to obtain the maximum strain energy density range ΔSEDmax value of different compounds at a specific rolling speed in the bead area. ΔSEDmax is the maximum value of ΔSED for each compound. It reflects the highest level of energy change in rubber compounds;
- (3)
- Calculate the fatigue life of different rubber compounds by inserting the obtained maximum strain energy density range ΔSEDmax value into the fatigue life equation of the rubber compound. The minimum fatigue life of the rubber compound is regarded as the fatigue life of the bead;
- (4)
- Use dynamic rolling radius of tire and fatigue life (Nf) to calculate the distance traveled at a specific speed.
3. Experiment
3.1. Fatigue Test Method
The material distribution of a 175/75R14 tire is shown in Figure 1. Based on the actual damage of the radial tire, rubber compounds of carcass, apex, and abrasion are selected to perform uniaxial cyclic tensile tests to test their fatigue life.
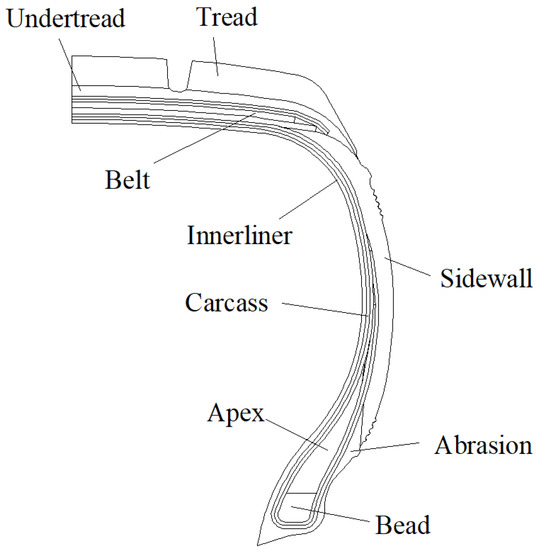
Figure 1.
Material distribution of a 175/75R14 tire.
To evaluate the fatigue characteristics of the three rubber compounds, the specimens’ dimension and shape conformed to ASTM D4482-07 (a standard test method for rubber property-extension cycling fatigue) [12]. For the rubber fatigue test, the dumbbell-shaped specimen has the advantages of a shorter test period and more convenient test [13], so it is widely used. The test specimen is shown in Figure 2. Figure 3 shows the specimen cutter. According to the ASTM D4482-07, this test used a mean value of 10 specimens under different strain levels to reduce error.
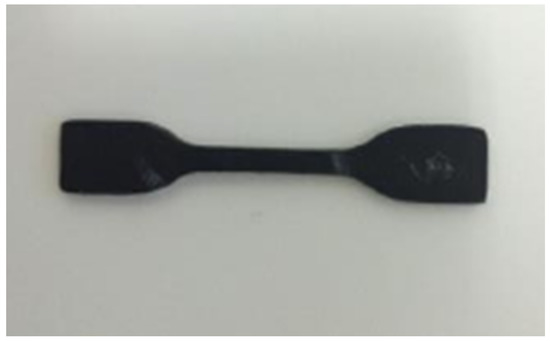
Figure 2.
Dumbbell specimen.
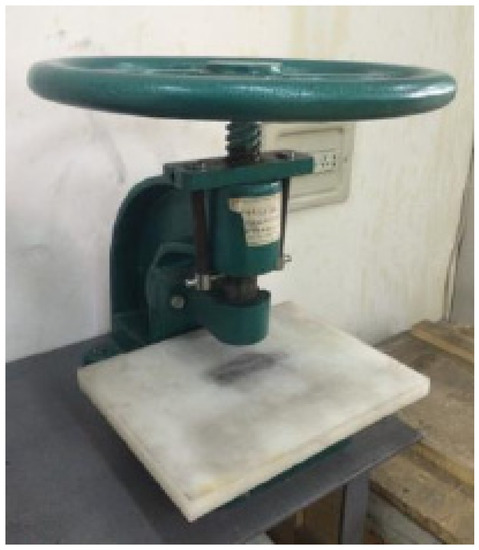
Figure 3.
Specimen Cutter.
After the specimens were installed, the fatigue tests were carried out using displacement control to apply the load. In the study of Mars et al. [14], frequency and waveform had little influence on fatigue testing, so the fatigue tests were conducted with a sinusoidal waveform of 5 Hz, as in Figure 4, and the minimum strain was maintained at zero. Tests were performed in an ambient temperature (23 °C). The maximum strain of each rubber compound is shown in Table 1.
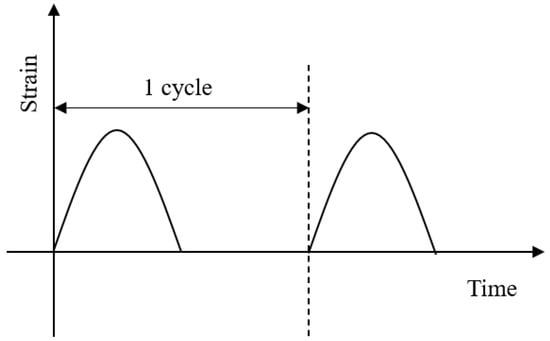
Figure 4.
Waveform type for tests.

Table 1.
Strain of rubber components for tests.
Under normal conditions, the crack propagation life accounts for nearly 90% of the total lifespan of rubber components [15]. Thus, the fatigue failure life was defined as the number of cycles from the initial state to the complete fracture of the specimen. The number of cycles of the specimen until failure was measured by an electromagnetic counter. In order to avoid sudden failures, a camera was used to monitor the test process.
3.2. Fatigue Test Result
The specific calculation method of SED can refer to ASTM-D4482-07 [12]. According to fatigue testing data, the strain-Nf curves of different bead compounds is obtained. ΔSED–Nf curves were converted from strain-Nf curves, as shown in Figure 5, Figure 6 and Figure 7. Nf is the crack propagation life, and ΔSED is the strain energy density range.
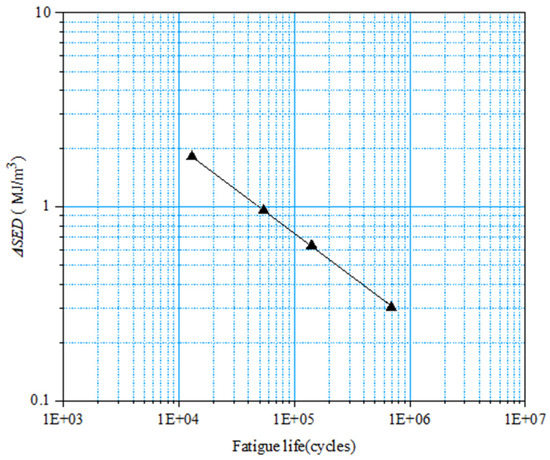
Figure 5.
ΔSED–Nf curve of carcass.
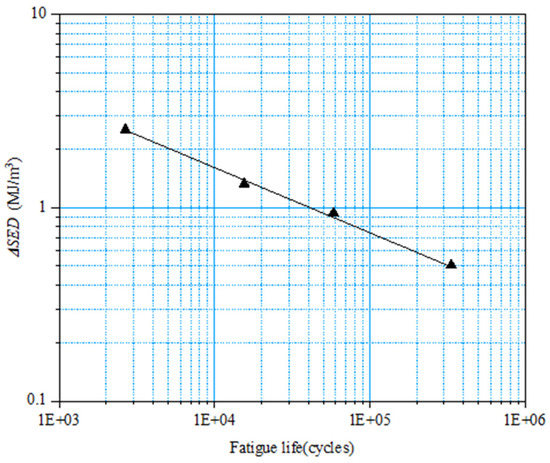
Figure 6.
ΔSED–Nf curve of apex.
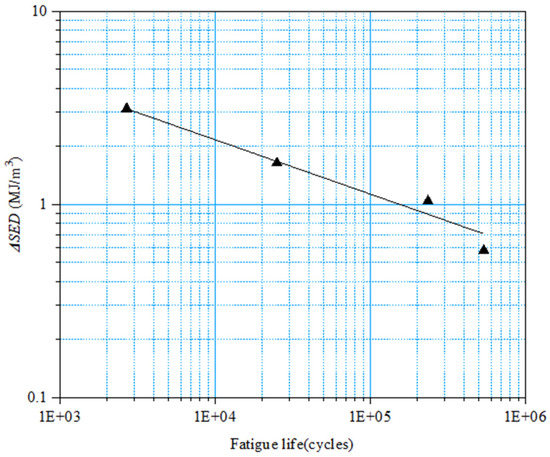
Figure 7.
ΔSED–Nf curve of abrasion.
Equations (2) to (4) show fatigue life prediction equations for three rubber compounds, the order is carcass, apex, and abrasion, respectively.
It shall be noted that Equations (2) to (4) are calculated based on the unit MJ/m3. Therefore, in the subsequent life prediction, the unit needs to be considered.
4. Finite Element Analysis
4.1. Tire Modelling Details
In this section, the developed tire model is described. A 175/75R14 tire was taken as the subject for this research. This research obtained the tire cross-section from the real tire of the 175/75R14 tire, as shown in Figure 8. The cross-sectional raster image was acquired by a CNC432 tire cross-section scanner, and then imported into AutoCAD software to divide each part. The scanner is shown in Figure 9. Hypermesh was utilized to establish a two-dimensional finite element mesh model, and refine the mesh for the bead and other vulnerable areas. The size of the elements in the bead region was 2 mm. The rubber components were defined by Hyperelastic elements (CGAX3H and CGAX4H). The cord-rubber composite materials were represented by the element Rebar. The steel cord components in the bead region were meshed using a SFMGAX1 element. The two-dimensional model was in a plane strain state. The 2D finite element model is shown in Figure 10.

Figure 8.
Cross-section of 175/75R14 tire.
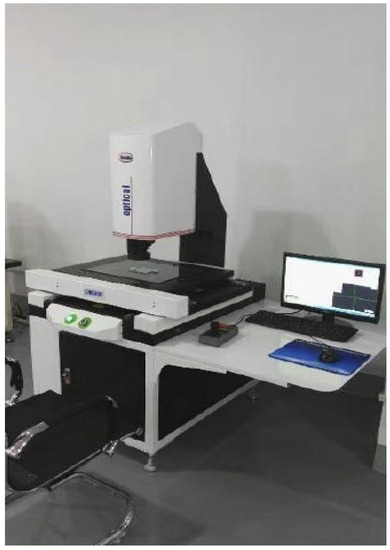
Figure 9.
Tire cross-section scanner.
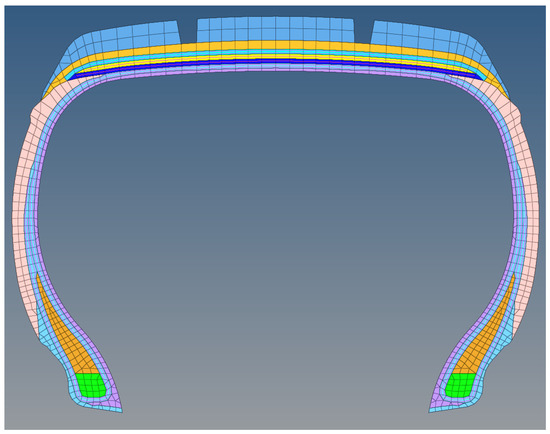
Figure 10.
2-dimensional finite element model.
Tires are mainly composed of rubber and cord-rubber materials, with typical nonlinear stress–strain behavior. Hence, the uniaxial tension tests were performed to determine the rubber hyperelastic material model [16]. The constitutive relationship curve for each rubber compound is shown in Figure 11.
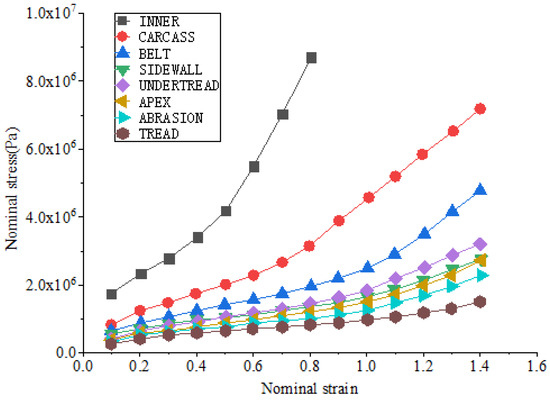
Figure 11.
Stress–strain response curve of different rubber compounds.
Abaqus provides several commonly used constitutive models, including the Neo–Hookean model, Yeoh model, Mooney–Rivlin model, Ogden model, Arruda–Boyce model, etc. Although the Neo–Hookean model [17] includes only one material constant, under large strain, the strain energy value predicted by the model is inconsistent with the measured value. The Mooney–Rivlin model [18] is very convenient to use; however, people find that it cannot predict multi-axial data. Treloar [19] indicated that the Ogden model and the Mooney–Rivlin model are essentially equivalent. The Arruda–Boyce model [20] is complex and not widely used. Due to the large deformation of the grounding part during the tire driving process, the Yeoh model has the advantage of being able to cover a large range of deformation, and its accuracy and stability are still relatively reliable under large deformations. Therefore, the Yeoh constitutive model was used for modelling the hyperelastic property of rubber compounds. The Yeoh strain energy function is expressed as Equation (5).
where U is the Yeoh strain energy function, is the first strain invariant, and C10, C20, C30 are modulus parameters of rubber compounds, which can be obtained by fitting the experimental data [21]. The fitting curve of the abrasion compound simulated by Yeoh model is shown in Figure 12. As seen from the figure, the Yeoh model has some errors in the small strain interval, but it is in good agreement with the experimental results in the medium and large strain intervals.
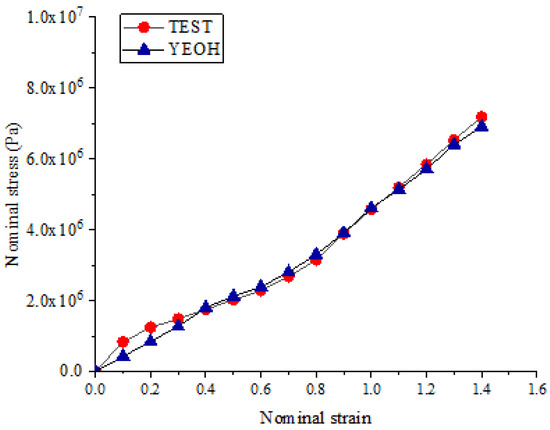
Figure 12.
The fitting curve of abrasion by Yeoh model.
4.2. Steady-State Rolling Analysis
A commercial software, ABAQUS, was applied for finite element analysis. A uniform pressure of 0.21 MPa was applied to the tire inner liner to simulate the tire inflation process. The *SYMMETRIC MODEL GENERATION command was used in Abaqus to rotate the two-dimensional model into a three-dimensional finite element model. The 3D model had a total of 201,403 elements and 213,903 nodes. The rim and road surface were defined as analytical rigid bodies. The vertical load was set to 9000N. To simulate the steady-state rolling state of the tire, the ALE (arbitrary Lagrangian–Eulerian) method, an implicit algorithm provided by ABAQUS, was used [22]. All geometric grid nodes did not move, and the physical change from the rotation was calculated as changes in other variables (energy, material properties, etc.) in the tire circumferential direction [5]. That is to say, this method transforms the contact problem of free rolling into a simple space problem. The rolling speed was set to 30 km/h. The free rolling angular velocity of the tire was 26.97 rad/s, and the direction was clockwise. The steady-state rolling analysis procedure of tire is shown in Figure 13.
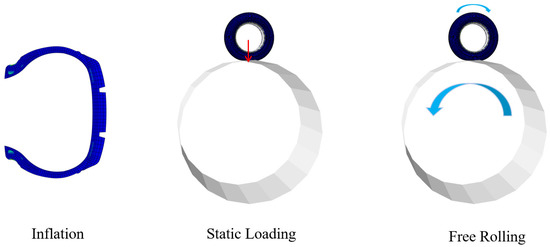
Figure 13.
Steady-state rolling analysis procedure.
Based on the simulation results, the ΔSEDmax (the maximum strain energy density range) values of the rubber compounds (carcass, apex, and abrasion) in the circumferential direction of the bead region were obtained, as shown in Table 2.
Table 2.
Maximum strain energy density range of rubber compounds.
5. Fatigue Life Prediction
After the computation of the ΔSEDmax of the three rubber compounds in the bead region (see Table 2), the number of cycles until failure (Nf) for each rubber compound can be estimated by substituting the obtained ΔSEDmax for fatigue life prediction equations (see Equations (2)–(4)). Then, driving distance until failure (Df) can be calculated as in Equation (6).
where Df is the predicted driving distance until failure, and R is the free rolling radius of the tire. The prediction results of fatigue life (Nf) and driving distance until failure (Df) for the bead rubber compounds are shown in Table 3.
Table 3.
Prediction values fatigue life (Nf) and driving distance (Df) for rubber compounds.
It can be seen from Table 3 that the fatigue life of the carcass is the shortest, and that the abrasion has the longest fatigue life. Therefore, the fatigue life of the bead region is most affected by the carcass. The fatigue life of the 17575/R14 tire bead can be roughly predicted based on the fatigue life equation of the carcass.
6. Verification of Prediction Method
In order to verify the reliability and accuracy of the above prediction method, the durability test of the 175/75R14 tire was carried out on the tire drum testing machine as shown in Figure 14.
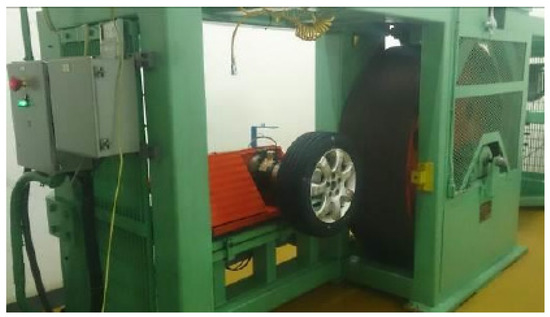
Figure 14.
Tire drum testing machine.
The test conditions were consistent with the simulation conditions: the inflation pressure was 0.21 MPa, the test speed was 30 km/h, and the vertical load was 9000 N. The test was performed four times and the mean value was taken to ensure the repeatability of the test results. In the results of the test, the crack occurred in the bead region as shown in Figure 15. The comparison between the predicted value and the test result is shown in Table 4. It can be seen from Table 4 that the predicted value and the fatigue life obtained from the actual fatigue test have an error of 1.32%, which is in good agreement. Based on the result, the method to predict fatigue life of tire bead is reliable, which can also be used to guide tire design and durability optimization.
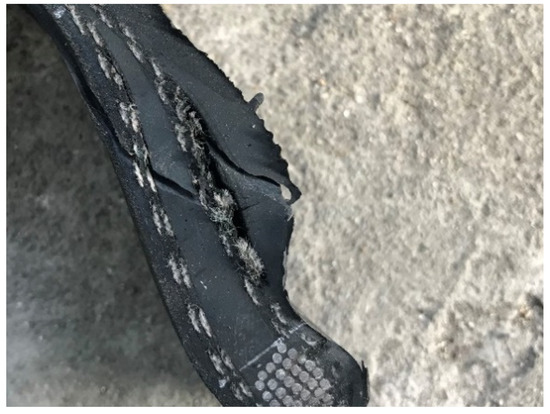
Figure 15.
Failure section of tested tire.
Table 4.
Fatigue life of the 175/75R14 tire bead.
7. Conclusions
In this study, a new fatigue life prediction method has been presented to evaluate the durability of tire bead. Based on the steady-state rolling analysis of the tire and the fatigue life equation of the rubber compound (carcass), the fatigue life of tire bead is predicted. Conclusions are as follows:
- (1)
- Based on the steady-state rolling analysis by a finite element method and the fatigue life equation of the rubber compound (carcass) in the bead region, a method that can flexibly predict the fatigue life (Nf) and the driving distance (Df) to failure of the tire bead is established;
- (2)
- The maximum strain energy density range can flexibly reflect the strain level of the tire, and practice also indicates that it is suitable as a parameter for fatigue evaluation;
- (3)
- The carcass plays a key role in the fatigue life of tire bead, and targeted optimization of this compound may effectively improve the fatigue performance of the tire bead.
Author Contributions
C.L. and W.W. carried out experiments; W.W. wrote the manuscript with the assistance of C.L. and L.C.; G.W. was responsible for the supervision and review; All authors have read and agreed to the published version of the manuscript.
Funding
This research received no external funding.
Acknowledgments
The authors appreciate the engineers of KENDA Rubber (China) Tire Co. Ltd. for kindly providing their constructive suggestions and helping during the process of the experiment.
Conflicts of Interest
The authors declare no conflict of interest.
References
- Kim, S.; Park, H.; Moon, B.; Sung, K.; Koo, J.M. The Prediction Methodology for Tire’s High Speed Durability Regulation Test Using A Finite Element Method. Int. J. Fatigue 2019, 118, 77–86. [Google Scholar] [CrossRef]
- Kim, T.W.; Jeon, H.Y.; Choe, J.H. Prediction of The Fatigue Life of Tires Using CED and VCCT. Key Eng. Mater. 2005, 297–300, 102–107. [Google Scholar] [CrossRef]
- Mars, W.V. Multiaxial Fatigue of Rubber; University of Toledo: Toledo, OH, USA, 2001. [Google Scholar]
- Nyaaba, W.; Frimpong, S.; Anani, A. Fatigue Damage Investigation of Ultra-large Tire Components. Int. J. Fatigue 2019, 119, 247–260. [Google Scholar] [CrossRef]
- Lee, D.; Kim, S.; Sung, K. A Study on The Fatigue Life Prediction of Tire Belt-layers Using Probabilistic Method. J. Mech. Sci. Technol. 2013, 27, 673–678. [Google Scholar] [CrossRef]
- Yang, X.; Olatunbosun, O.A. Optimization of Reinforcement Turn-up Effect on Tyre Durability and Operating Characteristics for Racing Tyre Design. Mater. Des. 2012, 35, 798–809. [Google Scholar] [CrossRef]
- Ogawa, H.; Furuya, S.; Koseki, H.; Iida, H.; Sato, K.; Yamagishi, K. A Study on the Contour of the Truck and Bus Radial Tire. Tire Sci. Technol. 1990, 18, 236–261. [Google Scholar] [CrossRef]
- Kamal, M.; Rahman, M.M. Advances in Fatigue Life Modeling: A Review. Renew. Sustain. Energy Rev. 2018, 82, 940–949. [Google Scholar] [CrossRef]
- Previati, G.; Kaliske, M. Crack Propagation in Pneumatic Tires: Continuum Mechanics and Fracture Mechanics Approaches. Int. J. Fatigue 2012, 37, 67–78. [Google Scholar] [CrossRef]
- Kabe, K.; Rachi, K.; Takahashi, N.; Kaga, Y. Tire Design Methodology Based on Safety Factor to Satisfy Tire Life (Simulation Approach to Truck and Bus Tire Design). Tire Sci. Technol. 2005, 33, 195–209. [Google Scholar] [CrossRef]
- Yan, X.; Wang, Y.; Feng, X. Study for The Endurance of Radial Truck Tires with Finite Element Modeling. Math. Comput. Simul. 2002, 59, 471–488. [Google Scholar] [CrossRef]
- ASTM D4482-07, Standard Test Method for Rubber Property-Extension Cycling Fatigue; ASTM International: West Conshohocken, PA, USA, 2007; Available online: www.astm.org (accessed on 20 September 2020).
- Wang, X.; Shangguan, W.; Liu, T. Experiment of Uniaxial Tension Fatigue and Modeling of Fatigue Life for Filled Natural Rubbers. J. Mech. Eng. 2013, 49, 65–73. [Google Scholar] [CrossRef]
- Mars, W.V.; Fatemi, A. Factors that Affect the Fatigue Life of Rubber: A Literature Survey. Rubber Chem. Technol. 2004, 77, 391–412. [Google Scholar] [CrossRef]
- Zine, A.; Benseddiq, N.; Abdelaziz, M.N. Prediction of Rubber Fatigue Life Under Multiaxial Loading. Fatigue Fract. Eng. Mater. Struct. 2006, 29, 267–278. [Google Scholar] [CrossRef]
- Smith, L.P. The Language of Rubber: An Introduction to The Specification and Testing of Elastomers; Butterworth-Heinemann: Oford, UK, 1994. [Google Scholar]
- Wang, Y.; Wang, F.; Wang, H. Application of Hyperelastic Constitutive Models in Finite Element Analysis on Tires. Tire Ind. 2009, 29, 277–282. [Google Scholar]
- Li, X.; Yang, X. A Review of Elastic Constitutive Model for Rubber Materials. China Elastomerics 2005, 15, 50–58. [Google Scholar]
- Treloar, L.R.G. Physics of Rubber Elasticty; Oxford University Press: Oxford, UK, 1975. [Google Scholar]
- Arruda, E.M.; Boyce, M.C. A Three-dimensional Constitutive Model for The Large Stetch Behavior of Rubber Elastic Materials. J. Mech. Phys. Solids 1993, 41, 389–412. [Google Scholar] [CrossRef]
- Ghosh, P.; Saha, A.; Bohara, P.C.; Mukhopadhyay, R. Material Property Characterization for Finite Element Analysis of Tires. Rubber World 2006, 233, 22–31. Available online: https://www.researchgate.net/publication/289771858_Material_property_characterization_for_finite_element_analysis_of_tires (accessed on 1 January 2006).
- Abaqus Example Problems Guide. Section 1.3.8. 2016. Available online: http://130.149.89.49:2080/v2016/books/exa/default.htm (accessed on 11 October 2020).
Publisher’s Note: MDPI stays neutral with regard to jurisdictional claims in published maps and institutional affiliations. |
© 2021 by the authors. Licensee MDPI, Basel, Switzerland. This article is an open access article distributed under the terms and conditions of the Creative Commons Attribution (CC BY) license (https://creativecommons.org/licenses/by/4.0/).