Article

Early Performance Prediction in Bioinformatics Systems Using Palladio Component Modeling

by
Doaa M. Talaat Dorgham
*,
Nahla A. Belal
and
Walid Abdelmoez
College of Computing and Information Technology, Arab Academy for Science, Technology, and Maritime Transport, Alexandria 1029, Egypt
*
Author to whom correspondence should be addressed.
Appl. Sci. 2021, 11(12), 5426; https://doi.org/10.3390/app11125426
Submission received: 13 May 2021 / Revised: 6 June 2021 / Accepted: 7 June 2021 / Published: 11 June 2021

Abstract

:
Bioinformatics is a branch of science that uses computers, algorithms, and databases to solve biological problems. To achieve more accurate results, researchers need to use large and complex datasets. Sequence alignment is a well-known field of bioinformatics that allows the comparison of different genomic sequences. The comparative genomics field allows the comparison of different genomic sequences, leading to benefits in areas such as evolutionary biology, agriculture, and human health (e.g., mutation testing connects unknown genes to diseases). However, software engineering best practices, such as software performance engineering, are not taken into consideration in most bioinformatics tools and frameworks, which may lead to serious performance problems. Having an estimate of the software performance in the early phases of the Software Development Life Cycle (SDLC) is beneficial in making better decisions relating to the software design. Software performance engineering provides a reliable and observable method to build systems that can achieve their required performance goals. In this paper, we introduce the use of the Palladio Component Modeling (PCM) methodology to predict the performance of a sequence alignment system. Software performance engineering was not considered during the original system development. As a result of the performance analysis, an alternative design is proposed. Comparing the performance of the proposed design against the one already developed, a better response time is obtained. The response time of the usage scenario is reduced from 16 to 8.6 s. The study results show that using performance models at early stages in bioinformatics systems can help to achieve better software system performance.

1. Introduction

Software performance is an important quality attribute that needs to be considered thoroughly in order to develop effective software systems. Software performance is affected by system responsiveness and system scalability. Software responsiveness necessitates meeting the objectives of a system within the required response time, while system scalability requires continuing to meet the response time requirements and the required throughput of a system while its functions increase. Many software systems are implemented without software performance engineering being taking into consideration in the early phases of the Software Development Lifecycle (SDLC). This leads to such systems usually falling short of their performance goals. Attempting to fix these systems in the late phases of the SDLC is expensive and may cause schedule delays, damaged relations with customers, and loss of profits. In extreme cases, it may cause the system to be redesigned from scratch. Performance is very difficult to adjust in an implemented system; thus, it must be considered an essential requirement from the early stages [1].
Traditional software development approaches prioritize software functionalities, while performance comes later in the process. This approach to development has been called the “fix-it-later” approach [2]. Achieving the required level of performance is one of the most important aspects in any software development effort, yet it is not included appropriately in most software development methods.
In this paper, we propose to use Palladio Component Modeling (PCM), which is a component-based software engineering tool used to predict the non-functional requirements of a software program—in our case, to predict the performance of a bioinformatics system. PCM aims to meet a software’s non-functional requirements, such as performance and reliability. Performance testing is usually carried out after the implementation of the software is finished. In other cases, it is conducted after software deployment because there are factors that affect the performance, such as the network, communications, and processor, that are not determined until the deployment phase [3]. In PCM, these factors are modeled such that their values are included in the model in the early phases of the SDLC. For such systems, it is very important that the application is highly scalable and has the required performance quality from the beginning in order to ensure system success; it is better to evaluate the performance during the early phases of development and to focus on it at all stages rather than only during the implementation and deployment phase.
Bioinformatics is defined as “the emerging field that deals with the application of computers to the collection, organization, analysis, manipulation, presentation, and sharing of biologic data” [4]. Bioinformatics applications must produce accurate and quick responses as much as possible. Some applications function properly, but their execution is often too slow to provide real-time feedback to users. These applications’ poor performance may have a direct effect on the patient’s health. One of the popular uses of bioinformatics is sequence alignment, also known as genome alignment or genome comparison. The comparative genomics field allows the comparison of different genomic sequences. Phylogenetic analysis involves studying the evolutionary history of and the relationships between different kinds of organisms [5,6]. Sequencing technology has been commonly used in clinical studies to clearly identify genes for drug design targets or to create medications for complex diseases [7].
Many approaches seek to satisfy performance goals without taking them into consideration in the early stages of the SDLC. Since sequence alignment is an important and growing field in bioinformatics, there are several tools available for its performance. ACANA [8] is a sequence alignment algorithm that uses a benchmark dataset of simulated non-coding sequences from [9] for performance evaluation. Unipro UGENE [10], which supports multiple biological data formats, integrates many tools into one interface, such as multiple sequence alignments, phylogenetic trees, and 3D structures. In this case, multithreading and special processor instructions are used to control the integrated algorithms in Unipro UGEN for maximum performance. Approaches carried out during SDLC early stages to detect performance metrics do not typically concern bioinformatics; mostly, bioinformatics approaches have focused on using high-performance computing (i.e., clusters of computers) for better performance results, such as in [11,12,13]. Other approaches, such as that of [14], implement high-performance languages, combining Python and C, for bioinformatics.
In this paper, a sequence alignment system is considered as a case study. The original development of the system did not consider software performance engineering in the early phases. It focused only on the functional requirements of the system and relied on conducting performance tests after the implementation of the system. This approach may lead to performance problems, such as not achieving the best performance results possible. Thus, a different approach is considered due to the importance of obtaining not only correct results but also the required response time. The original system is modeled in the design stage using PCM, conducting the proper performance analysis and gathering the performance metrics. Moreover, a design alternative is considered, which obtains better performance metrics when compared to the original design.
The rest of this paper is organized as follows. The required background is introduced in Section 2. In Section 3, the materials and methods used are presented. Following this, results are given in Section 4. Section 5 contains the discussion about the results obtained and highlights future directions. Finally, Section 6 concludes the paper.

2. Background

In this section, software performance engineering is presented, with details about the techniques employed in this study, namely the PCM and sequence alignment bioinformatics systems.

2.1. Software Performance Engineering (SPE)

SPE includes the methods applied during an SDLC to ensure that the performance requirements will be met. SPE should start during the early phase of the SDLC (i.e., the requirements and specifications or design phase). Most IT managers do not wish to extend the time to market [1]. Performance measurement should take into account a software system’s efficiency, corresponding to the time and allocation of resources. It can be expressed through multiple metrics (indices), including response time, utilization, and throughput [15].
There are many techniques to evaluate a system’s performance:
  • Measurement-based performance evaluation: in this technique, the values of the important performance requirements are collected by processing and analyzing collected data. A. Van Hoorn stated that the usual measurement-based operations to operate and improve the software are debugging, profiling, logging, and monitoring. Debugging and profiling generally occur at development time in the development environment, where a high degree of disruption is suitable. Logging and monitoring are used during operation in the production environment [16].
  • Model-based performance evaluation: here, the values of performance measures of interest are obtained by analyzing and simulating the software system. Model-based predictions search for other alternatives concerning the deployment and architecture of a system. It can be useful in many ways, such as the prediction and comparison of the performance metrics according to the design alternatives introduced for the system by improving its architecture, and also producing early estimates of the performance measures of interest during the SDLC [17].
Varied modeling techniques may be used to describe systems in a way that is suitable for their purpose of predicting performance metrics. Different performance modeling notations have been proposed, each focusing on different applications and forms of analysis. Models can be categorized according to their purposes into three categories: descriptive, prescriptive, and predictive. Furthermore, performance metrics can be categorized according to the method of modeling into black-box, architectural, and analytical performance models [18,19].
Black-box performance models describe the system at a high level regardless of its architecture. Black-box modeling uses machine learning techniques to estimate system performance. Black-box models may be more effective than analytical and architectural models, as the latter two need to know the internal behavior of the software system [18].
Architectural performance models store architectural information together with performance information. Approaches are utilized to combine performance tests within the design stage as the software is being modeled in this phase, such as the UML profile for schedulability, performance, and time (UML-SPT) [20], UML MARTE [21], and PCM [22]. These models have low simulation overhead because higher-level abstraction models of software components are used. Moreover, these models are used in several domains, such as online applications, parallel programing, and cloud computing [23].
Analytical performance models represent a popular approach to determine time-based system behavior. Queuing Network (QN), Layered Queuing Network (LQN), and Petri Nets (PNs) are well-known examples of analytical performance models [15]. There are many solution techniques to identify performance indices by analyzing performance models. These techniques include numerical techniques, simulation, or operational laws.
A multi-step solution method can be obtained by combining model transformations, simulation or analytical solutions, and bridging code. Architectural performance models can be directly simulated or automatically converted into analytical models, which are then processed by solvers [24]. Models such as UML MARTE and UML SPT have to be transformed into LQNs—for example, by using another tool, such as Tulsa [25]. On the other hand, PCM—the concern of this paper—contains its own simulators that transform the PCM models into a discrete-event simulation of a Generalized Queueing Network (GQN) and obtain the desired performance without any need to use extra tools.
There have been empirical evaluations of model-based performance solutions and approaches that focus on a single form, such as PCM in [26] or QN in [27]. Moreover, sequence diagrams and state charts of the UML were used to validate and evaluate performance in [28]. Other approaches contain methods to derive models, such as in [17,29], which describes component-based research methods using models, focusing on model flexibility, tool support, and complexity. PCM was used in [30] for automatically detecting and resolving software performance antipatterns. Antipatterns aim at finding and correcting common design flaws that cause major performance corruption. Antipatterns have been studied in a number of approaches, such as in [31,32], to automatically detect and/or refactor flaws in the design mode using UML.

2.2. Palladio Component Modeling (PCM)

The PCM is a component-based software engineering tool whose purpose is to determine the non-functional requirements of a software program, including performance and reliability. PCM requires specific tasks for a specific person, referred to as roles; a person can perform many tasks, and many persons can also perform the same task [33].
In the PCM, the component developer’s role is to implement the software components. Functional and non-functional requirements are developed for the components, and component specifications and executable software components are obtained. Component developers start by modeling the component repository, which contains all the components, interfaces, and data types needed for the system, and illustrating the relation between components and interfaces, whether the roles are provided or required [29]. This is referred to as the repository diagram.
The second diagram is a service effect specification (SEFFs) model that represents the actions that a component can carry out (for example, processing or transmitting the data) and the resources required for these actions. SEFF is developed for each function mentioned in the components in the repository. SEFF matches the activity diagram in the UML [29,34].
A software architect should then take the repository and SEFF diagrams to build an assembly that will be modeled in the system diagram, which is an important part of the complete system. The system diagram defines the connections between the components at which each required role in one is connected to the corresponding provided role in another one; it also defines the system’s delegation roles [33,34].
The system deployer’s role is to handle the allocation of components of hardware and software resources providing the needed infrastructure. All the hardware needed is mentioned, including servers, clients, and networks, and the ways in which the software components are installed and configured in this environment are also accounted for. Furthermore, a system deployer model’s resource environment diagram illustrates all the properties needed—for example, CPU scheduling and processing rate, network latency, and throughput—and it also models the allocation diagram representing how the software is allocated in the hardware [33,34]. This is known as the resource environment and allocation diagram.
Finally, the usage diagram is developed to help the system architects in defining how the user will interact with the system. Domain experts can state the expected usage scenarios and workloads of the system, defining it in a usage model [34].

2.3. Bioinformatics Systems

Bioinformatics combines the knowledge of biology, computer science, mathematics, and statistics to analyze biological data. Bioinformaticians, for the most part, are responsible for developing the systems; they must have both biological and programming skills. The results of bioinformatics tools and frameworks are achieved gradually and they are less reliable than others. Software engineering does not appear in these tools and frameworks, which might result in major performance problems. Bioinformaticians do not have the needed software engineering services to avoid these problems. By using software engineering standards—preferably devised by software engineers or bioinformatics engineers instead of bioinformaticians—these problems can be avoided [35].
As mentioned previously, one of the most important fields of bioinformatics is sequence alignment. Sequence alignment can be used in defining protein functions, autoimmune diseases, and in homology and phylogeny. Sequence alignment can be used in protein functions to estimate the final function based on the amino acid sequence by comparing the sequence to a database of defined proteins and their functions. In this case, the protein’s conduct and function are determined by its three-dimensional folds along with the amino acid composition [36]. Sequence alignment is being used to discover the genetic origin of autoimmune diseases. It can be used to find similarities between protein sequences in an autoimmune disease patient’s body cells and defined viruses and bacteria. When major similarities are discovered, a treatment can be created to change the body’s genetic code [37]. Homology is a branch of biology concerned with the formation of evolutionary trees. It can be carried out by aligning significant sections of DNA from different life forms. Humans, for example, have several types of DNA in common with monkeys, apes, and other primates. On a human-only scale, this could be useful in identifying the genes that cause genetic diseases [5]. Phylogeny is a branch of biology that studies the evolutionary history of all living things on the planet in order to build a phylogenetic tree. Multiple sequence alignment is a common practice in phylogenetic analysis and includes determining and organizing the evolutionary history of various organisms into a hierarchy, in which closely related species are physically positioned near one another [38].
In this study, a sequence alignment system is employed to test the performance enhancement when using the PCM model in the early stages of development. Sequence alignment is selected based on the importance of the field, as discussed earlier; moreover, it serves as a basis for the incorporation of software engineering principles with bioinformatics, meaning that the study can be further expanded to other areas of bioinformatics.

3. Materials and Methods

In this paper, we propose to use Palladio Component Modeling (PCM) during the early phase of software development as a performance analysis technique in order to evaluate the performance of a bioinformatics system. The following subsections explain the system used as a case study and its operation according to its original design. Then, in the following subsection, PCM is explained and is used to model the performance of the original system. In the last subsection, a modified design is proposed to obtain better performance than the original one. It is modeled using PCM, and performance metrics are obtained and compared to the metrics of the original design.

3.1. Genome Comparison and Phylogenetic Analysis System

A genome comparison and phylogenetic analysis tool is used as a case study. Many tools have been developed for genome comparison and phylogenetic analysis, such as Blast [39], Clustal Omega [40], and W-IQ-TREE [39,41], none of which, however, include the availability of software artifacts to facilitate performance evaluation. Hence, a similar system has been developed and is available in [42], with the required UML diagrams.
The system under study, the genome comparison phylogenetic analysis tool, is an online tool. It is a free, open-source tool, which is user-friendly and operates on the cloud. The server hosting the application is Jelatic PaaS, which offers a 128 MiB RAM and a minimum 400 MHz processor and is scalable up to 32 Gib and 102.40 GHz. The system consists of a phylogenetic analysis module and a search module. The phylogenetic analysis module takes a genome sequence as input directly from the user or allows them choose from an external database. The input will be used in a sequence alignment task that will return the aligned sequence. The aligned sequence will be used in a phylogenetic analysis task to produce the phylogenetic tree, which will be displayed as the result. The search module is used to search for research papers regarding genomics and phylogeny, providing the option to download them and also to search and view databases in order to identify different sequences of proteins and nucleic acids, including DNA and RNA sequences.
The developers modeled the system by using UML use cases, a sequence diagram, and an activity diagram, focusing only on functional requirements, without considering performance requirements at all and without mentioning them in their design analysis. Figure 1 shows the use case diagram of the system in which the user can input the genome sequence and start the tasks. These tasks include sequence alignment, phylogenetic analysis, and output visualization. The database is responsible for inputting the sequence into the alignment if it is needed.
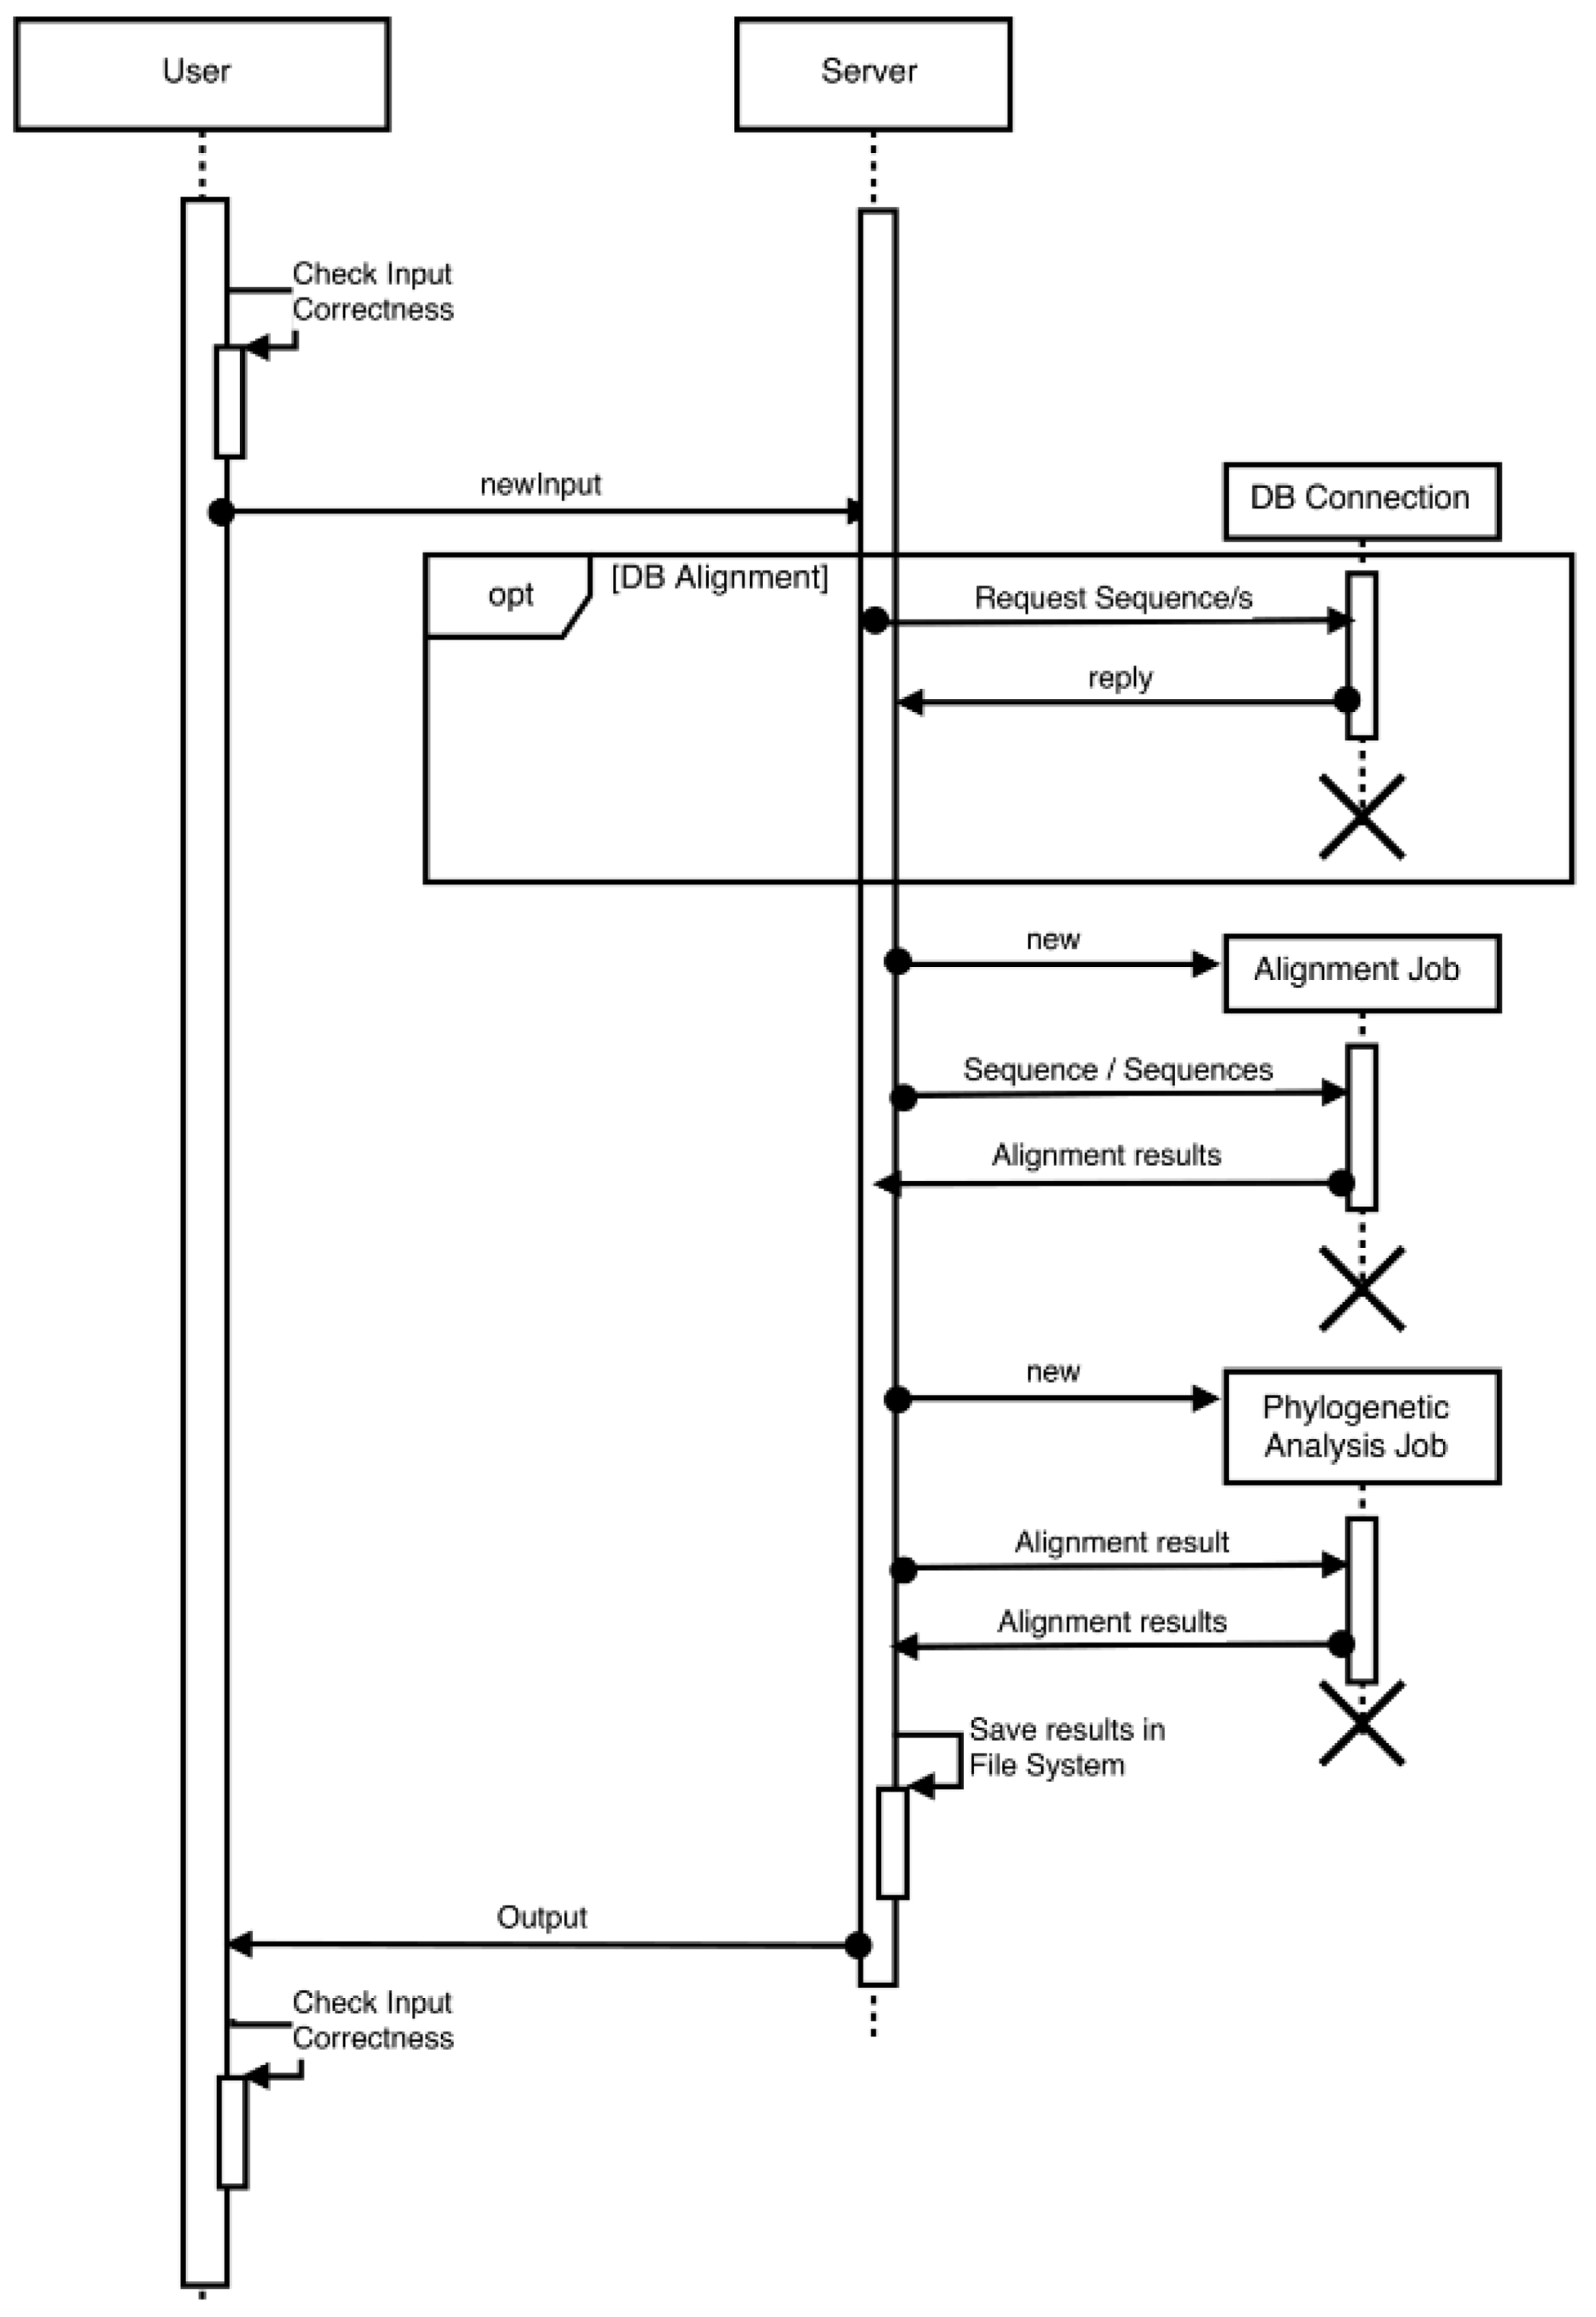
Figure 2 shows the sequence diagram of the system, illustrating the process that takes place. The diagram illustrates that the user will input the sequence; then, after being validated, it will progress to the alignment task. If a database sequence is needed, it will be retrieved from the database and inputted into the alignment job. The alignment job object is created by taking the inputted sequence and then providing its result. The result obtained from the previous job is used as input for the new job object, which is the phylogenetic analysis job. After saving the results in a file system, they will be outputted to the user.
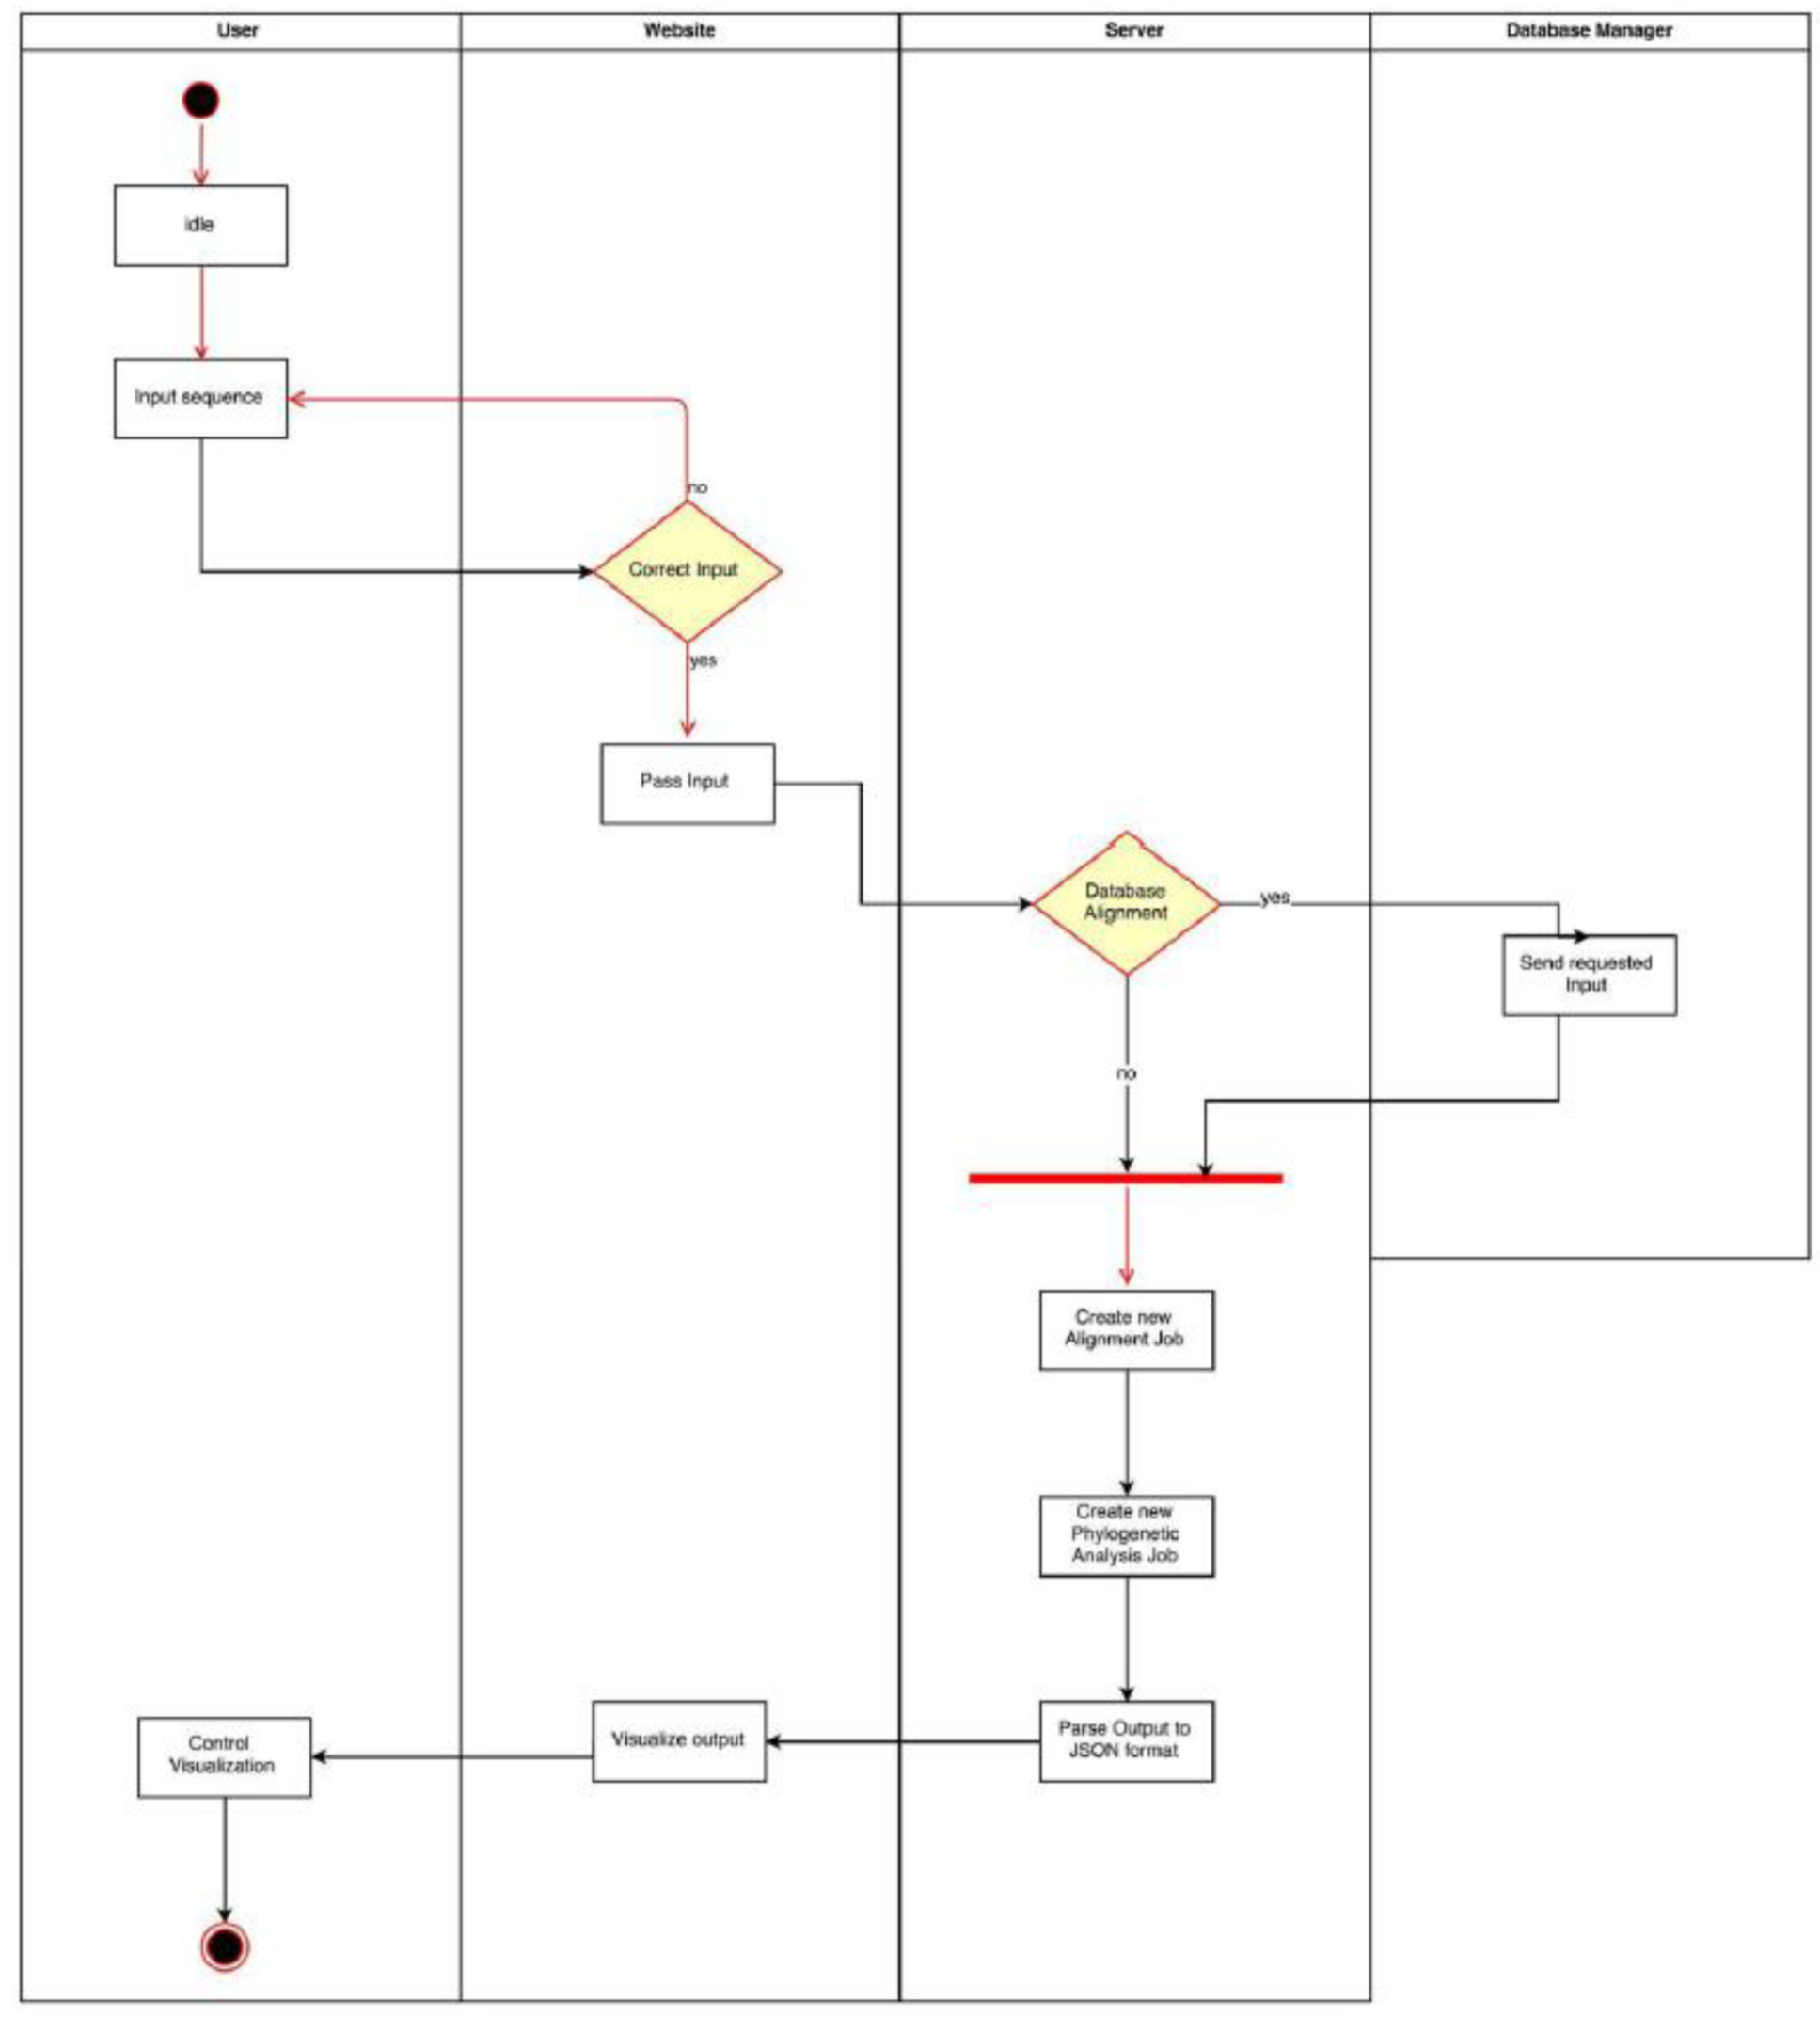
Figure 3 shows the activity diagram, where the flow of the activities of the system is defined. The diagram shows the objects, actions, and flows between actions and objects. The flows between actions and objects show the interactions and transitions, starting from the idle user to the user providing the required input for the analysis job. Then, they show the result of the phylogenetic analysis job being parsed out in JSON format. JSON is the language used for exchanging information over the web [43]. Finally, the phylogenetic tree will be visualized as the result of the system by the user.

3.2. Performance Modeling and Simulation Using PCM

The diagrams described in the previous section were used to build the PCM models. The objects shown in the activity and sequence diagrams were modeled as components in the PCM, as shown in Table 1.
The genome comparison and phylogenetic analysis system is then modeled using the PCM technique, resulting in the following diagrams: the repository diagram, the assembly diagram, the SEFF diagram, the resource environment and allocation diagram, and the usage diagram.
Figure 4, which is a part of the repository diagram, shows the components and the provided and required interfaces that allow the components to communicate with one another. The figure shows the “seqAlignJob” component, which provides the “iSeqAlign” interface, which is required by the “PhyGnAnJob” component. The roles are devised according to the actions and object flows of the activity diagram and according to the order of time sequence in the sequence diagram, and they are presented as arrows in the repository diagram.
The actions in the activity diagram will be presented as signatures on the provided interfaces. A signature is similar to a method in a programming language with a unique identifier, parameter/s, and return type. As shown in the figure, “alignSeq” is the action performed by the “seqAlignJob”, and “phGnResult” is the action performed by “phGnAnJob”. The name of the signatures appears in the SEFF compartment of the component; this will open the SEFF diagram of the signatures.
Furthermore, the repository contains the defined data types, “FileContent”, which defines the type of files that have been parsed out from the phylogenetic analysis result.
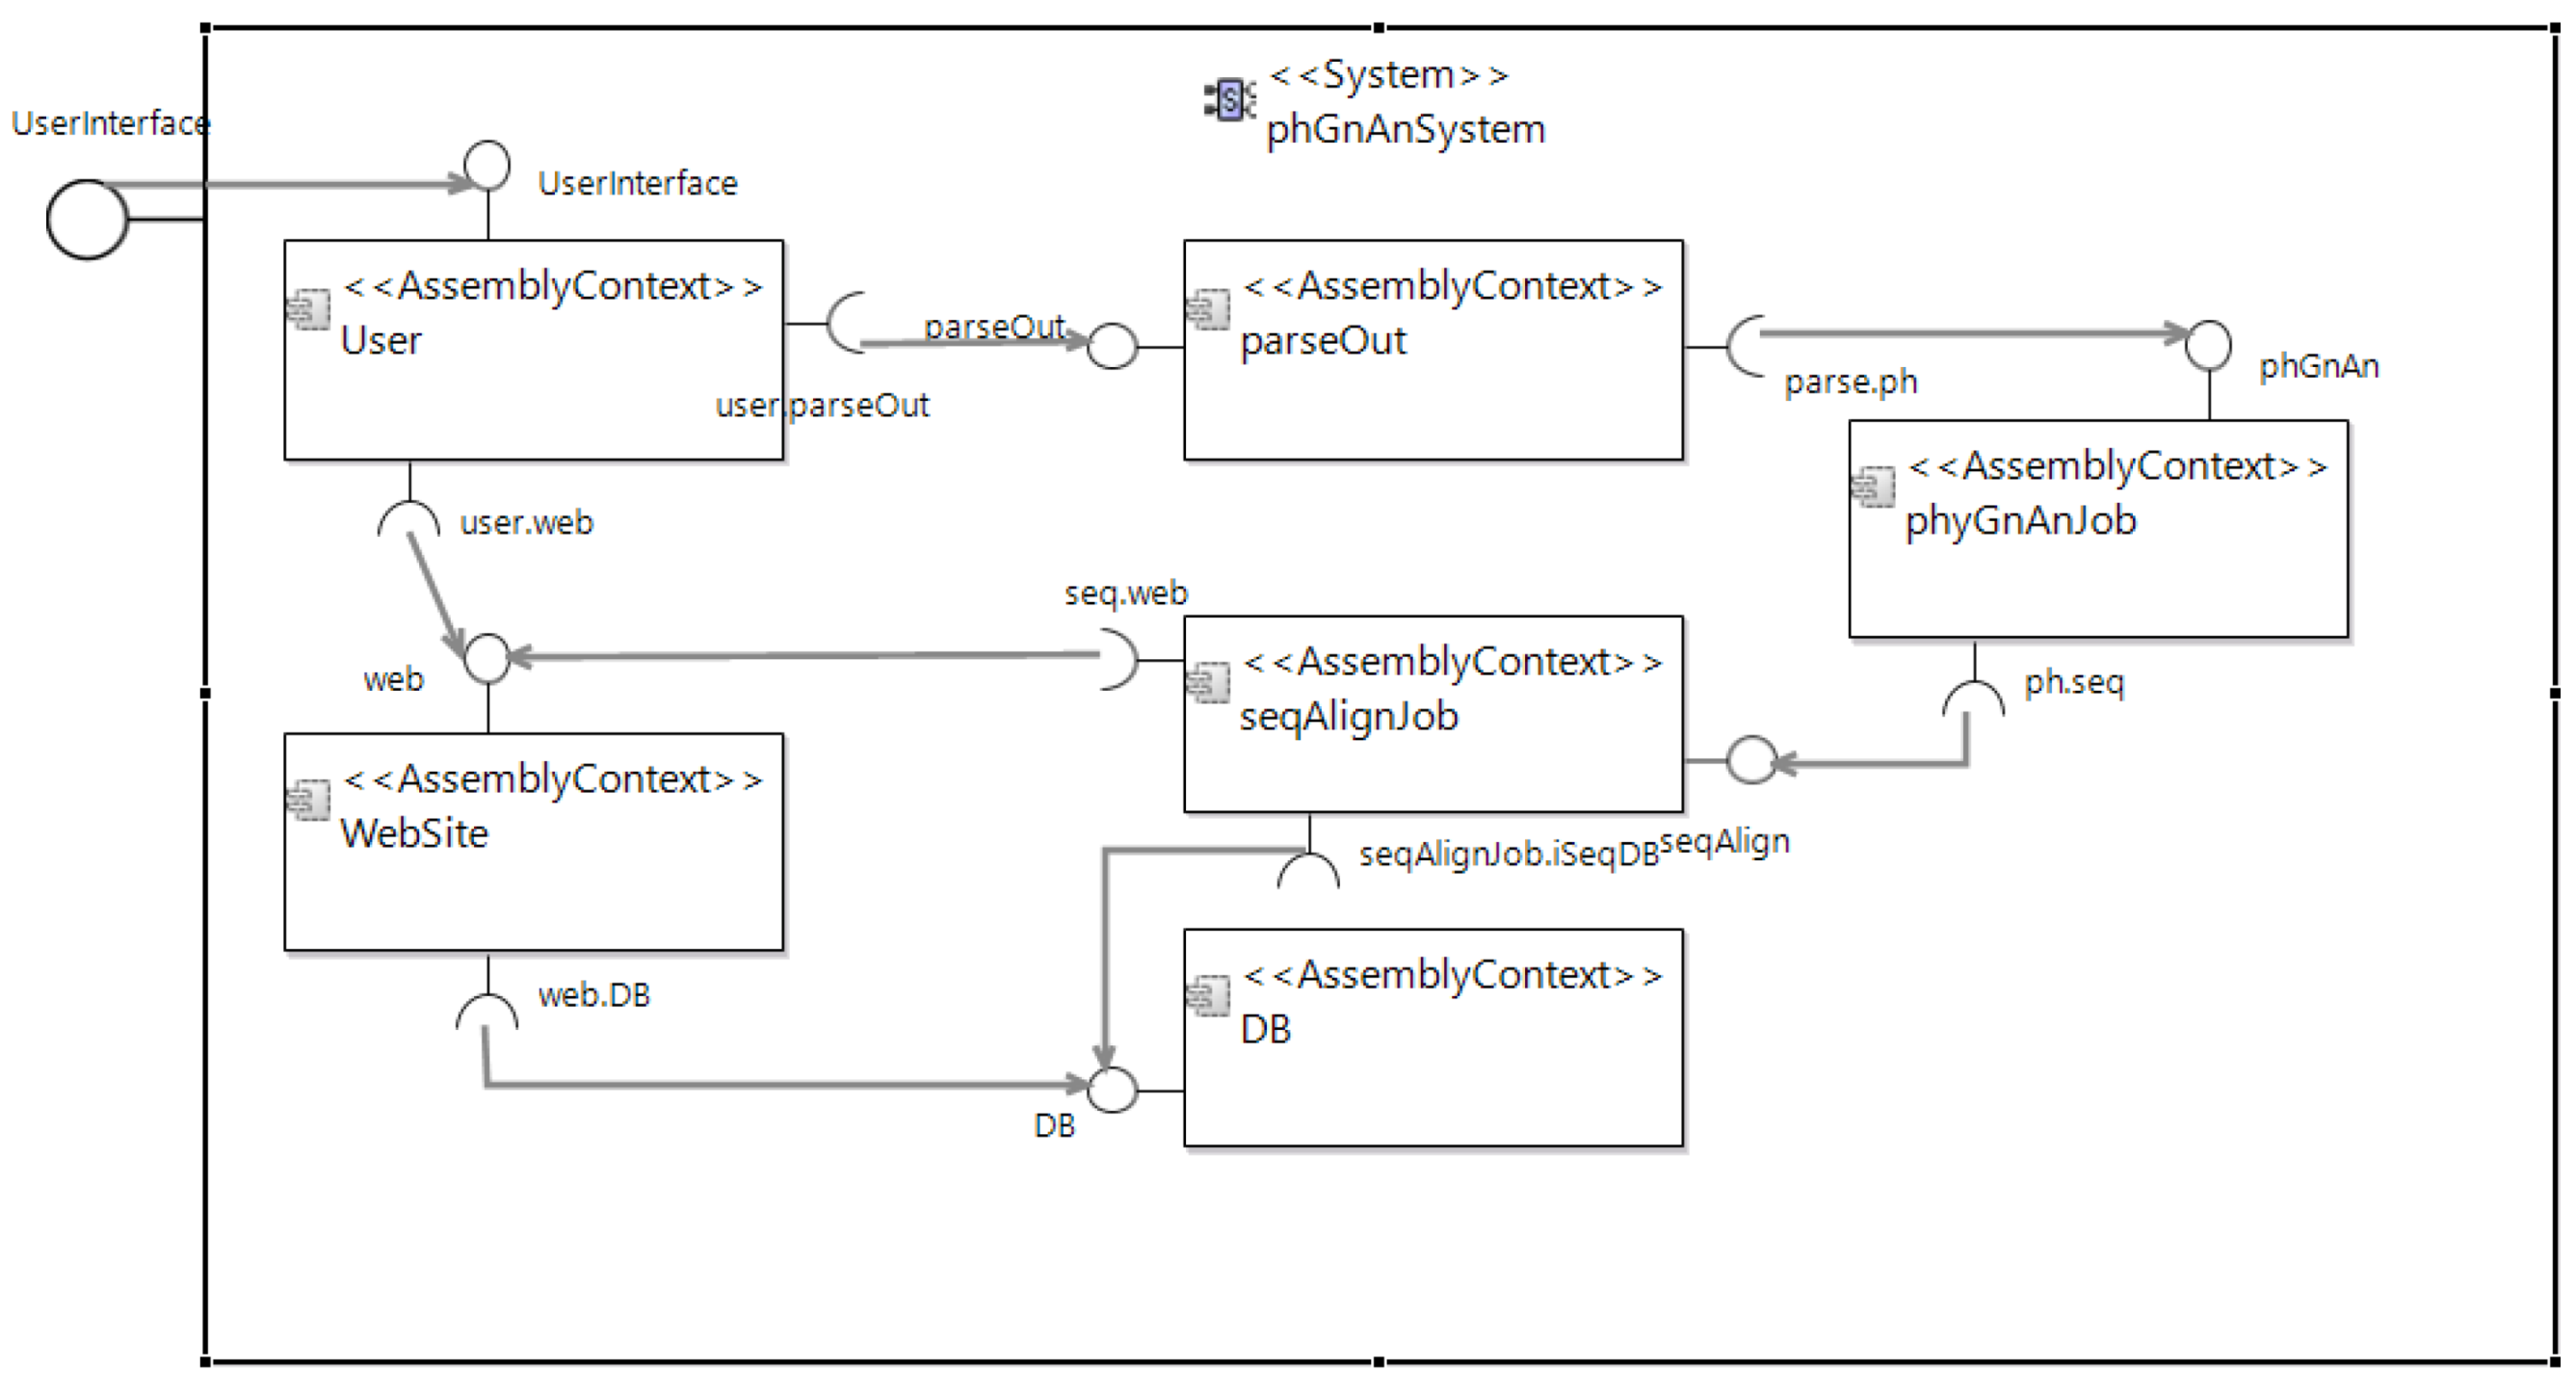
Figure 5 shows the assembly diagram, which contains all the components, interfaces, and roles in the system. Components are represented as rectangles, the provided interfaces as a closed circle and solid line, and the required interfaces as a semi-circle and a solid line. The roles are the arrows that point from the requiring interface to the provided one.
Figure 6 shows the SEFF diagram for the “alignSeq” signature. The diagram shows how the function starts by obtaining the input provided by the user. The “passInput” signature provided by the “webSite” component is responsible for sending the sequence as output to the “alignSeq”. The input will be used to perform the function internally; it should be noted that the processor speed depends on the “BYTESIZE” of this output. “BYTESIZE” represents the number of bytes in the memory for the string variables. The function will return the aligned sequence as a variable, “alignedSeq”, which will be used in the same way in the “phGnAnResults” signature. Consequently, functions will continue to be processed until the final result, which is the phylogenetic tree, is obtained.
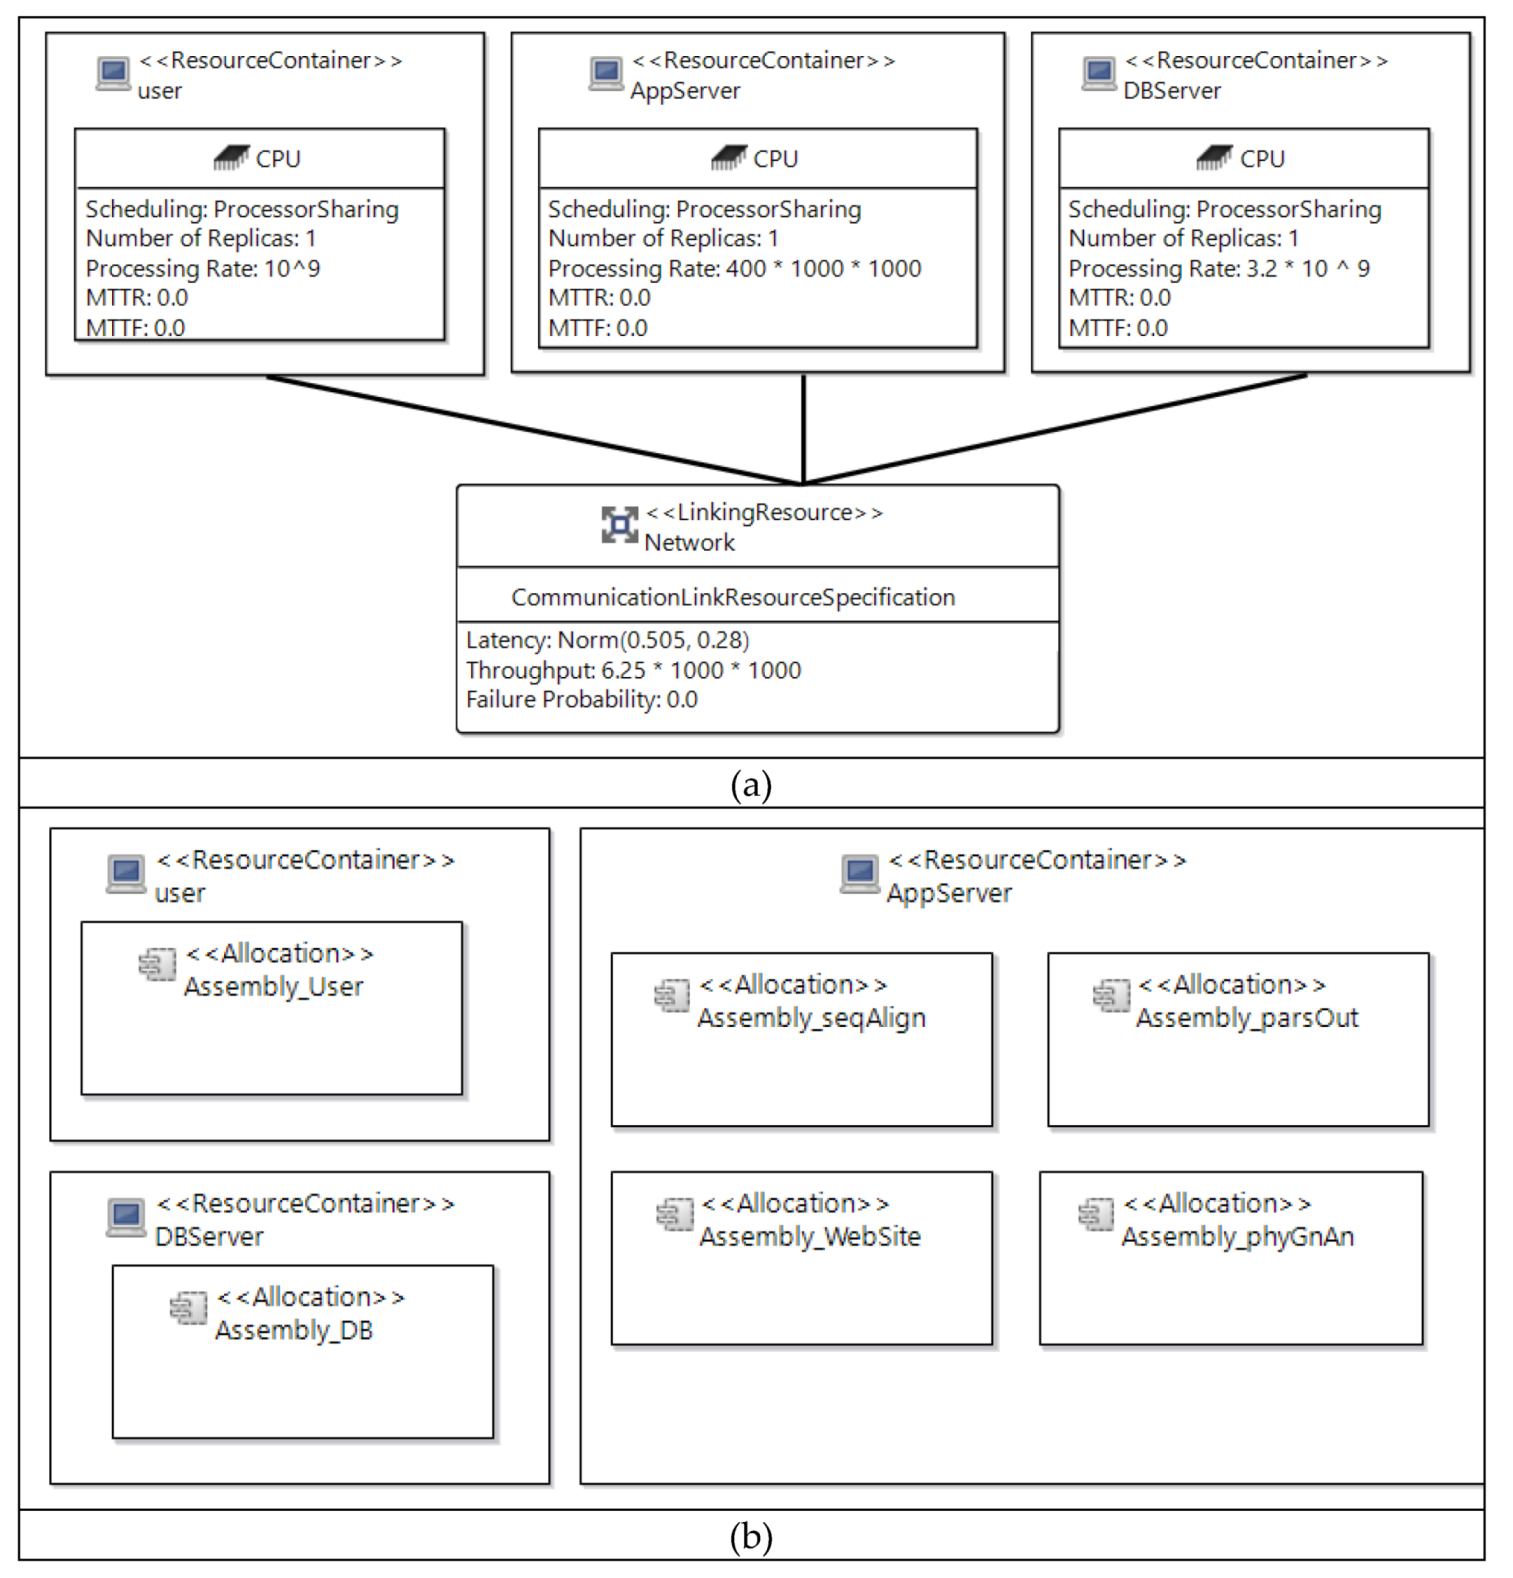
Figure 7a shows the resource environment diagram, in which the servers and network are presented. Each server contains the CPU specifications defining its properties. The “user” resource container represents the device that the user is using while operating the system. The CPU processing rate is defined as 1 GHz “10^9”, which is the minimum requirement for a personal computer to connect to the internet under Windows 7 OS.
The “AppServer” represents the Jelastic Paas server mentioned earlier, using its minimum value of 400 MHz “400*1000*1000”. The scheduling value is set to “ProcessorSharing”, which means that the jobs that arrive will be fulfilled concurrently and each of them will receive an equal portion of the service size provided. The same is carried out for the database server “DBServer” CPU, defining all the properties needed to estimate the performance of the system as follows: CPU scheduling value “ProcessorSharing” and processing rate equals 3.2 GHz “3.2*10^9”, which is the average processing rate for different databases, such as Oracle, IBM, and others. The “Network” connecting them has the latency measured in normal distribution “Norm(0.505,0.28)” and a throughput of 6.25 MB “6.25*1000*1000”. The network latency is not fixed because it depends on several factors, such as transmission mediums, propagation, routers, and others. The location of each component is shown in Figure 7b, where the user is located on its resource, the database is located on the database server, and all other components are located on the application server.
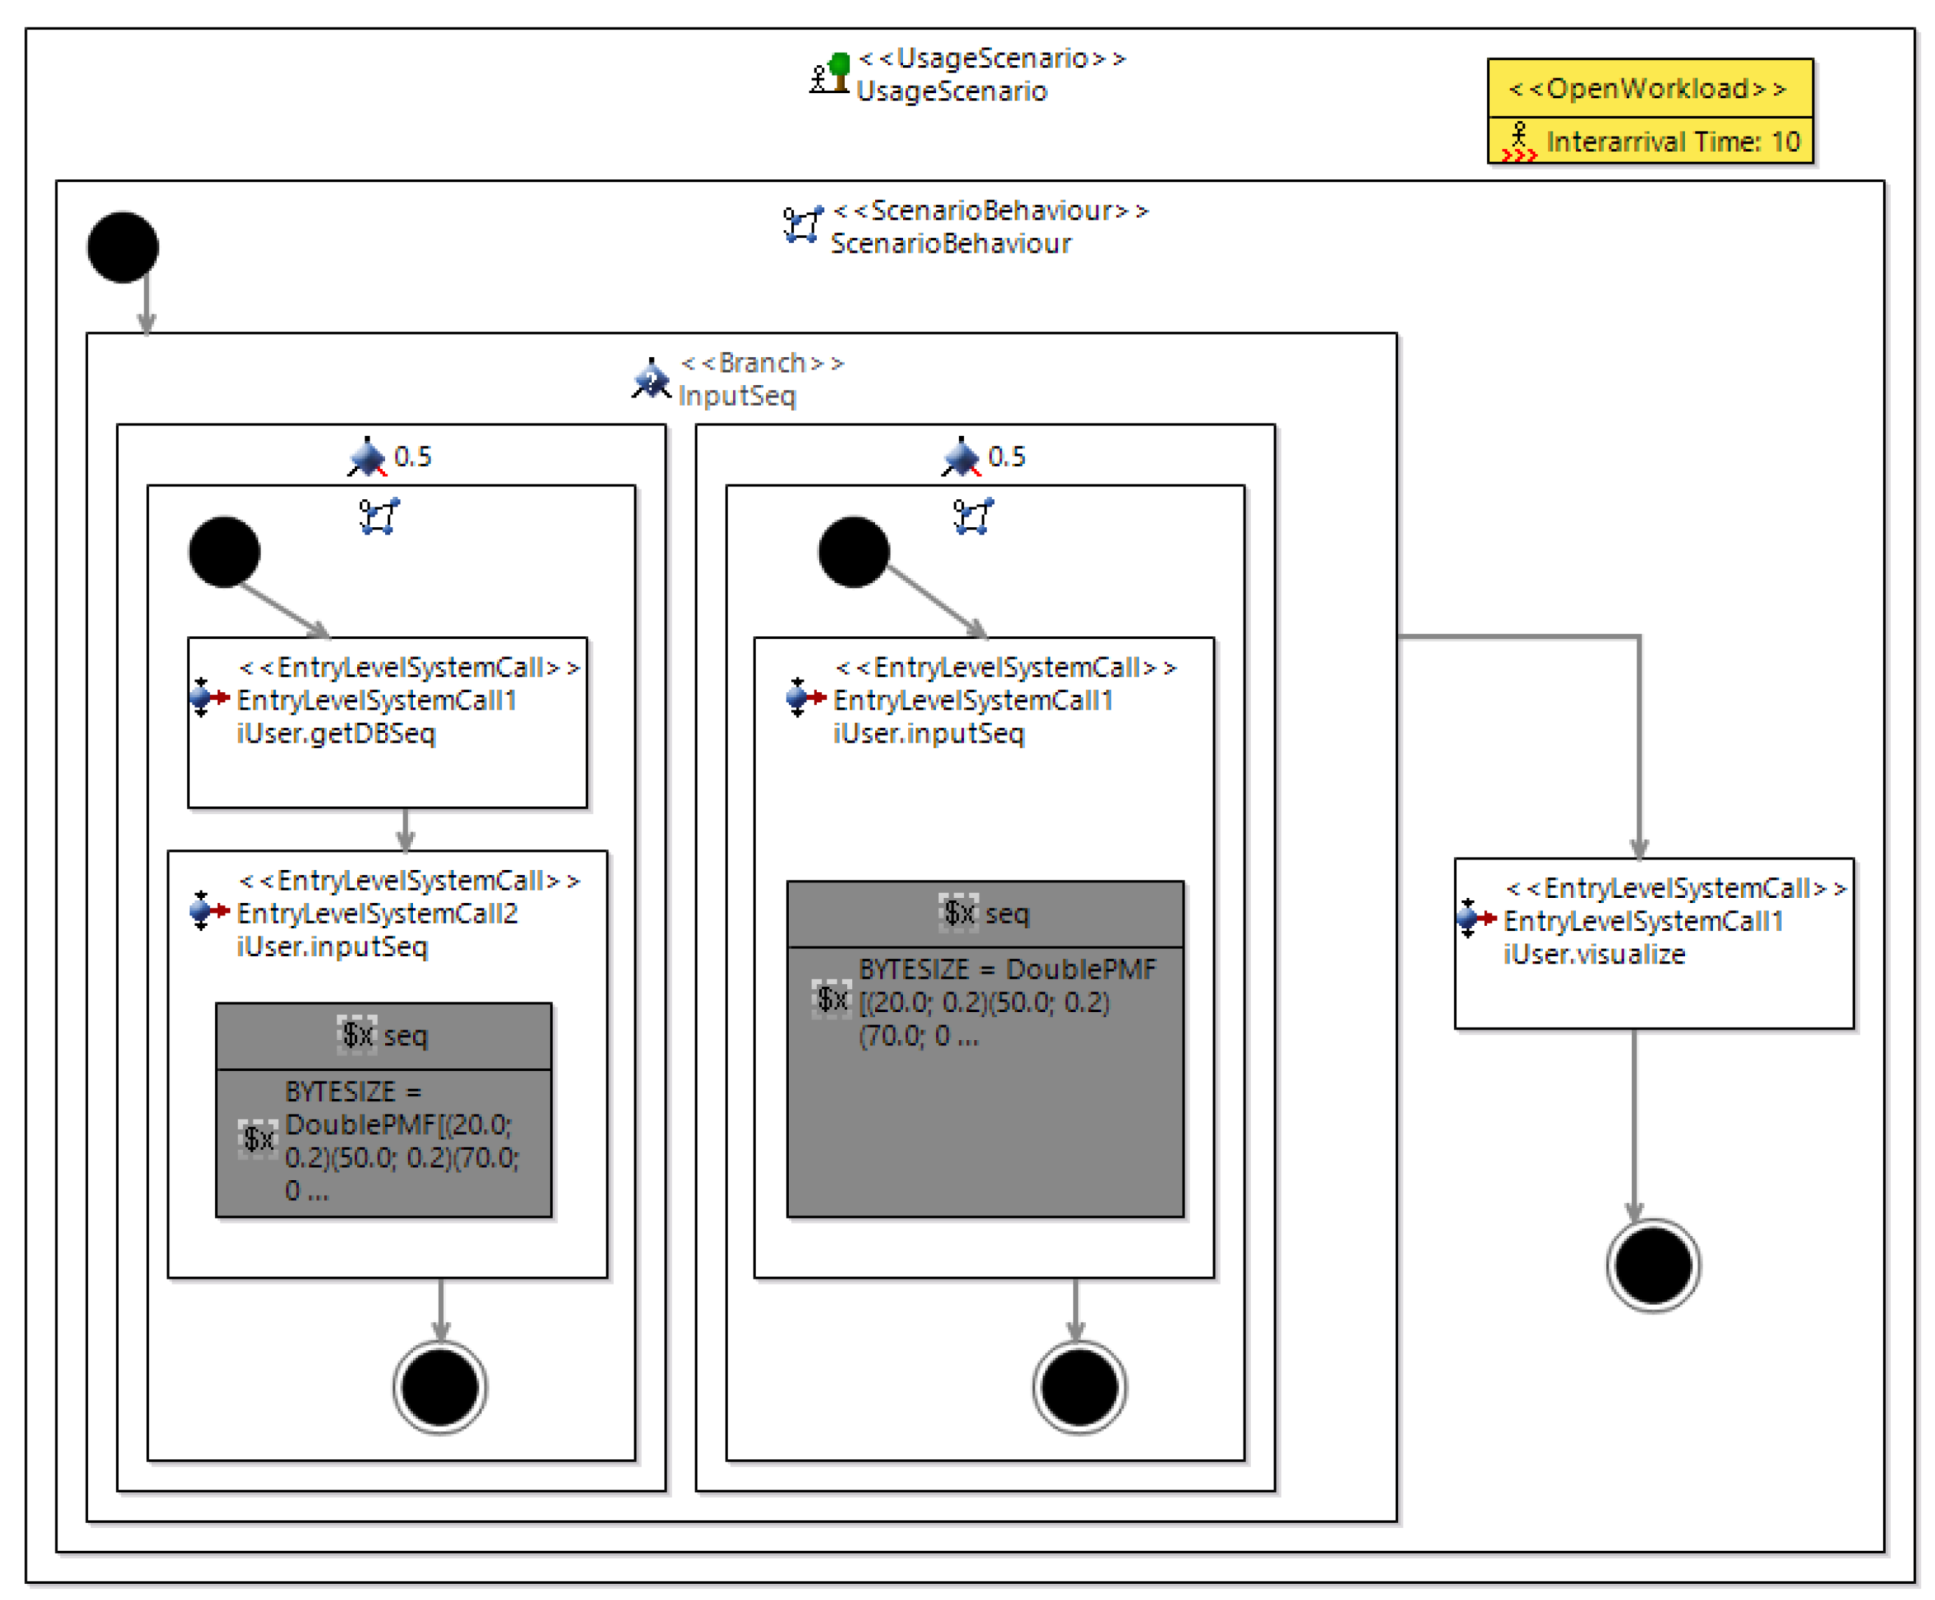
Figure 8 shows the usage model diagram, demonstrating that the user can input a sequence directly or choose from a database first, each with a probability of 50%. Furthermore, it shows that the user can see the output of the analysis using the “visualize” function. In an open workload, users continue to arrive, regardless of the number of concurrent users inside the system. Each time an agent is produced to execute the behavior (job) “inputSeq or getDBSeq then inputSeq”, the agents are terminated after completing the behavior. The interarrival time is the time between one behavior and another, which is set to “10” s.
In the end, the simulation was run using the SimuCom simulator embedded in the PCM. This tool creates a simulation using an object of the PCM as an XMI serialization in order to determine the response time metrics under the defined workloads. These metrics will be compared with the results after modifying the system. The PCM simulator transforms the models into a discrete event of a Generalized Queueing Network (GQN) that produces performance metrics without using plugins or other tools. The simulation runs under a maximum simulation time of 15,000 and a maximum measures count of 1000.
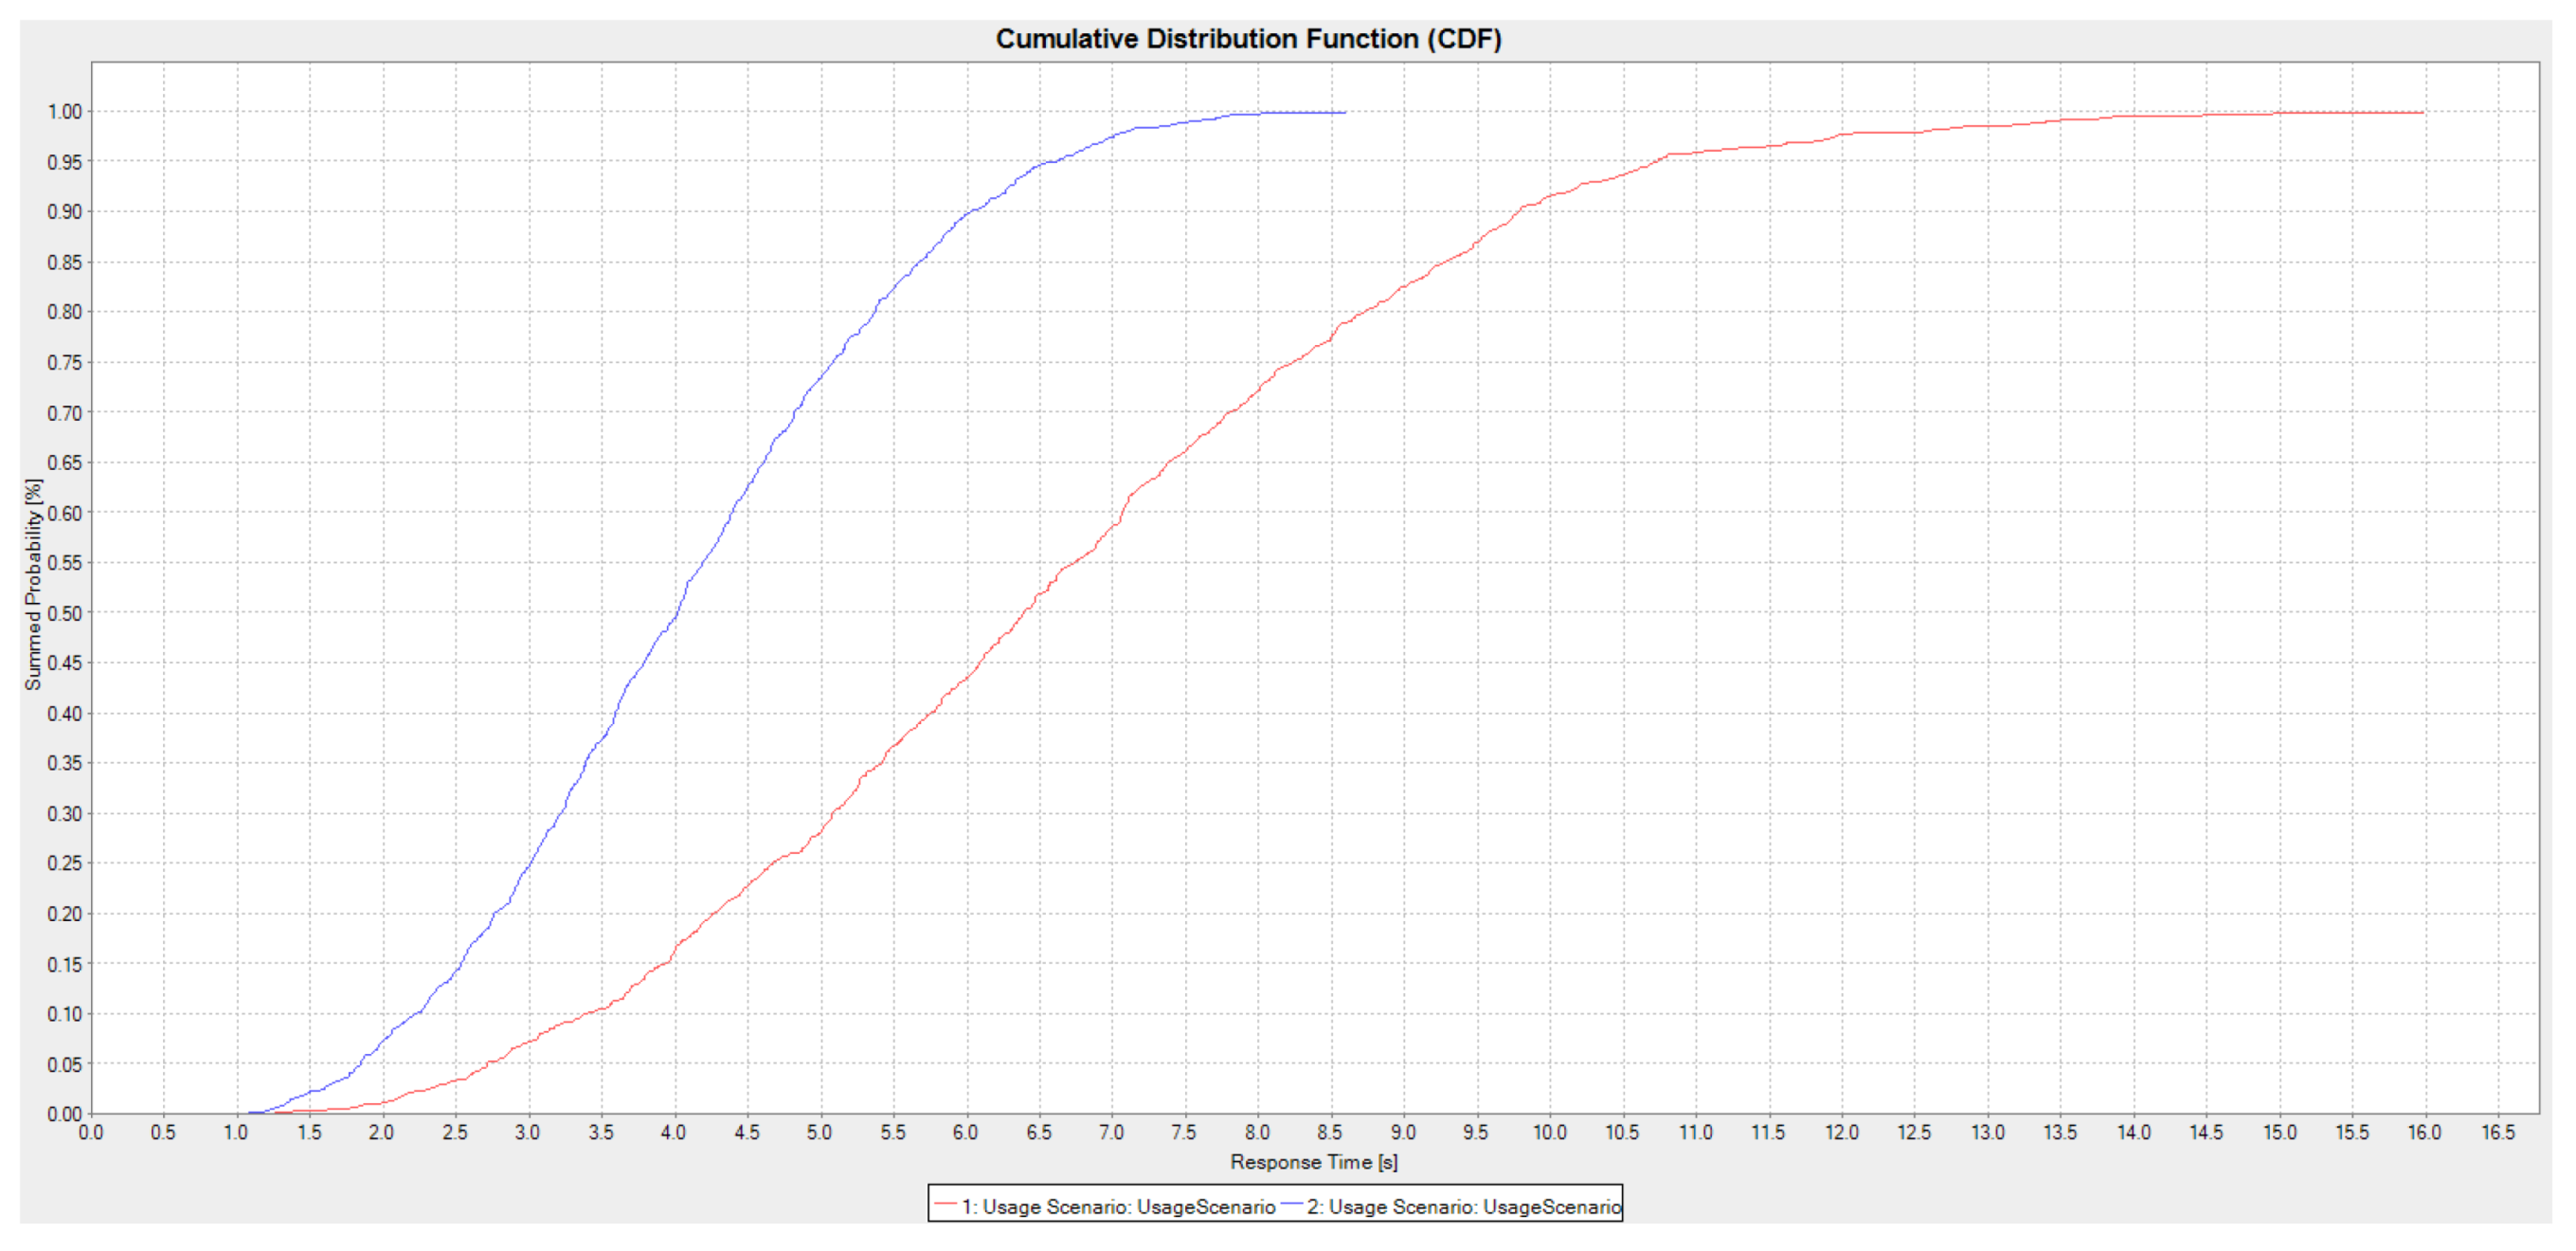
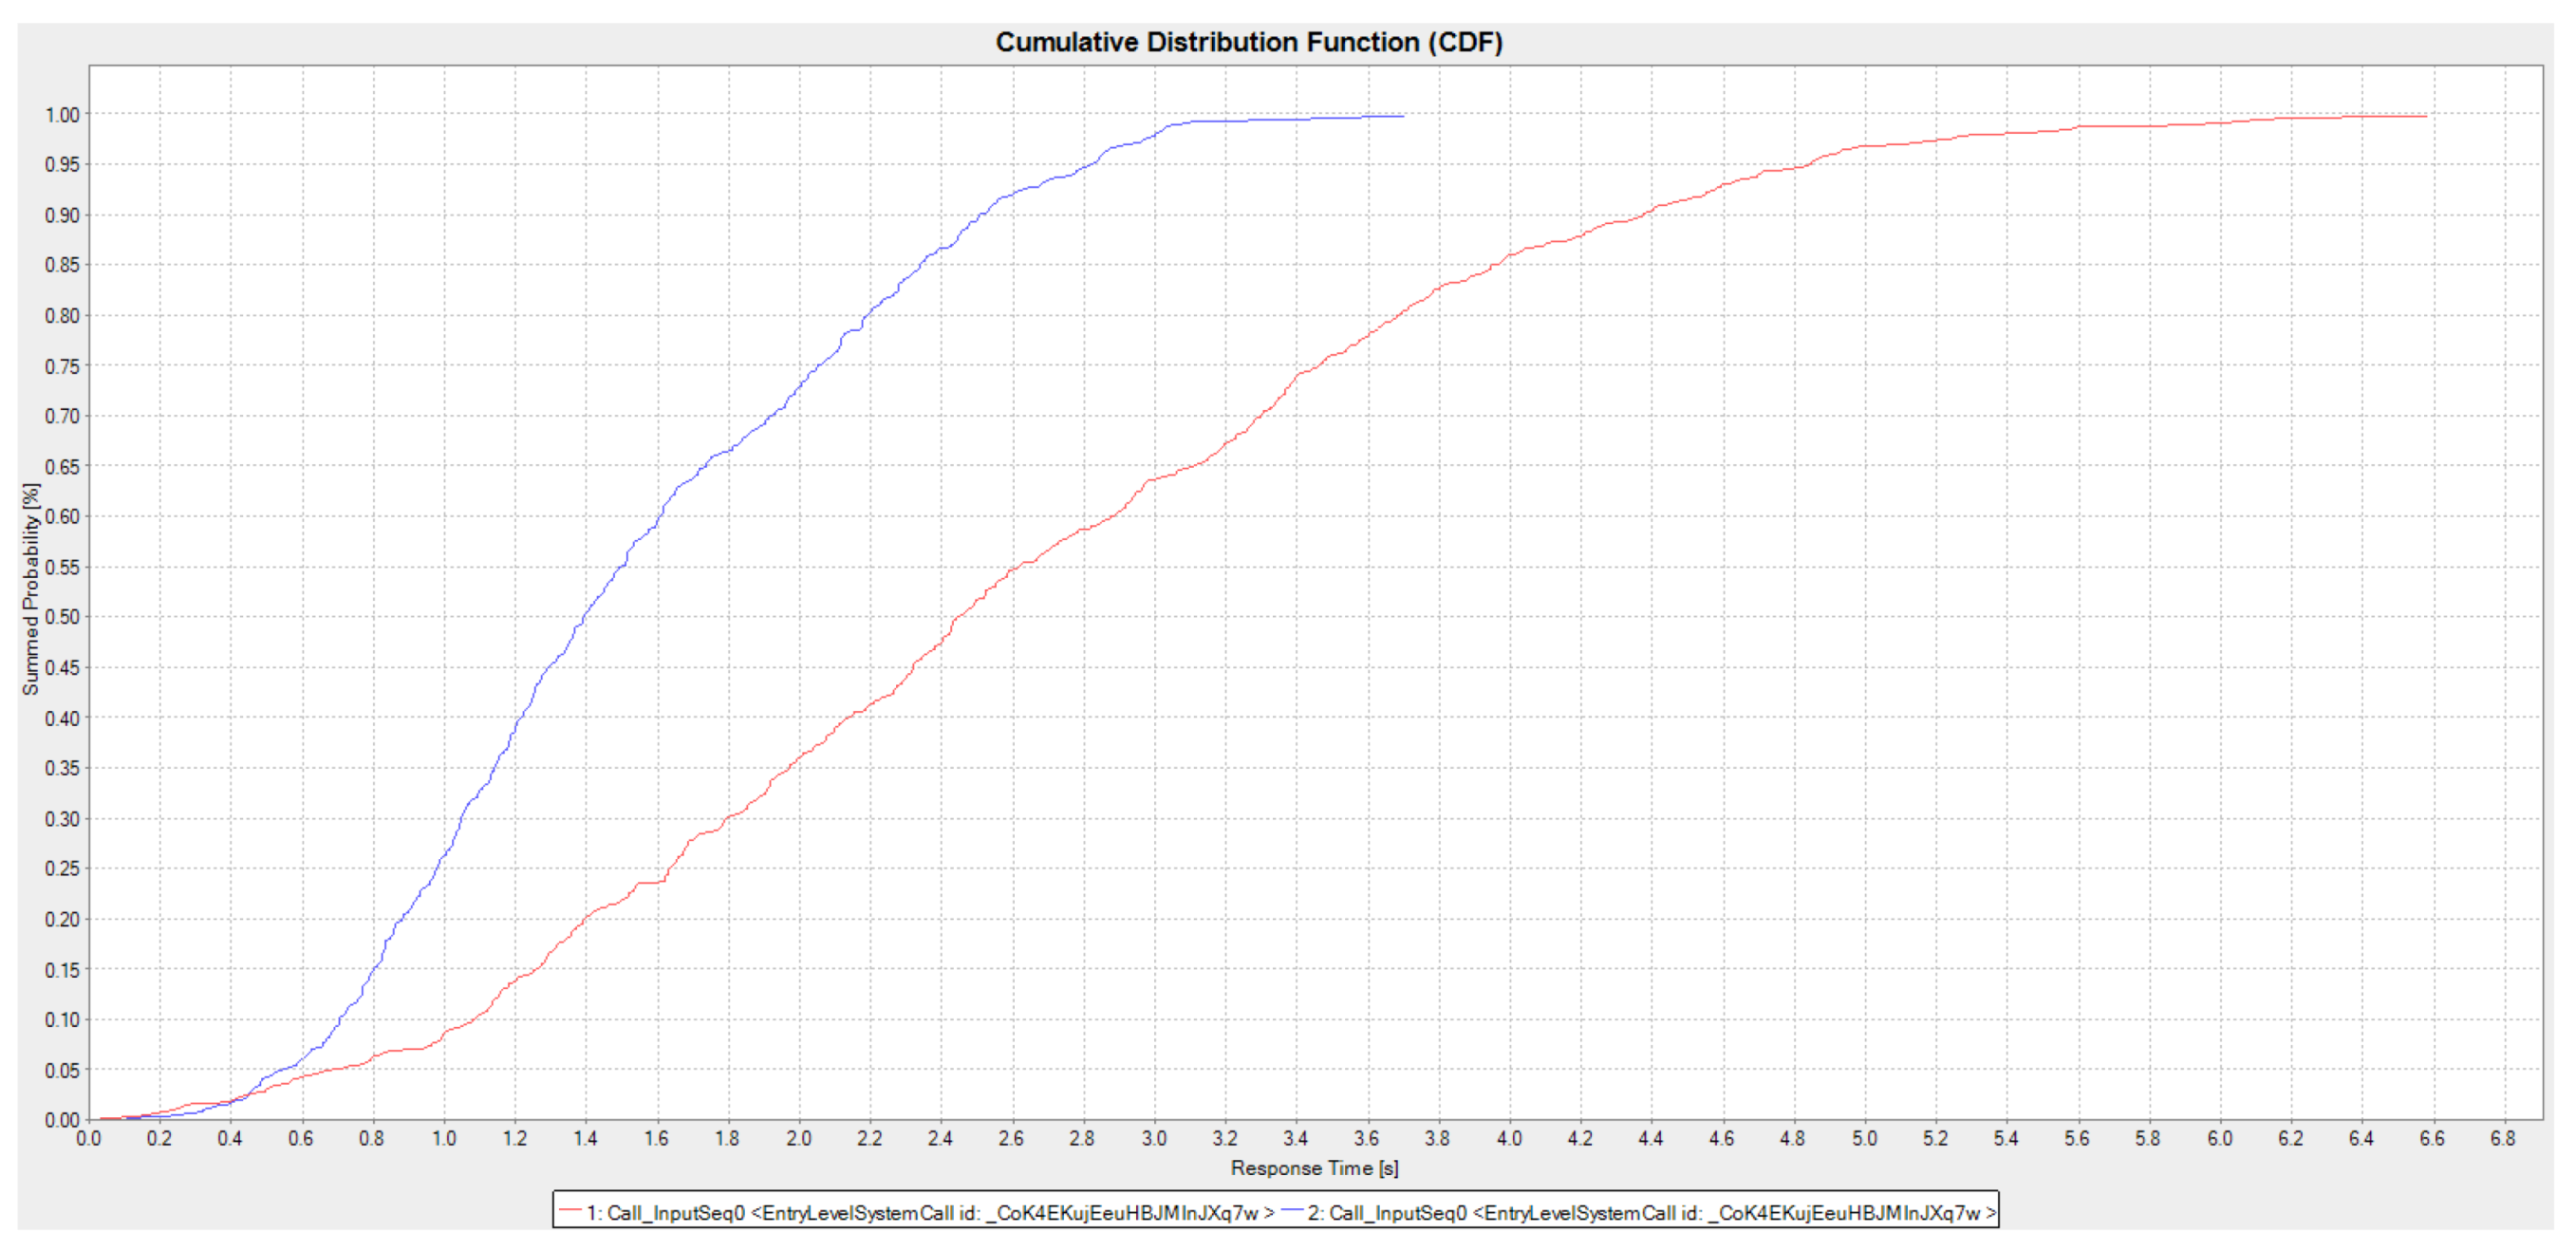
The performance metric obtained for the usage scenario indicates that the overall response time is up to 16 s. Moreover, the response time of the “passInput” function that submits the entered sequence to the “alignSeq” function shows a maximum response time of 6.6 s. The results indicate that the former function is responsible for the slow response time, as it takes around half the time before the user can obtain the output.

3.3. Proposed Alternative Design

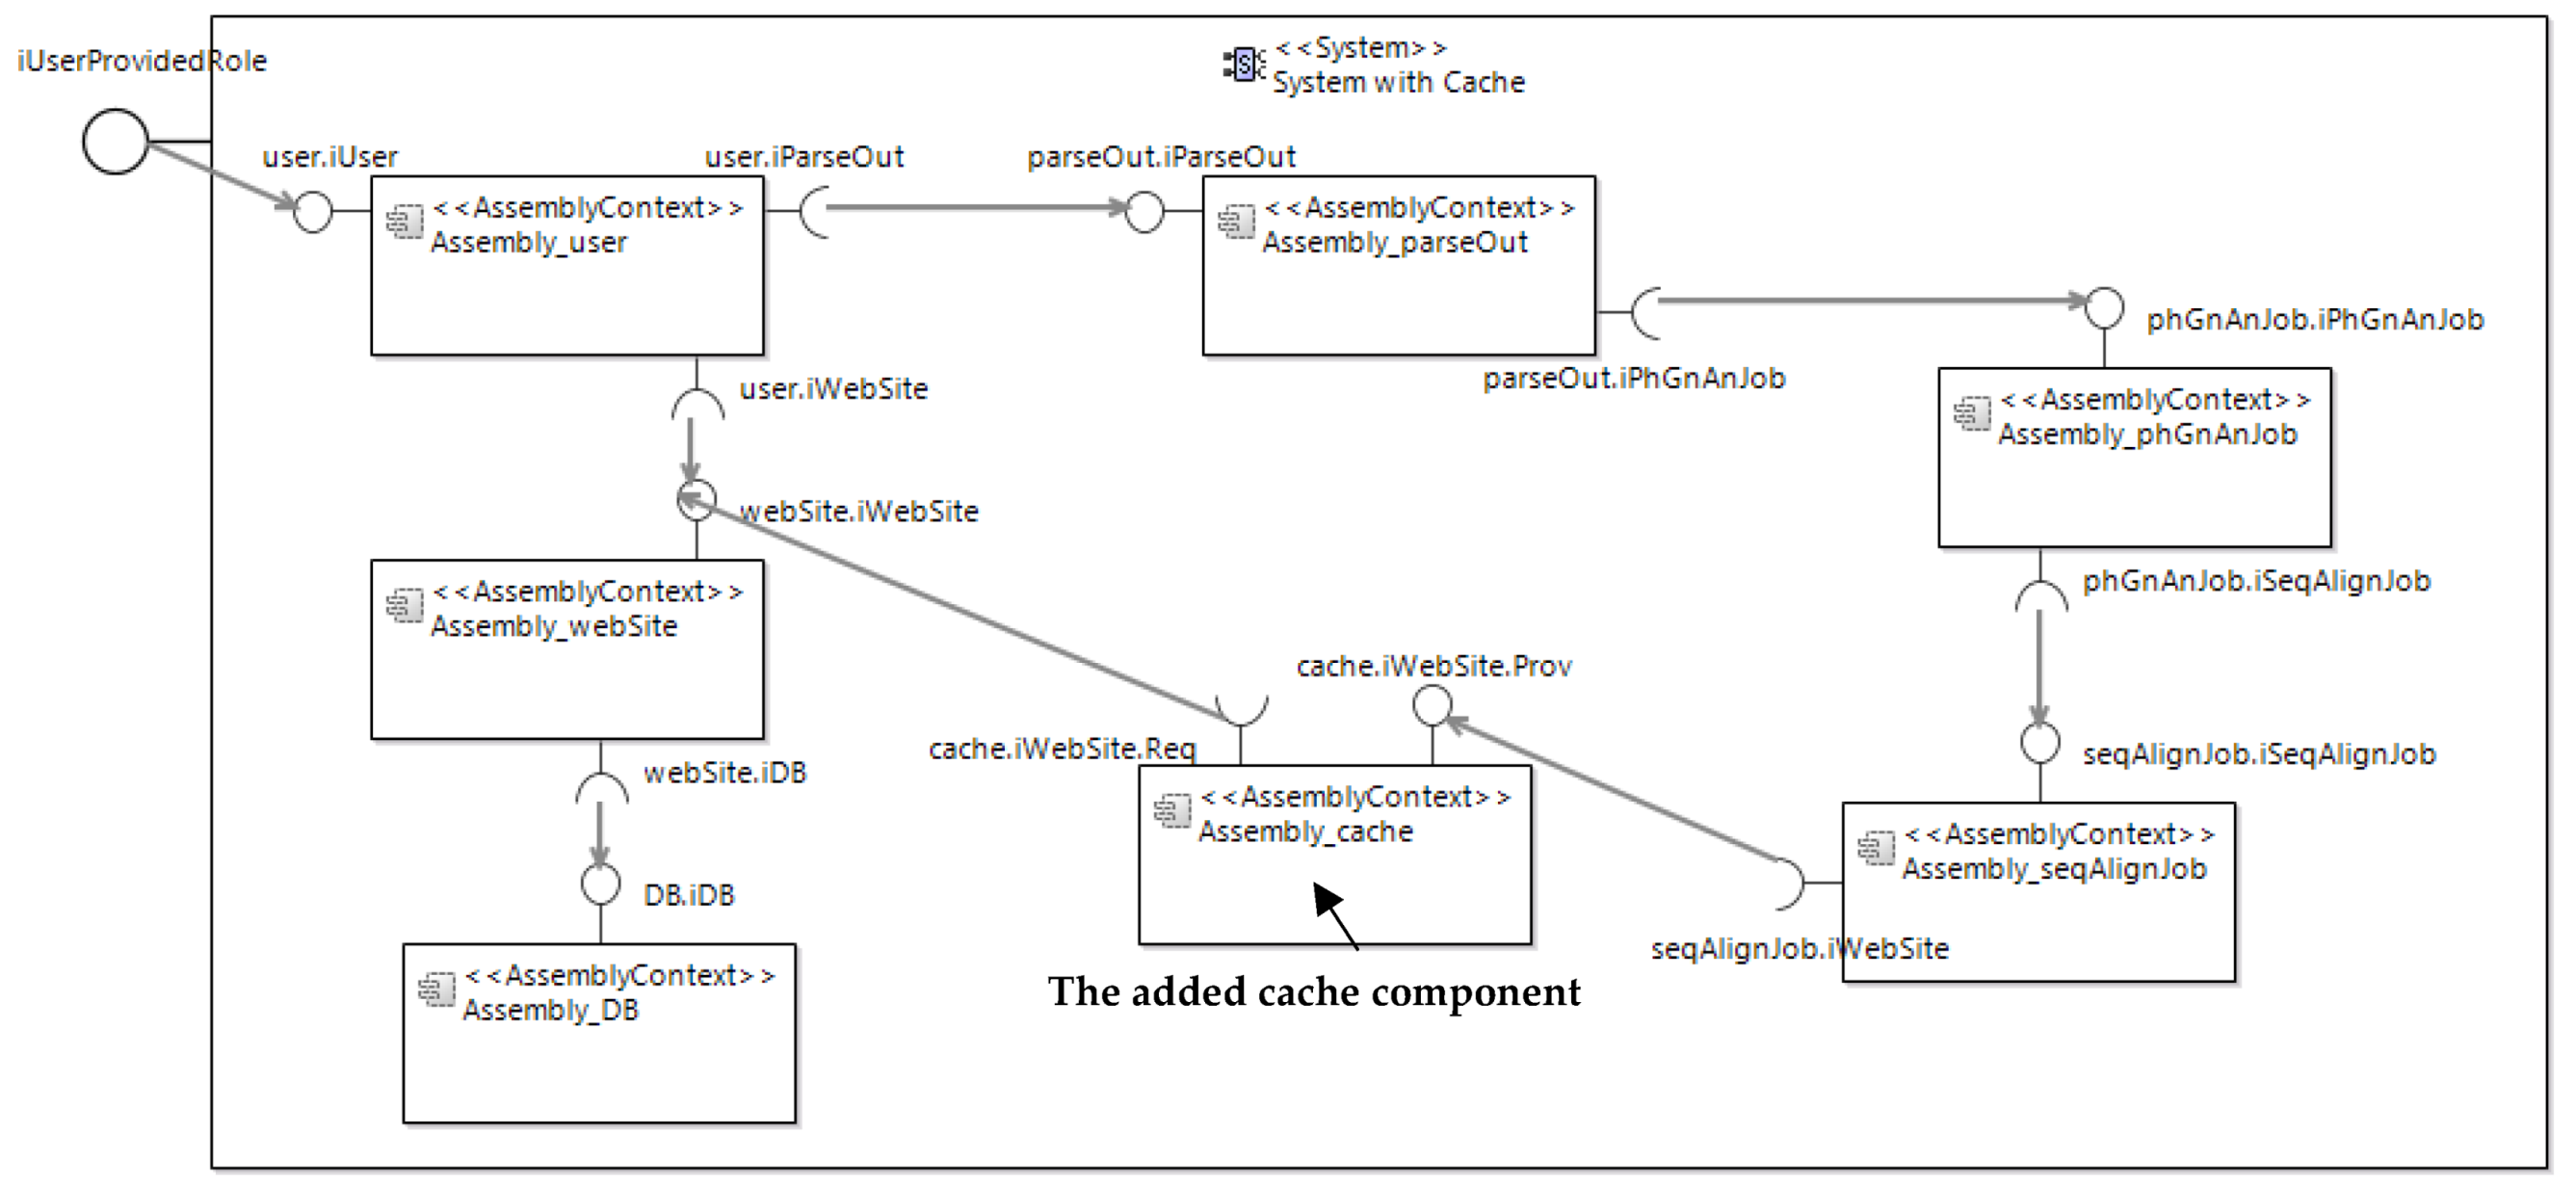
Seeking a better response time for the phylogenetic analysis system, an enhanced design alternative is applied to the system. As the user interface and the database are deployed on different servers rather than the application server, this means that every time an input is performed on a file, the system sends this file across the network connection between the two servers. To reduce the overhead as a result of the recurring network transfer, a cache component is presented on the application server. The data stored in the cache are the result of an earlier passing from the users or the database. When the requested data are located in a cache (i.e., a cache hit), they will be passed onto the next job. Otherwise, when a cache miss occurs, data will be added to the cache for further use. By applying this concept, data will not be transferred across the network connection every time they are accessed.
Figure 9 shows the assembly diagram after adding the cache component, with all the modifications needed in the interfaces and roles. The cache component will be responsible for providing and requiring the interface containing the “passInput” and “getDBSeq” functions. The interface will provide the cache with the files retrieved from the database and provided by the user. These files must be retrieved faster than when obtaining them from the user or database every time. Moreover, the cache is added to the allocation diagram, indicating that it will be deployed on the application server “AppServer”, previously shown in Figure 7b.

4. Results

The genome comparison and phylogenetic analysis system is modeled using the component-based software engineering tool PCM, where all the models are annotated with the data needed to achieve the required performance metric. Overall, the response time is shown to be the most important metric needed, and it is denoted by the word “performance”. The results are given in the form of response time measurements. The simulation is performed for the modified model, as mentioned in Section 3.2.
The results are compared with those from the original architecture. Figure 10 shows the response time curve of the usage scenario according to the original architecture in red, and the new response time curve after adding the cache component in blue. The results show that adding the cache component to the system enhances its response time. For example, in the graph, 50% of the overall operation takes less than 4.0 s with the cache component, while in the original architecture, it takes less than 6.5 s.
Figure 11 shows the results of comparing the “passInput” function, which has a significant impact on the slow response time of the system. The results show an improvement in the response time as, in the original architecture, the maximum response time is approximately 6.6 s, but with the cache, the maximum response time is approximately 3.7 s.
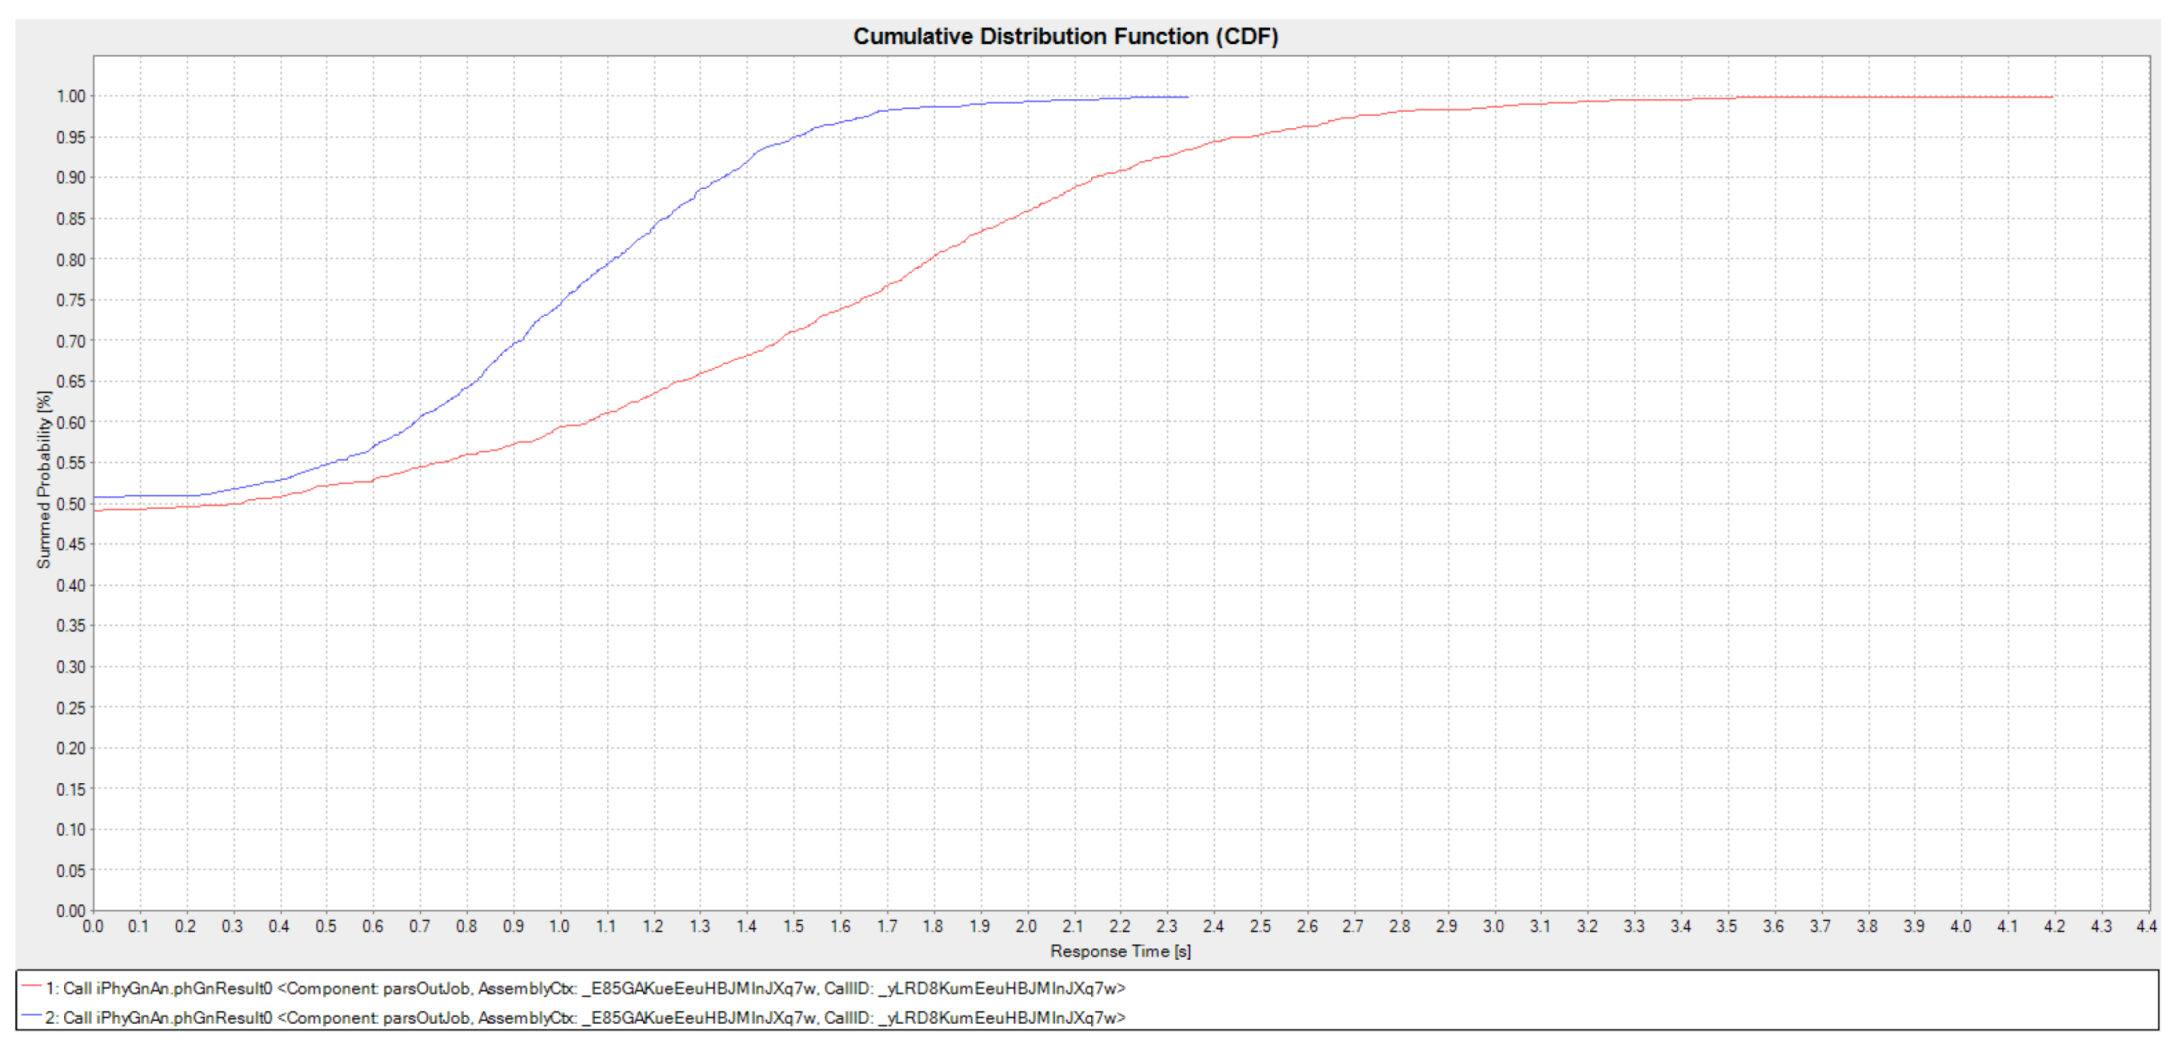
Furthermore, all the internal functions were affected by the modification, as shown in Figure 12, which shows the “phGnResult” function, which takes the output of the sequence alignment to apply phylogenetic analysis and produce the result to be shown as the phylogenetic tree to the user after parsing.
All the result graphs show that the alternative design with the cache component has a superior response time, indicating that it provides better performance.

5. Discussion

Conducting Palladio Component Modeling (PCM) for the phylogenetic analysis system, the analysis of the obtained results shows that the response time of some functions affects the performance negatively. This design of the system prevents it from achieving the required performance level. These functions’ results require around half of the whole response time of the system. The functions that need access to the database were affecting the system’s overall performance. The location of the database on another server, separate from the application, creates more traffic on the network. The modified design of the system, with the cache component located on the same server as the application, makes it easier and faster to retrieve the files from it. With the modified design, the functions show improvements; for example, for the “getDBseq” function, which fetches the files from the database, the response time was initially 5.6 s and was improved to reach 2.3 s; moreover, for the “passInput” function, the maximum response time was initially 6.6 s and became 3.7 s. For the original design, the result was approximately 16 s for the whole operation, which is acceptable performance; however, in bioinformatics systems, a faster response is required. Therefore, the alternative design was modeled to obtain better results. The performance was recorded to be 8.6 s for the system, which is considered a good response time. The performance improvement was achieved during the design phase in order to ensure that the performance requirements are fulfilled before the system is implemented. This aids in saving time and power during later phases.

6. Conclusions

In this paper, we use Palladio Component Modelling (PCM) as a performance analysis technique to evaluate the performance of a bioinformatics system in the early phases of development. Bioinformatics is a field of study that solves biological problems using computers. This field suffers from a lack of software performance engineering. Modeling a system and conducting performance analysis in the early stages of the SDLC ensures that the best performance possible is achieved. PCM is a component-based modeling tool that is designed for performance evaluation. In this paper, a phylogenetic analysis system that did not take performance into consideration in its original design is modeled using PCM. Then, another system design is presented and a better response time is obtained. In conclusion, using software performance analysis with PCM seems to improve the likelihood of achieving performance goals for a phylogenetic analysis system.
Future research should further confirm the importance of including software engineering skills while developing bioinformatics systems. This could be achieved by developing a framework including performance-annotated design architectures and design patterns that are suitable and specifically designed for different bioinformatics systems in order to ensure that they achieve the best performance.

Author Contributions

Writing—original draft preparation, D.M.T.D.; writing—review and editing, D.M.T.D.; supervision, N.A.B. and W.A. All authors have read and agreed to the published version of the manuscript.

Funding

This research received no external funding.

Conflicts of Interest

The authors declare no conflict of interest.

References

  1. Smith, C.U.; Williams, L.G. Software performance engineering. In Encyclopedia of Software Engineering; John Wiley & Sons, Inc.: Hoboken, NJ, USA, 2003; pp. 794–810. [Google Scholar]
  2. Verma, K.K.; Solanki, A.K. A Novel Performance Analysis Technique Using Modeling and Refactoring for Software Architecture. In Proceedings of the International Conference on Advances in Engineering Science Management & Technology (ICAESMT), Uttaranchal University, Dehradun, India, 14–15 March 2019. [Google Scholar]
  3. Woodside, M.; Franks, G.; Petriu, D.C. The Future of Software Performance Engineering. In Proceedings of the FOSE’07, Minneapolis, MN, USA, 23–25 May 2007; pp. 171–187. [Google Scholar]
  4. NCBI. Available online: https://www.ncbi.nlm.nih.gov/books/NBK44939/ (accessed on 30 April 2021).
  5. Xia, X. Comparative genomics. In Handbook of Statistical Bioinformatics; Springer: Berlin/Heidelberg, Germany, 2011; pp. 567–600. [Google Scholar]
  6. Jarvis, P.D.; Holl, B.R.; Sumner, J.G. Phylogenetic invariants and Markov invariants. In Reference Module in Life Sciences; Elsevier: Amsterdam, The Netherlands, 2017. [Google Scholar]
  7. Ashley, E. Towards precision medicine. Nat. Rev. Genet. 2016, 17, 507–522. [Google Scholar] [CrossRef]
  8. Huang, W.; Umbach, D.M.; Li, L. Accurate anchoring alignment of divergent sequences. Bioinformatics 2006, 22, 29–34. [Google Scholar] [CrossRef] [PubMed] [Green Version]
  9. Pollard, D.A.; Bergman, C.M.; Stoye, J.; Celniker, S.E.; Eisen, M.B. Benchmarking tools for the alignment of functional noncoding DNA. BMC Bioinform. 2004, 5, 6. [Google Scholar]
  10. Okonechnikov, K.; Golosova, O.; Fursov, M. Unipro UGENE: A unified bioinformatics toolkit. Bioinformatics 2012, 28, 1166–1167. [Google Scholar] [PubMed] [Green Version]
  11. Negoita, G.A. High Performance Computing Applications: Inter-Process Communication, Workflow Optimization, and Deep Learning for Computational Nuclear Physics. Ph.D. Thesis, Iowa State University, Ames, IA, USA, 2018. [Google Scholar]
  12. Ayres, D.L.; Cummings, M.P.; Baele, G.; Darling, A.E.; Lewis, P.O.; Swofford, D.L.; Huelsenbeck, J.P.; Lemey, P.; Rambaut, A.; Suchard, M.A. BEAGLE 3: Improved Performance, Scaling, and Usability for a High-Performance Computing Library for Statistical Phylogenetics. Syst. Biol. 2019, 68, 1052–1061. [Google Scholar] [CrossRef] [PubMed] [Green Version]
  13. Fabregat, A.; Sidiropoulos, K.; Viteri, G.; Forner, O.; Marin-Garcia, P.; Arnau, V.; D’Eustachio, P.; Stein, L.; Hermjakob, H. Reactome pathway analysis: A high-performance in-memory approach. BMC Bioinform. 2017, 18, 142. [Google Scholar] [CrossRef] [PubMed] [Green Version]
  14. Shajii, A.; Numanagić, I.; Baghdadi, R.; Berger, B.; Amarasinghe, S. Seq: A high-performance language for bioinformatics. Proc. ACM Program. Lang. 2019, 3, 1–29. [Google Scholar] [CrossRef] [Green Version]
  15. Cortellessa, V.; Di Marco, A.; Inverardi, P. Model-Based Software Performance Analysis; Springer: Berlin/Heidelberg, Germany, 2011. [Google Scholar]
  16. Van Hoorn, A. Model-Driven Online Capacity Management for Component-Based Software Systems. Ph.D. Thesis, Kiel University, Kiel, Germany, 2014. [Google Scholar]
  17. Balsamo, S.; Marco, A.; Inverardi, P. Model-based performance prediction in software development: A survey. IEEE Trans. Softw. Eng. 2004, 30, 295–310. [Google Scholar] [CrossRef]
  18. Liao, L.; Chen, J.; Li, H.; Zeng, Y.; Shang, W.; Guo, J.; Sporea, C.; Toma, A.; Sajedi, S. Using black-box performance models to detect performance regressions under varying workloads: An empirical study. Empir. Softw. Eng. 2020, 25, 4130–4160. [Google Scholar] [CrossRef]
  19. Bertolino, A.; Inverardi, P.; Muccini, H. Software architecture-based analysis and testing: A look into achievements and future challenges. Computing 2013, 95, 633–648. [Google Scholar] [CrossRef]
  20. Object Management Group (OMG). UML-SPT: UML Profile for Schedulability, Performance, and Time, v 1.1. January 2005. Available online: https://www.omg.org/spec/SPTP/1.1/About-SPTP/ (accessed on 20 February 2021).
  21. Mallet, F.; André, C.; DeAntoni, J. Executing AADL Models with UML/MARTE. In Proceedings of the 14th IEEE International Conference on Engineering of Complex Computer Systems, Potsdam, Germany, 2–4 June 2009; pp. 371–376. [Google Scholar]
  22. Becker, S.; Koziolek, H.; Reussner, R. The Palladio Component Model for Model-driven Performance Prediction. J. Syst. Softw. 2009, 82, 3–22. [Google Scholar] [CrossRef]
  23. Ortega-Arjona, J.L.; Roberts, G. Architectural Performance Models: Estimating the Contribution of Software Structure to the Performance of Parallel Software Architecture. In Proceedings of the 2nd Nordic Workshop on Software Architecture, Ronneby, Sweden, 12–13 August 1999. [Google Scholar]
  24. Di Marco, A.; Mirandola, R. Model Transformation in Software Performance Engineering. In Proceedings of the International Conference on the Quality of Software Architectures, Västerås, Sweden, 27–29 June 2006; Hofmeister, C., Crnkovic, I., Reussner, R., Eds.; Springer: Berlin/Heidelberg, Germany, 2006; pp. 95–110. [Google Scholar]
  25. Li, C.; Altamimi, T.; Zargar, M.; Casale, G.; Petriu, D. Tulsa: A Tool for Transforming UML to Layered Queueing Networks for Performance Analysis of Data Intensive Applications. In Proceedings of the International Conference on Quantitative Evaluation of Systems, Berlin, Germany, 5–7 September 2017; pp. 295–299. [Google Scholar]
  26. Brosig, F.; Meier, P.; Becker, S.; Koziolek, A.; Koziolek, H.; Kounev, S. Quantitative Evaluation of Model-Driven Performance Analysis and Simulation of Component-based Architectures. IEEE Trans. Softw. Eng. 2015, 41, 157–175. [Google Scholar] [CrossRef] [Green Version]
  27. Bolch, G.; Greiner, S.; De Meer, H.; Trivedi, K.S. Queueing Networks and Markov Chains: Modeling and Performance Evaluation with Computer Science Applications, 2nd ed.; Wiley and Sons: Hoboken, NJ, USA, 2006. [Google Scholar]
  28. Bernardi, S.; Donatelli, S.; Merseguer, J. From UML Sequence Diagrams and Statecharts to Analysable Petri Net Models. In Proceedings of the International Workshop on Software and Performance (WOSP), Rome, Italy, 24–26 July 2002; pp. 35–45. [Google Scholar]
  29. Koziolek, H. Performance evaluation of component-based software systems: A survey. Perform. Eval. 2010, 67, 634–658. [Google Scholar] [CrossRef] [Green Version]
  30. Trubiani, C.; Koziolek, A. Detection and solution of software performance antipatterns in palladio architectural models. In Proceedings of the International Conference on Performance Engineering (ICPE), Karlsruhe, Germany, 14–16 March 2011; pp. 19–30. [Google Scholar]
  31. Cortellessa, V.; Di Marco, A.; Eramo, R.; Pierantonio, A.; Trubiani, C. Digging into UML models to remove performance antipatterns. In Proceedings of the International Conference on Software Engineering, Cape Town, South Africa, 3 May 2010; pp. 9–16. [Google Scholar]
  32. Cortellessa, V.; Di Marco, A.; Trubiani, C. Software performance antipatterns: Modeling and analysis. In Formal Methods for Model-Driven Engineering; Bernardo, M., Cortellessa, V., Pierantonio, A., Eds.; Springer: Berlin/Heidelberg, Germany, 2012; Volume 7320, pp. 290–335. [Google Scholar]
  33. Becker, S.; Koziolek, H.; Reussner, R. Model-based performance prediction with the palladio component model. In Proceedings of the 6th International Workshop on Software and Performance (WOSP2007), Buenos Aires, Argentina, 5–8 February 2007. [Google Scholar]
  34. Reussner, R.; Becker, S.; Burger, E.; Happe, J.; Hauck, M.; Koziolek, A.; Koziolek, H.; Krogmann, K.; Kuperberg, M. The Palladio Component Model; Karlsruhe Institute of Technology: Karlsruhe, Germany, 2011. [Google Scholar]
  35. Lawlor, B.; Walsh, P. Engineering bioinformatics: Building reliability, performance and productivity into bioinformatics software. Bioengineered 2015, 6, 193–203. [Google Scholar] [CrossRef] [PubMed] [Green Version]
  36. Cohen, J. Bioinformatics, an introduction for computer scientists. ACM Comput. Surv. 2004, 36, 122–158. [Google Scholar] [CrossRef]
  37. Field, M.A. Detecting pathogenic variants in autoimmune diseases using high-throughput sequencing. Immunol. Cell Biol. 2020, 99, 146–156. [Google Scholar] [CrossRef] [PubMed]
  38. Ali, R.H.; Bogusz, M.; Whelan, S. Identifying Clusters of High Confidence Homologies in Multiple Sequence Alignments. Mol. Biol. Evol. 2019, 36, 2340–2351. [Google Scholar] [CrossRef] [PubMed]
  39. BLAST. Available online: https://blast.ncbi.nlm.nih.gov/Blast.cgi?PAGE_TYPE=BlastSearch&BLAST_SPEC=blast2seq&LINK_LOC=align2seq (accessed on 10 October 2020).
  40. Clustal Omega. Available online: https://www.ebi.ac.uk/Tools/msa/clustalo/# (accessed on 10 October 2020).
  41. Trifinopoulos, J.; Nguyen, L.T.; von Haeseler, A.; Minh, B.Q. W-IQ-TREE: A fast online phylogenetic tool for maximum likelihood analysis. Nucleic Acids Res. 2016, 44, W232–W235. [Google Scholar] [CrossRef] [PubMed] [Green Version]
  42. Genome Comparison and Phylogenetic Analysis System. Available online: https://genomecomparison.wixsite.com/gecphans (accessed on 12 October 2020).
  43. Pezoa, F.; Reutter, J.L.; Suarez, F.; Ugarte, M.; Vrgoc, D. Foundations of JSON schema. In Proceedings of the 25th International Conference on World Wide Web, Montreal, QC, Canada, 11–15 April 2016; pp. 263–273. [Google Scholar]
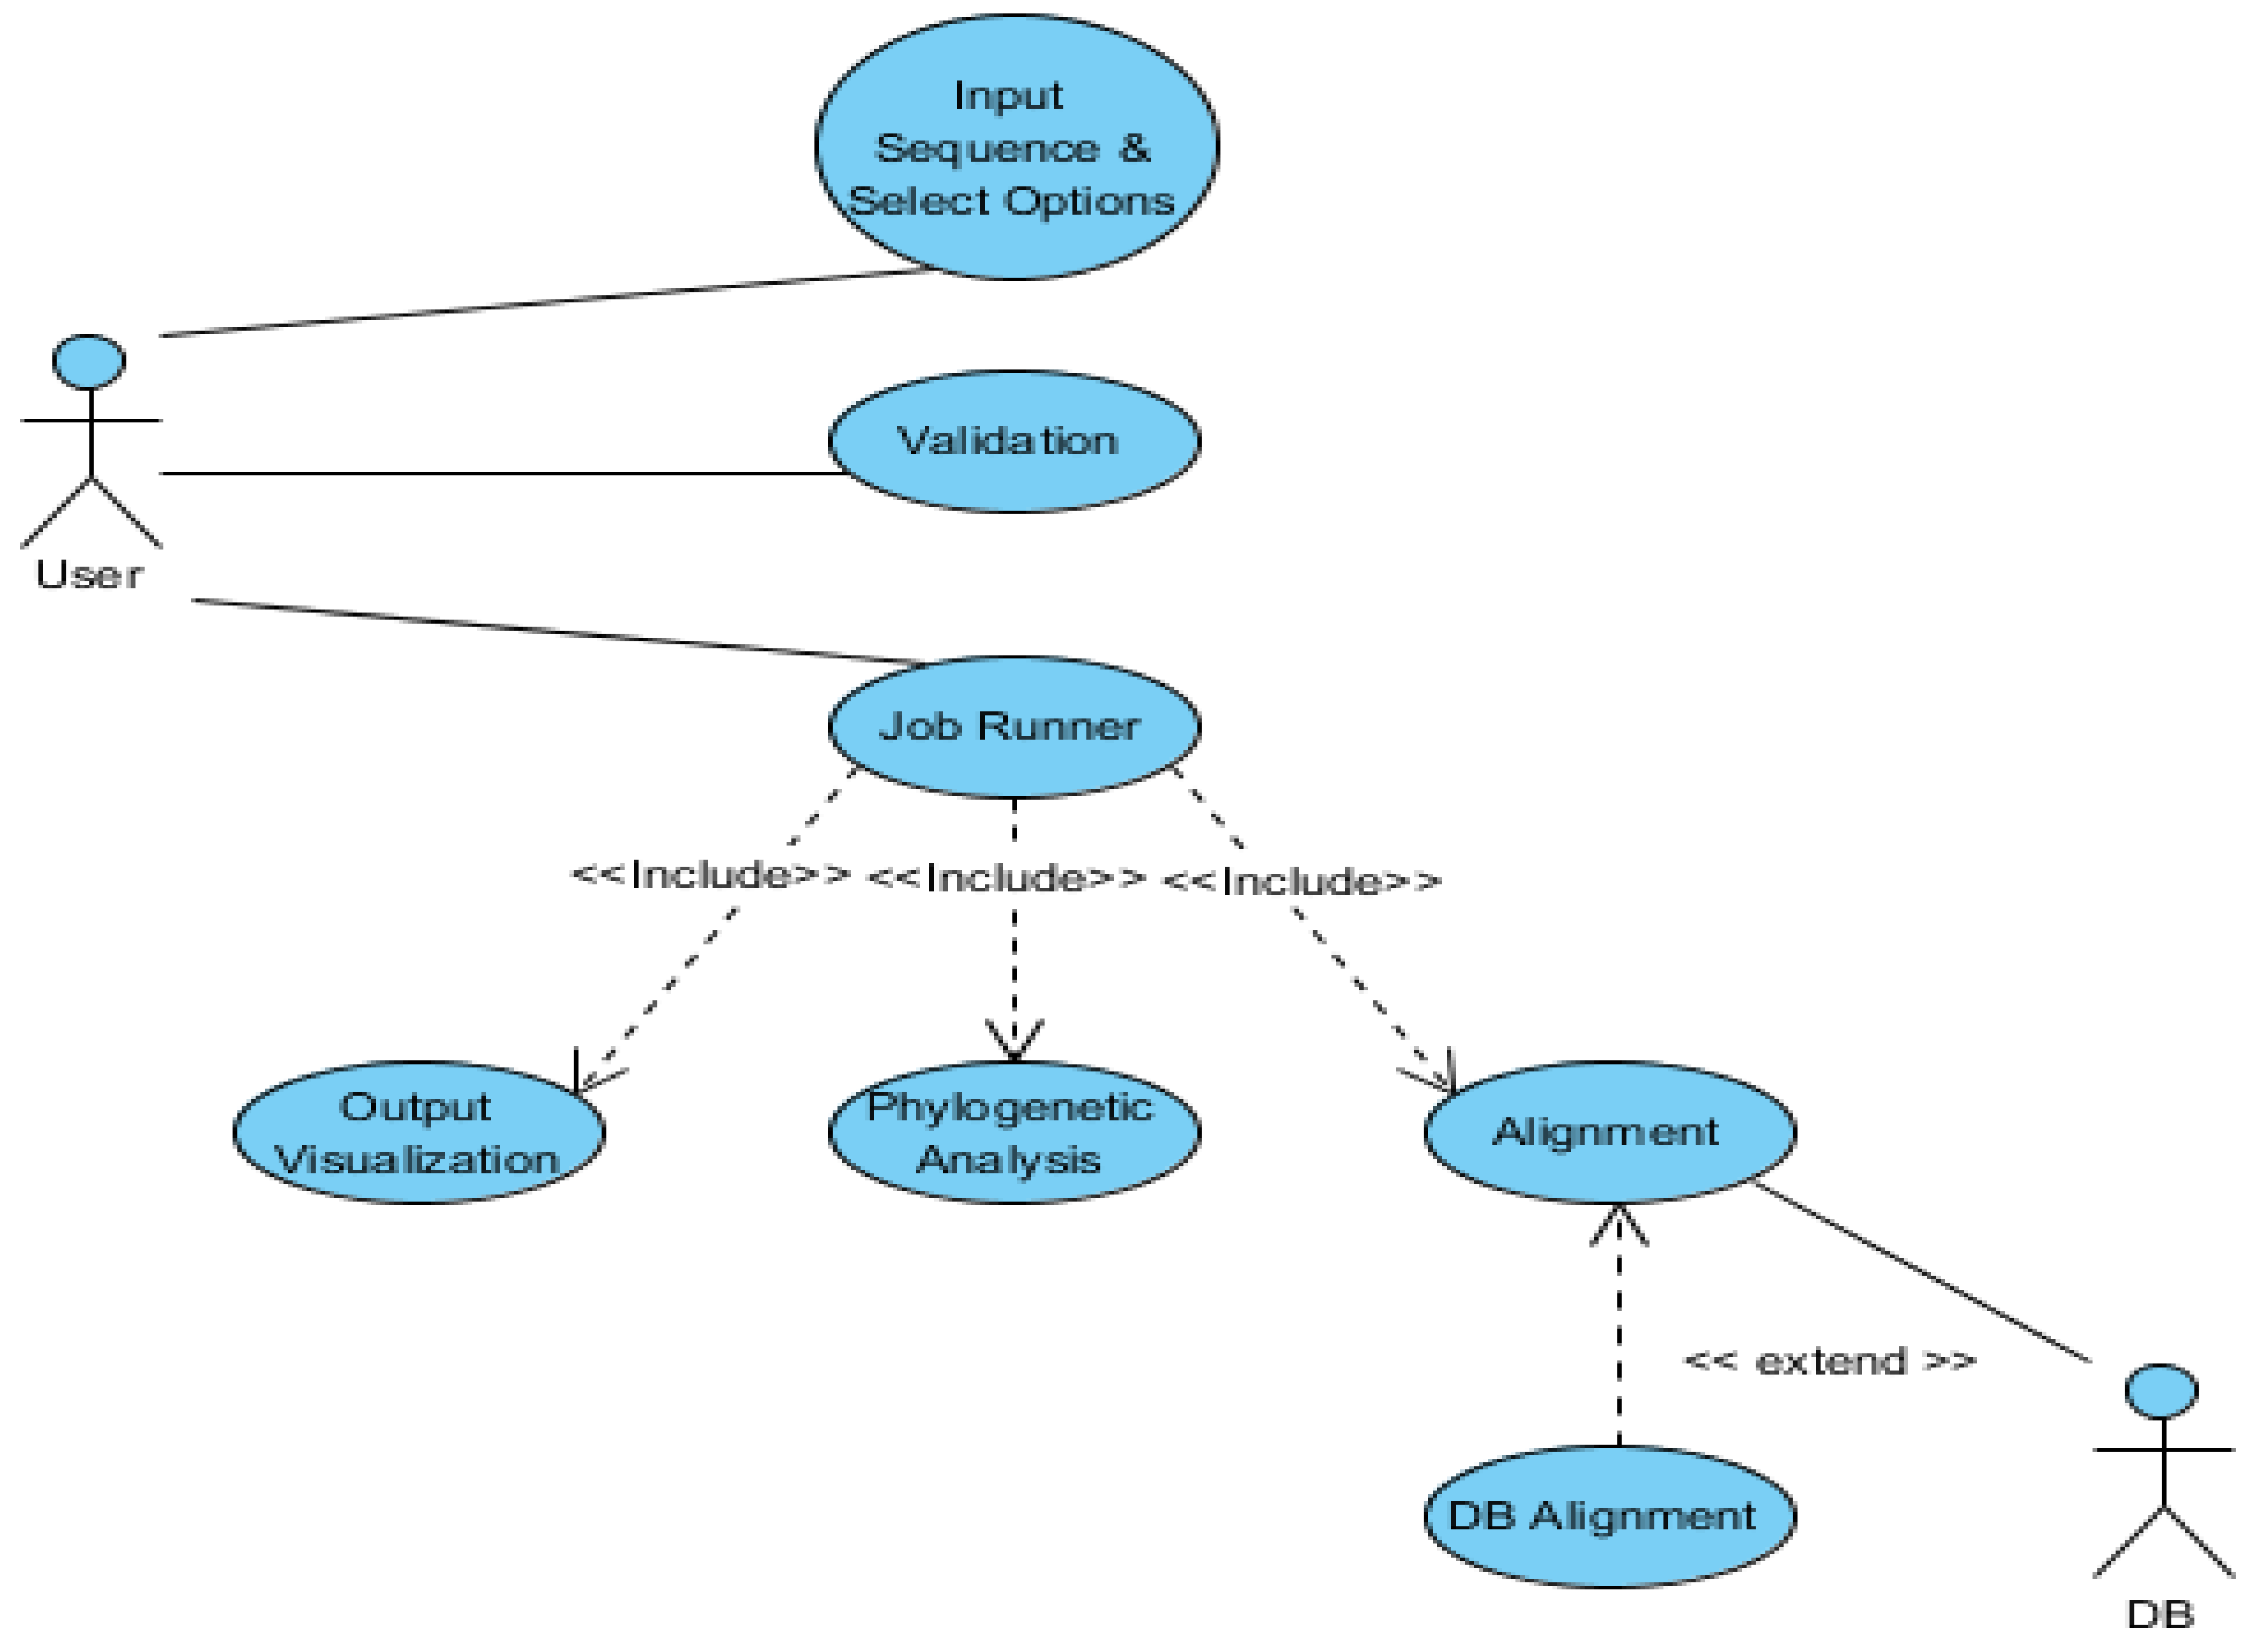
Figure 1. Use case diagram for the phylogenetic analysis module.
Applsci 11 05426 g001
Figure 2. Sequence diagram for the phylogenetic analysis module.
Applsci 11 05426 g002
Figure 3. Activity diagram for the phylogenetic analysis module.
Applsci 11 05426 g003
Figure 4. Part of the repository diagram.
Applsci 11 05426 g004
Figure 5. Assembly diagram for the phylogenetic analysis module.
Applsci 11 05426 g005
Figure 6. SEFF diagram for the alignSeq signature.
Applsci 11 05426 g006
Figure 7. Deployment of components in the resource environment: (a) resource environment diagram; (b) allocation diagram.
Applsci 11 05426 g007
Figure 8. Usage model diagram for the phylogenetic analysis module.
Applsci 11 05426 g008
Figure 9. Cache component added to the repository diagram of the system.
Applsci 11 05426 g009
Figure 10. Comparison between the response time of the usage scenario from the original architecture (red curve) and the alternative design (blue curve).
Applsci 11 05426 g010
Figure 11. Comparison between the response time of the passInput function from the original architecture (red curve) and the alternative design (blue curve).
Applsci 11 05426 g011
Figure 12. Comparison between the response time of the phGnResult function from the original architecture (red curve) and the alternative design (blue curve).
Applsci 11 05426 g012
Table 1. UML objects and their corresponding components.
UML ObjectPCM Component
User 1user
Website 1webSite
Alignment Job 2seqAlignJob
Phylogenetic analysis Job 2PhyGnAnJob
Server 1parseOut
DB Manager 1DB
1 Appeared in the activity diagram; 2 Appeared in the sequence diagram.
Publisher’s Note: MDPI stays neutral with regard to jurisdictional claims in published maps and institutional affiliations.