
Combustion and Performance Evaluation of a Spark Ignition Engine Operating with Acetone–Butanol–Ethanol and Hydroxy


 , , and
Abstract
1. Introduction
2. Materials and Methods
2.1. Experimental Test Bench
2.2. Tested Conditions and Fuel Characteristics
2.3. Fundamentals of the Combustion and Thermodynamic Models
2.3.1. Calculation of Combustion Gases Properties
2.3.2. Blow-by Gas Losses
2.3.3. Rejected Heat
2.3.4. Combustion Chamber Volume
2.3.5. Energy Distribution and Emissions Processing
3. Results and Discussion
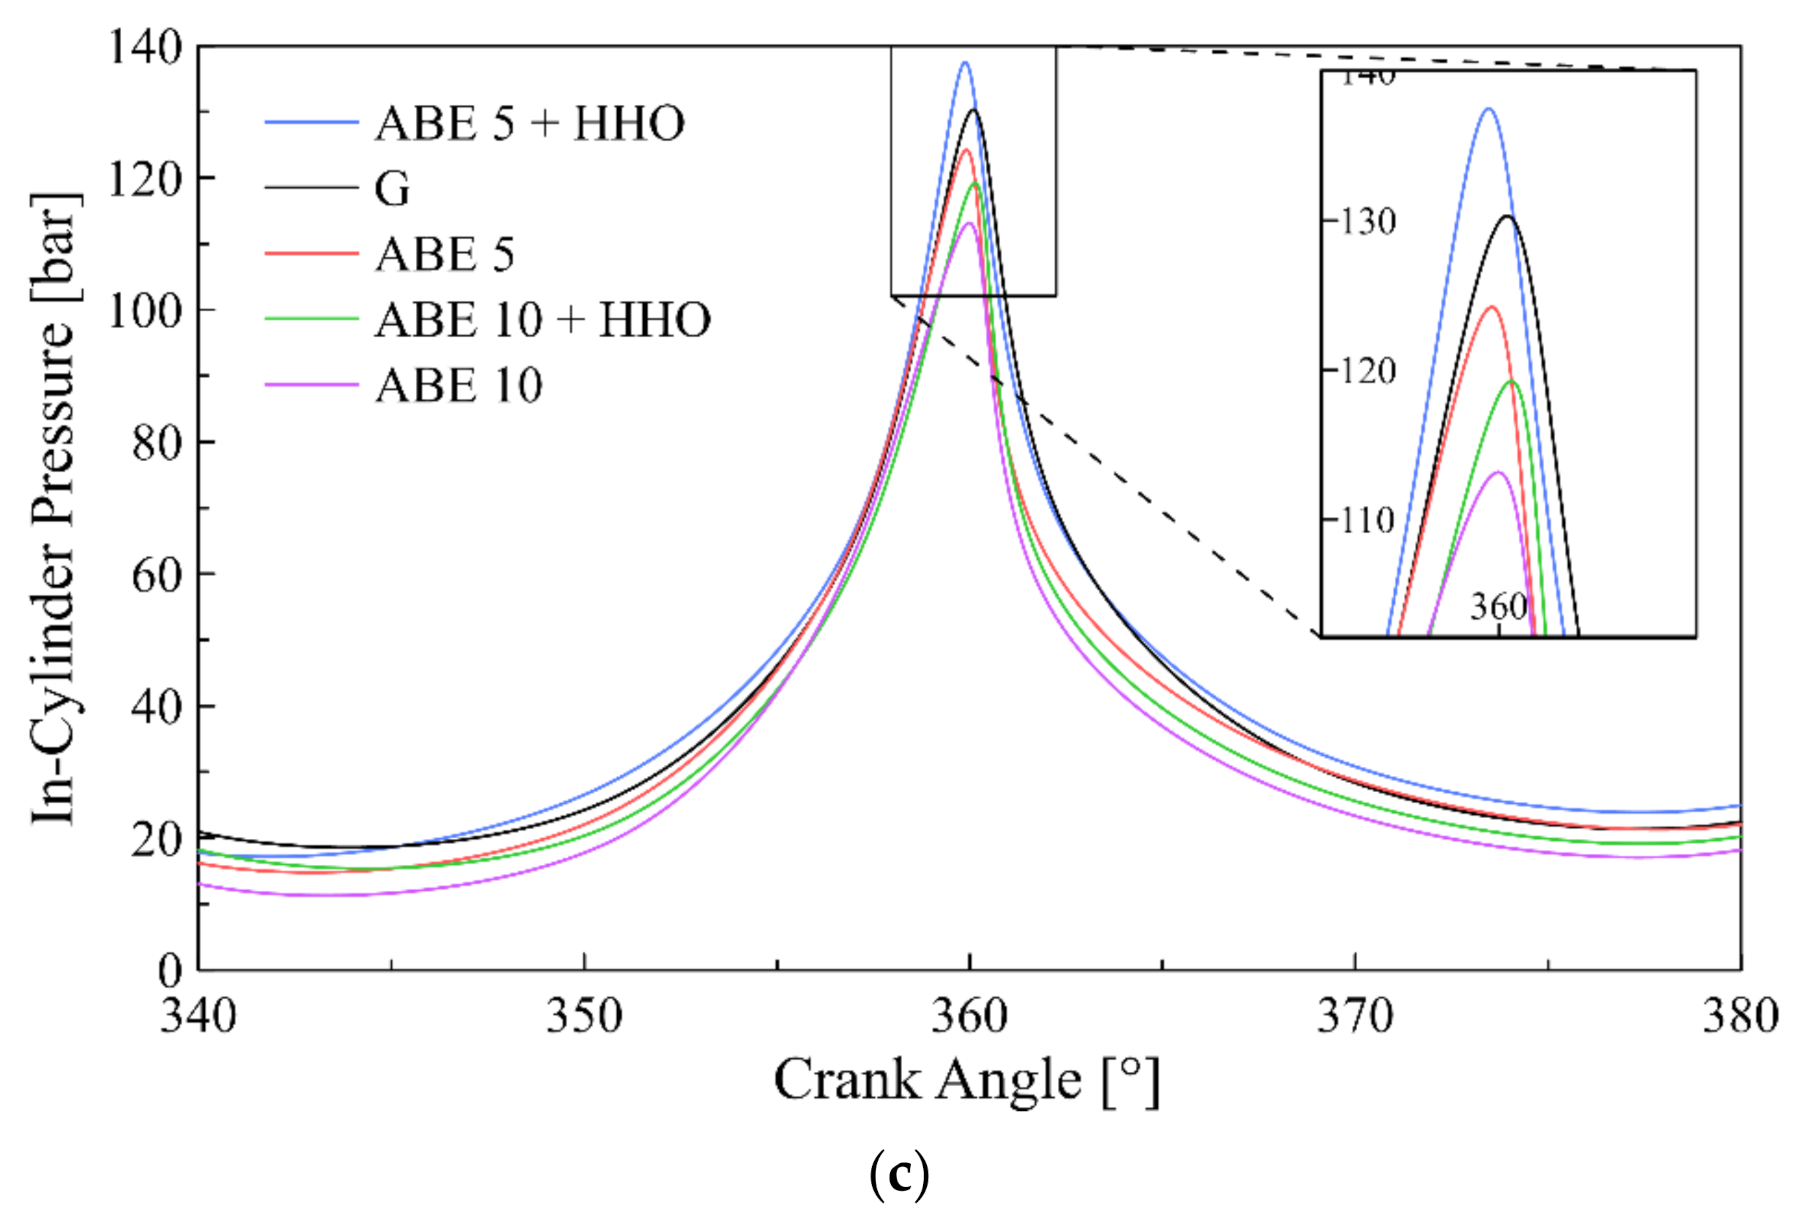
3.1. Cylinder Pressure
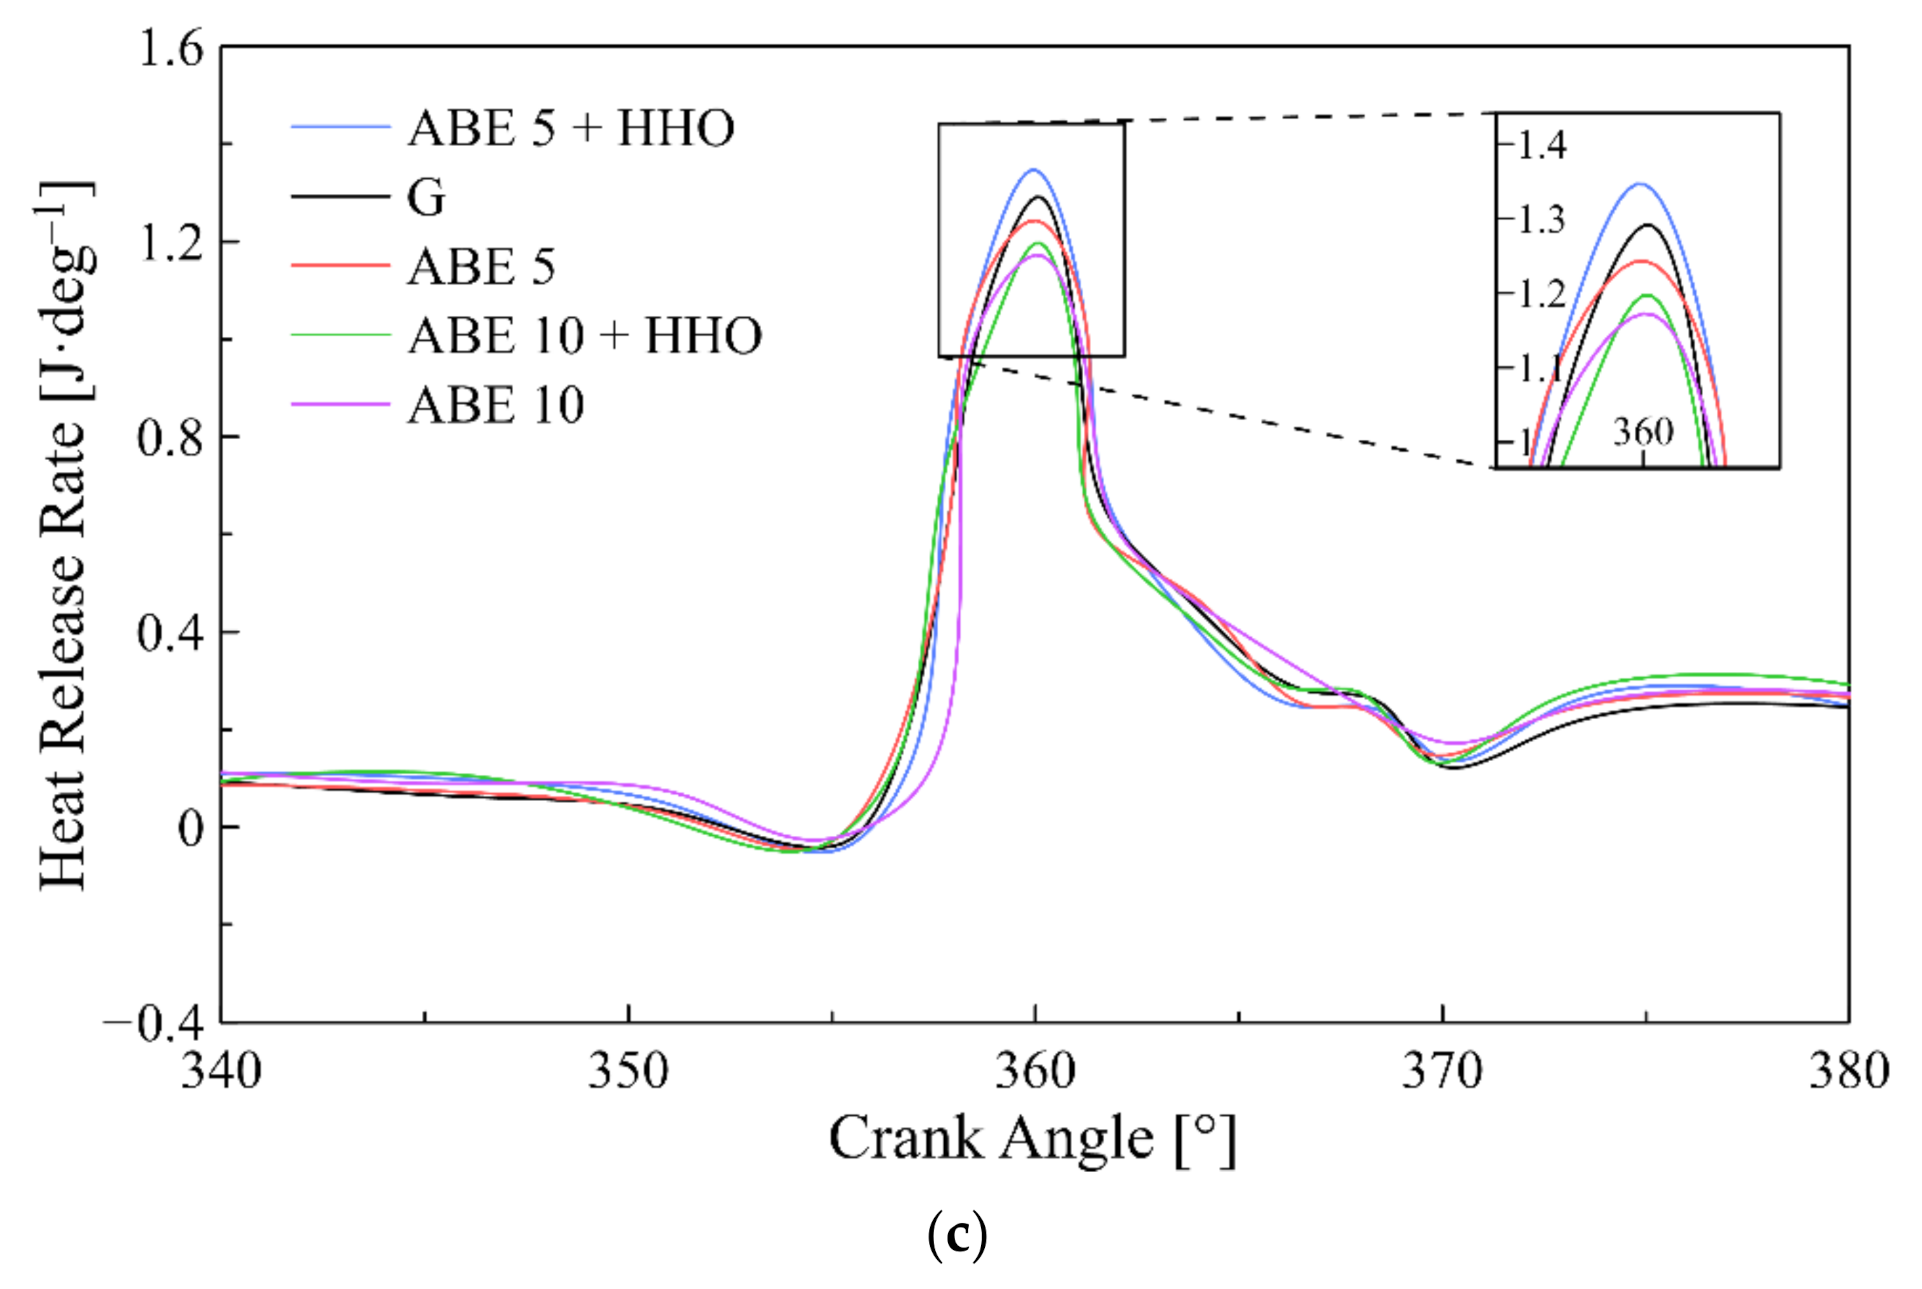
3.2. Heat Release Rate ()
3.3. Combustion Chamber Temperature
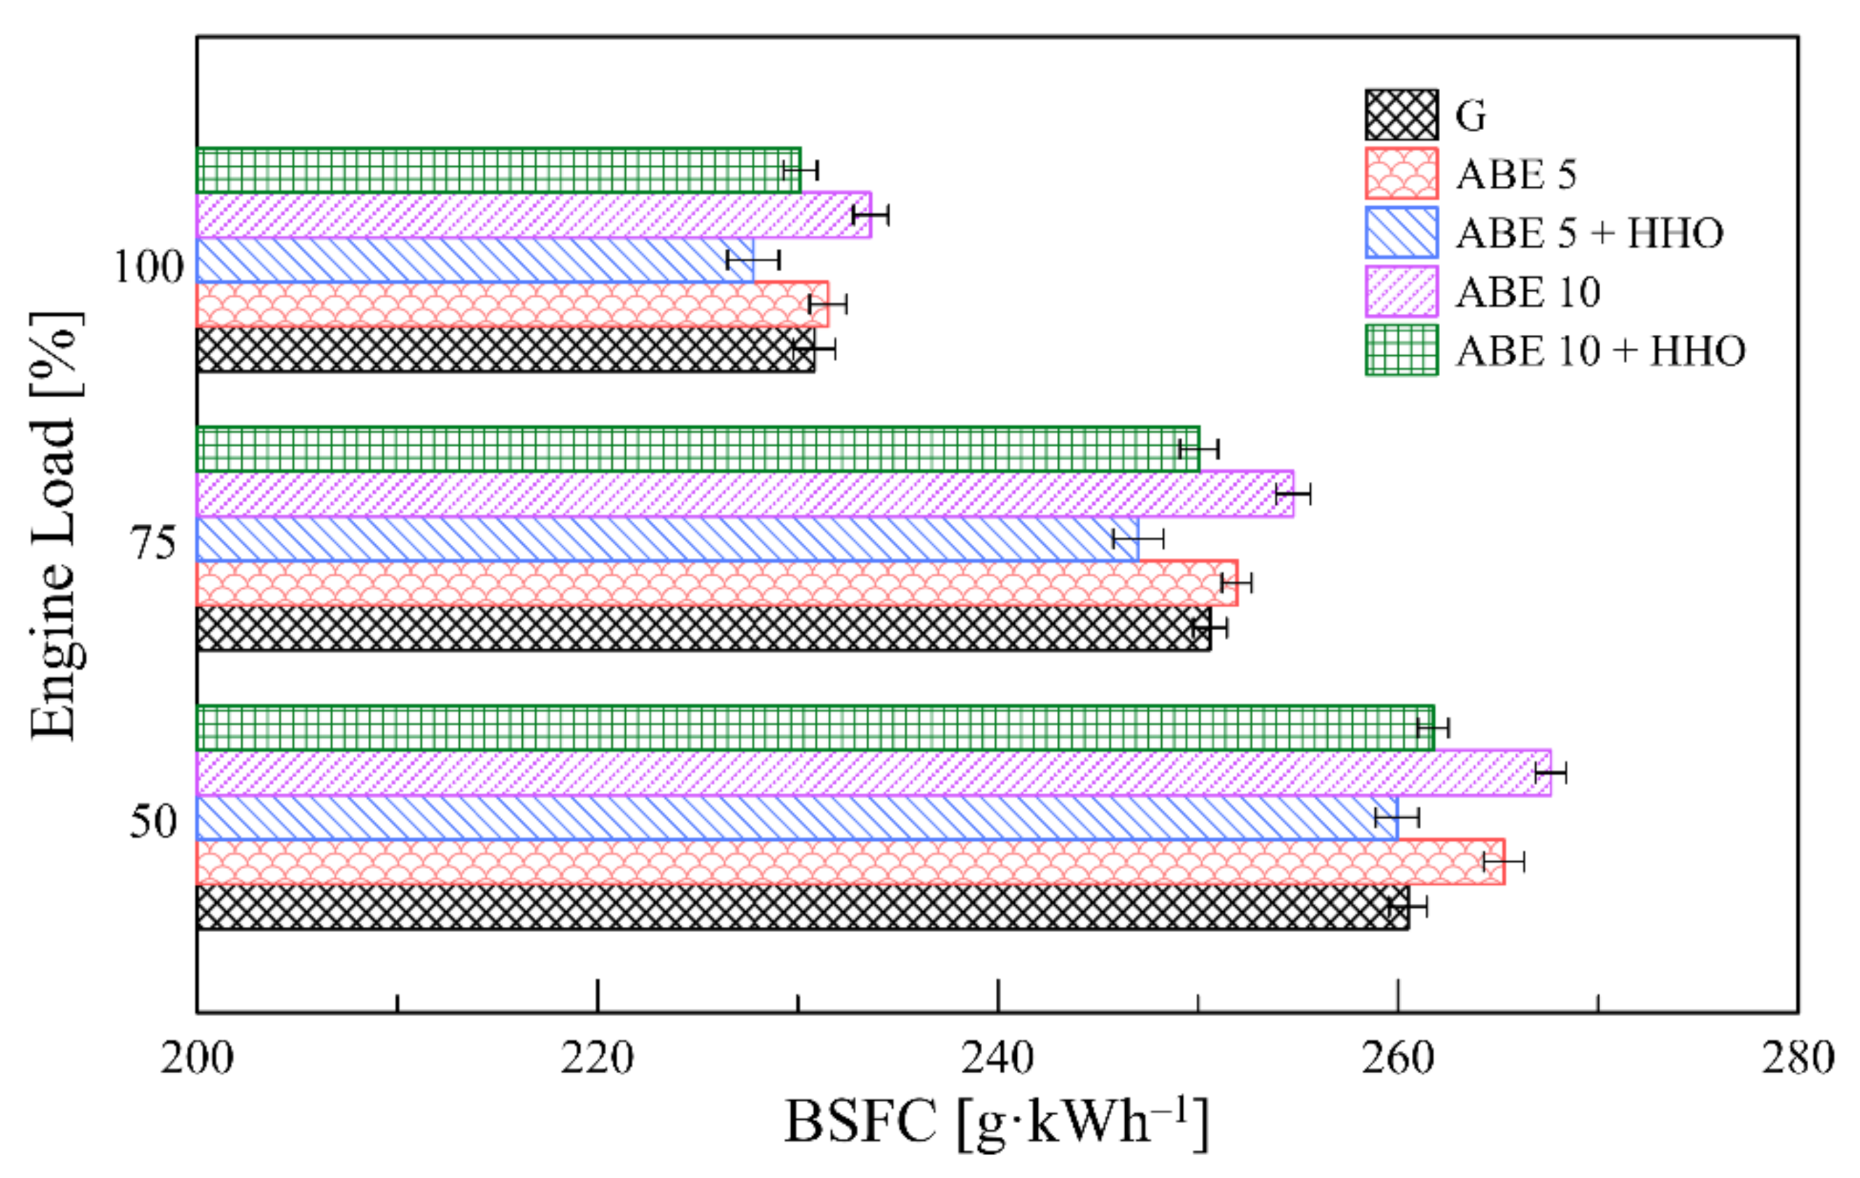
3.4. Engine Performance
3.5. Emission Characteristics
3.5.1. CO Emissions
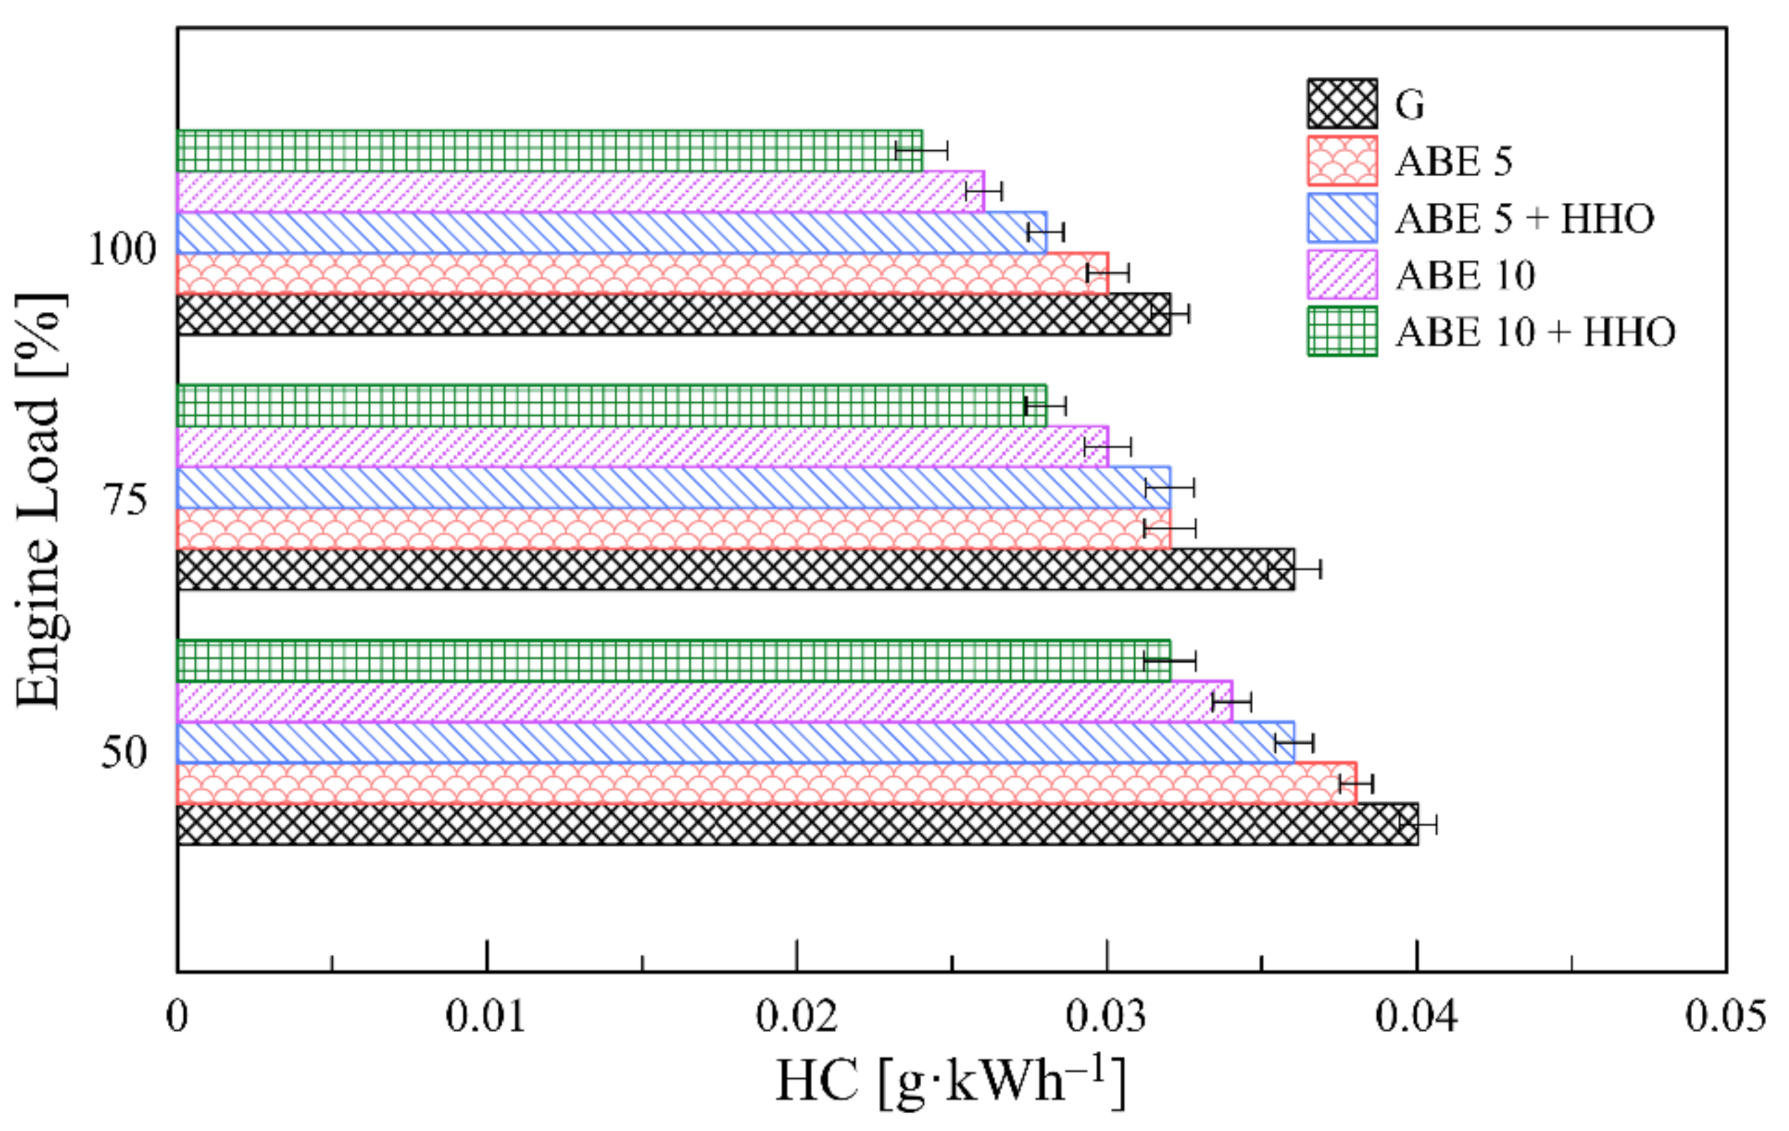
3.5.2. HC Emissions
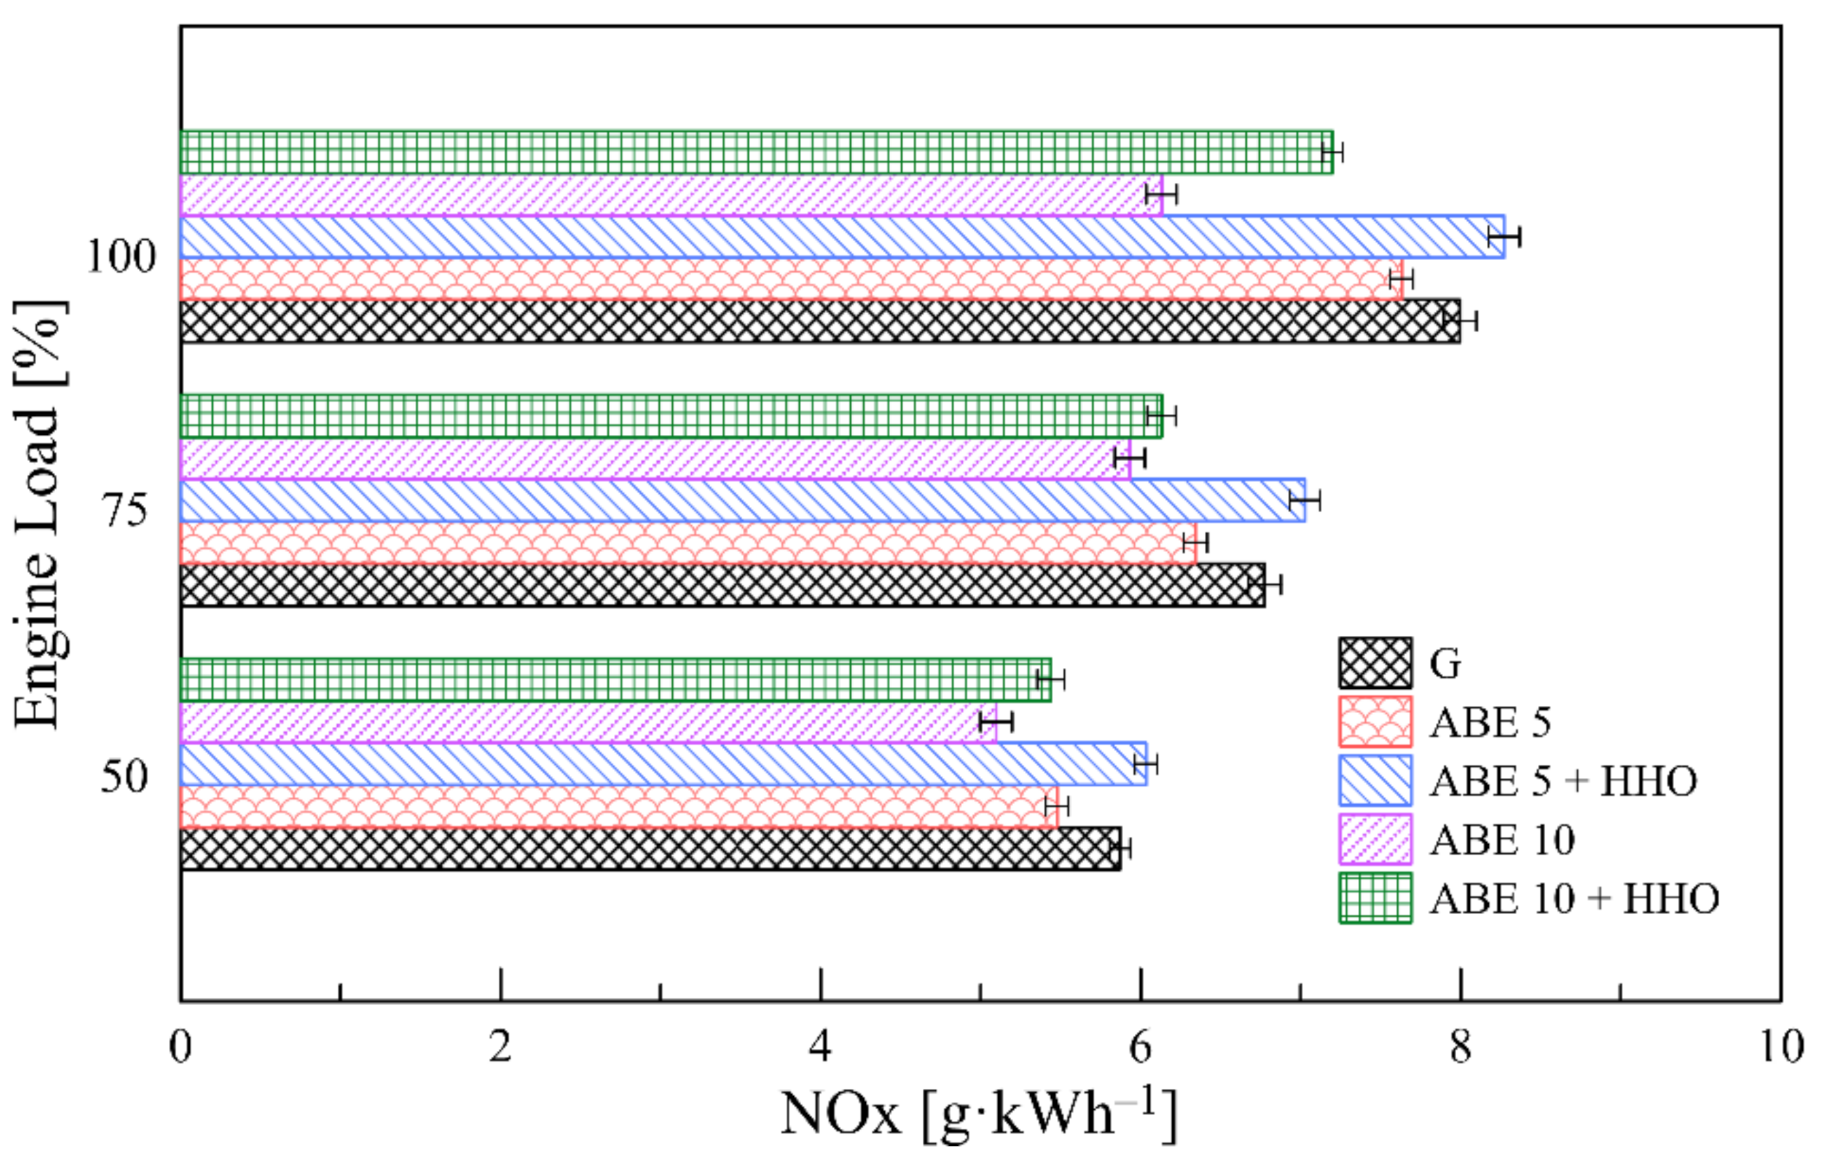
3.5.3. NOx Emissions
3.5.4. Smoke Emissions
3.5.5. Fuel Energy Distribution
4. Conclusions
- ABE standalone blends reduced both in-cylinder pressure and heat release rate compared to pure gasoline. Contrarily, hydroxy enrichment intensified the former and the latter while promoting a homogeneous fuel mixture.
- Engine load directly affected the combustion phasing leading to advanced or retarded combustion in the range of 0.2°–1.2°.
- ABE-based blends increase BSFC between 10–25 compared to pure gasoline due to lower calorific value and lower energy density. The partial fuel substitution with hydroxy gas counterbalanced this rise while obtaining a net BSFC reduction compared to the baseline fuel.
- The implementation of dual-fuel operation promoted a significant minimization of CO, HC, and smoke levels. However, CO2 and NOx emissions escalated due to enhanced combustion oxidation and higher combustion temperatures, which opens a new path for incorporating advanced fuel injection systems and after-exhaust treatment technologies.
- Energy losses represented a predominant share (37–52%) from the chemical energy input depending on the load. Increasing ABE and HHO content in the dual-fuel operation maximizes the power output by up to 2.2%. In contrast, high-load conditions promoted the minimization of energy losses, which implies higher combustion efficiency.
- ABE 10 + HHO featured the highest thermal efficiency (28–33%) from the fuel blends. Moreover, hydroxy doping increased efficiency up to 1.8%.
- Exergy destruction represents up to half of the exergy distribution, demonstrating the predominant share of internal irreversibilities in the combustion phenomena. Dual-fuel mode and higher engine loads result in enhanced useful exergy and power output.
Author Contributions
Funding
Institutional Review Board Statement
Informed Consent Statement
Data Availability Statement
Acknowledgments
Conflicts of Interest
Abbreviations
| ABE | Acetone–Butanol–Ethanol |
| BSFC | Break specific fuel consumption |
| CI | Compression ignition |
| HHO | Hydroxy gas |
| LHV | Lower heating value |
| ICE | Internal combustion engine |
| Heat release rate | |
| SI | Spark ignition |
| BSFC | Brake specific fuel consumption |
| CO | Carbon monoxide |
| CO2 | Carbon dioxide |
| NOx | Nitrogen oxides |
| HC | Hydrocarbons |
| WHR | Waste heat recovery |
| Nomenclature | |
| A | Area |
| b | Internal diameter of the combustion chamber |
| Best estimate of measurement | |
| P | Mean combustion chamber pressure |
| V | Combustion chamber volume |
| m | Gas mass |
| Empirical emission gas constants | |
| Model constants | |
| Deformation constant | |
| / | Specific heat at constant volume/pressure |
| T | Combustion chamber gas temperature |
| Heat release | |
| Heat rejected by convection | |
| H | Enthalpy |
| h | Specific enthalpy |
| Heat transfer coefficient of the wall | |
| R | Ideal gas constant |
| N | Engine speed |
| Number of repetitions | |
| Power output | |
| Vertical position of the piston | |
| Engine stroke | |
| Standard deviation | |
| Engine torque | |
| Internal energy | |
| Specific Internal Energy | |
| Gas Mass Fraction | |
| Heat transfer surface area of the combustion chamber | |
| Connecting rod’s critical area | |
| Diameter | |
| Length | |
| Pollutant emissions in power unit | |
| Exhaust emissions in ppm/%vol. | |
| Compression ratio | |
| Elastic modulus of steel | |
| Piston acceleration | |
| Eccentricity between the stump and the bearing, located in its centerline | |
| Gas molecular weight | |
| W | Mechanical work |
| Average velocity of the combustion chamber | |
| Measurement | |
| Greek Letters | |
| Crankshaft angle | |
| Δ | Differential variation |
| Fluid density | |
| Angle between the connecting rod and piston | |
| Rotational angle | |
| Specific heat ratio | |
| ω | Angular speed |
| η | Efficiency |
| Subscripts | |
| 0 | Initial conditions |
| comb | Combustion chamber gas |
| bb | Blow-by gas |
| Crankshaft | |
| D | Discharge |
| Pressure deformation | |
| Displaced | |
| Exhaust | |
| Stoichiometric combustion | |
| Mean | |
| Mechanical | |
| Top-dead center volume | |
| Theoretical | |
| Gaseous fuel | |
| Valve | |
| Intake/inlet | |
| Inertial forces | |
References
- Matrisciano, A.; Franken, T.; Mestre, L.C.G.; Borg, A.; Mauss, F. Development of a Computationally Efficient Tabulated Chemistry Solver for Internal Combustion Engine Optimization Using Stochastic Reactor Models. Appl. Sci. 2020, 10, 8979. [Google Scholar] [CrossRef]
- Ochoa, G.V.; Rojas, J.P.; Forero, J.D. Advance Exergo-Economic Analysis of a Waste Heat Recovery System Using ORC for a Bottoming Natural Gas Engine. Energies 2020, 13, 267. [Google Scholar] [CrossRef]
- Ochoa, G.V.; Gutierrez, J.C.; Forero, J.D. Exergy, Economic, and Life-Cycle Assessment of ORC System for Waste Heat Recovery in a Natural Gas Internal Combustion Engine. Resources 2020, 9, 2. [Google Scholar] [CrossRef]
- Forero, J.D.; Taborda, L.L.; Silvera, A.B. Characterization of the performance of centrifugal pumps powered by a diesel engine in dredging applications. Int. Rev. Mech. Eng. (IREME) 2019, 13, 11–20. [Google Scholar] [CrossRef]
- Valencia, G.; Duarte, J.; Isaza-Roldan, C. Thermoeconomic Analysis of Different Exhaust Waste-Heat Recovery Systems for Natural Gas Engine Based on ORC. Appl. Sci. 2019, 9, 4017. [Google Scholar] [CrossRef]
- Diaz, G.A.; Forero, J.D.; Garcia, J.; Rincon, A.; Fontalvo, A.; Bula, A.J.; Padilla, R.V. Maximum Power From Fluid Flow by Applying the First and Second Laws of Thermodynamics. J. Energy Resour. Technol. 2017, 139, 032903. [Google Scholar] [CrossRef]
- Ochoa, G.V.; Isaza-Roldan, C.; Forero, J.D. Economic and Exergo-Advance Analysis of a Waste Heat Recovery System Based on Regenerative Organic Rankine Cycle under Organic Fluids with Low Global Warming Potential. Energies 2020, 13, 1317. [Google Scholar] [CrossRef]
- Orozco, W.; Acuña, N.; Duarte, J. Characterization of Emissions in Low Displacement Diesel Engines Using Biodiesel and Energy Recovery System. Int. Rev. Mech. Eng. (IREME) 2019, 13, 420–426. [Google Scholar] [CrossRef]
- Tamilselvan, P.; Nallusamy, N.; Rajkumar, S. A comprehensive review on performance, combustion and emission characteristics of biodiesel fuelled diesel engines. Renew. Sustain. Energy Rev. 2017, 79, 1134–1159. [Google Scholar] [CrossRef]
- Masum, B.M.; Kalam, M.A.; Masjuki, H.H.; Palash, S.M.; Fattah, I.M.R. Performance and emission analysis of a multi cylinder gasoline engine operating at different alcohol–gasoline blends. RSC Adv. 2014, 4, 27898–27904. [Google Scholar] [CrossRef]
- Yacoub, Y.M.; Bata, R.M.; Gautam, M. The performance and emission characteristics of C1-C5 alcohol-gasoline blends with matched oxygen content in a single-cylinder spark ignition engine. Proc. Inst. Mech. Eng. Part A J. Power Energy 1998, 212, 363–379. [Google Scholar] [CrossRef]
- Nithyanandan, K.; Zhang, J.; Li, Y.; Wu, H.; Lee, T.H.; Lin, Y.; Lee, C.-F.F. Improved SI engine efficiency using Acetone–Butanol–Ethanol (ABE). Fuel 2016, 174, 333–343. [Google Scholar] [CrossRef]
- Di Blasio, G.; Viscardi, M.; Alfè, M.; Gargiulo, V.; Ciajolo, A.; Beatrice, C. Analysis of the Impact of the Dual-Fuel Ethanol-Diesel System on the Size, Morphology, and Chemical Characteristics of the Soot Particles Emitted from a LD Diesel Engine. SAE Tech. Pap. Ser. 2014. [Google Scholar] [CrossRef]
- Gargiulo, V.; Alfe, M.; Di Blasio, G.; Beatrice, C. Chemico-physical features of soot emitted from a dual-fuel ethanol–diesel system. Fuel 2015, 150, 154–161. [Google Scholar] [CrossRef]
- Beatrice, C.; Denbratt, I.; Di Blasio, G.; Di Luca, G.; Ianniello, R.; Saccullo, M. Experimental Assessment on Exploiting Low Carbon Ethanol Fuel in a Light-Duty Dual-Fuel Compression Ignition Engine. Appl. Sci. 2020, 10, 7182. [Google Scholar] [CrossRef]
- Vassallo, A.; Beatrice, C.; Di Blasio, G.; Belgiorno, G.; Avolio, G.; Pesce, F.C. The Key Role of Advanced, Flexible Fuel Injection Systems to Match the Future CO2 Targets in an Ultra-Light Mid-Size Diesel Engine. SAE Tech. Pap. Ser. 2018. [Google Scholar] [CrossRef]
- Belgiorno, G.; Dimitrakopoulos, N.; Di Blasio, G.; Beatrice, C.; Tunestål, P.; Tunér, M. Effect of the engine calibration parameters on gasoline partially premixed combustion performance and emissions compared to conventional diesel combustion in a light-duty Euro 6 engine. Appl. Energy 2018, 228, 2221–2234. [Google Scholar] [CrossRef]
- Milani, D.; Kiani, A.; McNaughton, R. Renewable-powered hydrogen economy from Australia’s perspective. Int. J. Hydrogen Energy 2020, 45, 24125–24145. [Google Scholar] [CrossRef]
- Escobar-Yonoff, R.; Maestre-Cambronel, D.; Charry, S.; Rincón-Montenegro, A.; Portnoy, I. Performance assessment and economic perspectives of integrated PEM fuel cell and PEM electrolyzer for electric power generation. Heliyon 2021, 7, e06506. [Google Scholar] [CrossRef]
- Alshehri, F.; Suárez, V.G.; Torres, J.L.R.; Perilla, A.; van der Meijden, M. Modelling and evaluation of PEM hydrogen technologies for frequency ancillary services in future multi-energy sustainable power systems. Heliyon 2019, 5, e01396. [Google Scholar] [CrossRef]
- Shivaprasad, K.; Raviteja, S.; Chitragar, P.; Kumar, G. Experimental Investigation of the Effect of Hydrogen Addition on Combustion Performance and Emissions Characteristics of a Spark Ignition High Speed Gasoline Engine. Procedia Technol. 2014, 14, 141–148. [Google Scholar] [CrossRef]
- Ismail, T.M.; Ramzy, K.; Elnaghi, B.E.; Mansour, T.; Abelwhab, M.; El-Salam, M.A.; Ismail, M. Modelling and simulation of electrochemical analysis of hybrid spark-ignition engine using hydroxy (HHO) dry cell. Energy Convers. Manag. 2019, 181, 1–14. [Google Scholar] [CrossRef]
- Yilmaz, A.C.; Uludamar, E.; Aydin, K. Effect of hydroxy (HHO) gas addition on performance and exhaust emissions in compression ignition engines. Int. J. Hydrogen Energy 2010, 35, 11366–11372. [Google Scholar] [CrossRef]
- Carl, J.; Fedor, D. Tracking global carbon revenues: A survey of carbon taxes versus cap-and-trade in the real world. Energy Policy 2016, 96, 50–77. [Google Scholar] [CrossRef]
- Mendoza-Casseres, D.; Valencia-Ochoa, G.; Duarte-Forero, J. Experimental assessment of combustion performance in low-displacement stationary engines operating with biodiesel blends and hydroxy. Therm. Sci. Eng. Prog. 2021, 23, 100883. [Google Scholar] [CrossRef]
- Dhinesh, B.; Raj, Y.M.A.; Kalaiselvan, C.; KrishnaMoorthy, R. A numerical and experimental assessment of a coated diesel engine powered by high-performance nano biofuel. Energy Convers. Manag. 2018, 171, 815–824. [Google Scholar] [CrossRef]
- van Wyk, S.; van der Ham, A.; Kersten, S. Pervaporative separation and intensification of downstream recovery of acetone-butanol-ethanol (ABE). Chem. Eng. Process. Process. Intensif. 2018, 130, 148–159. [Google Scholar] [CrossRef]
- Anderhofstadt, B.; Spinler, S. Preferences for autonomous and alternative fuel-powered heavy-duty trucks in Germany. Transp. Res. Part D Transp. Environ. 2020, 79, 102232. [Google Scholar] [CrossRef]
- Ismail, T.M.; Ramzy, K.; Abelwhab, M.; Elnaghi, B.E.; El-Salam, M.A.; Ismail, M. Performance of hybrid compression ignition engine using hydroxy (HHO) from dry cell. Energy Convers. Manag. 2018, 155, 287–300. [Google Scholar] [CrossRef]
- Ferguson, C.R.; Kirkpatrick, A.T. Internal Combustion Engines—Applied Thermosciences; John Wiley & Sons: Hoboken, NJ, USA, 2001. [Google Scholar]
- Williams, F.A. Combustion Theory Benjamin/Cummings; Westview Press: Menlo Park, CA, USA, 1985. [Google Scholar]
- Ochoa, G.V.; Isaza-Roldan, C.; Forero, J.D. A phenomenological base semi-physical thermodynamic model for the cylinder and exhaust manifold of a natural gas 2-megawatt four-stroke internal combustion engine. Heliyon 2019, 5, e02700. [Google Scholar] [CrossRef]
- Pain, J. Gas Dynamics. Nat. Cell Biol. 1967, 213, 1182. [Google Scholar] [CrossRef]
- Hernández-Comas, B.; Maestre-Cambronel, D.; Pardo-García, C.; Fonseca-Vigoya, M.; Pabón-León, J. Influence of Compression Rings on the Dynamic Characteristics and Sealing Capacity of the Combustion Chamber in Diesel Engines. Lubricants 2021, 9, 25. [Google Scholar] [CrossRef]
- Irimescu, A.; Di Iorio, S.; Merola, S.S.; Sementa, P.; Vaglieco, B.M. Evaluation of compression ratio and blow-by rates for spark ignition engines based on in-cylinder pressure trace analysis. Energy Convers. Manag. 2018, 162, 98–108. [Google Scholar] [CrossRef]
- Woschni, G. A Universally Applicable Equation for the Instantaneous Heat Transfer Coefficient in the Internal Combustion Engine. SAE Tech. Pap. Ser. 1967. [Google Scholar] [CrossRef]
- Consuegra, F.; Bula, A.; Guillín, W.; Sánchez, J.; Forero, J.D. Instantaneous in-Cylinder Volume Considering Deformation and Clearance due to Lubricating Film in Reciprocating Internal Combustion Engines. Energies 2019, 12, 1437. [Google Scholar] [CrossRef]
- Ağbulut, Ü.; Sarıdemir, S.; Albayrak, S. Experimental investigation of combustion, performance and emission characteristics of a diesel engine fuelled with diesel–biodiesel–alcohol blends. J. Braz. Soc. Mech. Sci. Eng. 2019, 41, 389. [Google Scholar] [CrossRef]
- Heseding, M.; Daskalopoulos, P. Exhaust Emission Legislation-Diesel-and Gas Engines; VDMA: Frankfurt Am Main, Germany, 2006. [Google Scholar]
- Musthafa, M.M.; Kumar, T.A.; Mohanraj, T.; Chandramouli, R. A comparative study on performance, combustion and emission characteristics of diesel engine fuelled by biodiesel blends with and without an additive. Fuel 2018, 225, 343–348. [Google Scholar] [CrossRef]
- Ma, F.; Wang, M.; Jiang, L.; Deng, J.; Chen, R.; Naeve, N.; Zhao, S. Performance and emission characteristics of a turbocharged spark-ignition hydrogen-enriched compressed natural gas engine under wide open throttle operating conditions. Int. J. Hydrogen Energy 2010, 35, 12502–12509. [Google Scholar] [CrossRef]
- Senthilkumar, S.; Sivakumar, G.; Manoharan, S. Investigation of palm methyl-ester bio-diesel with additive on performance and emission characteristics of a diesel engine under 8-mode testing cycle. Alex. Eng. J. 2015, 54, 423–428. [Google Scholar] [CrossRef][Green Version]
- Zhang, J.; Nithyanandan, K.; Li, Y.; Lee, C.-F.; Huang, Z. Comparative Study of High-Alcohol-Content Gasoline Blends in an SI Engine. SAE Tech. Pap. Ser. 2015, 1. [Google Scholar] [CrossRef]
- Duarte, J.; Amador, G.; Garcia, J.; Fontalvo, A.; Padilla, R.V.; Sanjuan, M.; Quiroga, A.G. Auto-ignition control in turbocharged internal combustion engines operating with gaseous fuels. Energy 2014, 71, 137–147. [Google Scholar] [CrossRef]
- Duarte, J.; Garcia, J.; Jiménez, J.; Sanjuan, M.E.; Bula, A.; González, J. Auto-Ignition Control in Spark-Ignition Engines Using Internal Model Control Structure. J. Energy Resour. Technol. 2017, 139, 022201. [Google Scholar] [CrossRef]
- Li, Y.; Nithyanandan, K.; Zhang, J.; Lee, C.-F.; Liao, S. Combustion and Emissions Performance of a Spark Ignition Engine Fueled with Water Containing Acetone-Butanol-Ethanol and Gasoline Blends. SAE Tech. Pap. Ser. 2015. [Google Scholar] [CrossRef]
- Kul, B.S.; Kahraman, A. Energy and Exergy Analyses of a Diesel Engine Fuelled with Biodiesel-Diesel Blends Containing 5% Bioethanol. Entropy 2016, 18, 387. [Google Scholar] [CrossRef]
- Monsalve-Serrano, J.; Belgiorno, G.; Di Blasio, G.; Guzmán-Mendoza, M. 1D Simulation and Experimental Analysis on the Effects of the Injection Parameters in Methane–Diesel Dual-Fuel Combustion. Energies 2020, 13, 3734. [Google Scholar] [CrossRef]


| Specification | Value |
|---|---|
| Engine type | 4T OHV |
| Max. Power | 3.5 kW |
| Bore × Stroke | 66 × 50 mm |
| Max. Torque | 10.5 Nm/2400 rpm |
| Compression ratio | 8.5:1 |
| Fuel capacity | 4.5 L |
| Ignition system | T.C.I |
| Displacement | 171 cc |
| Parameter | Instrument | Manufacturer | Range |
|---|---|---|---|
| Cylinder pressure | Piezoelectric transducer | KISTLER type 7063-A | 0–250 bar |
| Airflow | Air mass sensor | BOSCH OE-22680 7J600 | 0–125 g/s |
| Angle | Crankshaft angle | Beck Arnley 180–0420 | 5–9999 RPM |
| Fuel measuring | Gravimetric meter | OHAUS-PA313 | 0–310 g |
| HHO gas flow | HHO flow rate | GT-556-MTR-ICV | 0–3 LPM |
| Temperature | Temperature sensor | Type K | −200–1370 °C |
| CO | Exhaust gas analyzer | BrainBee AGS-688 | 0–9.99% |
| HC | 0–9999 ppm | ||
| NOx | PCA-400 | 0–3000 ppm | |
| Smoke opacity | BrainBee OPA-100 | 0–99.9% |
| Variable | Uncertainty (%) |
|---|---|
| Pressure chamber | ±0.4 |
| Air mass | ±1.2 |
| Crankshaft angle | ±1.1 |
| Gravimetric meter | ±1.2 |
| HHO flow rate | ±1.0 |
| CO2 | ±1.1 |
| HC | ±1.5 |
| Smoke opacity | ±2.0 |
| NOx | ±1.5 |
| Total uncertainty | ±3.8 |
| Parameter | Units | Gasoline | Acetone | Butanol | Ethanol |
|---|---|---|---|---|---|
| Chemical formula | - | ||||
| LHV | () | 43.4 | 29.6 | 33.1 | 26.8 |
| Density | () | 737 | 788 | 810 | 789 |
| Vaporization latent heat | () | 440 | 518 | 716 | 904 |
| Autoignition temperature | (°C) | 300 | 465 | 343 | 420 |
| Laminar flame speed | () | 33 | 34 | 48 | 39 |
| Parameter | Units | ABE5 | ABE10 |
|---|---|---|---|
| LHV | () | 42.79 | 42.20 |
| Density | () | 740.38 | 743.76 |
| Latent Vaporization heat | () | 451.77 | 463.54 |
| Autoignition temperature | (°C) | 304.36 | 308.73 |
| Laminar flame velocity | () | 33.49 | 33.99 |
| Test | RPM | Load (%) | Fuel Mixture Composition | Symbology |
|---|---|---|---|---|
| 1 | 2400 | 50 | 100% Gasoline | G |
| 2 | 95% Gasoline + 5% ABE | ABE5 | ||
| 3 | 90% Gasoline + 10% ABE | ABE10 | ||
| 4 | 95% Gasoline + 5% ABE + 0.04 LPM Hydroxy | ABE5 + HHO | ||
| 5 | 90% Gasoline + 10% ABE + 0.04 LPM Hydroxy | ABE10 + HHO | ||
| 6 | 75 | 100% Gasoline | G | |
| 7 | 95% Gasoline + 5% ABE | ABE5 | ||
| 8 | 90% Gasoline + 10% ABE | ABE10 | ||
| 9 | 95% Gasoline + 5% ABE + 0.04 LPM Hydroxy | ABE5 + HHO | ||
| 10 | 90% Gasoline + 10% ABE + 0.04 LPM Hydroxy | ABE10 + HHO | ||
| 11 | 100 | 100% Gasoline | G | |
| 12 | 95% Gasoline + 5% ABE | ABE5 | ||
| 13 | 90% Gasoline + 10% ABE | ABE10 | ||
| 14 | 95% Gasoline + 5% ABE + 0.04 LPM Hydroxy | ABE5 + HHO | ||
| 15 | 90% Gasoline + 10% ABE + 0.04 LPM Hydroxy | ABE10 + HHO |
Publisher’s Note: MDPI stays neutral with regard to jurisdictional claims in published maps and institutional affiliations. |
© 2021 by the authors. Licensee MDPI, Basel, Switzerland. This article is an open access article distributed under the terms and conditions of the Creative Commons Attribution (CC BY) license (https://creativecommons.org/licenses/by/4.0/).
Share and Cite
Guillin-Estrada, W.; Maestre-Cambronel, D.; Bula-Silvera, A.; Gonzalez-Quiroga, A.; Duarte-Forero, J. Combustion and Performance Evaluation of a Spark Ignition Engine Operating with Acetone–Butanol–Ethanol and Hydroxy. Appl. Sci. 2021, 11, 5282. https://doi.org/10.3390/app11115282
Guillin-Estrada W, Maestre-Cambronel D, Bula-Silvera A, Gonzalez-Quiroga A, Duarte-Forero J. Combustion and Performance Evaluation of a Spark Ignition Engine Operating with Acetone–Butanol–Ethanol and Hydroxy. Applied Sciences. 2021; 11(11):5282. https://doi.org/10.3390/app11115282
Chicago/Turabian StyleGuillin-Estrada, Wilson, Daniel Maestre-Cambronel, Antonio Bula-Silvera, Arturo Gonzalez-Quiroga, and Jorge Duarte-Forero. 2021. "Combustion and Performance Evaluation of a Spark Ignition Engine Operating with Acetone–Butanol–Ethanol and Hydroxy" Applied Sciences 11, no. 11: 5282. https://doi.org/10.3390/app11115282
APA StyleGuillin-Estrada, W., Maestre-Cambronel, D., Bula-Silvera, A., Gonzalez-Quiroga, A., & Duarte-Forero, J. (2021). Combustion and Performance Evaluation of a Spark Ignition Engine Operating with Acetone–Butanol–Ethanol and Hydroxy. Applied Sciences, 11(11), 5282. https://doi.org/10.3390/app11115282