1. Introduction
Deep learning-based applications have outperformed the imagination of human beings in many aspects, such as computer vision, speech recognition, natural language processing, audio recognition, etc. [
1,
2,
3], but domain shifts dramatically damage the performance of deep learning methods [
4,
5]. In such a scenario, features extracted by a deep neural network, which was pre-trained using existing datasets (called the source domain), can become meaningless for the target task (referred to as the target domain). Essentially, the different data distributions between the source and target domain will hinder the generalization on the target task, which means the learned knowledge from source domains cannot be transferred to target domains.
To relieve the domain shift issue, which is common in practical scenarios, collecting labeled data and training a new classifier for every possible scenario can compensate the degradation in performance. However, the cost of acquiring huge volumes of labeled data remains expensive and time consuming. Domain Adaptation (DA) [
6] is an alternative solution, which, instead of collecting labeled data, utilizes known or labeled data to learn a classifier for unknown or unlabeled data. Domain adaptation is a particular case of Transfer Learning (TL), which has become commonplace in today’s deep learning-centric computer vision.
2. Related Work
CORrelation ALignment (CORAL) [
7] works well by aligning the distribution of the source and target features in an unsupervised manner. However, it only relies on a linear transformation to minimize the squared Frobenius norm distance of the covariances of the source and target features, which will limit flexibility and adaptability. Furthermore, CORAL needs to calculate the second-order statistics (covariances) at first between the source and target data and, after that, transform the source domain to the target domain to align their distributions. Training an extra classifier, such as Support Vector Machine (SVM), is necessary with transformed source domain data and, finally, classifying the target domain dataset. In this slightly tedious process, an external classifier must be involved to obtain the final category, which we call “not-end-to-end”.
Deep CORAL [
8] has been proposed using Deep Neural Networks (DNNs), which is a kind of nonlinear transformation to extend CORAL. Deep CORAL adds the objective function of basic CORAL to be a part of the total loss function, making full use of the characteristics of DNNs, which can minimize the loss function to align covariances between the source and target domain. Hence, Deep CORAL essentially overcomes the linear transformation dependence of CORAL attributed to the nonlinear characteristics of DNNs. Meanwhile, in order to address the not-end-to-end dilemma, Deep CORAL introduces joint training into neural network to reduce the influence of degenerated features induced by minimizing the CORAL loss alone. Nevertheless, we can still point out several problems existing in Deep CORAL.
First of all, Deep CORAL is not concerned with the quality of data, which will influence the accuracy. Deep CORAL extracts features of the source and target datasets using AlexNet only. AlexNet [
9], designed primarily by Alex Krizhevsky, is a Convolutional Neural Network (CNN), which became famous in 2012 since the championship with an error rate of 15.3% in the ImageNet Large Scale Visual Recognition Challenge (ILSVRC-2012). However, not all features extracted from convolutional layers can perfectly represent the original data. Our experiments illustrated this point (see
Section 4).
Secondly, according to [
8], the AlexNet used by Deep CORAL could project the source and target domain to a single point because Deep CORAL relies on the CORAL loss only. Therefore, joint training with both the classification loss and CORAL loss has been chosen by Deep CORAL to reduce this situation, but the classification loss could result in an offset when Deep CORAL tries to align the distributions of the source and target domain with minimizing CORAL loss.
Basically, minimizing CORAL loss only may align the second-order statistics of the source and target domain properly. However, if classification loss is added to the CORAL loss, then it will be a redundant term for CORAL, so the alignment will be disturbed because of it. To overcome this problem, we imported the p-norm [
10] to further align the distributions and improve the generalization accuracy.
In this paper, we introduced P-norm Attention Deep CORAL (P-ADC) to address the above challenges. The key insight underlying P-ADC is that we added attention into DNN of Deep CORAL, which not only retained the advantages of AlexNet, but also considered the use of attention to highlight image features, which had the effect of image preprocessing. Meanwhile, our experimental results show that Attention Deep CORAL provided an effective improvement when compared with traditional Deep CORAL. Furthermore, we extended the loss function of Deep CORAL, which included two parts into parts, to ease the second challenge mentioned above. The first part of the extended loss function still maintained the original classification loss function, and the rest we introduced contained the p-norm to balance the offset caused by the classification loss.
3. Method
Suppose the source domain training set , consists of N image-label pairs where is a source domain image, while is its corresponding label, and the target domain data , which are unlabeled. In the meantime, , and are the number, the feature vector means, and covariance matrices of the source and target data, respectively.
3.1. CORrelation ALignment
CORAL works by aligning the distributions of the source and target features in an unsupervised manner, matching the distributions by aligning the second-order statistics and the covariance, and applying a linear transformation
M to minimize the Frobenius distance metric.
where
is the covariance of the transformed source features and
and
are the covariance matrices. Let
be the singular-value decomposition (SVD) of
. Then, the final optimal value of
M as
where
denotes the Moore–Penrose pseudoinverse of
.
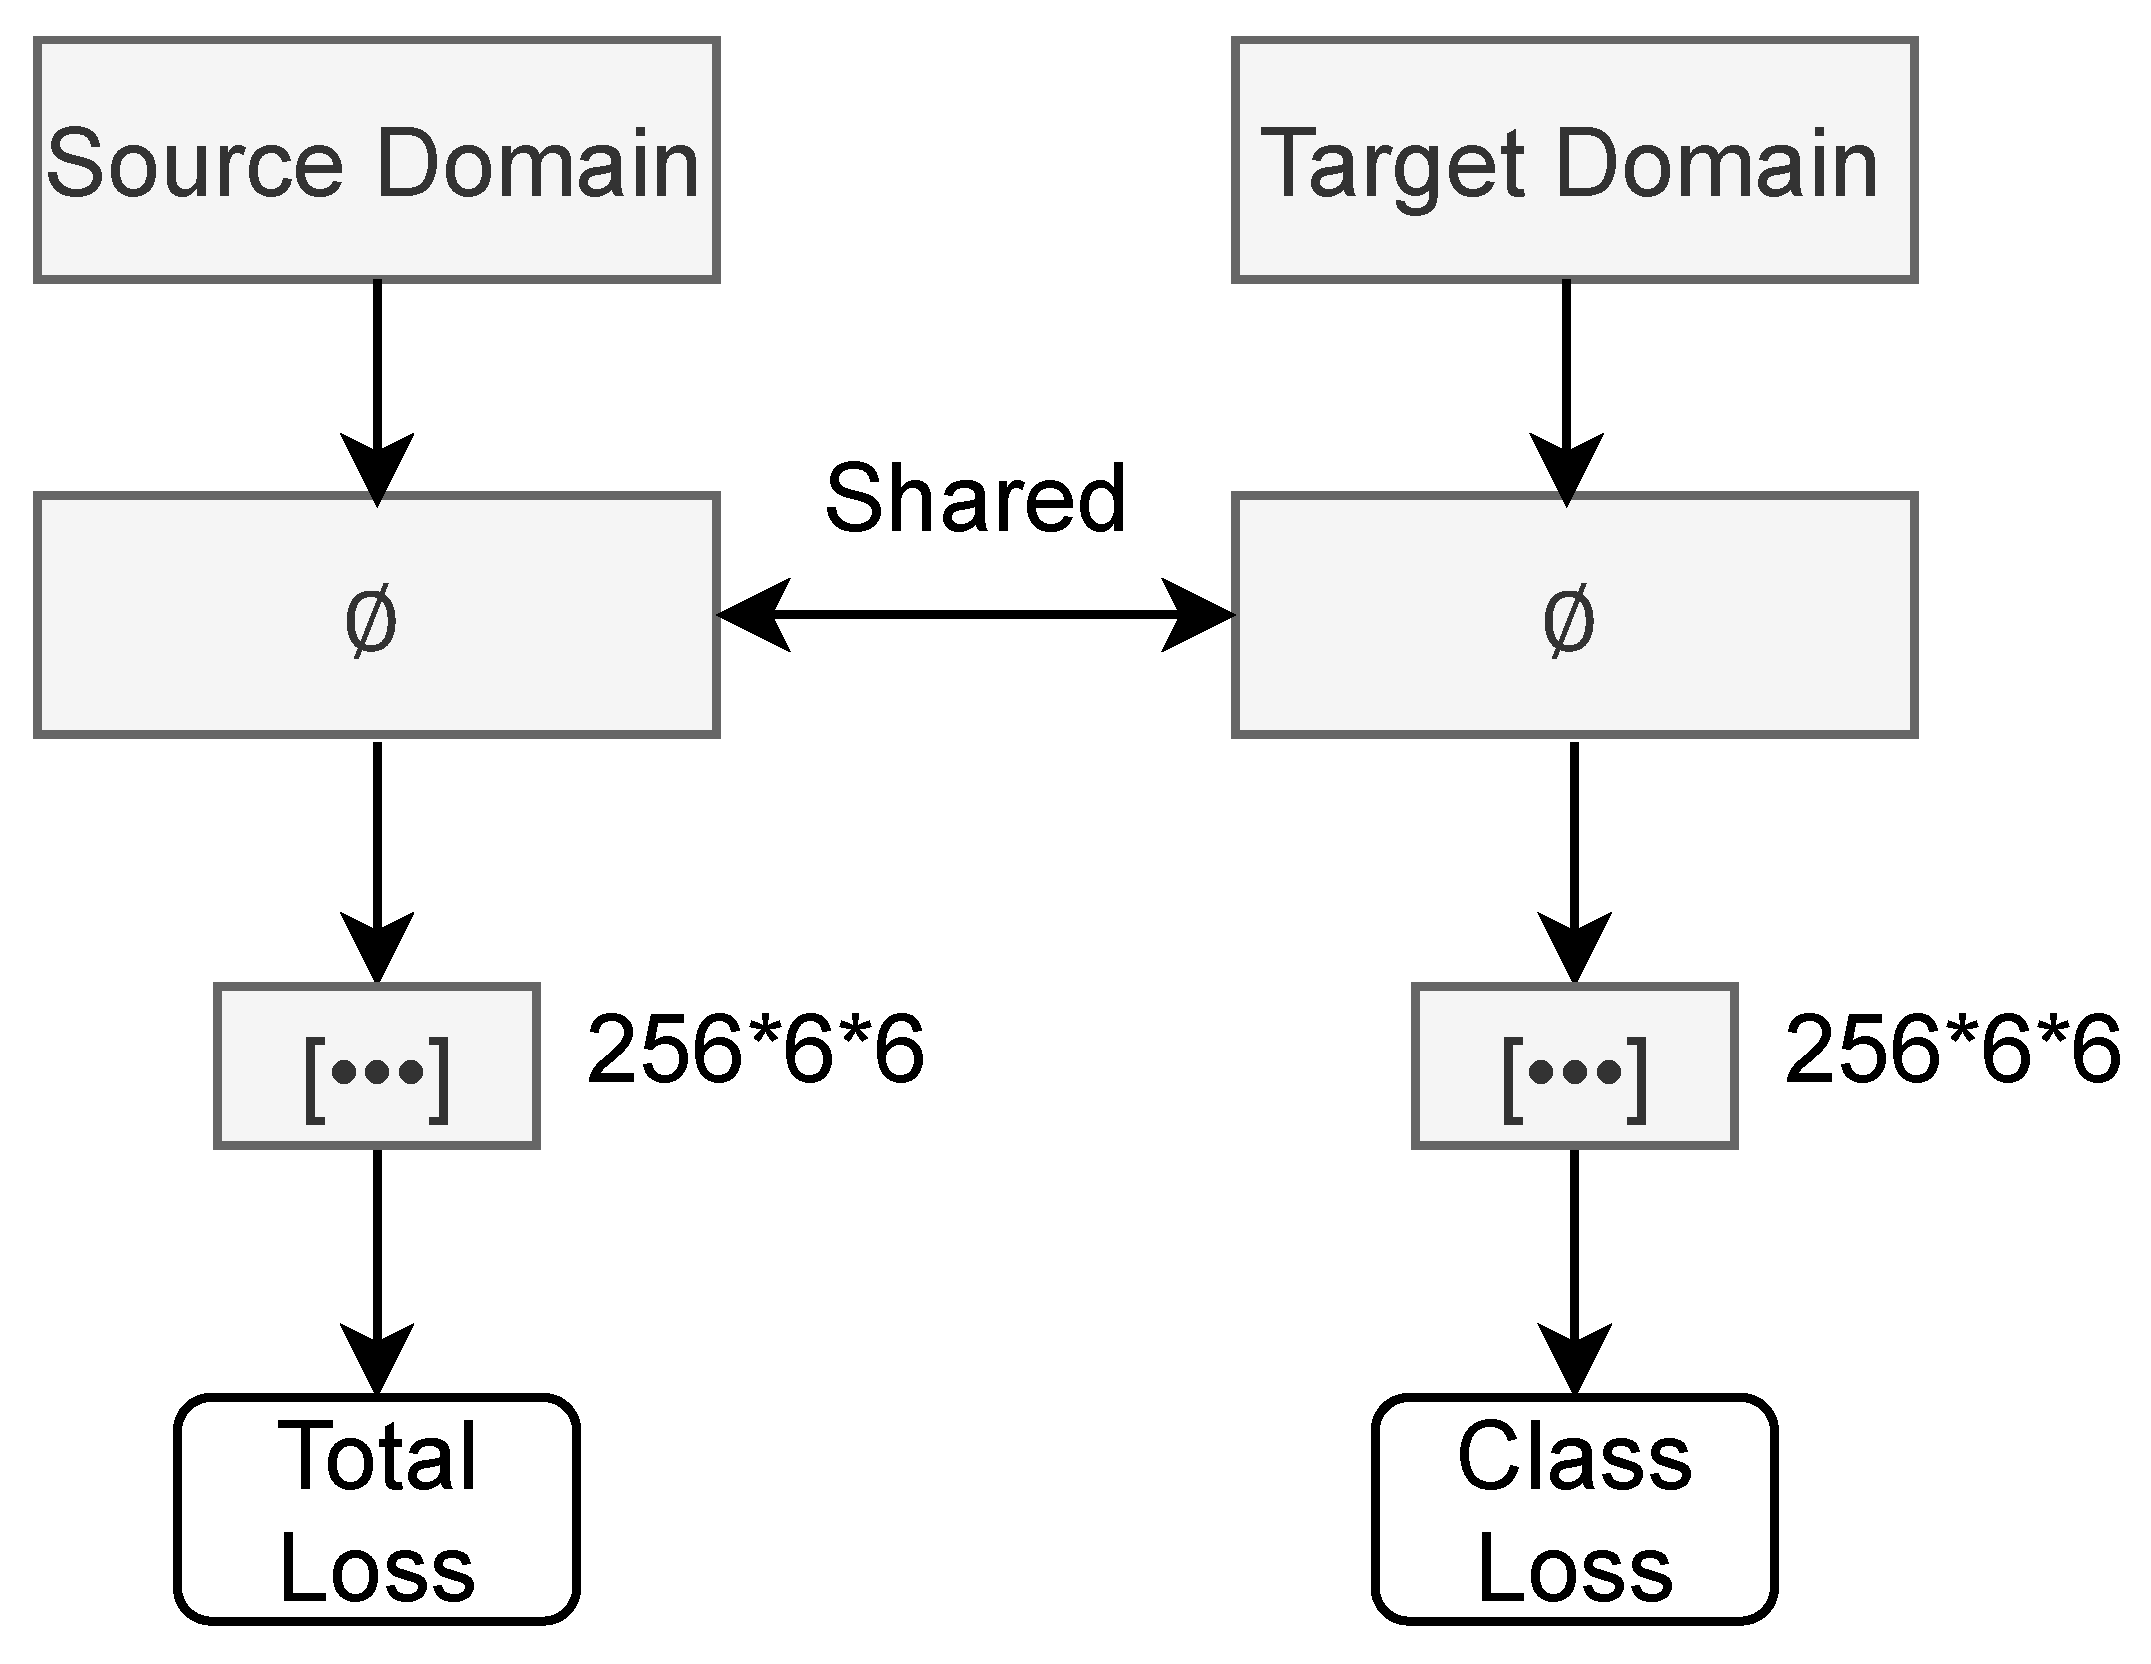
3.2. Deep CORAL
Deep CORAL minimizes the difference in the covariance between the source and target domain with the aid of a DNN. We defined the CORAL loss (Equation (
2)) as a part of the total loss function (Equation (
3)).
Figure 1 shows the architecture of Deep CORAL.
where
indicates the classification loss function, e.g., cross-entropy, square-loss, etc. Cross-Entropy was adopted in our experiments.
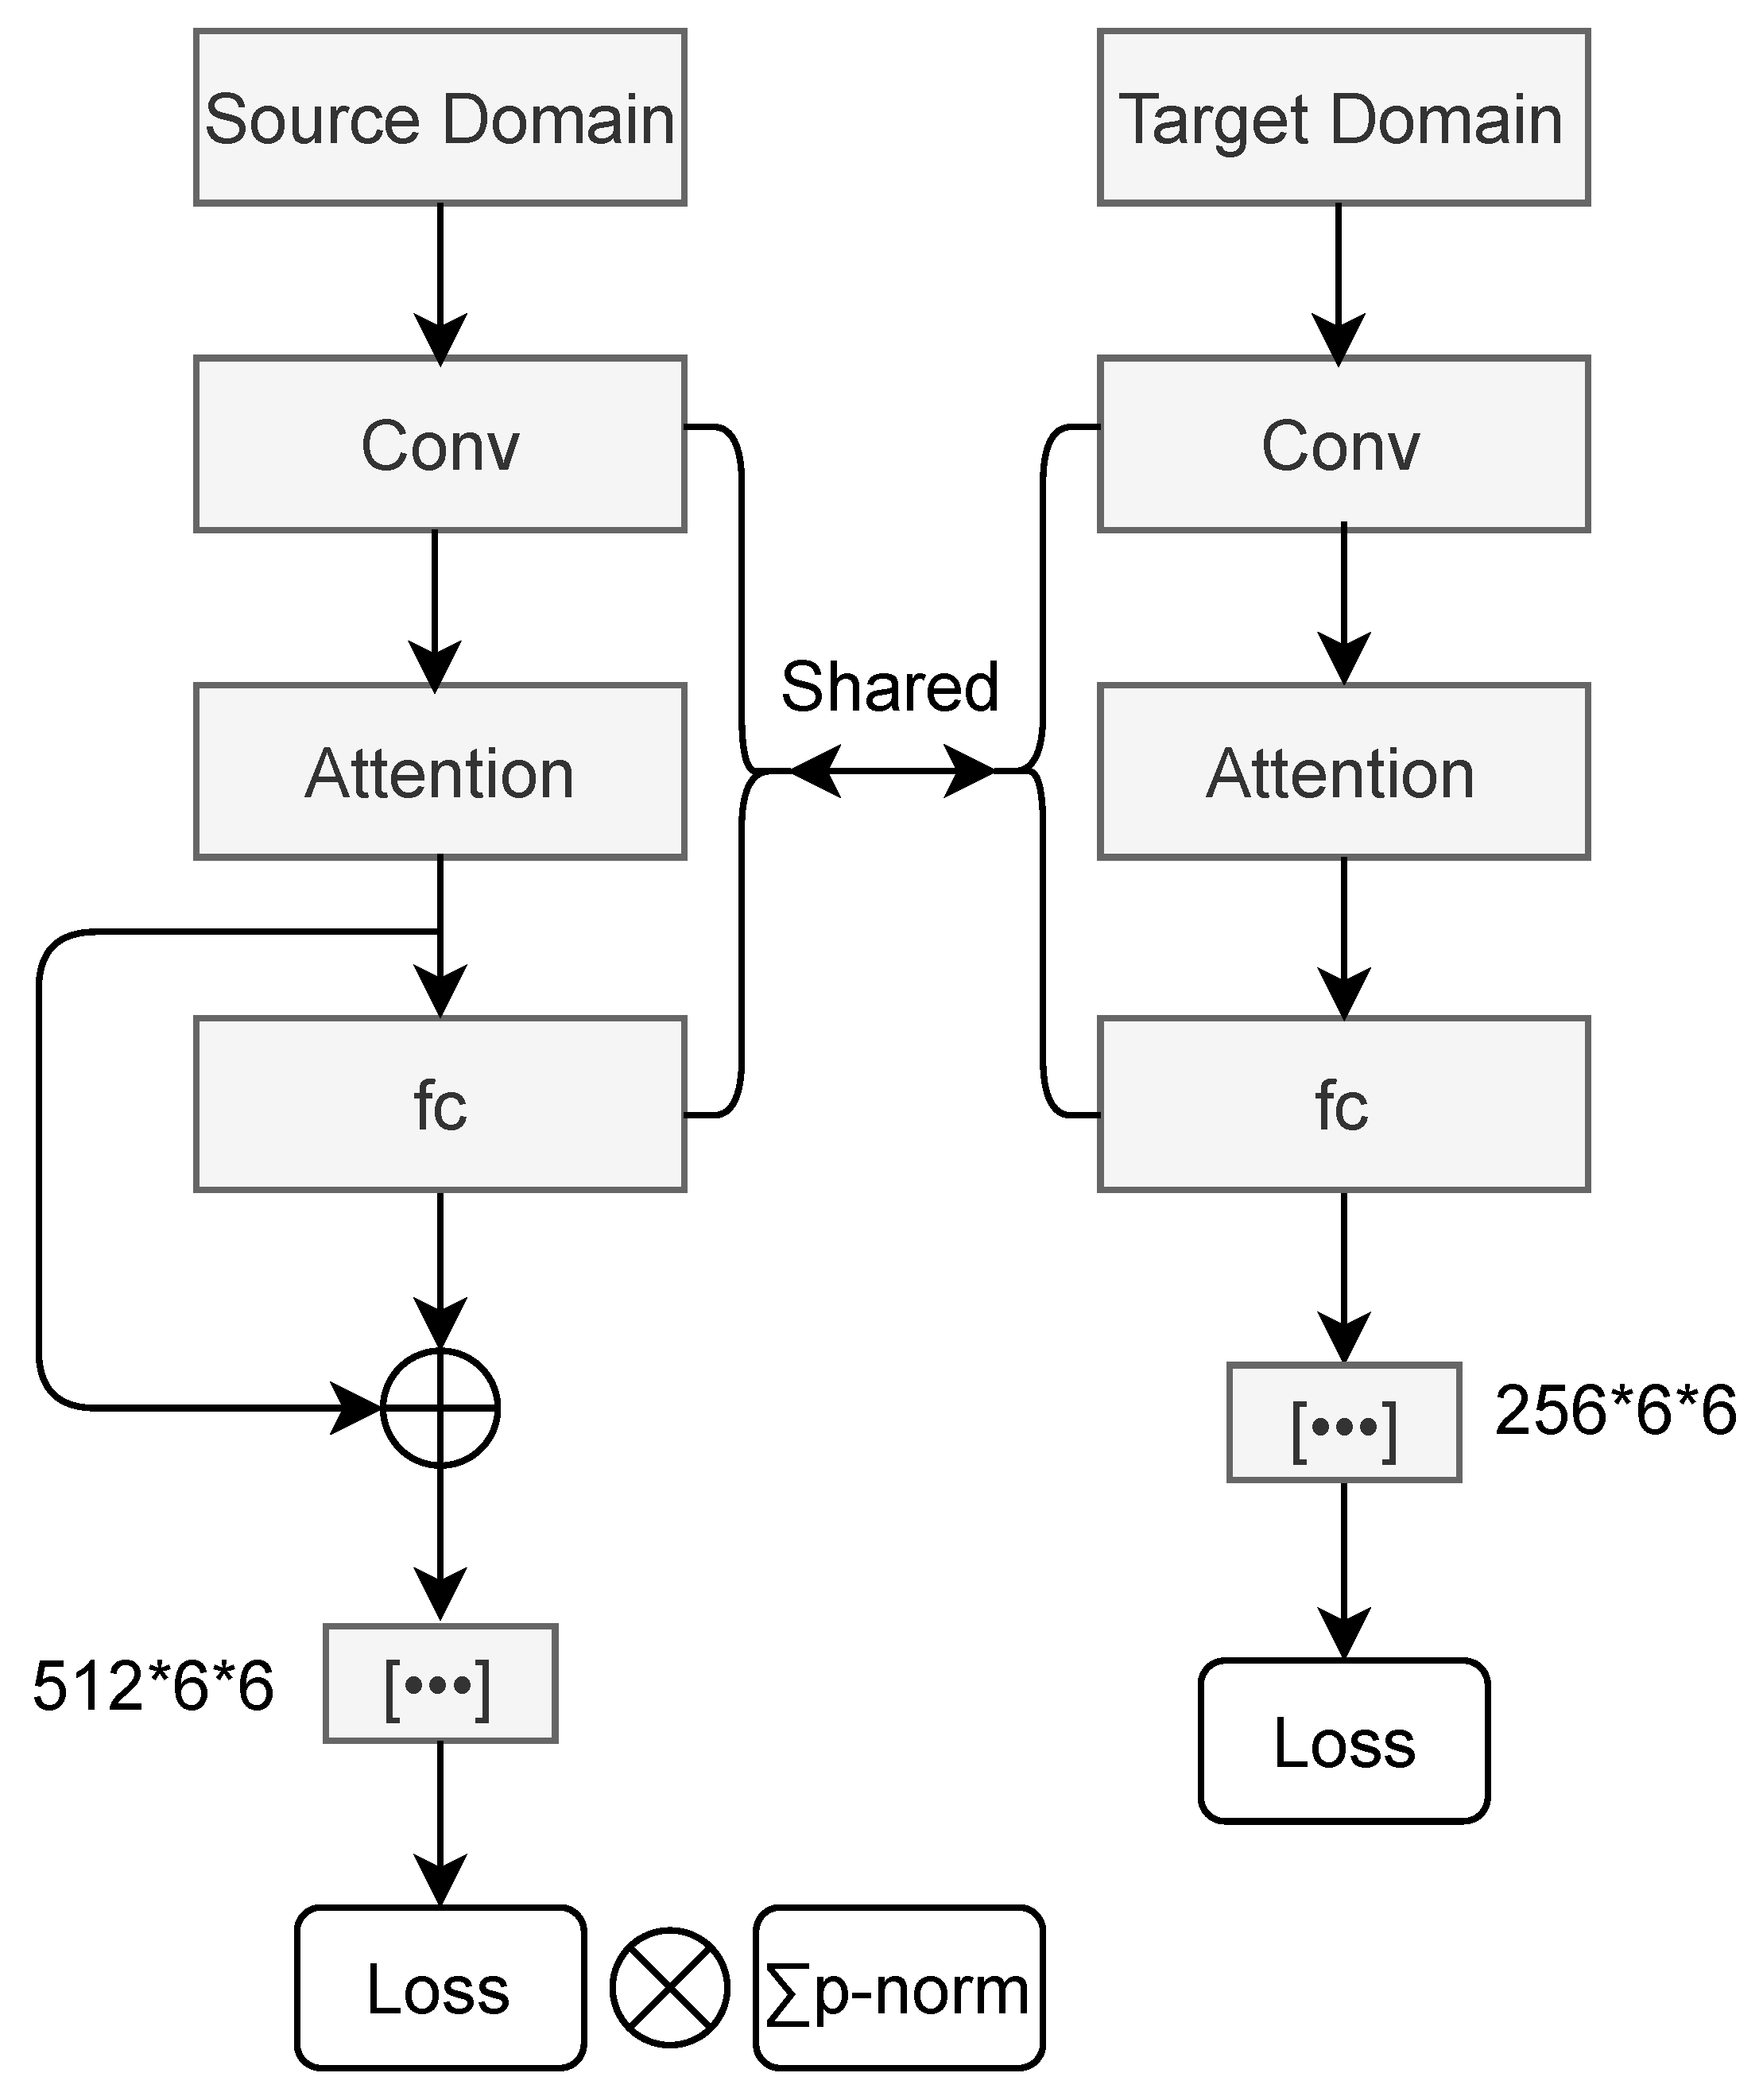
3.3. Our Method
Deep CORAL model was built using AlexNet in which convolutional layers are inefficient for modeling global dependencies in images due to its local view. We adapted the attention mechanism to overcome the shortcoming of AlexNet, enabling the image features extracted by convolutional layers to be able to provide more representative information. We call the proposed method P-norm Attention Deep CORAL (P-ADC) because of the added attention mechanism (see
Figure 2).
Suppose image features
are provided from the previous layer where
are the image features of each sample. Note that
C denotes the number of channels, and
is the width and height of the image features
x. Then, the energy of
is expressed as follows:
where
,
,
are the learned weight matrices, which belong to the convolutional layer with kernel_size = 1, stride = 1, and padding = 0.
C is the number of channels. Here, we can reduce the channel number
C to
[
11], where
was chosen in our experiment to reduce the number of parameters while not decreasing the performance significantly.
and
are two different feature spaces calculated with the image feature map
of the previous hidden layer.
means the energy of
.
j and
k indicate the position coordinates of the energy
of the ith image sample.
Attention mechanisms [
12,
13] have been employed successfully in sequence modeling and transduction problems such as speech recognition, neural captioning, etc., to tackle capturing long-range interactions for convolutions. Recently, attention mechanisms have also been applied in computer vision models to provide contextual information. The essence of the attention mechanism is actually an addressing process: Given a query vector
q related to the task and a key vector
k, the distribution values will be calculated by
q and
k, and then, attach it to the value vector
v. The main attention models are as follows.
Equation (
4) belongs to a kind of additive model.
The attention matrices of
are given by:
where
and
denote the attention matrices of
.
Then, the output of the attention layer is:
where
is the output of the attention layer. According to [
13], additive attention and dot-product attention are the most popular attention functions. Here, we also defined dot-product attention for the convenience of application.
.
The definition of the p-norm is as below:
We defined the p-norm loss between two domains for a single feature layer.
where
and
denote the feature covariance matrices.
d was set to the number of categories, i.e., the dimension or the output of the last fully connected layer. Therefore, according to the definition of CORAL loss, we have
. The total loss function is as follows:
where
trades off the adaptation and classification accuracy on the source domain.
4. Experiment Results
To evaluate our method, we performed experiments on a famous domain adaptation benchmark dataset, the Office-31 dataset [
14]. This dataset contains three image domains: DSLR, Amazon, and Webcam, and each of them has 31 classes with corresponding class names.
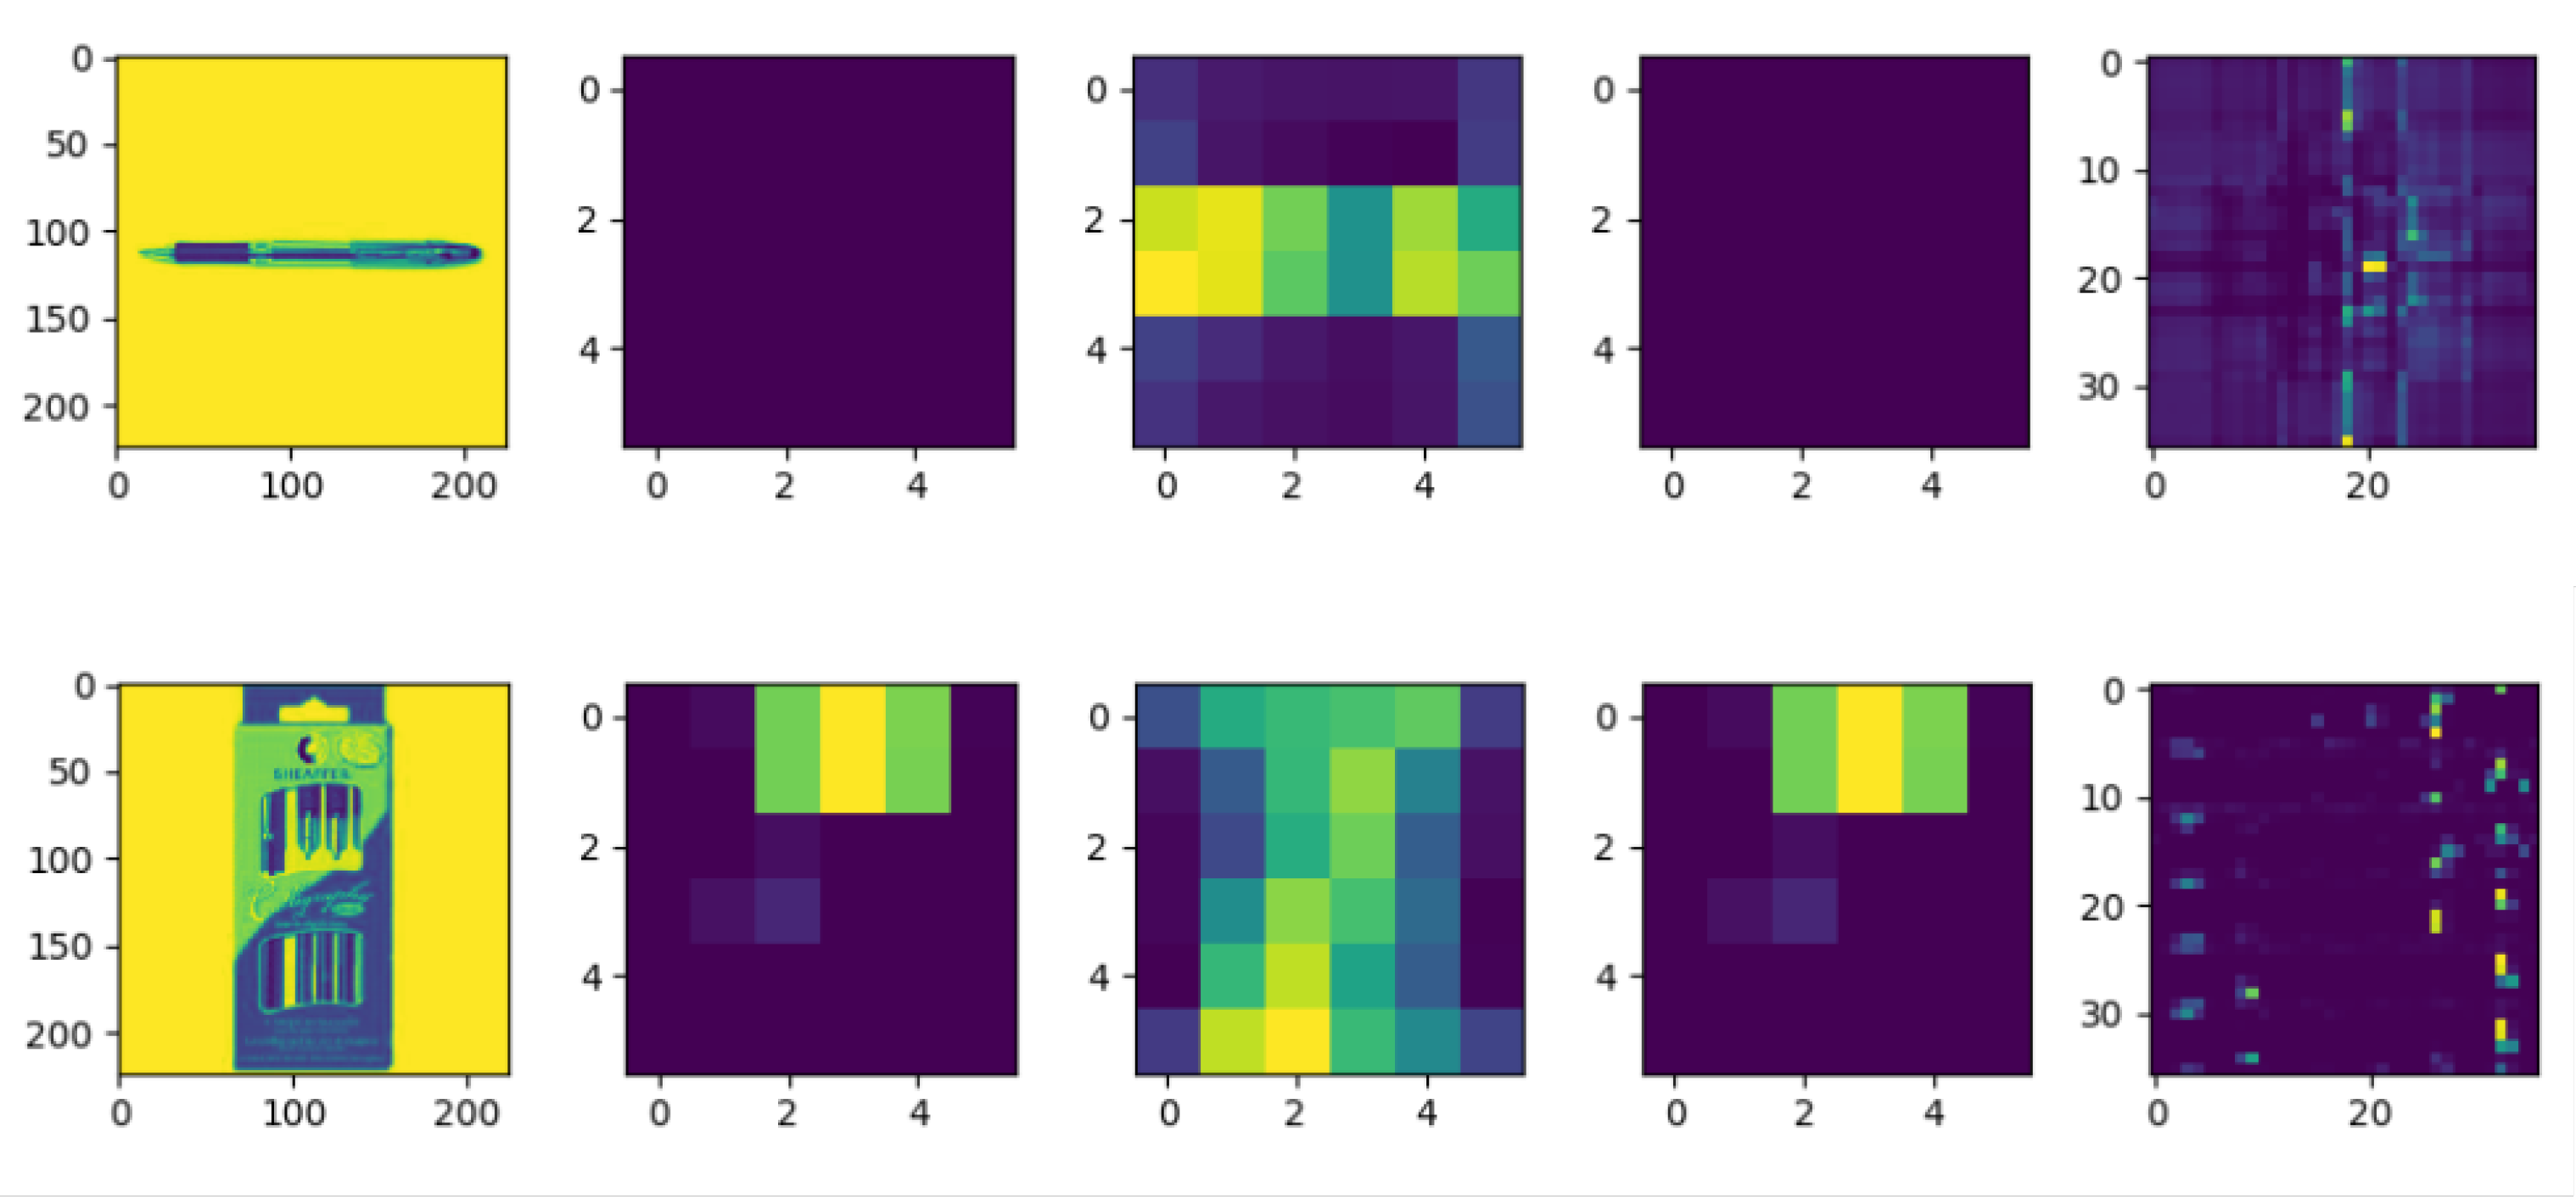
In
Figure 3, we compare the information quantity of feature maps for training with vs. without attention in Amazon. We can clearly see that adding attention helped the classifier acquire much more information, which means we can obtain higher test accuracy after adding attention.
In this experiment, we took one domain as the source domain and another as the target domain. We defaulted to the labels of all source domain data being given, and the labels of all target data were unknown. Because there are three domains in the Office-31 dataset, we can conduct our experiment on six experiment settings, namely: : (A)mazonas the source domain and (W)ebcam as the target domain; : (A)mazon as the source domain and (D)SLRas the target domain; : (W)ebcam as the source domain and (A)mazon as the target domain; : (W)ebcam as the source domain and (D)SLR as the target domain; : (D)SLR as the source domain and (A)mazon as the target domain; and : (D)SLR as the source domain and (W)ebcam as the target domain.
For comparative analysis of our method (P-ADC), in addition to Deep CORAL, we tested other well-known algorithms (deep domain confusion and conditional domain adversarial networks) on the Office-31 benchmark dataset. Deep Domain Confusion (DDC) [
15] adds an adaptation layer and domain confusion loss in AlexNet. Conditional Domain Adversarial Networks (CDANs) [
16] introduce multilinear conditioning and entropy conditioning to improve the discriminability and guarantee the transferability.
Following [
8], we initialized the weight of the last fully connected layer (fc8) with
and set the dimension to 31, the number of categories. The other layers of AlexNet were initialized with the pre-trained model parameters of ImageNet [
17], keeping the layerwise parameter settings. We also set batch size = 128, learning rate =
, weight decay =
, and momentum =
for all of the experiments below (
Table 1) for a fair comparison.
From
Table 1, we can see that P-ADC achieved higher average performance than Deep CORAL and the other baseline methods. In three out of six shifts, P-ADC
achieved the highest accuracy (
, where
t is the number of p-norm loss layers in a deep network and P-ADC
means that
p ranges from two to three). For the other three shifts, P-ADC
(
, where P-ADC
indicates that
p ranges from two to four) obtained the best scores. In this experiment, we only tried P-ADC
and P-ADC
because the p-norm loss would take up many computing resources with the increase of
p, resulting in the computing speed declining dramatically. In addition, as we can see from
Table 1, the test accuracy could not achieve the result of the official algorithm for all due to the fine-tuned AlexNet model from PyTorch, as well as the software and hardware environment.
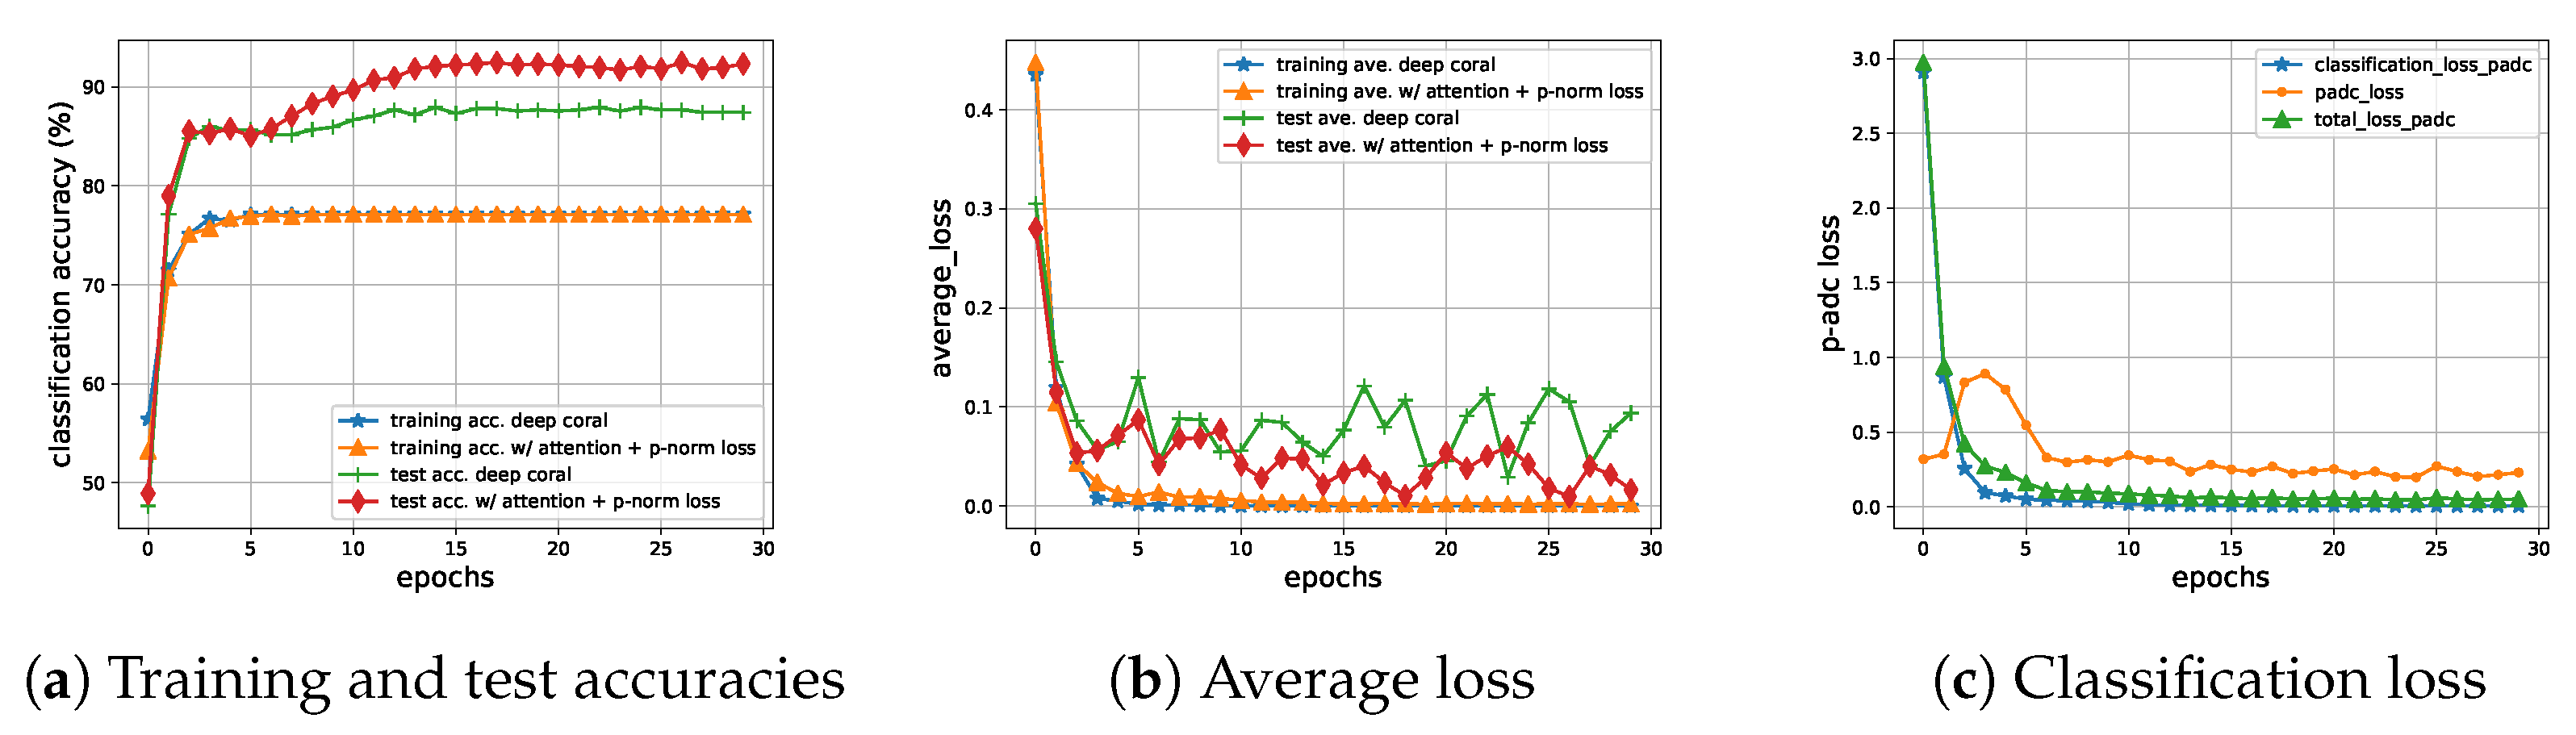
Figure 4 shows us three plots generated for shift
to assist us in analyzing P-ADC. In
Figure 4a, we visualize the process of training and testing on Deep CORAL and P-ADC. We can see our method outperformed Deep CORAL on the test accuracies.
Figure 4b shows the average loss in the training and test stage. It can be seen that our method was more stable in the test stage. Comparing
Figure 4b,c, we can conclude that the p-norm loss was not always decreasing during training as the CORAL loss, but nevertheless, the two losses were about the same after training for hundreds of iterations. Furthermore, our p-norm loss could converge finally, constraining the distance between the source and target domain and maintaining an equilibrium in the target domain even more effectively than the CORAL loss.
5. Conclusions
In this paper, we extended Deep CORAL, a simple, yet effective end-to-end adaptation in deep neural networks, with an attention mechanism to provide more information for deep neural networks. Meanwhile, we used the p-norm loss function to replace CORAL loss to balance the offset. Experiments on standard benchmark datasets (Office-31) showed state-of-the-art performance.
We tested our method on the classic benchmark dataset Office-31, and the experimental results showed us its effectiveness. One of the future research directions is the application of our method to a more diverse range of real-world applications and datasets. In addition, we are performing research on image recognition of vegetable diseases and insect pests under a greenhouse environment, which is very complicated. Different diseases and insect pests overlap, and light changes in real time. We hope to improve the accuracy of vegetable disease and insect pest identification with a domain adaptation method, including this method.
Author Contributions
Conceptualization, Z.-Y.W.; methodology, Z.-Y.W.; software, Z.-Y.W.; validation, Z.-Y.W.; formal analysis, Z.-Y.W.; investigation, Z.-Y.W.; resources, D.-K.K.; data curation, Z.-Y.W.; writing—original draft preparation, Z.-Y.W.; writing—review and editing, D.-K.K.; visualization, Z.-Y.W.; supervision, D.-K.K.; project administration, D.-K.K.; funding acquisition, D.-K.K. All authors read and agreed to the published version of the manuscript.
Funding
This research was supported by the Basic Science Research Program through the National Research Foundation of Korea (NRF) funded by the Ministry of Education (NRF-2018R1D1A1A02050166).
Institutional Review Board Statement
Not applicable.
Informed Consent Statement
Not applicable.
Data Availability Statement
Acknowledgments
The authors wish to thank members of the Dongseo University Machine Learn-ing/Deep Learning Research Laboratory and the anonymous referees for their helpful comments on earlier drafts of this paper.
Conflicts of Interest
The authors declare no conflict of interest.
References
- He, K.; Zhang, X.; Ren, S.; Sun, J. Delving Deep into Rectifiers: Surpassing Human-Level Performance on ImageNet Classification. In Proceedings of the 2015 IEEE International Conference on Computer Vision (ICCV), Santiago, Chile, 13–16 December 2015; pp. 1026–1034. [Google Scholar] [CrossRef] [Green Version]
- Silver, D.; Huang, A.; Maddison, C.J.; Guez, A.; Sifre, L.; van den Driessche, G.; Schrittwieser, J.; Antonoglou, I.; Panneershelvam, V.; Lanctot, M.; et al. Mastering the Game of Go with Deep Neural Networks and Tree Search. Nature 2016, 529, 484–489. [Google Scholar] [CrossRef] [PubMed]
- Schrittwieser, J.; Antonoglou, I.; Hubert, T.; Simonyan, K.; Sifre, L.; Schmitt, S.; Guez, A.; Lockhart, E.; Hassabis, D.; Graepel, T.; et al. Mastering Atari, Go, chess and shogi by planning with a learned model. Nature 2020, 588, 604–609. [Google Scholar] [CrossRef] [PubMed]
- Hoffman, J.; Rodner, E.; Donahue, J.; Saenko, K.; Darrell, T. Efficient Learning of Domain Invariant Image Representations. In Proceedings of the 1st International Conference on Learning Representations (ICLR), Scottsdale, Arizona, 2–4 May 2013. [Google Scholar]
- Luo, Y.; Zheng, L.; Guan, T.; Yu, J.; Yang, Y. Taking a Closer Look at Domain Shift: Category-Level Adversaries for Semantics Consistent Domain Adaptation. In Proceedings of the IEEE/CVF Conference on Computer Vision and Pattern Recognition (CVPR), Long Beach, CA, USA, 16–20 June 2019. [Google Scholar]
- Zhao, S.; Yue, X.; Zhang, S.; Li, B.; Zhao, H.; Wu, B.; Krishna, R.; Gonzalez, J.E.; Sangiovanni-Vincentelli, A.L.; Seshia, S.A.; et al. A Review of Single-Source Deep Unsupervised Visual Domain Adaptation. IEEE Trans. Neural. Netw. Learn. Syst. 2020. [Google Scholar] [CrossRef] [PubMed]
- Sun, B.; Feng, J.; Saenko, K. Return of frustratingly easy domain adaptation. arXiv 2015, arXiv:1511.05547. [Google Scholar]
- Sun, B.; Saenko, K. Deep Coral: Correlation Alignment for Deep Domain Adaptation. In European Conference on Computer Vision; Springer: Berlin/Heidelberg, Germany, 2016; pp. 443–450. [Google Scholar]
- Krizhevsky, A.; Sutskever, I.; Hinton, G.E. Imagenet classification with deep convolutional neural networks. Adv. Neural Inf. Process. Syst. 2012, 25, 1097–1105. [Google Scholar] [CrossRef]
- Wikipedia Contributors. Norm (Mathematics)—Wikipedia, The Free Encyclopedia. 2021. Available online: https://en.wikipedia.ahut.cf/w/index.php?title=Norm_(mathematics)&oldid=1020979856 (accessed on 19 May 2021).
- Zhang, H.; Goodfellow, I.; Metaxas, D.; Odena, A. Self-attention generative adversarial networks. In Proceedings of the International Conference on Machine Learning, Long Beach, CA, USA, 9–15 June 2019; pp. 7354–7363. [Google Scholar]
- Ramachandran, P.; Parmar, N.; Vaswani, A.; Bello, I.; Levskaya, A.; Shlens, J. Stand-alone self-attention in vision models. arXiv 2019, arXiv:1906.05909. [Google Scholar]
- Vaswani, A.; Shazeer, N.; Parmar, N.; Uszkoreit, J.; Jones, L.; Gomez, A.N.; Kaiser, L.; Polosukhin, I. Attention is all you need. arXiv 2017, arXiv:1706.03762. [Google Scholar]
- Saenko, K.; Kulis, B.; Fritz, M.; Darrell, T. Adapting visual category models to new domains. In European Conference on Computer Vision; Springer: Berlin/Heidelberg, Germany, 2010; pp. 213–226. [Google Scholar]
- Tzeng, E.; Hoffman, J.; Zhang, N.; Saenko, K.; Darrell, T. Deep domain confusion: Maximizing for domain invariance. arXiv 2014, arXiv:1412.3474. [Google Scholar]
- Long, M.; Cao, Z.; Wang, J.; Jordan, M.I. Conditional adversarial domain adaptation. In Advances in Neural Information Processing Systems; NeurIPS: Montreal, QC, Canada, 3–8 December 2018; pp. 1640–1650. [Google Scholar]
- Deng, J.; Dong, W.; Socher, R.; Li, L.J.; Li, K.; Li, F.F. ImageNet: A large-scale hierarchical image database. In Proceedings of the 2009 IEEE Conference on Computer Vision and Pattern Recognition, Miami Beach, FL, USA, 20–25 June 2009; pp. 248–255. [Google Scholar]
| Publisher’s Note: MDPI stays neutral with regard to jurisdictional claims in published maps and institutional affiliations. |
© 2021 by the authors. Licensee MDPI, Basel, Switzerland. This article is an open access article distributed under the terms and conditions of the Creative Commons Attribution (CC BY) license (https://creativecommons.org/licenses/by/4.0/).


