Article

Experimental Study of See-Saw Mode Nano-Vibration on Orifice-Type Restrictors

College of Metrology and Measurement Engineering, China Jiliang University, Hangzhou 310018, China
*
Authors to whom correspondence should be addressed.
Appl. Sci. 2021, 11(11), 5265; https://doi.org/10.3390/app11115265
Submission received: 29 April 2021 / Revised: 23 May 2021 / Accepted: 4 June 2021 / Published: 6 June 2021

Abstract

:
Slide stability is key to the aerostatic guide in ultra-precise machines; thus, it has garnered plenty of attention. Macro-scale studies are commonplace, but micro- and nano-vibration issues require more attention. Microscope vibration is mainly caused by tiny changes in the fluid parameters of lubricating gas film, which is complex and has no verdict. In this case, slide-gas interaction should be considered. In this study, the widely used orifice-type restrictor was investigated for its nano-vibration performance. A Comsol finite-element-method fluid–structure interaction model was used to simulate and analyze an orifice-type restrictor, and orifice-restrictor vibration characteristics at the nanometer scale were inspected using a high-performance laser vibrometer. The results demonstrate that see-saw mode vibrations occur in the restrictors, growing stronger with increased air-supply pressure. The see-saw vibration’s axis is speculatively determined based on orifice and restrictor structures, and the vibration type is related to the number of orifices. The results also show that the vibration is random with natural frequencies at the kilohertz level. The newly provided research results are beneficial for better understanding the nano-vibrations of orifice-type restrictors.

1. Introduction

Aerostatic bearings are widely employed in ultra-precision machine tools, owing to their low friction and high accuracy. When in use, the aerostatic bearings are supplied with external compressed air, which enters through restrictor orifices to form a layer of gas film that floats the slide. Many efforts are taken to properly align the air-supply pressure, restrictor parameters and gas clearance to ensure the optimal static performance of load capacity and stiffness [1,2,3]. For nanometer and sub-nanometer moving and positioning demands, absolute stability of the slide is required. Hence, the dynamic performance of the slide garners the most research attention. However, the air-supply pressure, restrictor parameters and gas clearance determine the flow-field characteristics (e.g., pressure distribution, temperature transmit, mass flow rate and charge coefficient), which are related to the gas-flow pattern. The Reynolds-number kinetic parameter is used to judge laminar or turbulent gas-flow patterns. Zhu et al. [4] showed that when the fluid Reynolds number exceeds a certain value, the pressure of the gas film will be greatly changed, affecting bearing stability. Li et al. [5] verified that the Reynolds number represented the degree of bearing micro-vibration; that is, when the Reynolds number increases, the gas film becomes turbulent and the vortex is enhanced to enlarge the vibration. In large Reynolds-number cases, self-excited vibrations (i.e., pneumatic hammering [6]) occurs at a low specific stiffness, often causing shock waves [7]. Hence, some researchers have regarded the micro-vibration as a vortex excitation. Chen et al. [8] established a relationship between gas vortices and nano-vibrations, demonstrating that the vibration energy of the aerostatic bearing increases with the strength of the air vortices. Chen [9,10,11] confirmed the vibration’s macroscopic factors of gas-source fluctuation, guideway noise, environment features, etc., further illuminating the relationship of the three micro-scale factors (i.e., first-order velocity slip, flow factor and effective viscosity) of the vibration. He showed that with the increase in film thickness, the micro-scale factors have little effect on the frequency at the maximum amplitude. However, they can be used to correct the vibration equations.
Most research has focused on the gas film itself. Nonetheless, the fluid–structure interaction (FSI) phenomenon should be further considered with respect to vibration. Practically, the FSI is a two-way problem. That is, the structural deformation of the slide or the restrictor and the air–gas pressure fluctuation mutually interact. Hoopes et al. [12] created a two-way fluid structure interaction model with conjugate heat transfer was created to study a spiral groove thrust bearing at various operating conditions, and they claimed that it is possible to use fluid–structure interaction to predict the load capacity for high-speed spiral groove thrust bearing. Dhar et al. [13] presented a novel fluid–structure interaction-thermal coupled model for the lateral lubricating gaps between gears and lateral bushes in external gear machines (EGMs), and proposed a novel relative lubricant film thickness measurement method in gear machines using capacitive sensors presented to validate the spatial film thickness predictions. Gao et al. [14] studied the multi-physics coupling phenomenon of a high-speed aerostatic spindle. Wang et al. [15] clarified the impact of structural deformation on a bearing using an FSI simulation model. Yan et al. [16] established a theoretical model of fluid–structure interactions using a numerical simulation to resolve the mechanical properties of aerostatic guideways with porous restrictors. Dhande et al. [17] used the CFD-FSI technique to analyze a three-lobe journal bearing based on ANSYS Workbench software to estimate the structural deformations, fluid pressure forces and displacements. Wang et al. [18] used the two-way coupled fluid–structure interaction to analyze the stability characteristics of a soft rotor and gas bearings, deriving the dynamic parameters for varying bearing capacity, rotational speed and temperature. Gao et al. [19] proposed a two-round optimization design method for aerostatic spindles considering the FSI effect. They revealed the deformation law of guideways for different materials and gas film thicknesses. Unfortunately, such discussions have rarely included FSI vibrations in restrictors.
To reduce vibrations and optimize performance, several applications have been proposed. Li et al. [5] showed that to suppress micro-vibrations, the air-supply pressure should be kept as small as possible. Small air-pockets and orifice diameters are also needed. Li et al. [20,21] studied the gas-pressure fluctuation and vibration characteristics inside an aerostatic thrust bearing equipped with a pocketed orifice-type restrictor, and a flow-field disturbance structure was created for the air chamber, changing the internal microscopic flow field [22]. These theoretical models were established for different conditions under a variety of restrictor types, such as orifice, slot or porous. When studying static performance, pocket structures, recesses and grooves are often found on the restrictors, which complicates the models. Hence, although more time-consuming than solving the governing air-film equations, the computational fluid dynamics (CFD) domain analysis has become popular [23]. Highly precise sensors (e.g., linear variable differential transducer accelerometers [8], piezoelectric acceleration sensors [10], laser displacement transducers [22], and capacitive displacement sensors [24]) have been employed to measure the vibration displacement and acceleration. Compared with experimental environments and device limits, micro- and nano-vibration experiments are complicated.
This paper examines new FSI vibrational performance at the nano-scale from a microscopic perspective. In Section 2, an equivalent model of a one-orifice-type restrictor is described, and a finite element model (FEM) based on the COMSOL FSI model was used for simulation. The simulation results are discussed as well. In Section 3, two types of restrictor vibration characteristics are inspected from experiments. A POLYTEC OFV505/5000 high-performance laser vibrometer is employed to obtain nanometer vibrations, and the time-domain results and frequency-domain results of restrictor vibration are analyzed to reveal the orifice-type restrictors. Discussion and conclusions are in Section 4 and Section 5.

2. Materials and Methods

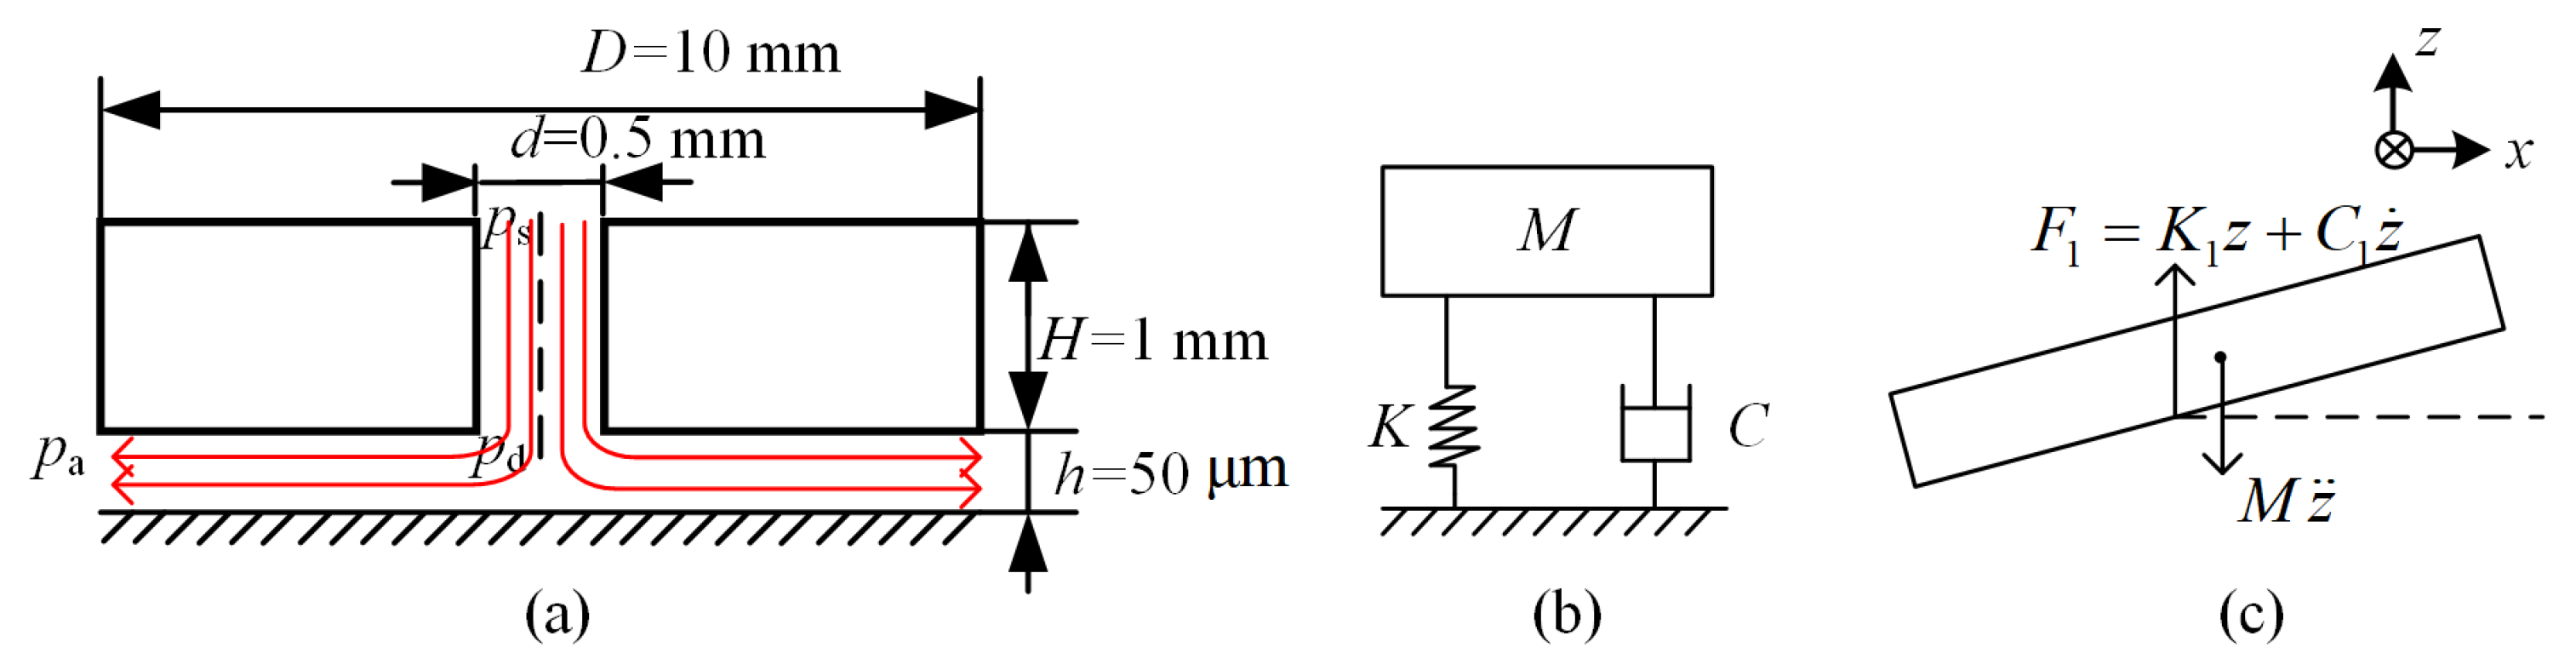
2.1. Orifice-Type Flat Restrictor Vibration Model

The orifice-type restrictor is currently the most widely used type. A flat circle restrictor with an orifice at its center is as shown in Figure 1a. When the air-supply of p s flows into an orifice of diameter d, a gas film is formed with a clearance of h. Normally, h is under 20 μ m to avoid vortex-induced vibration. When analyzing the motion, the gas film between the slide plate (i.e., the restrictor) and the guide-way can be simplified as a spring system [8,9], as shown in Figure 1b.
Regarding the multi-orifice restrictor, each orifice corresponds to a mass–spring–damper system, and the motion equation applies to each orifice [10,11]. Ignoring the drive chain, external load and overload torque [10], the orifice-type restrictor follows the motion of Equation (1). i = 1 implies that the one-orifice-type restrictor is considered:
M z ¨ + i = 1 n F i = 0 ( F i = K i z + C i z ˙ ) J 0 θ ¨ + i = 1 n M i = 0 ( M i = F i l i )
where z is normal displacement, θ is the rotation angle, M is the quality of the restrictor as a slide plate, J 0 is the moment of inertia of slide plate, F i is the force of the gas film in each orifice, K i and C i are the stiffness and damping of the gas, M i is the torque generated by the gas film force in each orifice, and l i is the force arm of each orifice to the mass plate’s centroid point. When considering the static performance of the restrictors, Equation (1) is sufficient to describe the motion, even if the stiffness and damping of each are equal. However, for the dynamic vibration, K i and C i must be different from the gas fluctuation of pressure, viscosity, etc. In addition to the inhomogeneous production of restrictors and the FSI phenomenon, the vibration motion is a relatively complex mathematical equation; it inevitably encounters difficulties with integration and large calculations. CFD, therefore, provides the many conveniences of FEM [16,24].

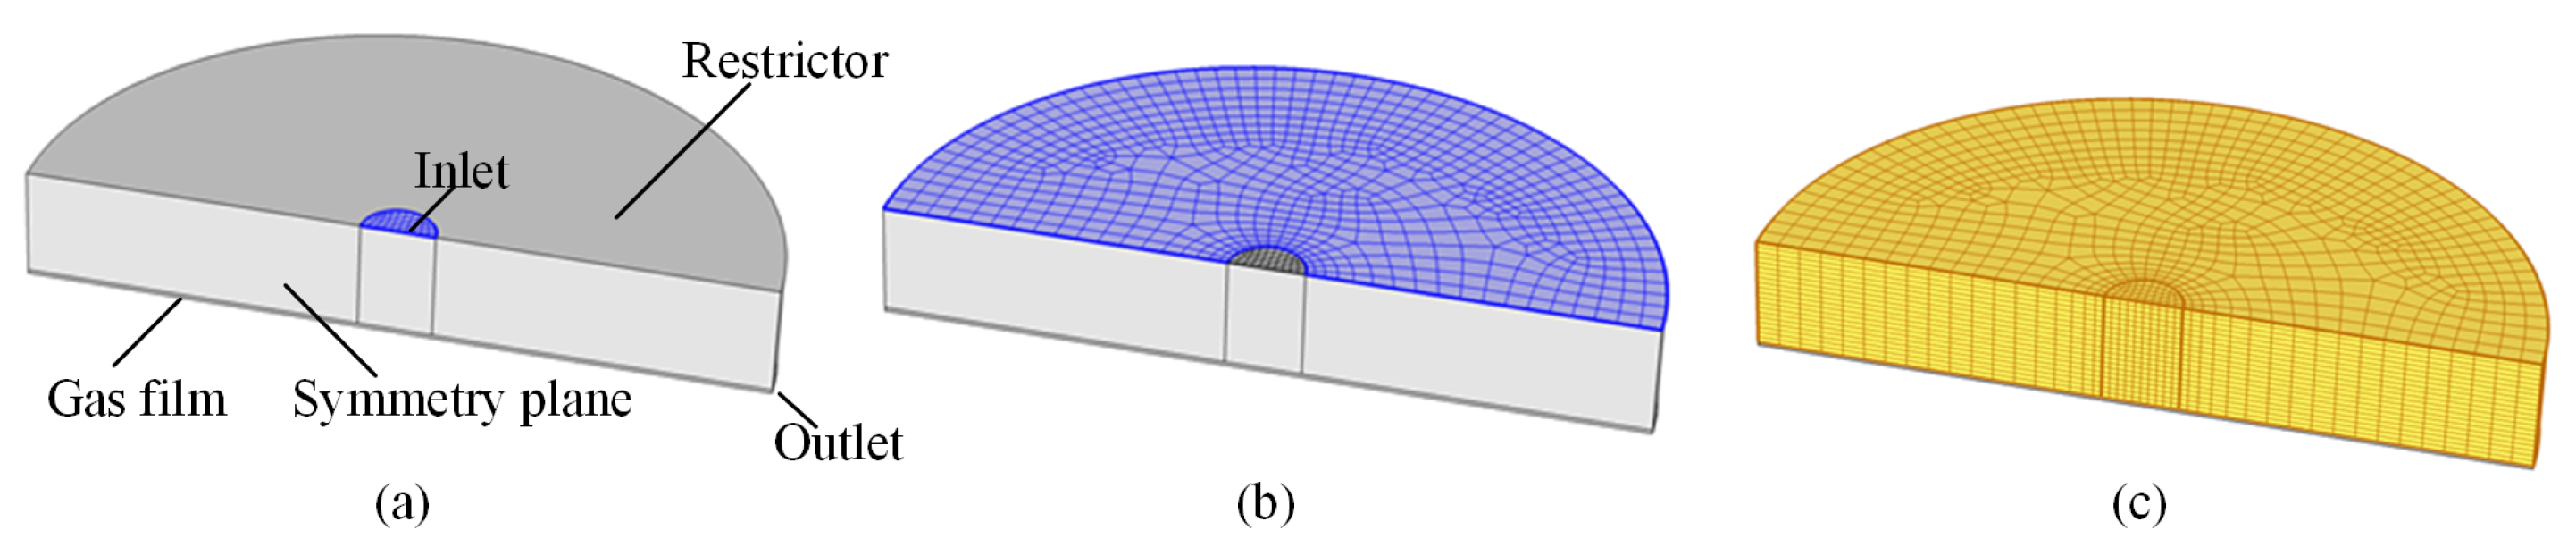
2.2. Simulation on One-Orifice-Type Restrictor Based on FEM FSI

An FEM FSI was built as shown in Figure 2. The restrictor and gas film metrics are as shown in Figure 1. The computer configuration was as follows: CPU Intel X5650 2.6 GHz, 24-GB RAM, Matrox G200 eW (Winbond) integrated graphics and a 2-terabyte hard disk. The restrictor is set into 20 layers, and the gas is five layers. The gas in the FEM model was set to a dynamic grid with a Yeoh smoothing type. Then, 19,725 grids were obtained with an average mesh quality >0.89. Finally, the structure was set to forge aluminum 6061 with a density, ρ s = 2.75 g/cm 3 , Young’s modulus, E = 205 MPa and Poisson ratio, μ s = 0.33. The gas parameters were set to “air” with a coefficient of kinetic viscosity, μ g = Pa/s, air density, μ g = 1.225 kg/m 3 and gauge-pressure-at-outlet, 0 Pa. With the FEM FSI model, each grid at the interface was a fluid–structure interface set with equilibria of stress ( τ ), displacement (d), heat flux (q) and temperature (T), as shown in Equation (2) [16]:
τ f · n f = τ s · n s d f = d s q f = q s T f = T s
where the subscripts, f and s, are fluid and solid, respectively.
In CFD, the steady-state calculation result from the Reynolds average Navier–Stokes (RANS) of the basin was used as the initial value of the transient simulation. Furthermore, the fluid in FSI model was calculated in large eddy simulation (LES). The solution length was set to 0.0001 s, and the total time as 0.005 s. The convergence of the results is default, 0.0001. The transient characteristics and the average amplitude characteristics of the normal vibration of the restrictor were obtained. Figure 3 shows the results of the transient normal amplitude distribution, A, under different inlet air velocities, v a .
Figure 4 shows the time-averaged normal amplitude, A a , at different inlet gas flow velocities, v a . Here, we did not set the inlet air pressure, owing to the simplified FEM FSI. However, it is certain that the air velocity, v a , is determined by the air-supply and the restrictor parameters if the load is stable or none.
When increasing the inlet air velocity, v a , in the FEM FSI model, the simulation solution failed, probably because of the computer configuration, according to a COMSOL technicians’ consultation. Fortunately, we made some compelling findings. From the simulation results, we present the following findings.
  • The restrictor presents normal linear vibration and rotation, which is consistent with the equation of motion given by Equation (1). The change in displacement shown in Figure 3 supports this well.
  • The rotational axis passes through the center of gravity in the xy plane (Figure 3), but it is not restricted to the x or y axes. The average normal amplitude is equal along the circumference, as shown in Figure 4, which means the rotation axis can be random.
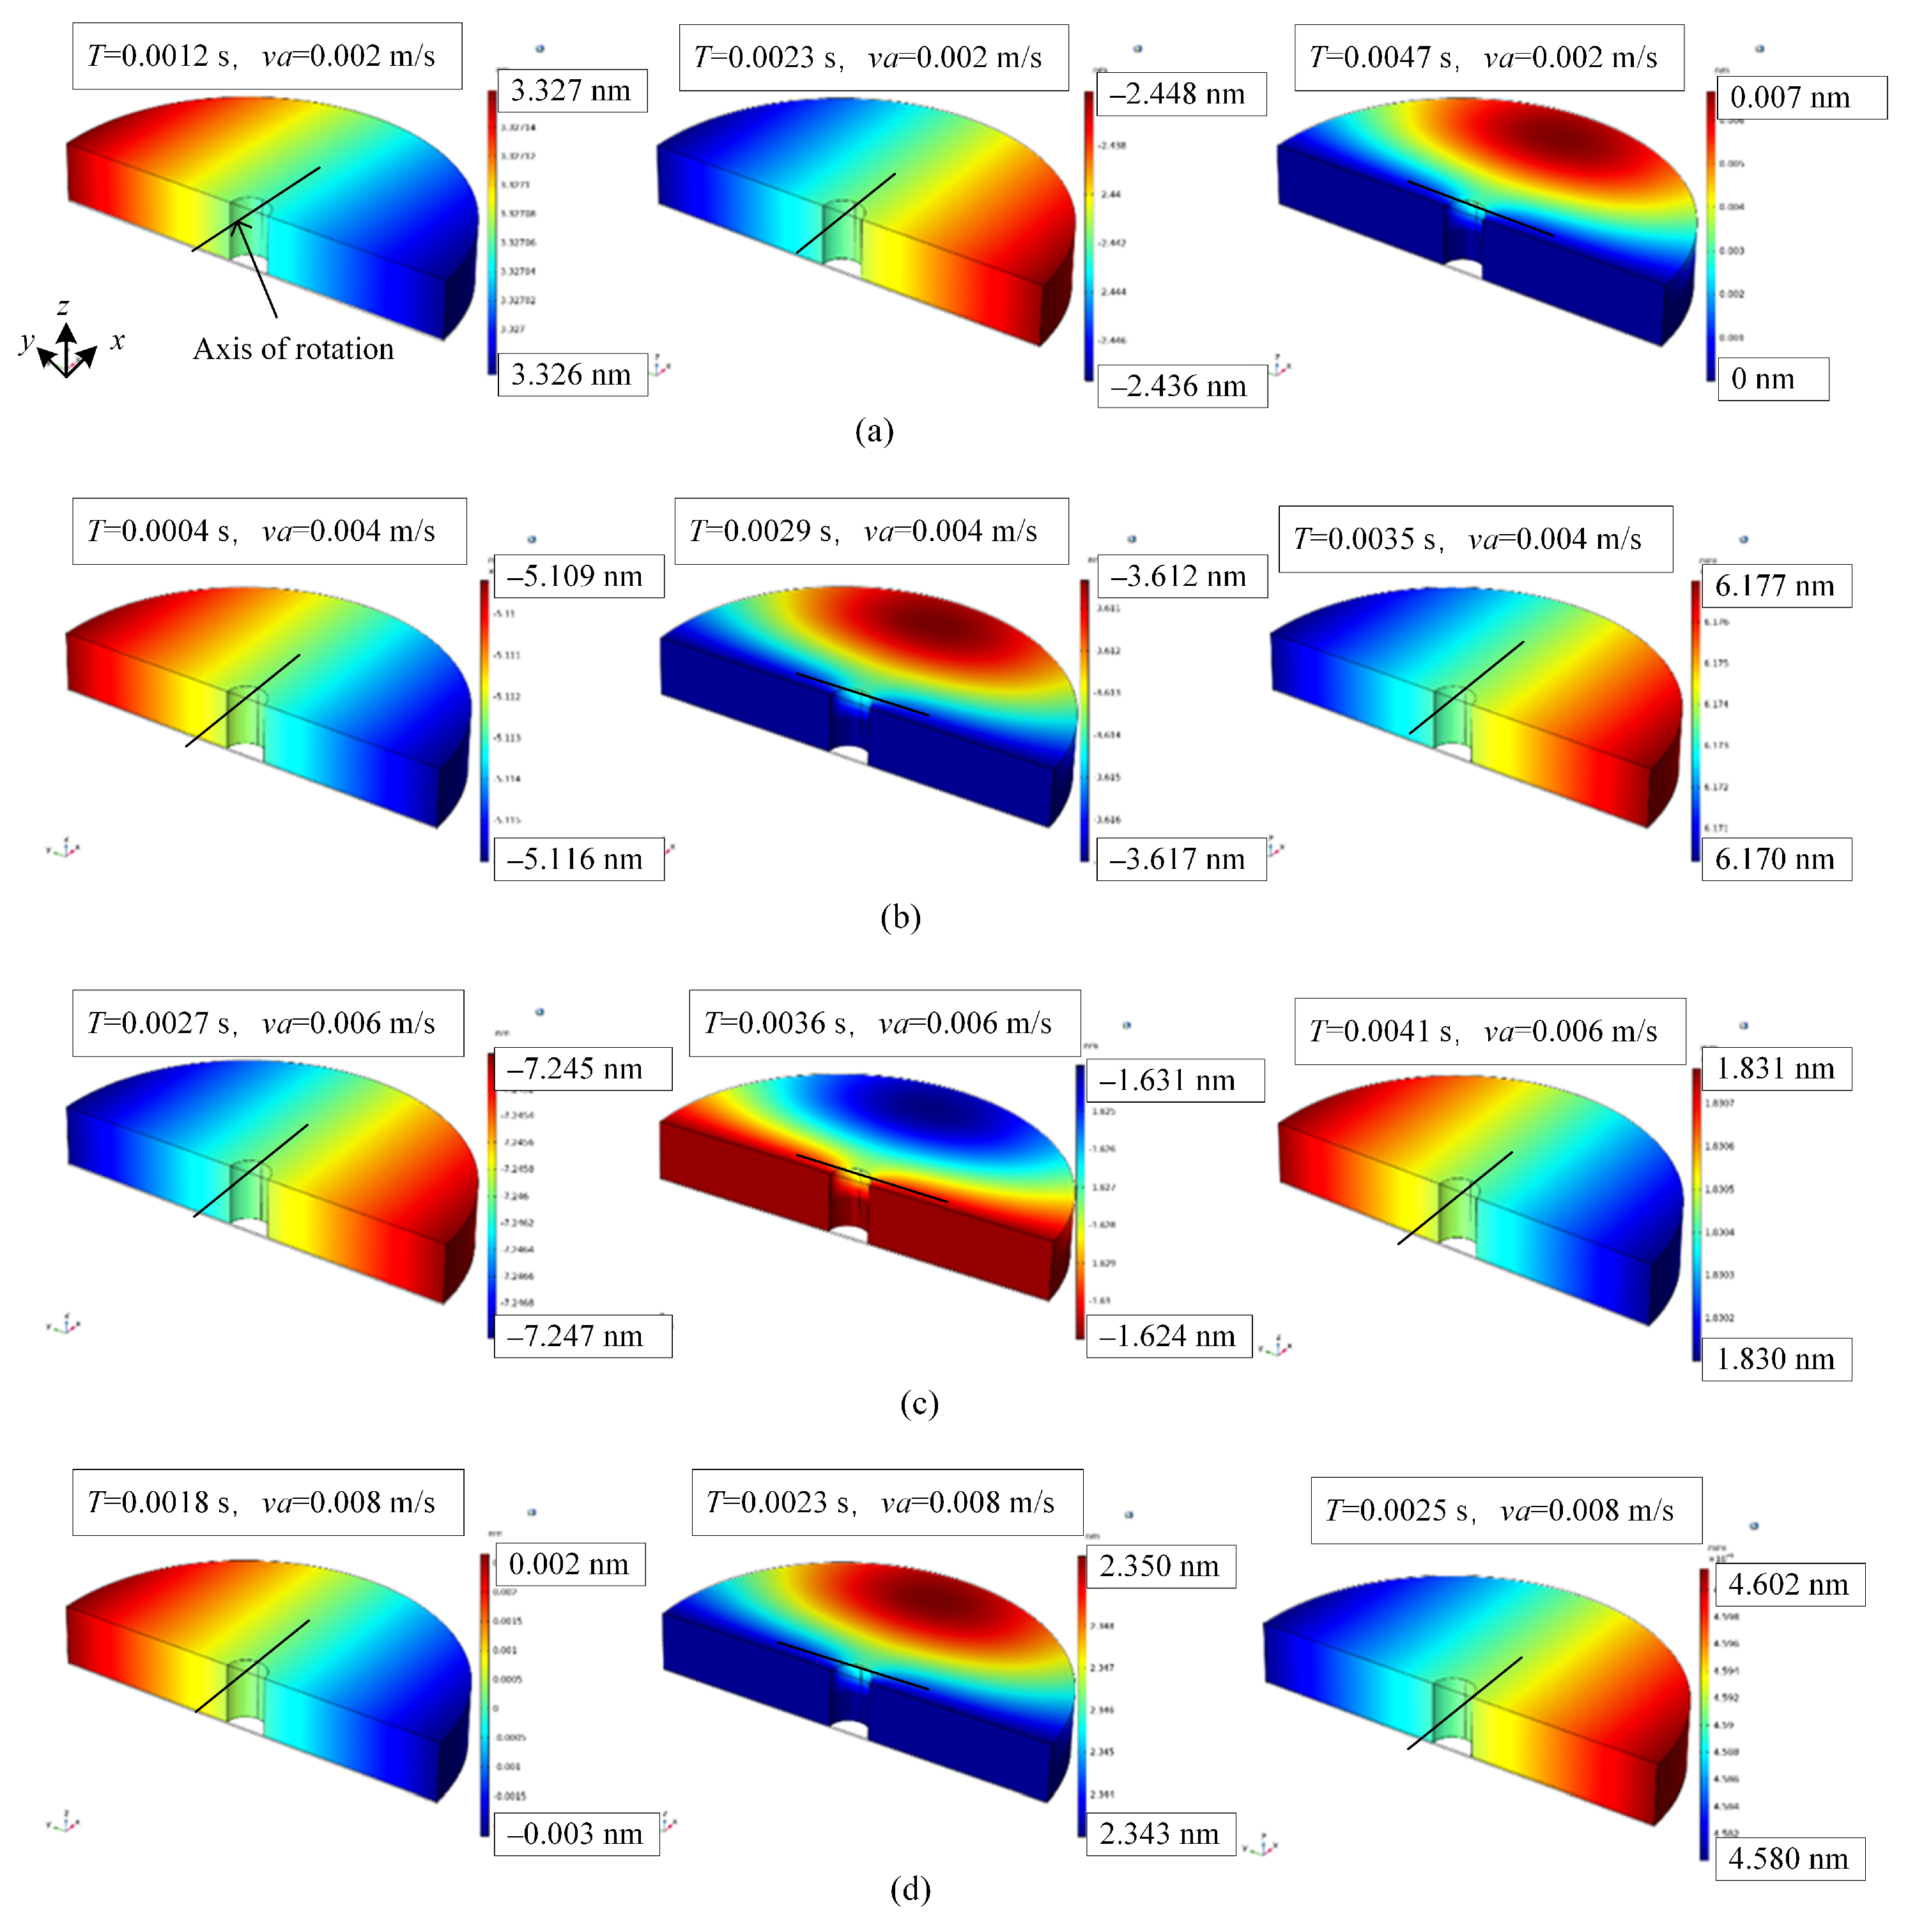
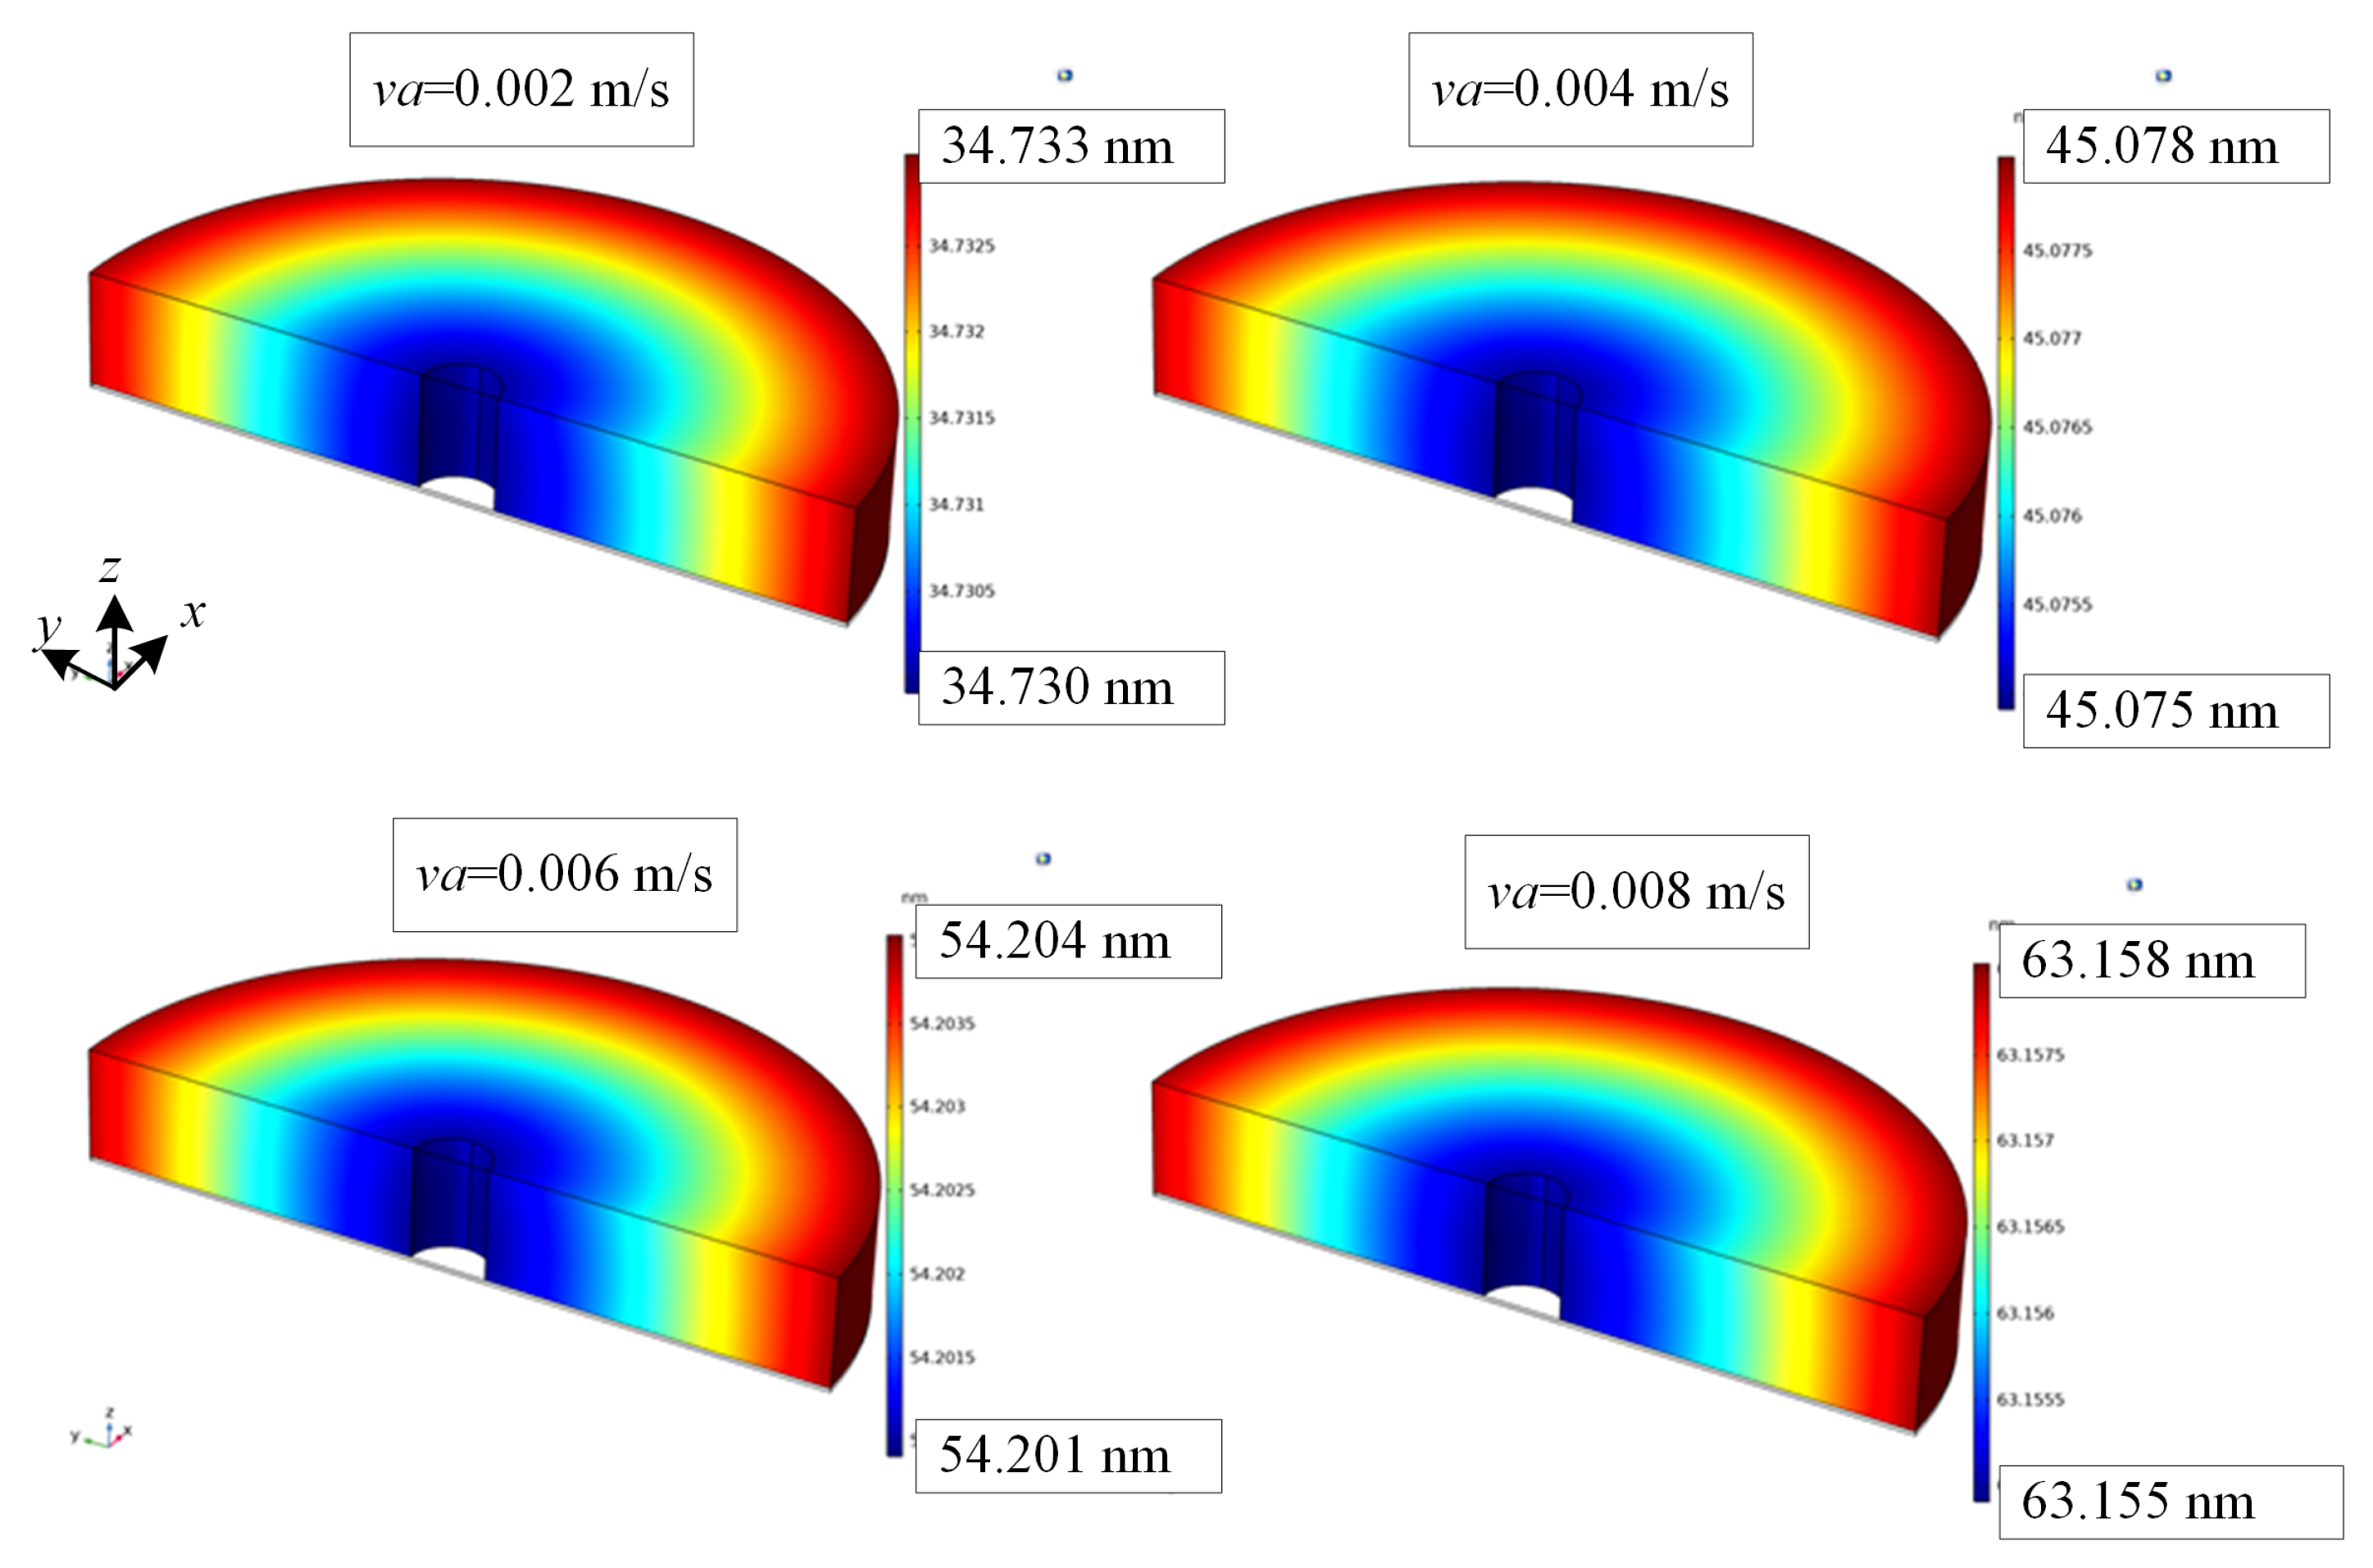
  • The greater the inlet air velocity, the greater the restrictor vibration, as shown in Figure 4. Interestingly, the peak–valley values of the time-averaged amplitudes on the circumference are identical (0.003 nm) under different air-supply pressures, meaning that even if the speed of the inlet air changes (representing the air-supply pressure and the gas film distribution change), the restrictor maintains the same rotational amplitude. If the vibration signal is expressed with direct-current (DC) and alternating-current (AC) components, the inlet air velocity only changes the DC component.
Although our simulation did not completely adhere to the actual structural parameters (e.g., air-supply pressure and film thickness of the restrictor), which were limited by the simulation conditions, the results obtained still provide useful qualitative results. Then, we examine the true vibrational state of the restrictor via experimentation.

3. Experiments and Results

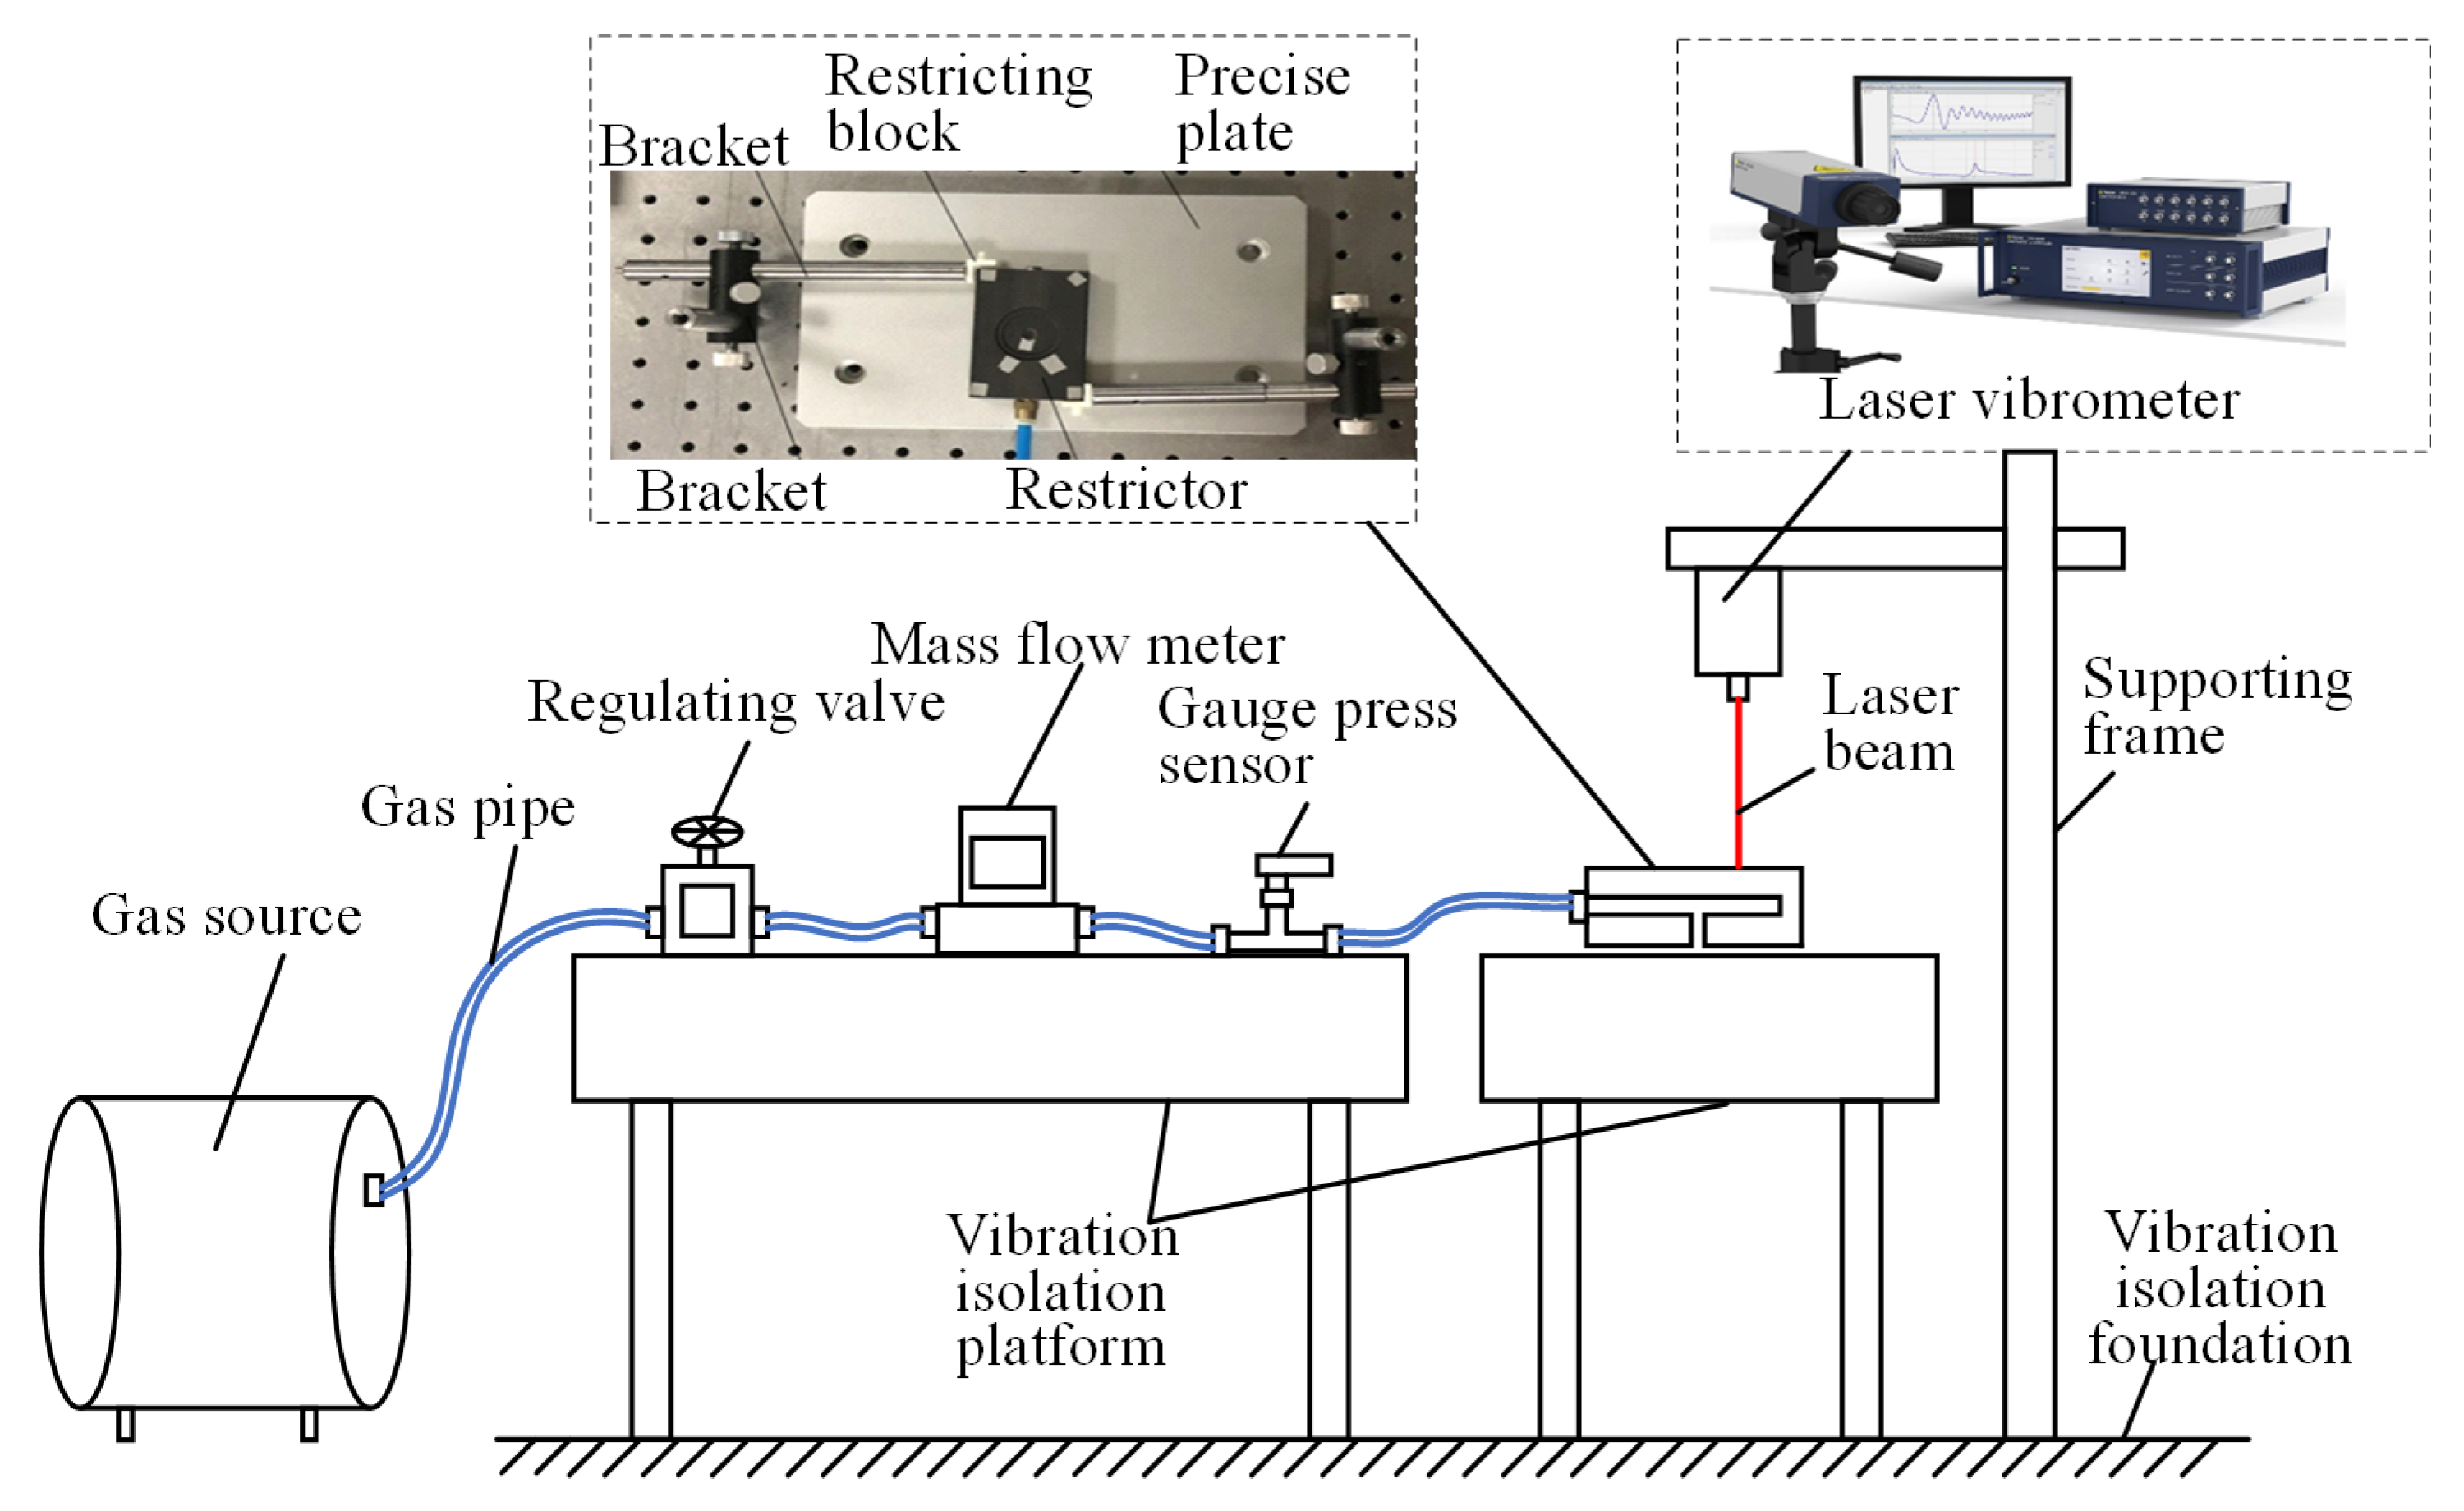
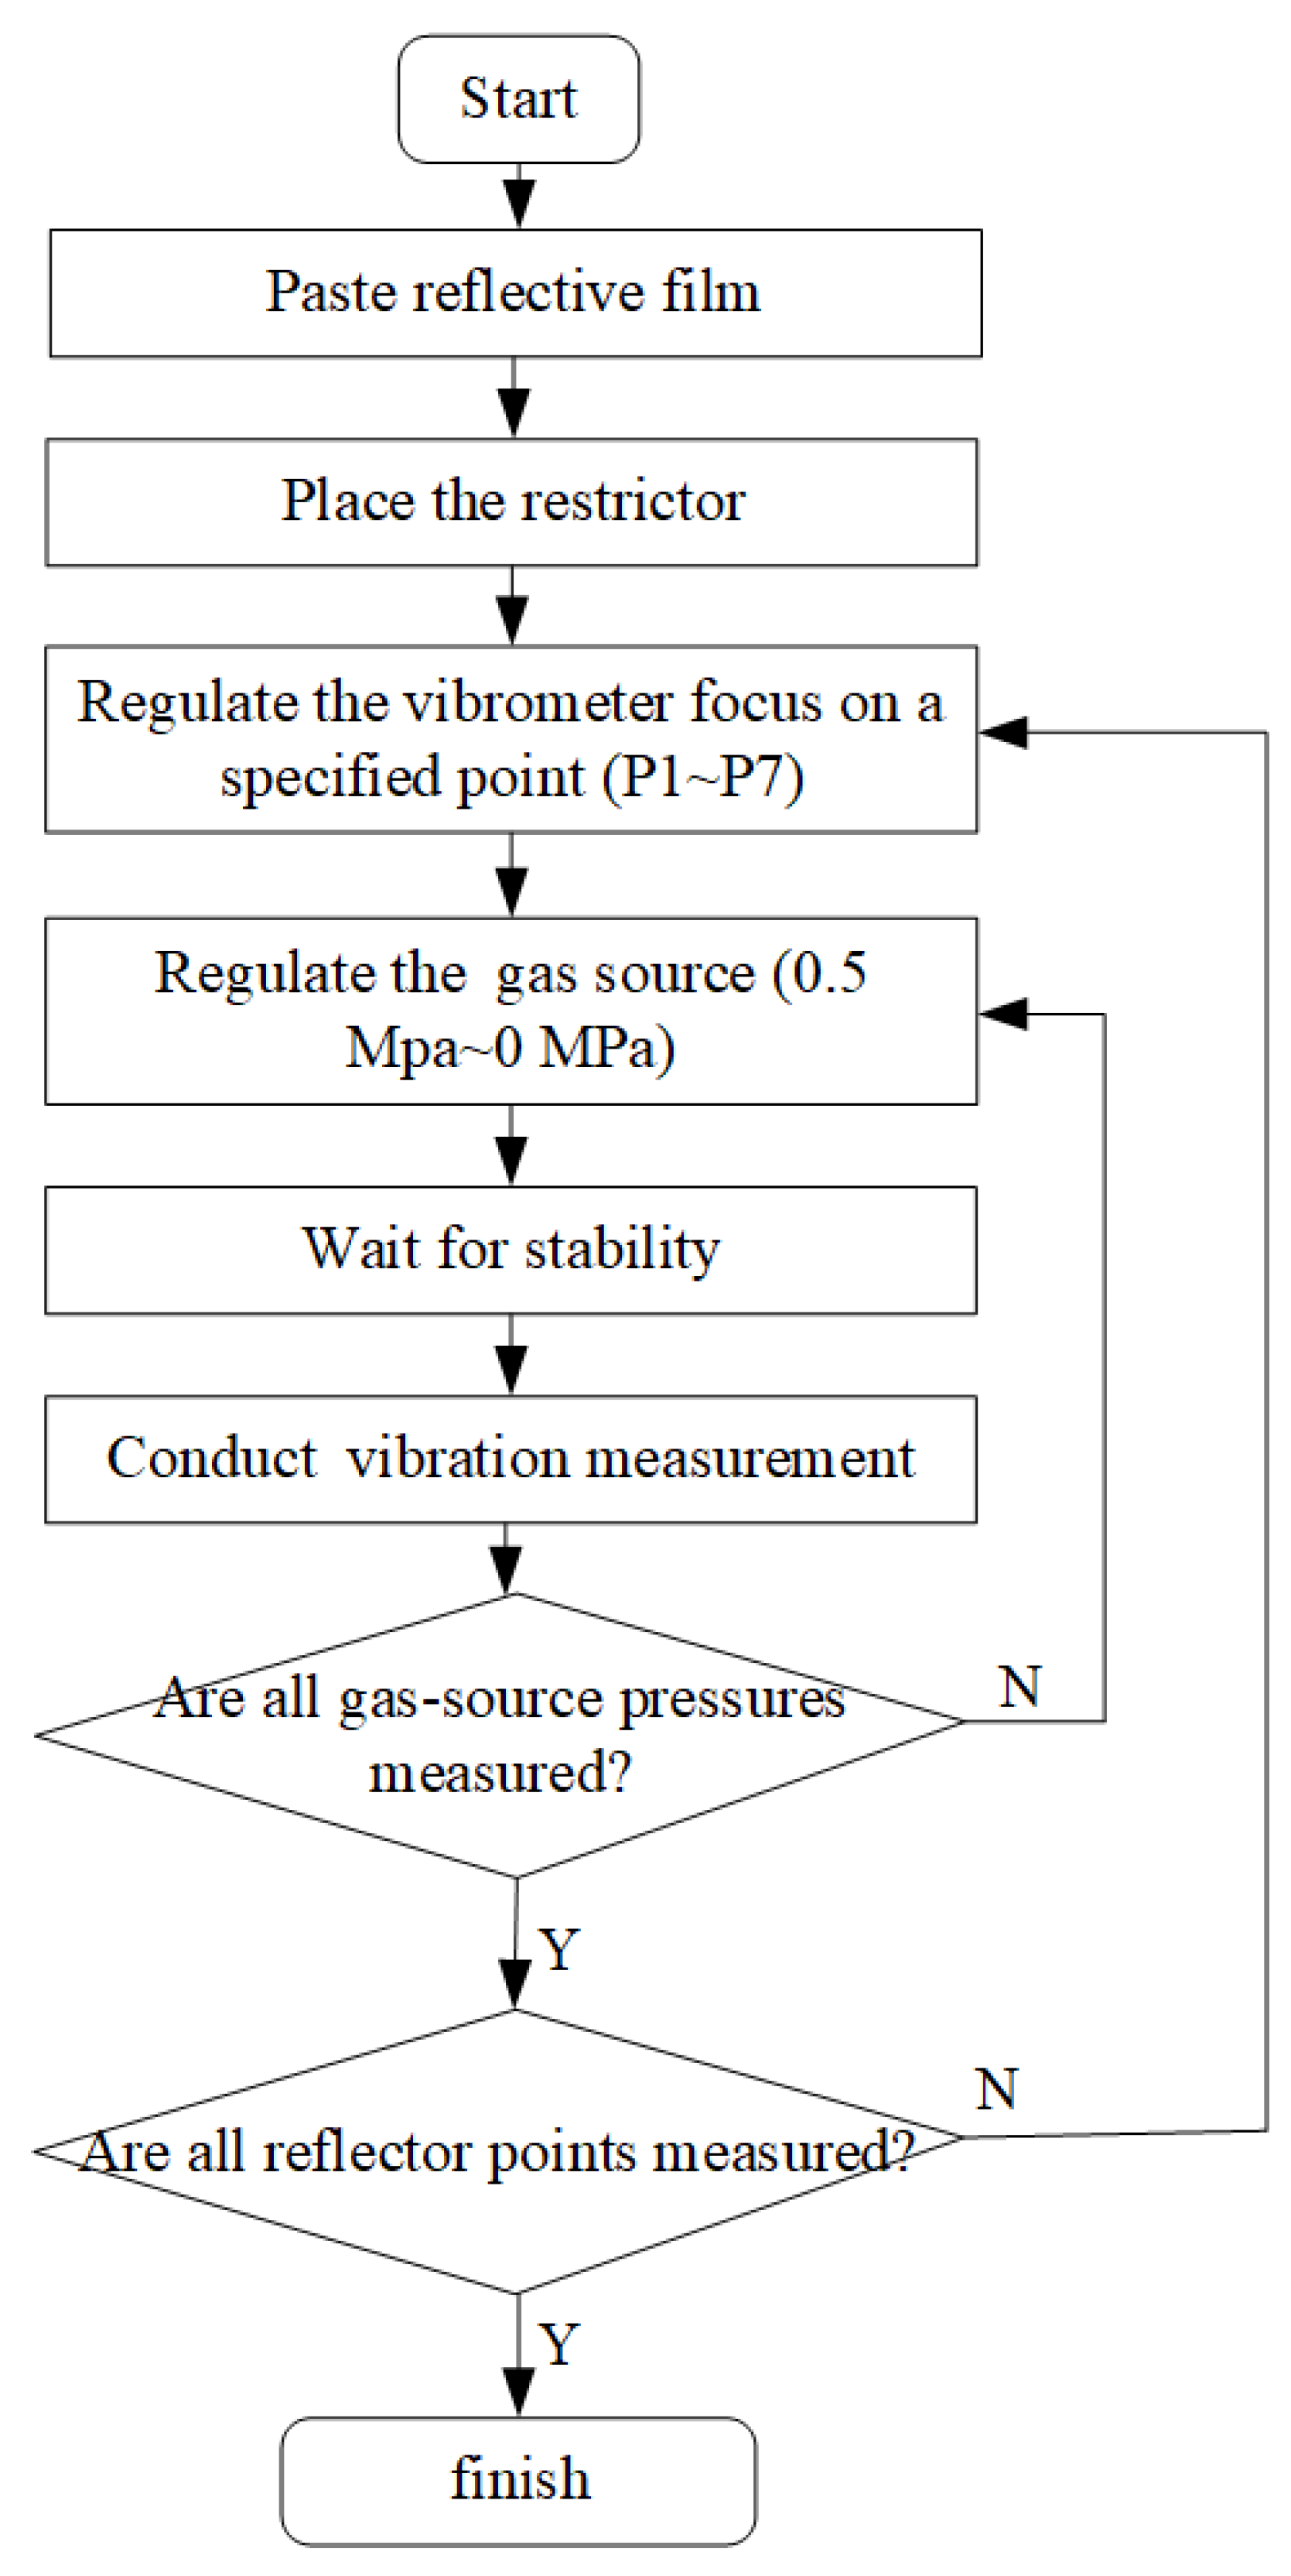
3.1. Experimental Setup

The experimental device configuration for measuring the restrictor vibration is shown in Figure 5, comprising a gas source, gas pipe, regulating valve (SMC IR1020-01BG), mass-flow meter (MF5712-N-200), gauge press sensor, laser vibrometer, supporting frame, vibration isolation platform, etc. The restrictors were placed on an ultra-precise plate with a restricting block, which limits the restrictor’s movement when gas is supplied. When the restrictor is in its steady state, there is little-to-no friction between it and the restricting block. For its nanometric measurement, a high-performance laser vibrometer POLYTEC OFV505/5000 was employed, equipped with a DD-900 displacement decoding card that measures a range of 0.5–100 m with 0–2.5 MHz measurement bandwidth and 0.5 pm displacement resolution.
Two orifice restrictors (double-ring- and double-U-grooved) were investigated using the experimental device. In our previous work [25], we studied the double-ring-grooved restrictor style. Both restrictors were 75 mm × 50 mm × 14 mm, as shown in Figure 6. From the bottom surface, orifices having diameters of 0.2 mm and square-cross-section grooves with depths and widths of 0.2 mm are present. From the upper surface, reflection stickers were dispersed along P1–P7, as required for the laser vibrometer. P1, P2, P3 and P4 are in the corners 5 mm from the edges. P7 is near the center. P5 and P6 are near the midpoints of P1 and P7 and P2 and P7, respectively. Because it is very difficult to adjust the position of the laser vibrometer, shifting is inevitable.
The measurement process is shown in Figure 7. First, after the reflection stickers are pasted, the laser vibrometer (on a tripod) is placed so that the beam falls on the P1 sticker. Second, the pressure regulator is adjusted to an air-source pressure of 0.5 MPa. Third, the amplitude–frequency curve of the vibration data is measured by the laser vibrometer. When the prominent frequency point in the amplitude–frequency curve stops changing with time (5 s), vibrational data are recorded at a time interval of 5.12 s with a sampling frequency of 102.4 kHz. Fourth, the pressure-regulating valve is adjusted to 0.4, 0.3, 0.2 and 0.1 MPa, and the above steps are repeated for each. Finally, the gas source is turned off, and the laser vibrometer is used to measure the normal vibration of the restrictor in a no-gas state. Then, the vibration measurement of P1 is complete. The tripod is then moved so that the laser beam of the vibrometer falls on the next reflection sticker. Everything is repeated until all positions are measured. These steps apply to both restrictor types. The entire experiment is then repeated for all restrictors in accordance with the above steps. Note that P5 and P6 are not included in the double-U-grooved-style restrictor tests.

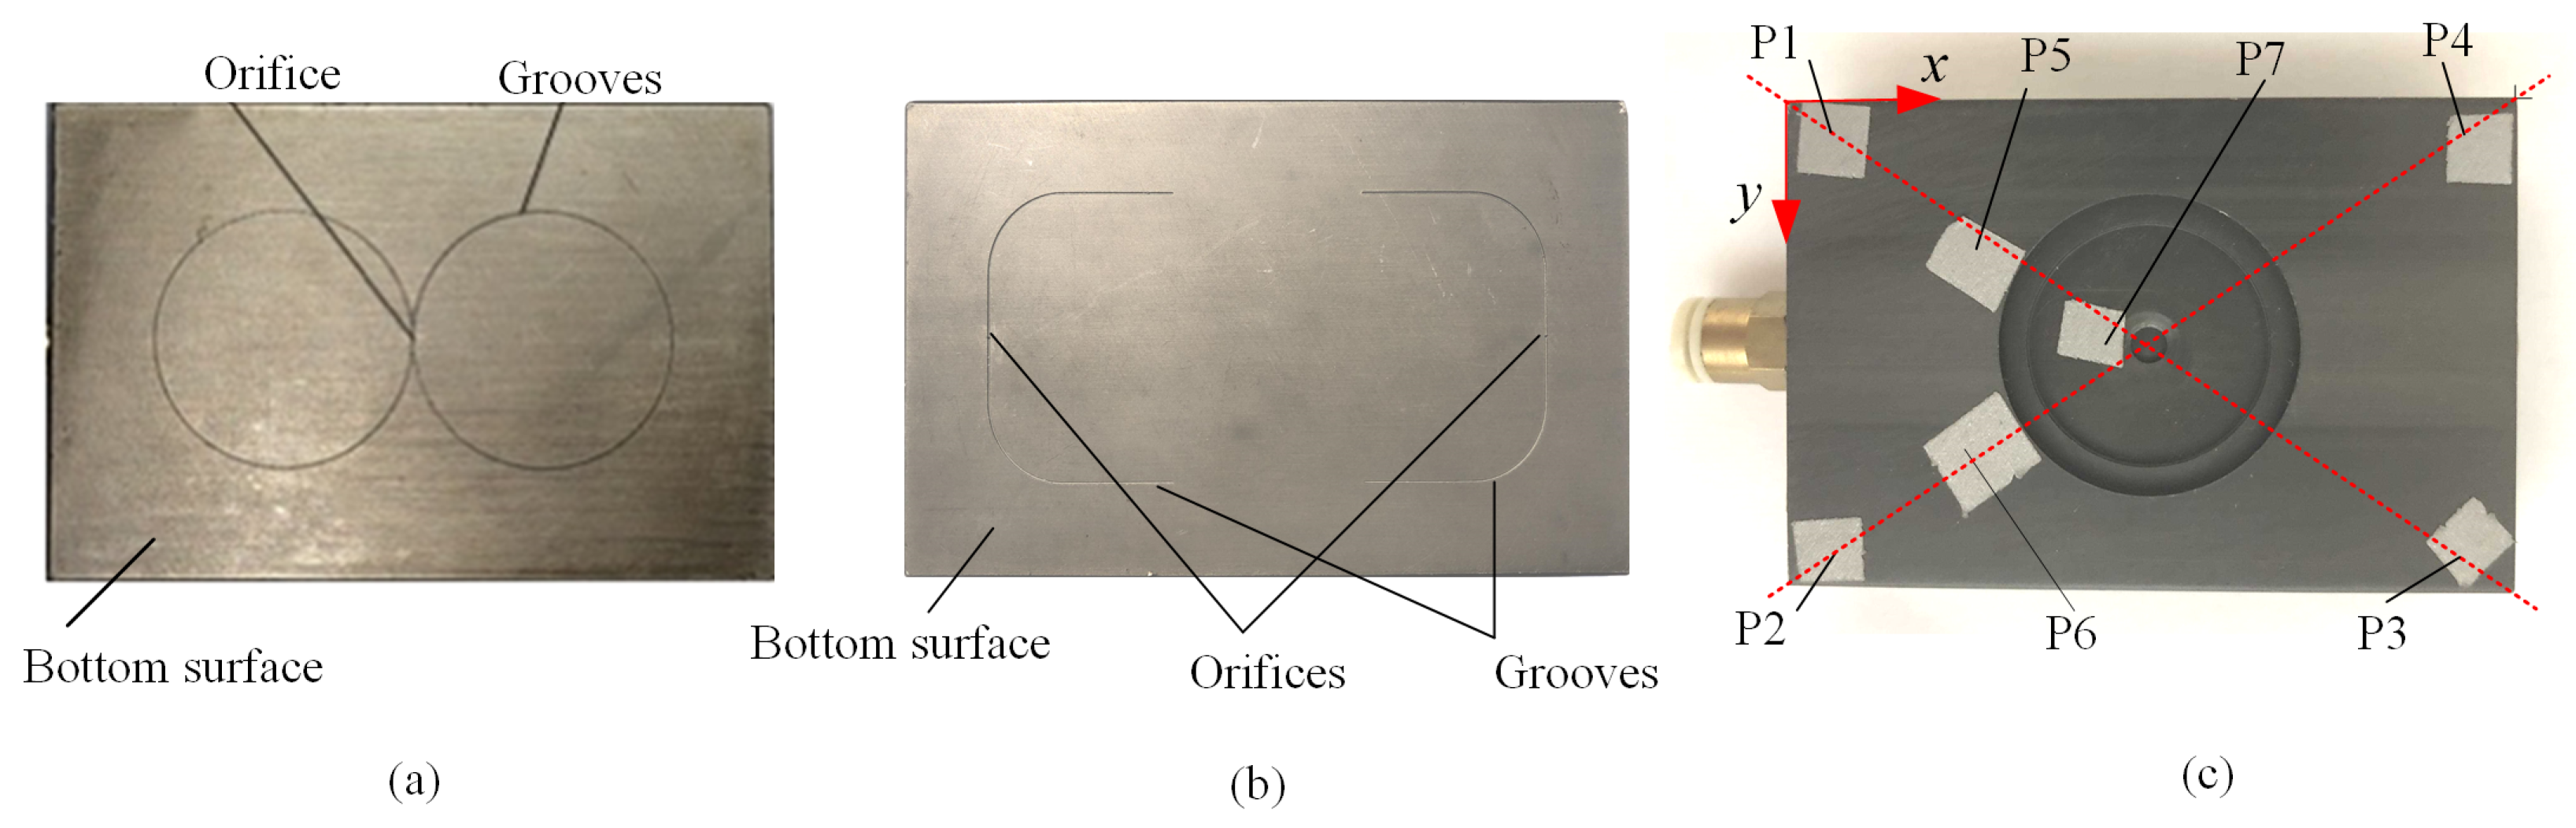
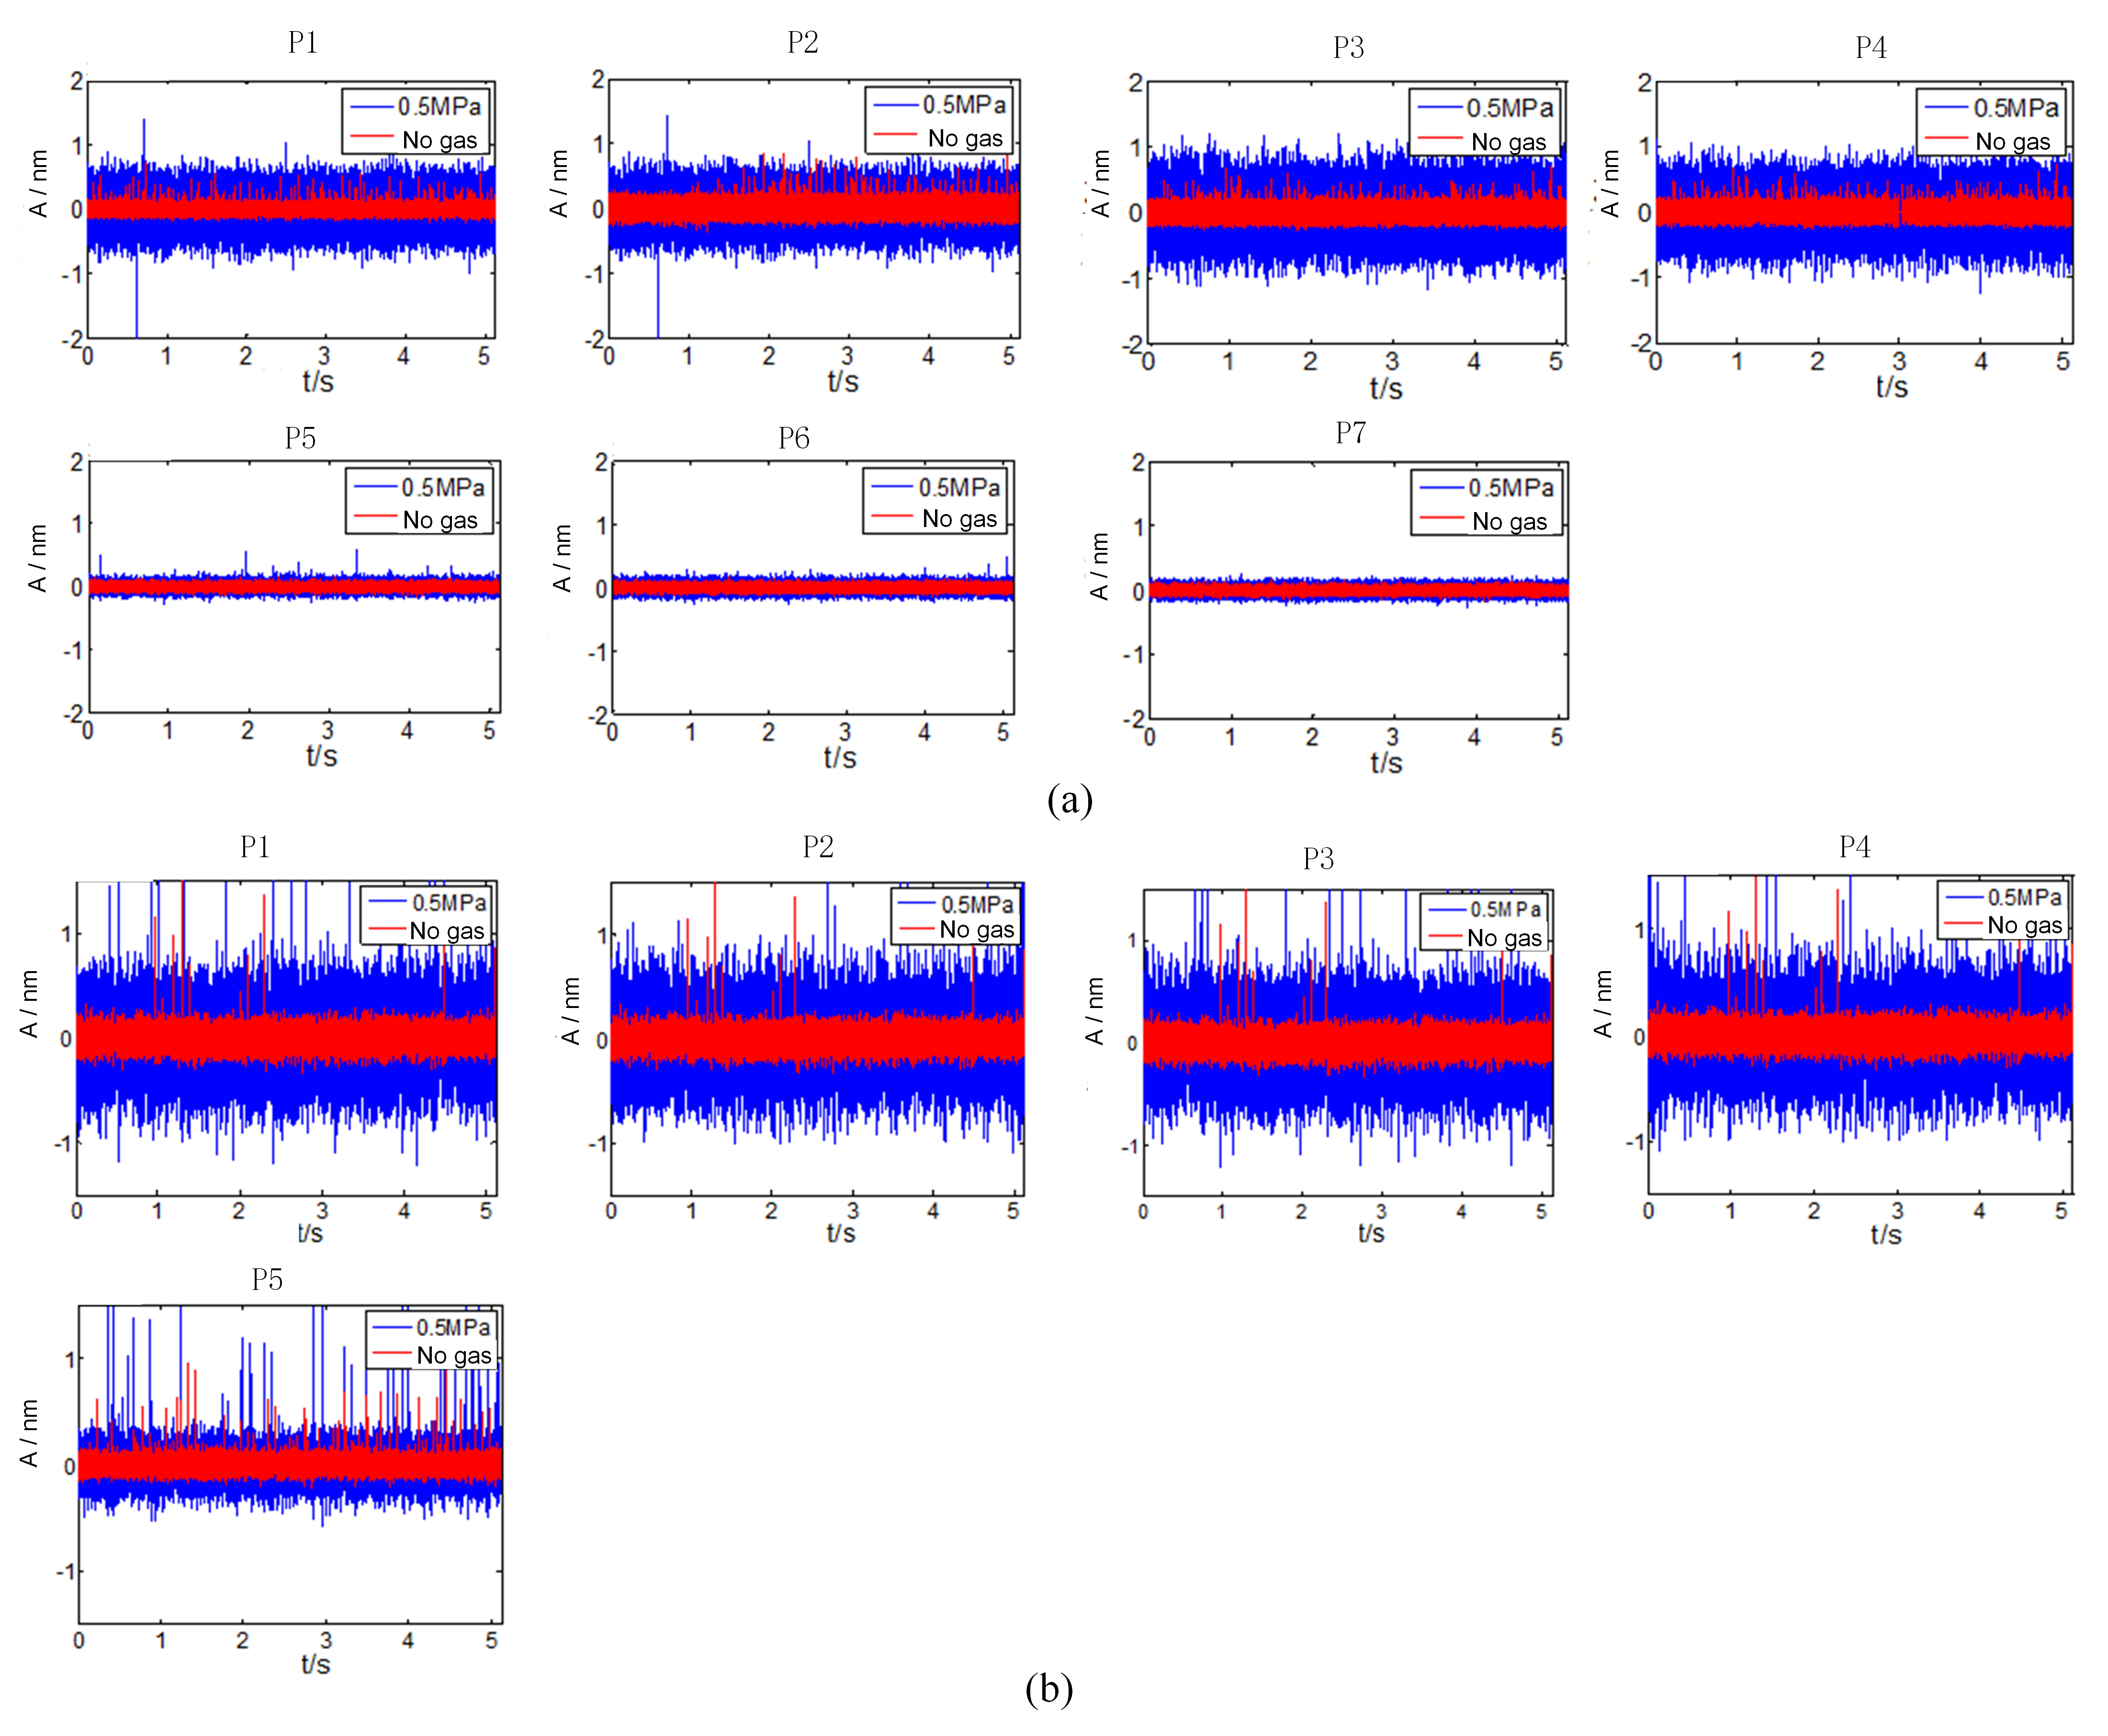
3.2. Time-Domain Results of Restrictors’ Vibration

Figure 8 shows the vibration measurement results of the double-ring- and double-U-grooved-style restrictors under 0.5 MPa and no gas where A is the vibration displacement. The data in the picture were 5 KHz high-pass filtered so that low-frequency interference signals would not overwhelm the high-frequency ones.
Figure 8 also shows that the amplitude of the vibration signal changed significantly under an air-supply pressure of 0.5 Mpa. Although the amplitude was very small (<1 nm), it was evident, indicating that the air-supply pressure significantly affected the amplitude. To further examine the relationship between air-supply pressure and vibration, the time-averaged vibration amplitudes, Aa, at 5.12 s, at different positions, are listed in Table 1 (P1–P7 are for the double-ring-grooved, and P1(U)–P7(U) are for the double-U-grooved) as plotted in Figure 9. When the air-supply pressure gradually increases, the vibration is mainly increased.

3.3. Frequency-Domain Results of Restrictor Vibration

Based on the Wiener–Sinchen law, the normal vibration displacement power spectral density (PSD) of the restrictor was calculated, and its frequency domain characteristics were analyzed. Figure 10 shows the normal nano-vibration displacement PSD after 5 kHz high-pass filtering obtained at different measurement positions. The displacement PSD distributions under no-gas and 0.5 MPa are, respectively, shown in Figure 10.

4. Discussion

From the results in Figure 9, it is clear that:
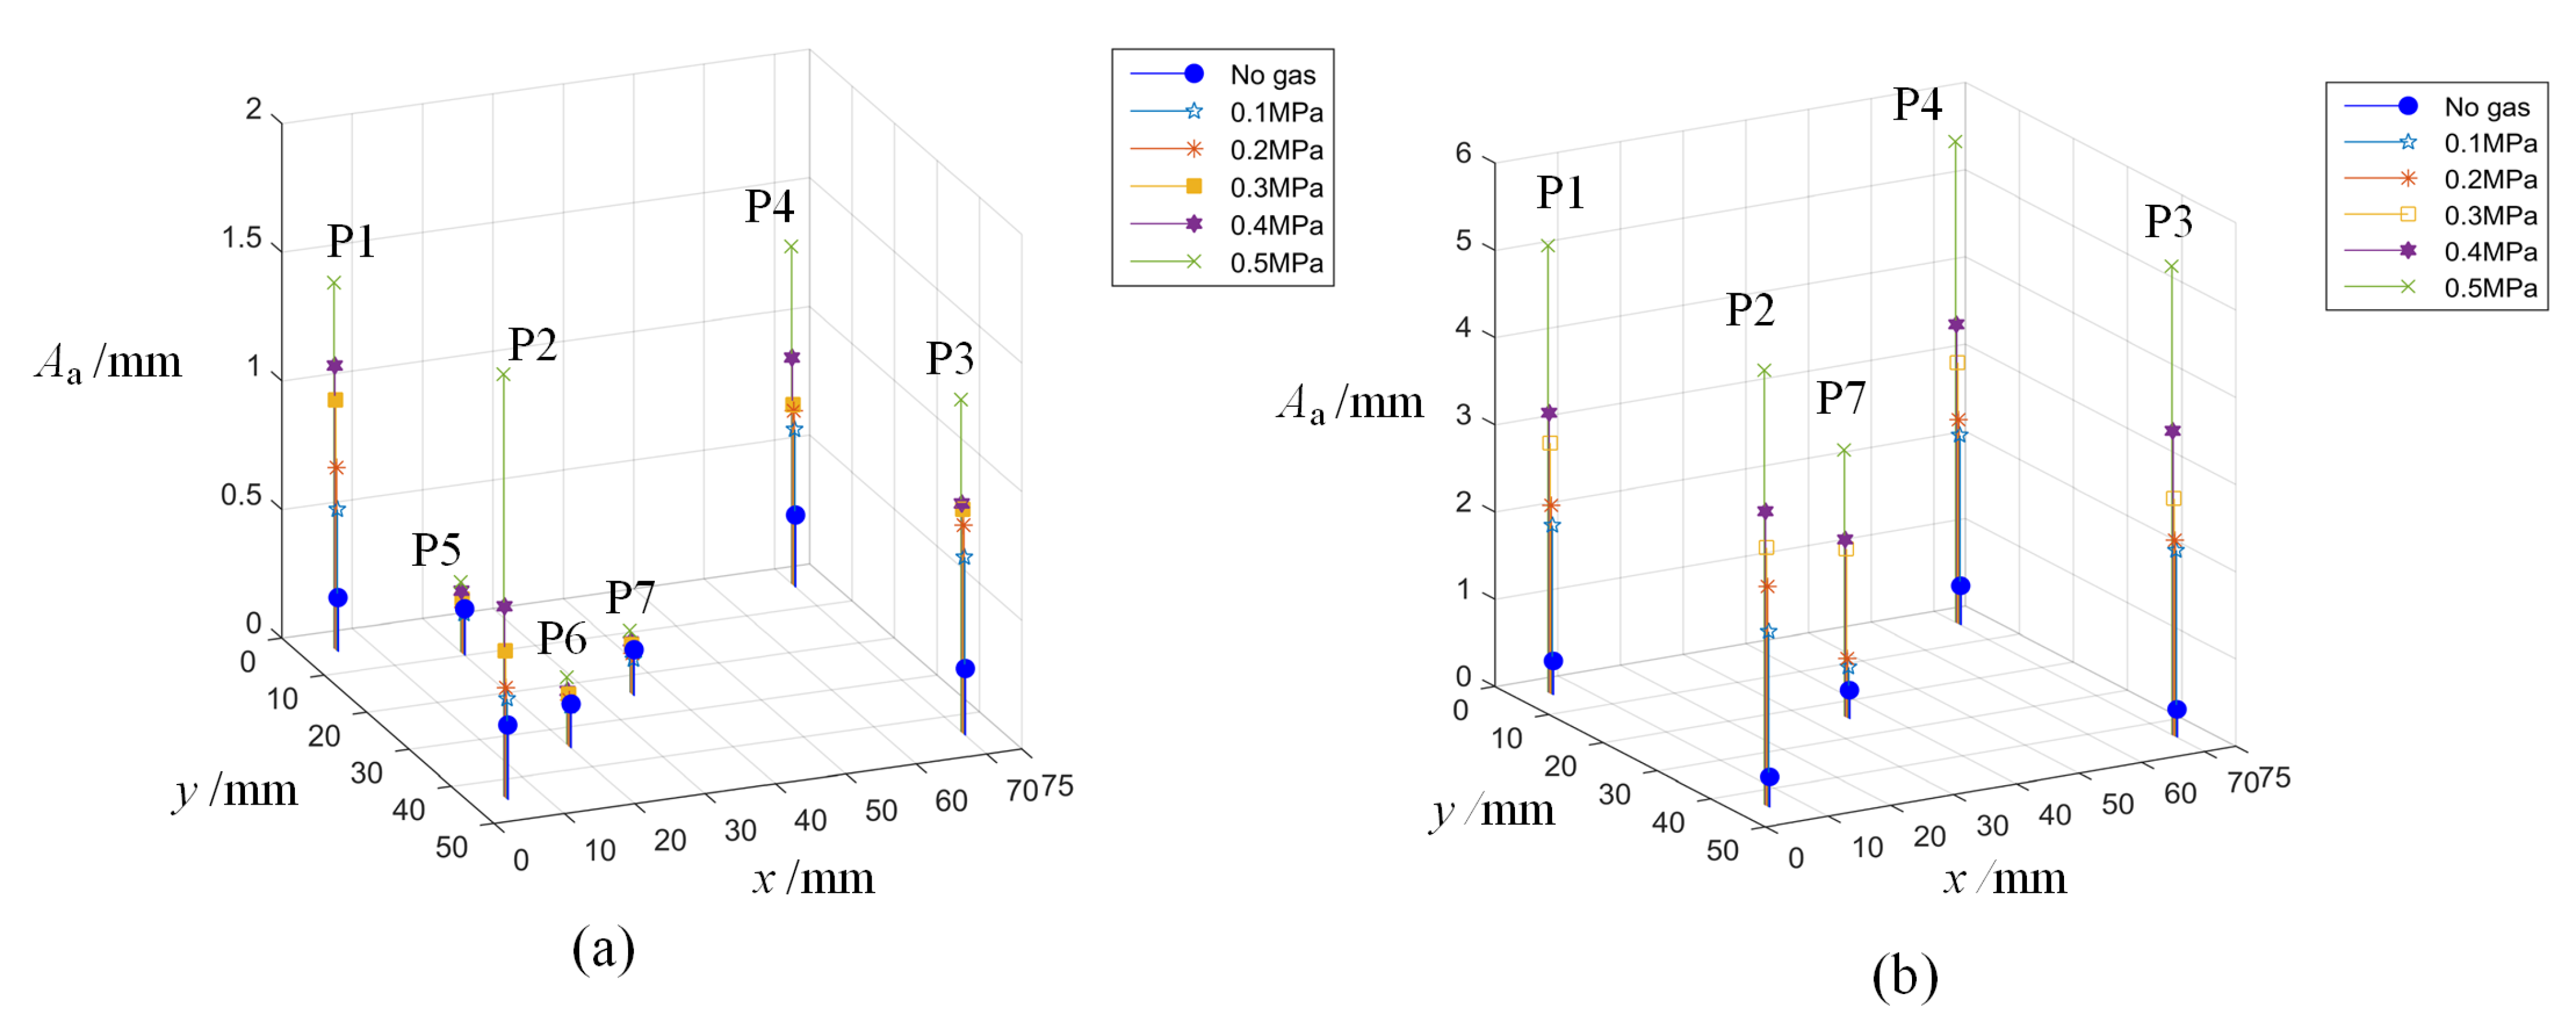
  • Normal nano-vibrations are generated at different measurement positions of the restrictor under different air-supply pressures with amplitudes ranging in picometer or nanometer order. For each position, the amplitudes of the normal nano-vibrations increase equally with the increase in air-supply pressure. This reveals the existence of normal vibration, and its magnitude is related to the air pressure. The greater the air pressure, the greater the vibration.
  • For the double-ring-grooved style restrictor under the same air-supply pressure, the measured positions of P1, P2, P3 and P4 had the largest similar vibration amplitudes. Those of positions P5 and P6 were reduced and close, and that at position P7 was the smallest. This shows that the normal vibration is a form of rotational vibration, which is consistent with the theoretical analysis (Section 2.2). This vibration form represents the see-saw mode discussed. For the one-orifice double-ring-grooved style restrictor, its vibration rotation axis should be in the restrictor’s center at the orifice. More specifically, it should be located between the orifice and the center of gravity.
  • For the double-U-grooved style restrictor with two orifices, the measurement data show that the vibration rotation axis is not at the center of the restrictor. It can be imagined that from a microscopic perspective, the two restrictors have the same nonidentical effect on the vibration as the spring model. Thus, the axis of rotation appears between restrictor orifice 1 and the center of gravity or between restrictor hole 2 and the center of gravity at different times. Therefore, position P7 near the center has a very large vibrational amplitude.
  • The variety of air-supply pressures changes the corresponding maximum vibration amplitude among P1, P2, P3 and P4. Hence, we speculate that the different air-supply pressures change the air-film thickness, flow rate and pressure distribution, which cause slight changes in the rotation axis, including the position and angle. However, we must consider that this difference could be caused by the inaccuracy of the laser-spot positioning.
  • Although the overall size was the same, the vibration of the double-U-grooved-style restrictor was larger than that of the double-ring-grooved-style restrictor. If the influence of the equalizing groove were to be ignored, then it is most likely that the two orifices would magnify the vibration far greater than one orifice would.
  • The simulation results of Section 2.2 showed that even if the speed of the inlet air changes per air-supply pressure and gas film distribution, the restrictor maintains the same rotation amplitude. However, we did not observe this phenomenon. The rotation amplitude varied evidently with different inlet air pressures. This requires further exploration in a future study.
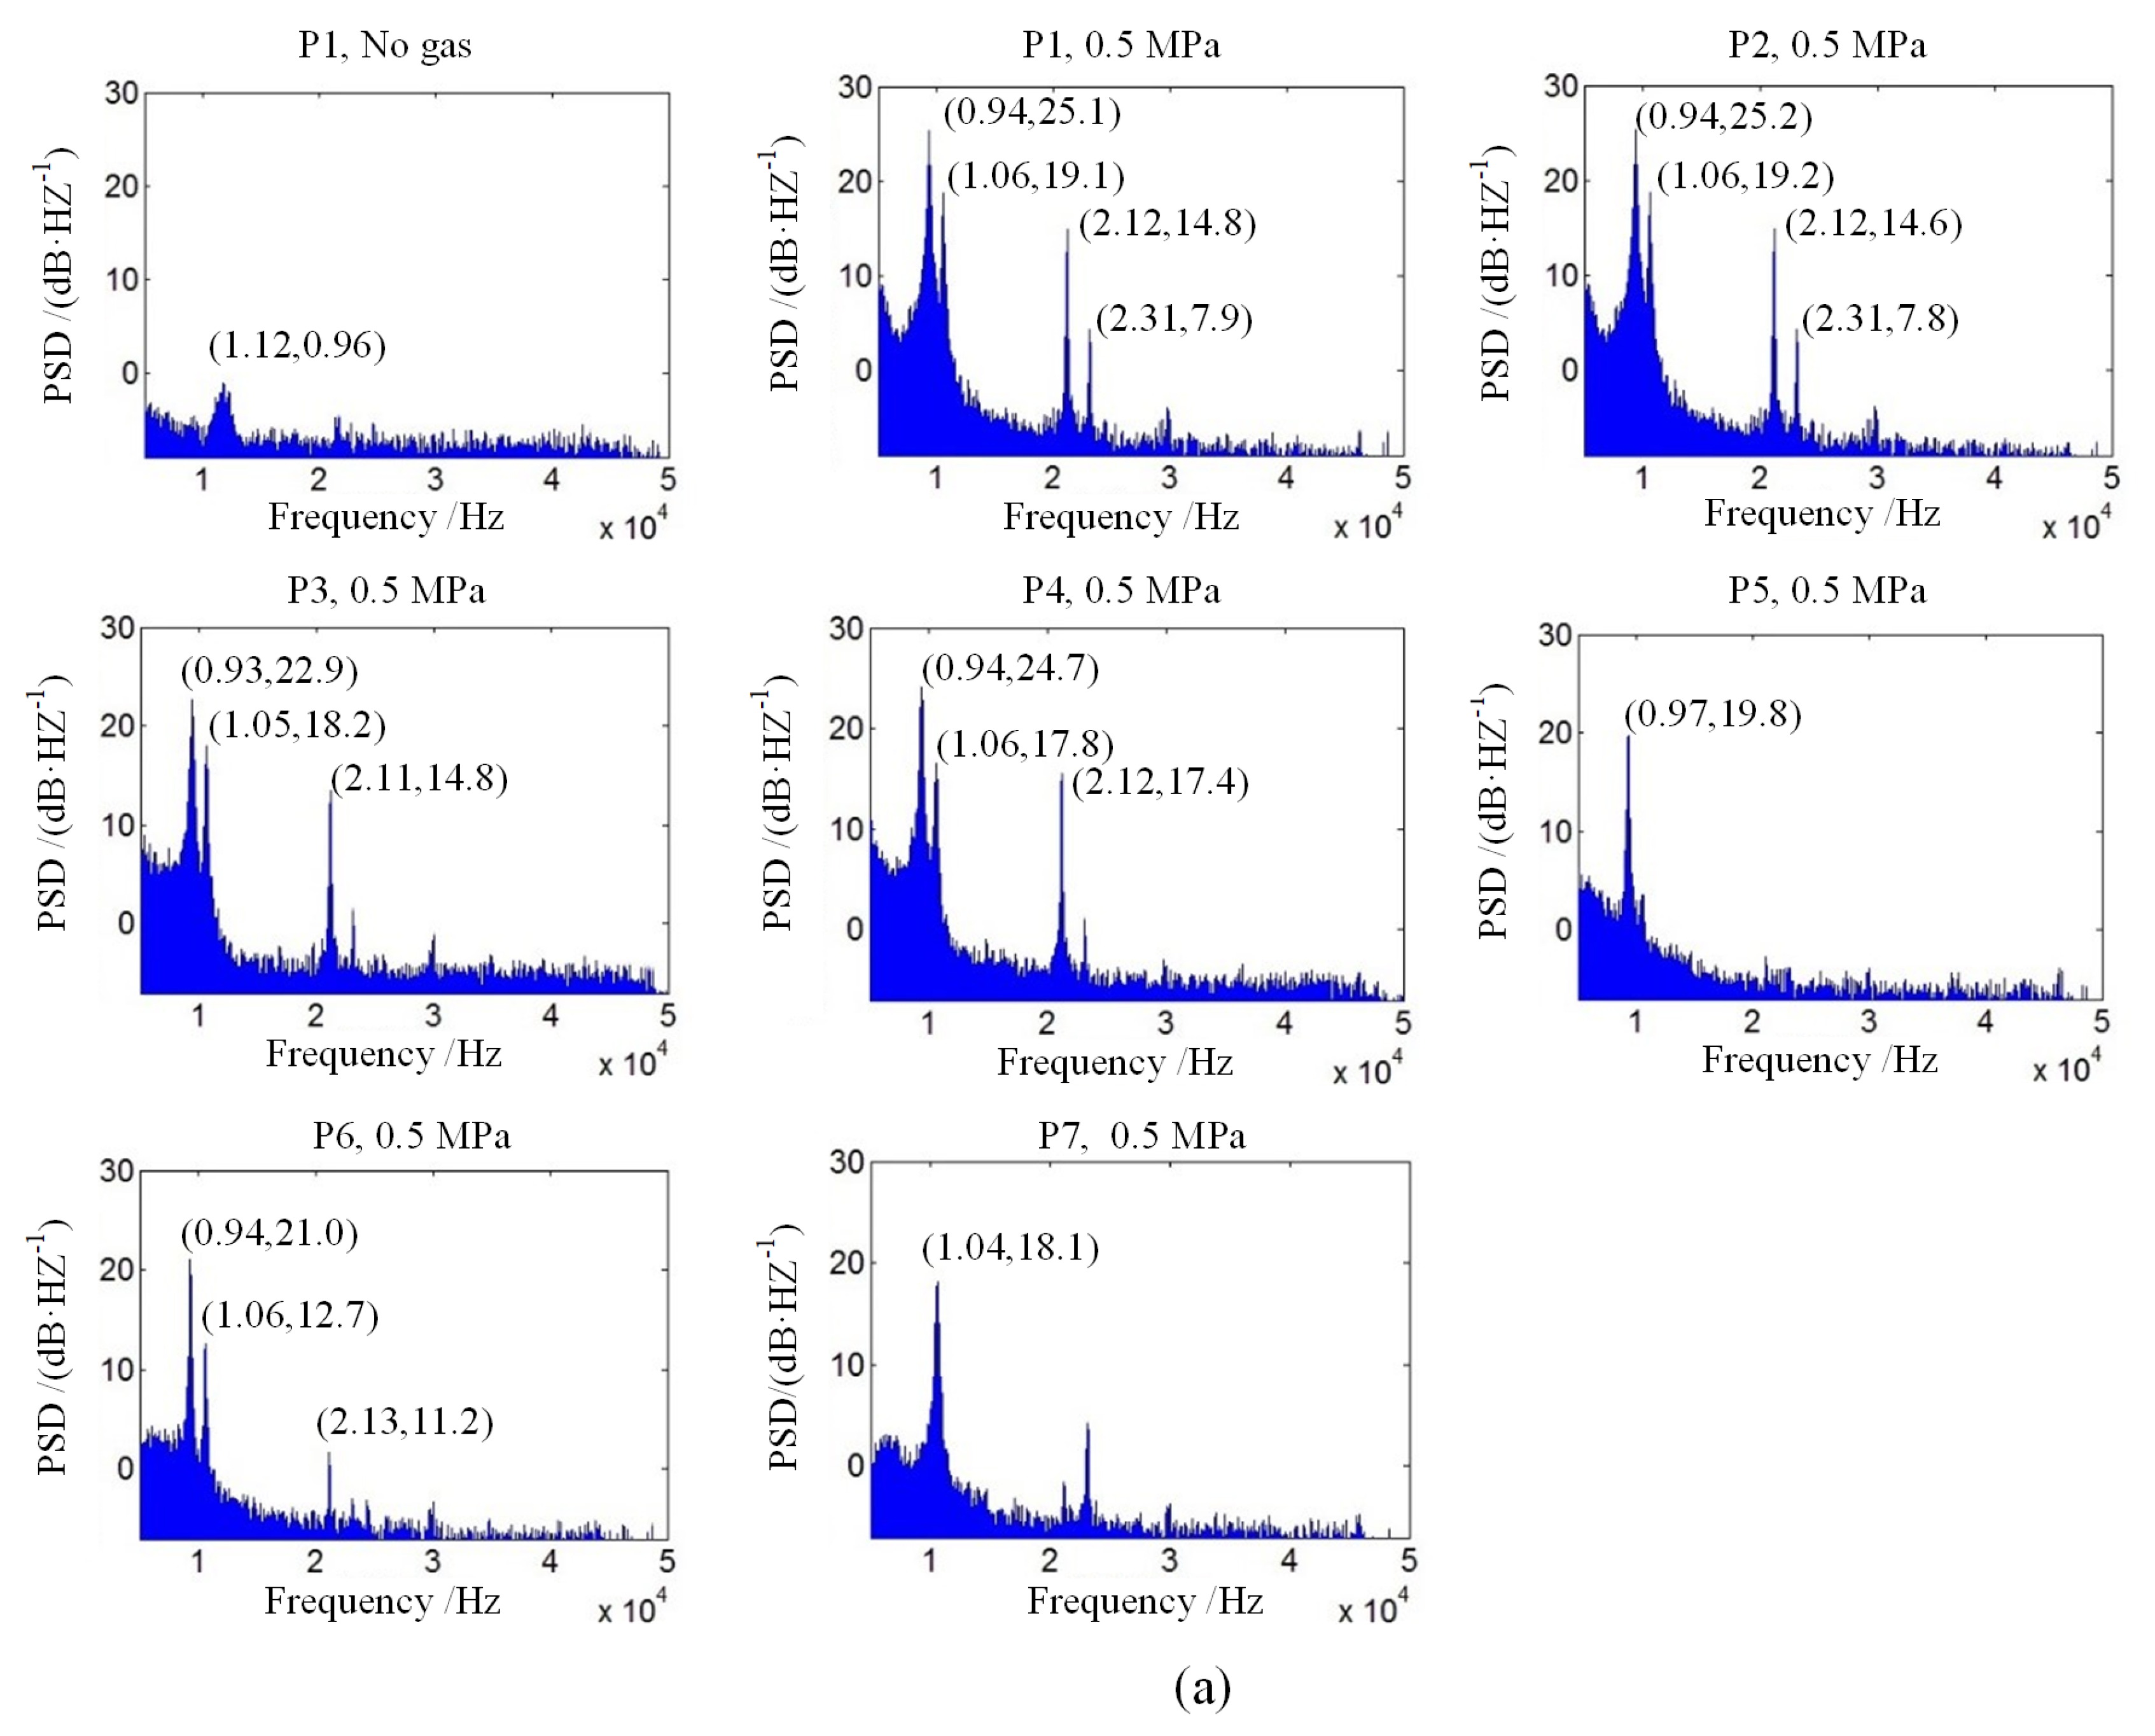
  • From the results in Figure 10, it is clear that for the double-ring-grooved-style restrictor, the normal nano-vibration generated at positions P1–P7 at 0.5 MPa carried large power near 9.4 and 10.6 kHz, even though P7 had no evident power concentration. Furthermore, different measurement locations carried certain amounts of power around 21.2 and 23.1 kHz. Because 21.2 and 23.1 kHz are approximately twice the frequencies of 9.4 and 10.6 kHz, respectively, it can be assumed that 9.4 and 10.6 kHz are the fundamental frequencies of the normal nano-vibration of the restrictor, and 21.2 and 23.1 kHz are their harmonics frequencies.
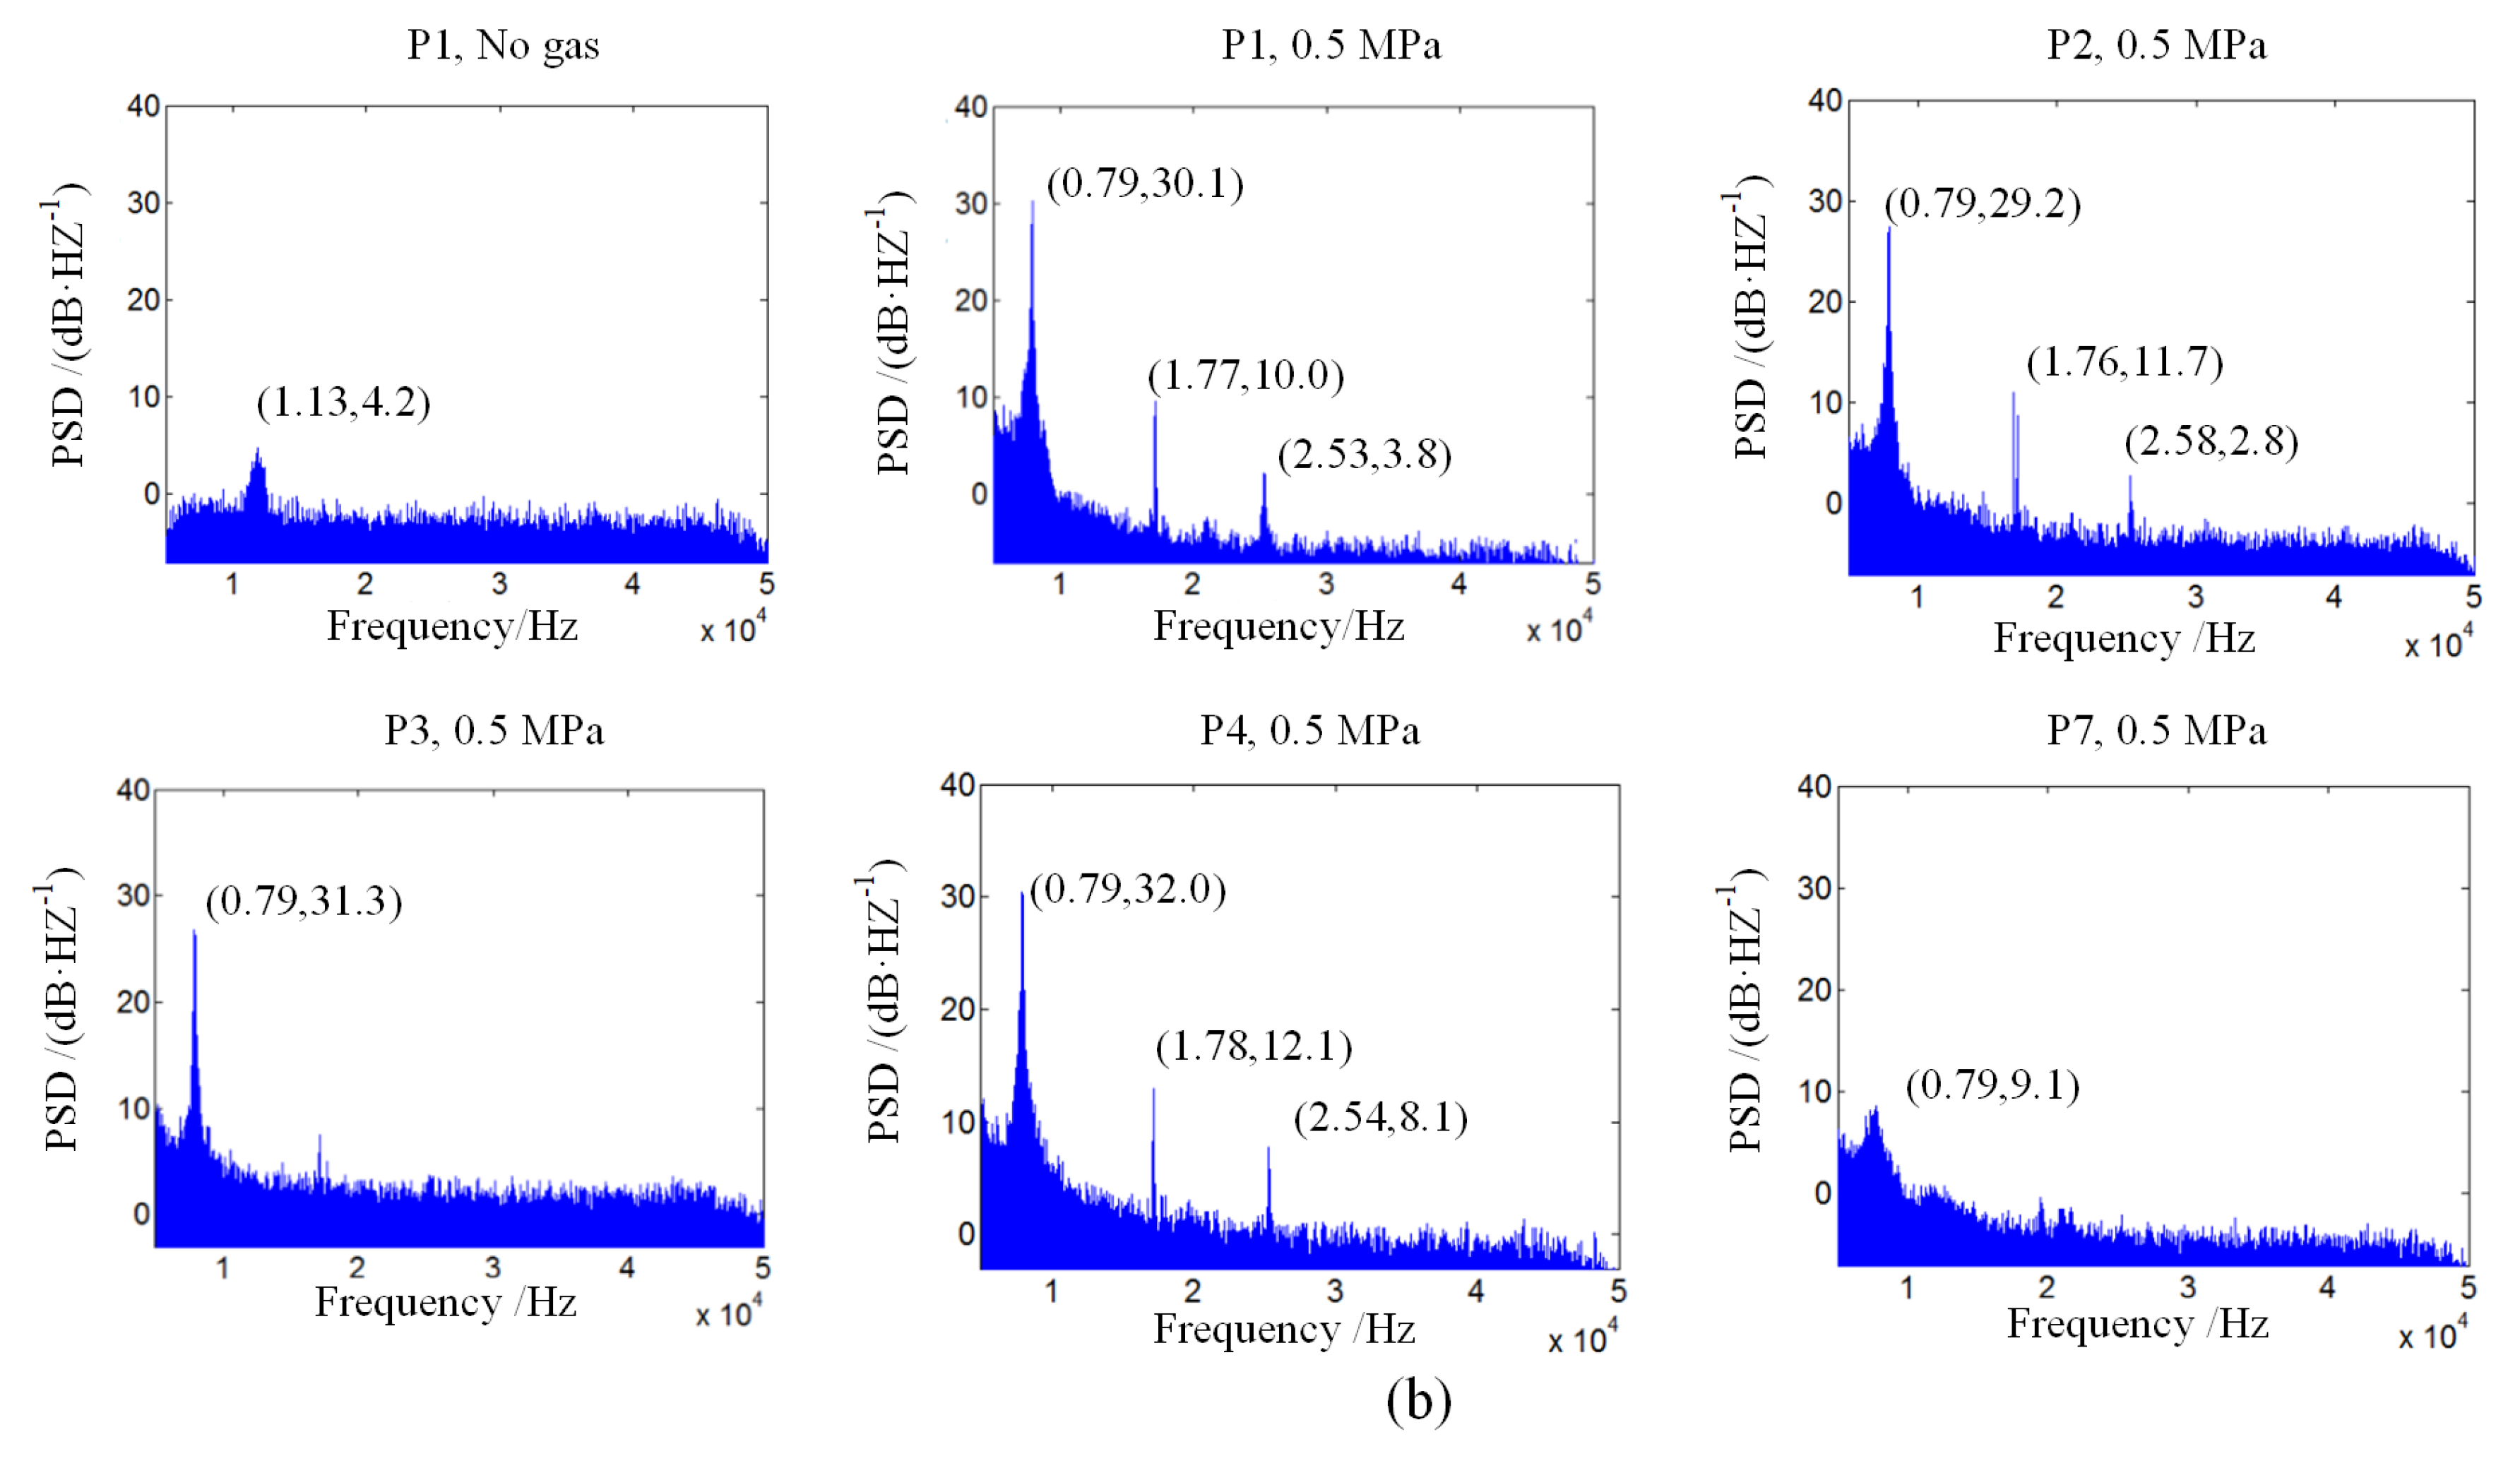
  • For the double-U-grooved-style restrictor, the normal nano-vibration generated at different positions at 0.5 MPa air-source pressures carried large power around 7.9, 17.7 and 25.3 kHz. However, there was no evident power concentration phenomenon at P7. Because 17.7 and 25.3 kHz are approximately twice and three times the relationships with 7.9 kHz, 7.9 kHz can be considered the fundamental frequency of the normal random nano-vibration of the restrictor; 17.7 kHz is the double frequency, and 25.3 kHz is the triple frequency.
  • More results of the normal nano-vibration PSD of the restrictors were obtained when p a was 0.1, 0.2, 0.3, 0.4 and 0.5 MPa. From these results, the fundamental frequency of the nano-vibration was consistently around 9.4 and 10.6 kHz (double-ring-grooved style restrictor), and 7.9 kHz (double-U-grooved style restrictor), which fully supports the notion that the obtained frequency is an intrinsic vibration model, which is unrelated to air-supply pressure.

5. Conclusions

A one-orifice restrictor was simulated using a COMSOL FEM model based on FSI, and the nanometer vibration performance of orifice-type restrictors was discussed. Two practical restrictors underwent experimentation to verify the vibration characteristics. The conclusions are as follows:
  • With a steady-state air flow, the gas film flow of the restrictor caused fluctuations at the micro-level, resulting in the entire restrictor producing fluid–solid-coupling vibrations. This vibration creates the see-saw motion, which increases with the air-supply pressure and gas film velocity.
  • The see-saw form of vibration has a rotating axis, which is determined by the orifice and the restrictor. It is considered that this rotating axis changes slightly with the influence of the micro-air flow.
  • The nano-vibration of the restrictor is related to its number of orifices. Multiple orifices induce greater vibration.
  • The nano-scale micro-vibration of the restrictor is not completely random at the kilohertz level, and its working surface structure also affects the vibration frequency.
The present study investigates the nano-vibration mechanism and aims to promote the ultra-precision equipment performance. Experimental measurements pertaining to the two-specific orifice-type restrictors without sliding were obtained, and the vibration during movement was neglected. Although the current experimental results reveal the characteristics of nano-vibrations in the orifice restrictor, an accurate mathematical model for the natural frequencies has not been established based on the experimental results. In the future, we will test more orifice-type restrictors and other types of restrictors.

Author Contributions

Conceptualization, X.S. and D.L.; methodology, X.S.; software, J.Y. (Jing Yu); validation, J.Y. (Jing Yu) and J.Y. (Jianlong Yin); formal analysis, X.S.; investigation, X.S. and J.Y. (Jianlong Yin); resources, J.Y. (Jing Yu); data curation, X.S.; writing—original draft preparation, X.S.; writing—review and editing, X.S. and D.L.; visualization, X.S.; supervision, D.L.; project administration, X.S.; funding acquisition, D.L., J.Y. (Jing Yu) and X.S. All authors have read and agreed to the published version of the manuscript.

Funding

This research was funded by National Natural Science Foundation of China (Grant No.51775529); Zhejiang Natural Science Foundation (Grant No.LY19E050002); and Fundamental Research Funds for the Provincial Universities of Zhejiang (Grant No.2020YW03).

Institutional Review Board Statement

Not applicable.

Informed Consent Statement

Not applicable.

Data Availability Statement

The data presented in this study are available in article.

Conflicts of Interest

The authors declare no conflict of interest.

References

  1. Zheng, Y.; Yang, G.; Cui, H.; Hou, Y. Improving the stiffness of the aerostatic thrust bearing by using a restrictor with multi-orifice series. Proc. Inst. Mech. Eng. Part J J. Eng. Tribol. 2020, 234, 1881–1891. [Google Scholar] [CrossRef]
  2. Lu, Z.W.; Zhang, J.A.; Liu, B. Study on the gas film flow field and its influencing factors at the outlet of the orifice of the aerostatic bearing. Shock Vib. 2020, 8891382. [Google Scholar] [CrossRef]
  3. Kodnyanko, V.; Shatokhin, S.; Kurzakov, A.; Pikalov, Y. Mathematical Modeling on Statics and Dynamics of Aerostatic Thrust Bearing with External Combined Throttling and Elastic Orifice Fluid Flow Regulation. Lubricants 2020, 8, 57. [Google Scholar] [CrossRef]
  4. Zhu, J.; Chen, H.; Chen, X. Large eddy simulation of vortex shedding and pressure fluctuation in aerostatic bearings. J. Fluids Struct. 2013, 40, 42–51. [Google Scholar] [CrossRef]
  5. Li, Y.; Yin, Y.; Yang, H.; Liu, X.; Mo, J.; Cui, H. Modeling for optimization of circular flat pad aerostatic bearing with a single central orifice-type restrictor based on CFD simulation. Tribol. Int. 2017, 109, 206–216. [Google Scholar] [CrossRef]
  6. Talukder, H.M.; Stowell, T.B. Pneumatic hammer in an externally pressurized orifice-compensated air journal bearing. Tribol. Int. 2003, 36, 585–591. [Google Scholar] [CrossRef]
  7. Shang, H.G.; Sheng, L.N.; Wu, B.X. Studies on the evolution of shock wave in gas film clearance for aerostatic thrust bearing. Prog. Comput. Fluid 2020, 20, 209–221. [Google Scholar]
  8. Chen, X.; Han, C.; Xin, L.; Ye, Y.; Hu, Y.; Xu, J. Air vortices and vano-vibration of aerostaticbearings. Tribol. Lett. 2011, 42, 179–183. [Google Scholar] [CrossRef]
  9. Chen, D.; Dong, L.; Pan, R.; Fan, J.; Qiang, C. Coupling effects of the impact factors in micro-scale on the performance of aerostatic guideway. Ind. Lubr. Tribol. 2018, 70, 846–855. [Google Scholar] [CrossRef]
  10. Chen, D.; Dong, L.; Pan, R. Vibration analysis of air-bearing work-stage under micro-scale effect. Proc. Inst. Mech. Eng. Part K J. Multi-Body Dyn. 2018, 232, 521–534. [Google Scholar] [CrossRef]
  11. Chen, D.; Kong, S.; Liu, J.; Fan, J. Influence of micro-scale velocity slip on the dynamic characteristics of aerostatic slider. Ind. Lubr. Tribol. 2021, 73, 120–125. [Google Scholar] [CrossRef]
  12. Hoopes, K.; Wilkes, J.C.; Moore, J.; Grieco, J.; Passmore, K.; Brady, J. Modeling a spiral groove thrust bearing using 3D, two-way fluid structure interaction with conjugate heat teansfer. Proc. Asme Turbo Expo Turbine Tech. Conf. Expo. 2016, 7b. [Google Scholar] [CrossRef]
  13. Dhar, S.; Vacca, A. A novel FSI-thermal coupled TEHD model and experimental validation through indirect film thickness measurements for the lubricating interface in external gear machines. Tribol. Int. 2015, 82, 162–175. [Google Scholar] [CrossRef]
  14. Gao, Q.; Lu, L.; Chen, W.; Chen, G. A novel modeling method to investigate the performance of aerostatic spindle considering the fluid–structure interaction. Tribol. Int. 2017, 115, 461–469. [Google Scholar] [CrossRef]
  15. Wang, W.; Cheng, X.; Zhang, M.; Gong, W.; Cui, H. Effect of the deformation of porous materials on the performance of aerostatic bearings by fluid-solid interaction method. Tribol. Int. 2020, 150, 106391. [Google Scholar] [CrossRef]
  16. Yan, R.; Wang, L.; Wang, S. Mechanical research on aerostatic guideways in consideration of fluid–structure interaction. Ind. Lubr. Tribol. 2019, 72, 285–290. [Google Scholar] [CrossRef]
  17. Dhande, D.Y.; Pande, D.W.; Lanjewar, G.H. Numerical analysis of three lobe hydrodynamic journal bearing using CFD-FSI technique based on response surface evaluation. J. Braz. Soc. Mech. Sci. Eng. 2018, 40, 393–408. [Google Scholar] [CrossRef]
  18. Wang, B.; Ding, Q.; Yang, T. Soft rotor and gas bearing system: Two-way coupled fluid–Structure interaction. J. Sound Vib. 2019, 445, 29–43. [Google Scholar] [CrossRef]
  19. Gao, Q.; Gao, S.; Lu, L.; Zhu, M.; Zhang, F. A Two-Round Optimization Design Method for Aerostatic Spindles Considering the Fluid–Structure Interaction Effect. Appl. Sci. 2021, 11, 3017. [Google Scholar] [CrossRef]
  20. Li, Y.; Lin, Y.; Zhu, H.; Sun, Z. Research on the gas pressure fluctuation characteristics inside an aerostatic thrust bearing with a pocketed orifice-type restrictor. Tribol. Trans. 2014, 57, 28–35. [Google Scholar] [CrossRef]
  21. Li, Y.; Zhao, J.; Zhu, H.; Lin, Y. Numerical analysis and experimental study on the microvibration of an aerostatic thrust bearing with a pocketed orifice-type restrictor. Proc. Inst. Mech. Eng. Part J J. Eng. Tribol. 2014, 229, 609–623. [Google Scholar] [CrossRef]
  22. Li, Y.; Wan, X.; Li, X. Microvibration suppression of an aerostatic thrust bearing adopting flow field disturbance structure. Adv. Mech. Eng. 2017, 9, 168781401771718. [Google Scholar] [CrossRef] [Green Version]
  23. Chang, S.H.; Chan, C.W.; Jeng, Y.R. Numerical analysis of discharge coefficients in aerostatic bearings with orifice-type restrictors. Tribol. Int. 2015, 90, 157–163. [Google Scholar] [CrossRef]
  24. Gao, Q.; Qi, L.; Gao, S.; Lu, L.; Song, L.; Zhang, F. A FEM based modeling method for analyzing the static performance of aerostatic thrust bearings considering the fluid–structure interaction. Tribol. Int. 2021, 156, 106849. [Google Scholar] [CrossRef]
  25. Shen, X.; Ding, J.; Yu, J.; Li, D. Research on Normal Random Micro-vibration of Restrictors in Ultra-precision Gas Static Pressure Systems. China Mech. Eng. 2020, 31, 2429–2436. [Google Scholar] [CrossRef]
Figure 1. Orifice-type and its equivalent model: (a) axial section of the restrictor; (b) equivalent spring model; and (c) one-orifice model.
Applsci 11 05265 g001
Figure 2. FEM FSI meshing: (a) refined meshing at inlet; (b) meshing at the upper surface; and (c) sweep meshing from top to bottom.
Applsci 11 05265 g002
Figure 3. Transient normal vibration A results under different inlet air velocities v a at different instantaneous time T from FEM FSI model: (a) v a = 0.002 m/s; (b) v a = 0.004 m/s; (c) v a = 0.006 m/s; and (d) v a = 0.008 m/s.
Applsci 11 05265 g003
Figure 4. Time-average amplitudes A a of vibration from FEM FSI model in total time 0.005 s under different inlet air velocities v a .
Applsci 11 05265 g004
Figure 5. Experimental device with a vibrometer.
Applsci 11 05265 g005
Figure 6. The examined restrictors: (a) double-ring-grooved; (b) double-U-grooved; and (c) upper surface.
Applsci 11 05265 g006
Figure 7. Block diagram of the measurement process.
Applsci 11 05265 g007
Figure 8. Time-domain vibration data under 0.5 Mpa and no gas: (a) double-ring-grooved; and (b) double-U-grooved.
Applsci 11 05265 g008
Figure 9. Time-average amplitude Aa under different air-supply pressures: (a) double-ring-grooved; and (b) double-U-grooved.
Applsci 11 05265 g009
Figure 10. Power spectral density of vibration signals under different air-supply pressures: (a) double-ring-grooved [25]; and (b) double-U-grooved.
Applsci 11 05265 g010aApplsci 11 05265 g010b
Table 1. Time-averaged amplitude A a under different air-supply pressures (nm).
Gas Source (MPa)P1P2P3P4P5P6P7P1(U)P2(U)P3(U)P4(U)P7(U)
No gas0.210.290.260.280.180.170.180.390.350.320.450.33
0.10.550.390.690.610.160.160.141.942.012.142.170.59
0.20.710.430.810.680.180.180.162.162.522.252.340.68
0.30.970.570.870.700.210.200.192.872.962.722.991.93
0.41.100.740.890.880.240.210.203.213.373.493.422.03
0.51.421.641.291.310.270.260.245.124.985.375.513.05
Publisher’s Note: MDPI stays neutral with regard to jurisdictional claims in published maps and institutional affiliations.

