Article

Quantitative Risk Assessment for Deep Tunnel Failure Based on Normal Cloud Model: A Case Study at the ASHELE Copper Mine, China

Key Laboratory of Ministry of Education on Safe Mining of Deep Metal Mines, Ministry of Education, Northeastern University, Shenyang 110819, China
*
Author to whom correspondence should be addressed.
Appl. Sci. 2021, 11(11), 5208; https://doi.org/10.3390/app11115208
Submission received: 2 May 2021 / Revised: 27 May 2021 / Accepted: 28 May 2021 / Published: 4 June 2021

Abstract

:
The spatial and temporal distribution of tunnel failure is very complex due to geologic heterogeneity and variability in both mining processes and tunnel arrangement in deep metal mines. In this paper, the quantitative risk assessment for deep tunnel failure was performed using a normal cloud model at the Ashele copper mine, China. This was completed by considering the evaluation indexes of geological condition, mining process, and microseismic data. A weighted distribution of evaluation indexes was determined by implementation of an entropy weight method to reveal the primary parameters controlling tunnel failure. Additionally, the damage levels of the tunnel were quantitatively assigned by computing the degree of membership that different damage levels had, based on the expectation normalization method. The methods of maximum membership principle, comprehensive evaluation value, and fuzzy entropy were considered to determine the tunnel damage levels and risk of occurrence. The application of this method at the Ashele copper mine demonstrates that it meets the requirement of risk assessment for deep tunnel failure and can provide a basis for large-scale regional tunnel failure control in deep metal mines.

1. Introduction

At the current rate of mine expansion, more than 30% of the metal mines in China will enter into the deep mining category (i.e., a mining depth greater than 1000 m) by the end of 2025. This indicates that the exploitation of deep mineral resources will become commonplace in China [1,2,3]. Under high ground stress conditions in deep metal mines, frequent and strong blast disturbances can lead to the spalling and collapse of the rock surrounding tunnels. For example, more than 20 m of the roadway in the Hongtoushan copper mine, one of the deepest nonferrous metal mines in China, was damaged by blasting disturbance at a mining depth of 1000 m [4]. In the Dongguashan copper mine, large-scale collapses in deep tunnels were induced by high ground stress and frequent blasting. In the Jinchuan No. 2 mine, the combined effects of high geo-stress and horizontal tectonic stress resulted in the large-scale deformation and failure of the rock mass, and more than 56% of the deep tunnels have serious damage from collapse, where the maximum convergent deformation can reach 500 mm [5]. In the Ashele copper mine, tunnel collapse and the burial of drilling equipment lead to a long interruption of production. As such, a quantitative risk assessment for deep tunnel failure should be carried out to ensure the safety of workers and equipment (e.g., targeted support measures and systematic mining process optimization).
The deep metal mines have many unique characteristics. First, the mining system is very complex, with the tunnel and shaft arranged in three-dimensional space that can extend thousands of meters horizontally and vertically. Second, several dozens of stopes can be actively mined at different depths, producing a complex and dynamic stress field that can ultimately lead to rock mass failure. Third, for high-production mines, especially those that use medium-length hole blasting or long-hole blasting, the explosives used can weigh several hundred kilograms or even several tons, which will cause extremely strong blast disturbance. Compared to the coal mines, which have a layered structure and use mechanized mining methods, or civil tunnel engineering, which has a linear structure and is excavated by either a smaller amount of explosive or a tunnel boring machine, the characteristics of the rock mass failure in deep metal mines are more complex and uncertain in terms of time, space, frequency, and intensity. Thus, to better assess the risk of the tunnel failure in deep metal mines, it is necessary to consider a variety of parameters and utilize a mathematical method that can evaluate both the probability and uncertainty of rock mass failure. As there are many inducing factors and evaluation indicators for tunnel failure in metal mines, a reasonable index system is necessary to ensure the accuracy of tunnel failure risk assessment. The geological condition is used to refer to the internal cause for tunnel failure (e.g., lithology and in situ stress), and thus multiple geological indicators have been commonly used to study the rock mass stability or predict rock mass hazards [6,7,8]. Mining disturbances are common external triggers for tunnel failure. Under high in-situ stress conditions, during the mining process, rock masses are inevitably subjected to frequent disturbances that can be classified into unloading effects (i.e., the stress change in the surrounding rock mass after the ore is mined) or dynamic disturbances (e.g., blasting). Many scholars have conducted systematic studies on the characteristics of tunnel failure due to mining disturbances and indicate that tunnel failure and mining disturbances are highly correlated [9,10,11,12,13]. Moreover, rock mass responses during tunnel failure, such as the amount of displacement, wave velocity change, microcrack generation, and propagation, are also important indexes for evaluating the stability of the tunnels. Microseismic monitoring technology detects elastic waves generated by rock mass fracturing and has been demonstrated to be a valuable tool for monitoring rock mass stability [14]. Traditional test methods for stress and deformation can only obtain information for individual points, lines, or surfaces. In contrast, the temporal-spatial evolution laws of MS parameters (e.g., event cluster, energy release, and magnitude) are calculated from geophysical theories and can provide three-dimensional information regarding the changes in stress and deformation inside rock mass. MS monitoring technology has played an important role in safety management in deep metal mines and can be used in many aspects, including early warning of dynamic disasters [15,16,17,18,19,20,21,22], rock mass fracture mechanism research [23,24,25], and fault-slip risk assessment [26,27,28].
The quantitative risk assessment for deep tunnel failure can be divided into two categories: the machine learning methods with un/supervised models and comprehensive evaluation methods based on rock mass failure evaluation index criteria. The machine learning methods include the neural networks [29], the support vector machines [30], and the Bayes discriminant analysis [31]. The comprehensive evaluation methods include the Fuzzy Delphi method [32], the principal component analysis method [33,34], grey correlation analysis [35], Topsis [36,37], the fuzzy comprehensive evaluation method [38], the efficacy coefficient method [39,40], the unascertained measure theory [41], the set pair analysis [42], the cloud model [43], and the Dempster-Shafer evidence theory [44]. The cloud model has attracted the attention of rock mechanics researchers [45,46] as it can synthetically describe the randomness and fuzziness of concepts, as well as implement the uncertainty transformation between a qualitative concept and its quantitative instantiations.
The depth of the Ashele copper mine has exceeded 1000 m. Due to the complexity of the mining system, tunnel failure is induced by mining disturbances that have both spatial and temporal components. In this paper, three different evaluation indicators are considered in the risk assessment of deep tunnel failure (geological conditions, mining disturbances, and MS parameters). After the weighted evaluation indexes were determined by using the entropy weight method, the normal cloud model theory was applied to evaluate the rock mass failure risk at the Ashele copper mine.

2. Normal Cloud Model Theory

2.1. Entropy Weight Method

In the application of the normal cloud model, the different evaluation indexes have contributions to the evaluation object. The weight, expressed in a quantitative value that reflects the relative importance of each evaluation index in the set of factors, directly affects the resulting comprehensive evaluation. As such, scientific and reasonable assessment of the evaluation index weights is very important for building an objective evaluation model.
The entropy weight method can be used to weigh multiple evaluation indicators and does not depend on the subjective judgment or experience of decision-makers, which is more objective and accurate for weight calculation. Moreover, the calculation process of this method is simple, and it easily solves the weighting problem in multi-index target evaluation scenarios. The entropy weight method assigns weights according to degree of difference of each evaluation index. If there is a large difference in a specific index, it means that the index contains a lot of information and has a great influence on the comprehensive evaluation results. Thus, it is given a larger weight value. There are three main steps of the entropy weight method, as follows:
(1) Dimensionless processing of the data. According to the property of each index, the profitability index and the cost index can be divided as:
t i j = { x i j max x i j   ( i = 1 ,   2 , , n )   the   profitability   index min x i j x i j   ( i = 1 ,   2 , , n )   the   cos t   index
where j = 1, 2, …, m; n is the number of data, and m is the number of evaluation indicators. The larger the profitability index and the smaller the cost index, the better they are. Then, the data can be normalized as:
t i j = t i j j i t i j
(2) Calculate the information entropy of each indicator. The information entropy of the j-th evaluation index is expressed as:
H j = l i = 1 n u i j ln u i j ,   ( j = 1 ,   2 ,   ,   m ;   i = 1 ,   2 ,   ,   n )
where u i j = t i j i = 1 n t i j , l = 1 ln n , and uij = 0, uijlnuij = 0.
(3) Calculate the weight. The weight of each evaluation index is calculated as:
w j = 1 H j m j = 1 m H j

2.2. Cloud Model

2.2.1. Definition and Numerical Characteristics of the Cloud Model

The cloud model considers the uncertainty of converting between qualitative concepts and quantitative numerical representations [47]. Let U be a quantitative set, then U = {x}. C is a qualitative concept in U, and the definite parameter xU is a random occurrence in C. For any element x of U, the membership degree of x in C is u(x)∈[0,1], and u(x) is a stable random number. The distribution of x in U is called the cloud, and every x is called a cloud droplet. A cloud that is composed of a large number of cloud droplets can represent a qualitative concept in the domain space.
u : U [ 0 , 1 ] x U x u ( x )
Three numerical characteristics (Ex, En, and He) are introduced to express the qualitative concept of cloud theory. Expectation (Ex) is the expectation of the spatial distribution of cloud droplets in the domain space and the mean value of the set. Ex is also the point that best represents the qualitative concept. Entropy (En) is determined by the randomness and fuzziness of the qualitative concept. Specifically, En is a measure of the randomness and fuzziness of a qualitative concept. Hyper entropy (He) is a measure of the uncertainty of the entropy and reflects the cohesion of the uncertainty at all points in the domain space. The value of hyper entropy He indirectly reflects the thickness of cloud droplets.

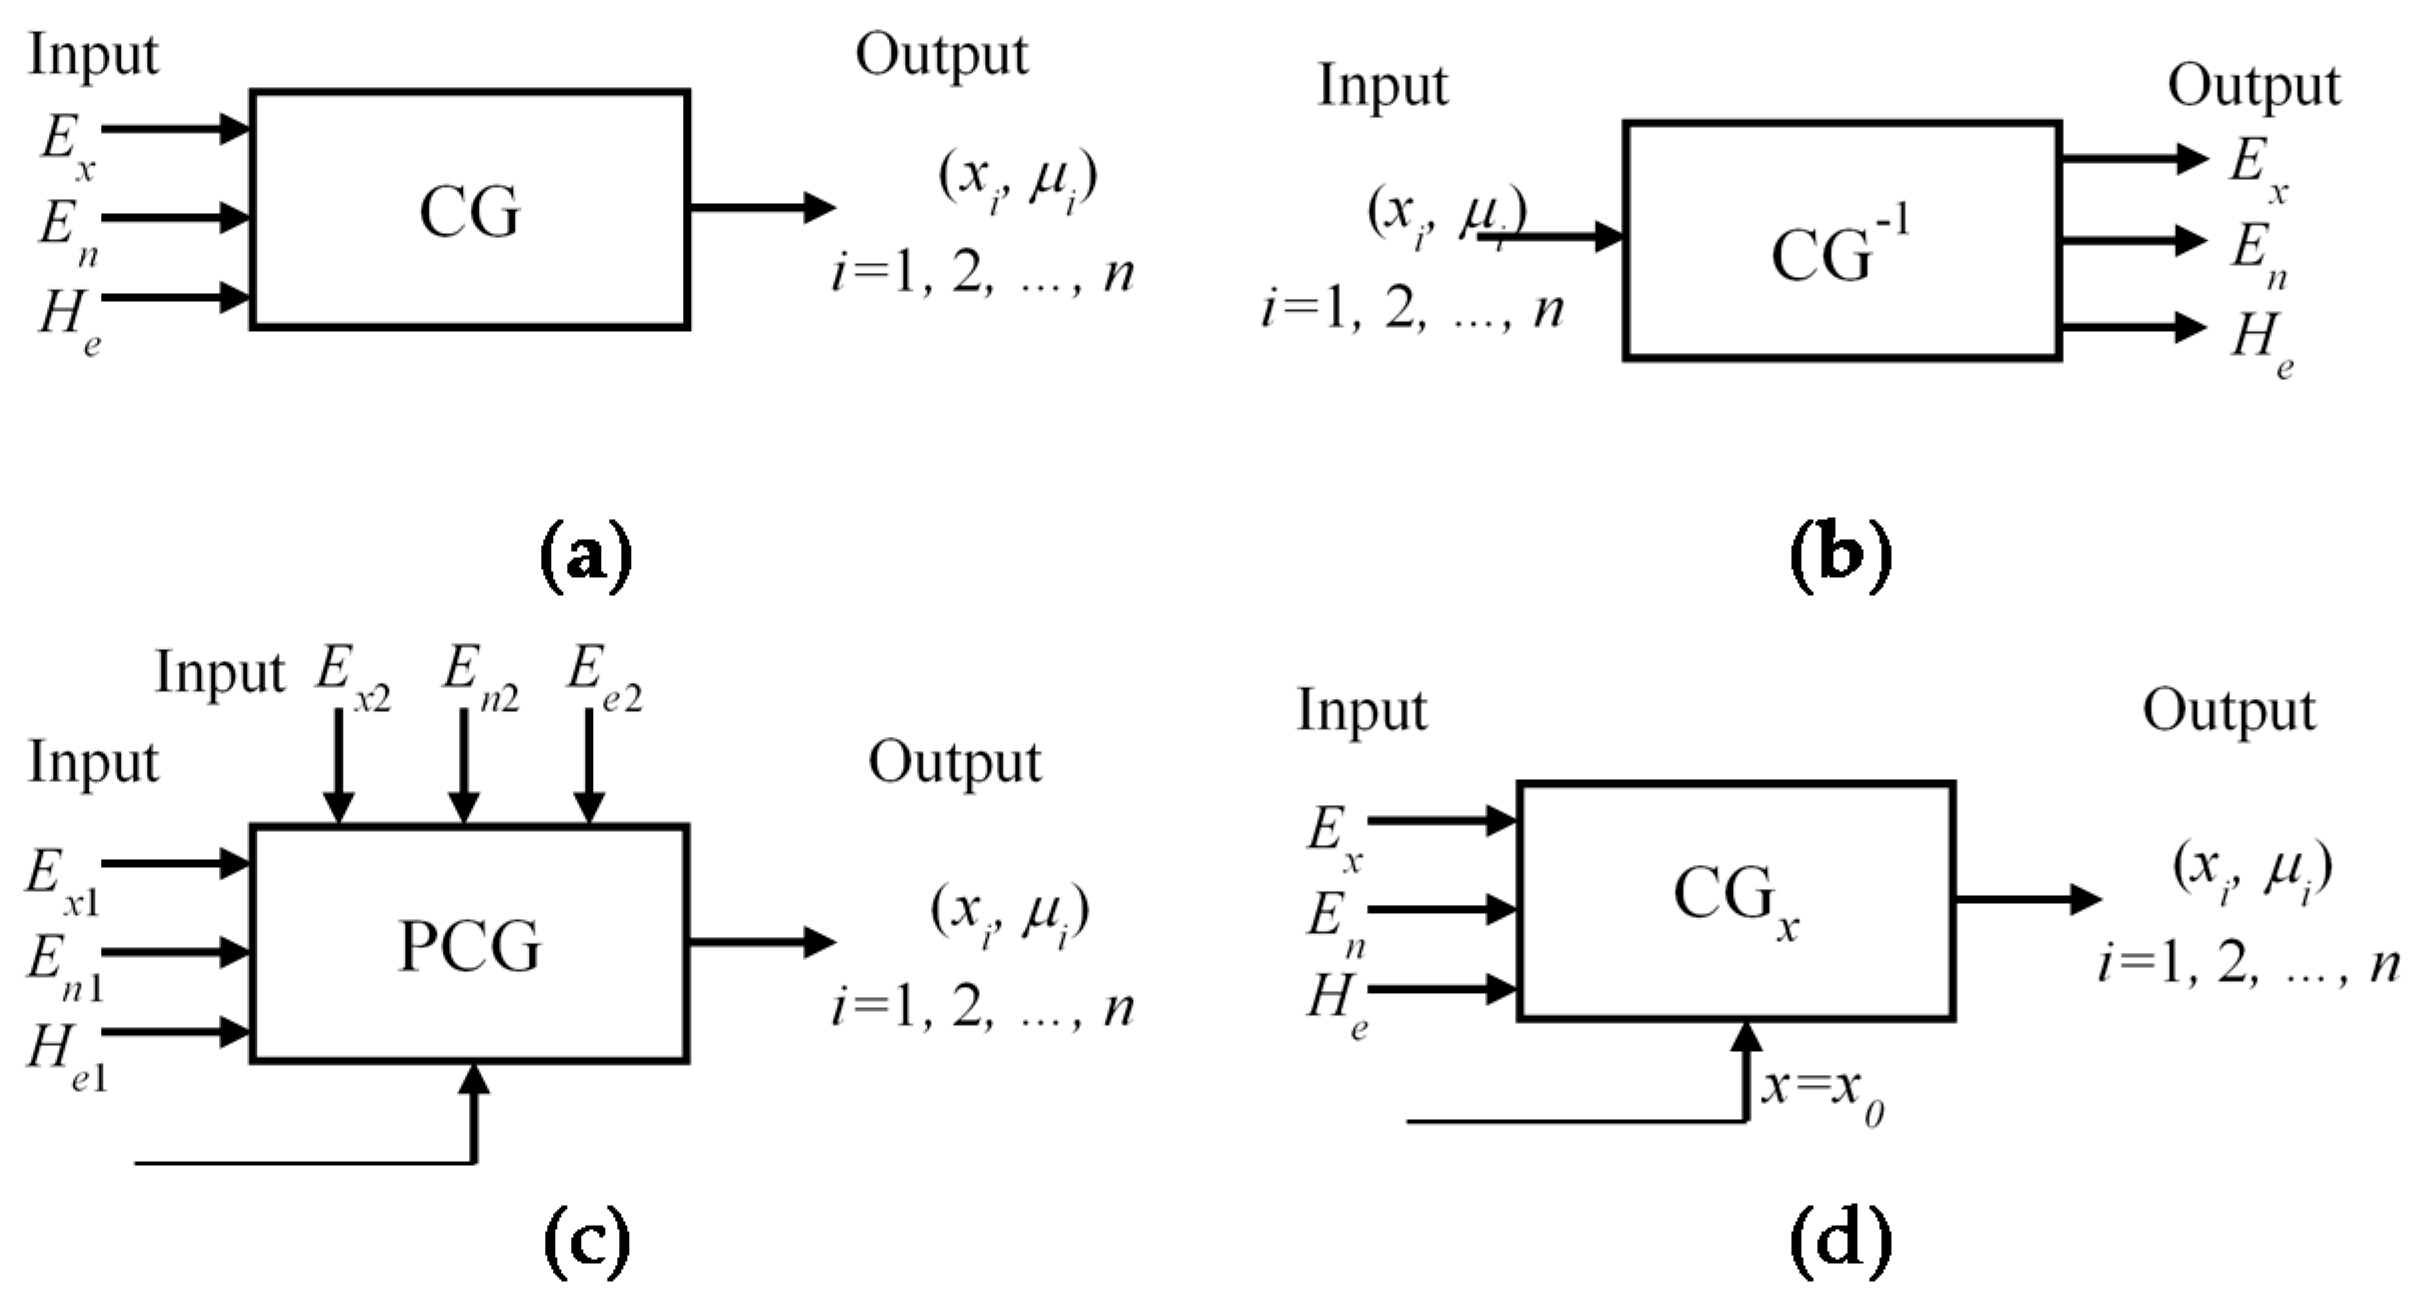
2.2.2. Cloud Generator

Cloud models are executed by cloud generators. There are four commonly used cloud generators: the forward cloud generator, the backward cloud generator, the two-dimensional cloud generator, and the x-condition cloud generator (Figure 1). The forward cloud generator (CG) is used to generate the cloud drops with a membership degree that conforms to the three numerical characteristics. On the contrary, in the backward generator (CG−1), the transferring process is used to derive the qualitative concept represented by the three descriptors from cloud drops. The two-dimensional cloud generators can establish a three-dimensional cloud droplet (x1, x2, y) that satisfies the two-dimensional cloud distribution on the basis of the one-dimensional cloud generator. Lastly, the x-condition cloud generator (CGx) uses the three numerical characteristics of cloud and the specified x = x0 to generate the cloud drops.
By analyzing the determination of membership function in both natural and social sciences, Li et al. [48] determined that the normal distribution is the most suitable distribution for the membership function. According to the central-limit theorem, when a random variable is affected by many small and independent random factors, and each factor does not play an overwhelming role in the controlling distribution, this random variable has a normal distribution. In the case of tunnel collapse, there are many factors that can lead to tunnel damage, and each factor does not play a leading role. Therefore, the normal distribution cloud generator is used for the quantitative risk assessment of deep tunnel failure.

2.2.3. Integrated Cloud Model

Each evaluation index can generate a cloud. Assuming that there are m clouds generated from m evaluation indexes, the integrated cloud model can be established from these clouds based on their weight distribution. The equation is expressed as:
E x = j = 1 m ( E x j × w j )
E n = j = 1 m ( E n j 2 × w j )
H e = j = 1 m ( H e j × w j )
where wj is the weight of the j-th evaluation index, j = 1, 2, …, m.

2.3. Calculation Process of Cloud Model

In this paper, the comprehensive membership degree and comprehensive evaluation value of sample data are calculated based on the cloud model (shown in Figure 2). The calculation process includes three steps.
(1) The numerical characteristics of the cloud associated with each evaluation index are calculated by using the backward cloud generator.
(2) Based on x-conditional cloud model, the membership degree u(xij) of sample data belonging to a certain damage level is calculated. After the weight of each evaluation index, wj is determined by the entropy weight method, and the comprehensive membership degree bi of sample data at certain damage levels is expressed as:
b i = j = 1 m w j × u ( x i j )
The damage level of the sample data is then obtained according to the maximum membership rule. However, when the comprehensive membership degree of different damage levels is similar, using the maximum membership rule may provide incorrect values. The fuzzy entropy, Hi, can provide additional information in these cases and reflect the similarity of the membership degree [49]. The fuzzy entropy term is defined as:
H i = 1 f k = 1 s [ b i k ln b i k + ( 1 b i k ) ln ( 1 b i k ) ]
f = ln 1 s ( s 1 ) ln s 1 s
where bik is the comprehensive membership degree of the k-th damage level, s is the number of damage levels, and f is the normalization coefficient.
(3) The integrated cloud model is established according to Equations (6)–(8). After the eigenvalues of damage levels are determined from the expectation, Ex, the comprehensive evaluation value p of the sample data can be calculated based on the weighted mean method as:
P i = k = 1 s b i k v k k = 1 s b i k
where Pi is the comprehensive evaluation value of the i-th sample data and vk is the eigenvalue of the k-th damage level.

3. The Index System of Risk Assessment for Tunnel Failure

The evaluation index system is the foundation of risk assessment for tunnel failure. In this paper, the classification standards of tunnel failure are determined based on the investigation of deep tunnel failure in the Ashele copper mine. The evaluation indexes used here were derived by analyzing the index’s reliability, weight value, and characteristic value.

3.1. Damage Level of the Tunnel

The tunnel damage level was determined by considering the existing standards [50,51,52] and the results of site surveys. Four damage levels were created: no damage, slight damage, moderate damage, and serious damage (Table 1).
By systematic investigation of tunnel damage in the Ashele copper mine, it was found that there was a variety of damage in the tunnel in the 350 m level to the 0 m level (i.e., the mining depth was approximately from 565 m to 915 m), including spalling and bulking of the sidewall or the roof caving (Figure 3 and Figure 4). The majority of the damage belonged to the slight damage and moderate damage index; however, slight damage accounted for the highest proportion. There were four typical characteristics of the tunnel damage in the Ashele copper mine. First, damage degree increased with buried depth. For example, there was a large range of tunnel damage in strike-drift at the 50 m level. Second, tunnel damage is closely related to the maximum principal stress direction. The majority of the damage occurred in the strike-drift that was oriented perpendicular to the maximum principal stress, rather than in the transverse drift, which was oriented parallel to the maximum principal stress. Third, tunnel damage was greatly affected by mining disturbance. For example, some transverse drifts were located close to the stope and are prone to damage. Fourth, the lithology and the development of joints and fractures had an important influence on the damage of tunnel. For example, tunnels located in rock with significant pyrite developed joints and fractures in the hanging wall and are prone to damage.

3.2. Evaluation Index

Three types of evaluation indexes (geological parameters, mining disturbances, and MS data) (Figure 5) were selected for the risk assessment of tunnel failure in the Ashele copper mine by considering the mining engineering, monitoring data, and tunnel damage characteristics. The evaluation indexes of geological parameters were angled between the tunnel and the maximum principal stress, depth, and lithology. The evaluation index of mining disturbances was the distance between the tunnel and its nearest stope. The evaluation indexes of MS data included the accumulative number of MS events, the accumulative released energy, the density of MS events, apparent stress, and displacement. The definitions of these nine evaluation indexes are introduced in Table 2.
In total, 100 observations between April 2017 to June 2018 were used to populate a risk assessment model for tunnel failure (Table 3). The numbers of no damaged samples, slightly damaged samples, and moderately damaged samples were 24, 44, and 22, respectively. In total, 90 of the observations were randomly selected for modeling, while 10 observations were used for the generalization ability test.

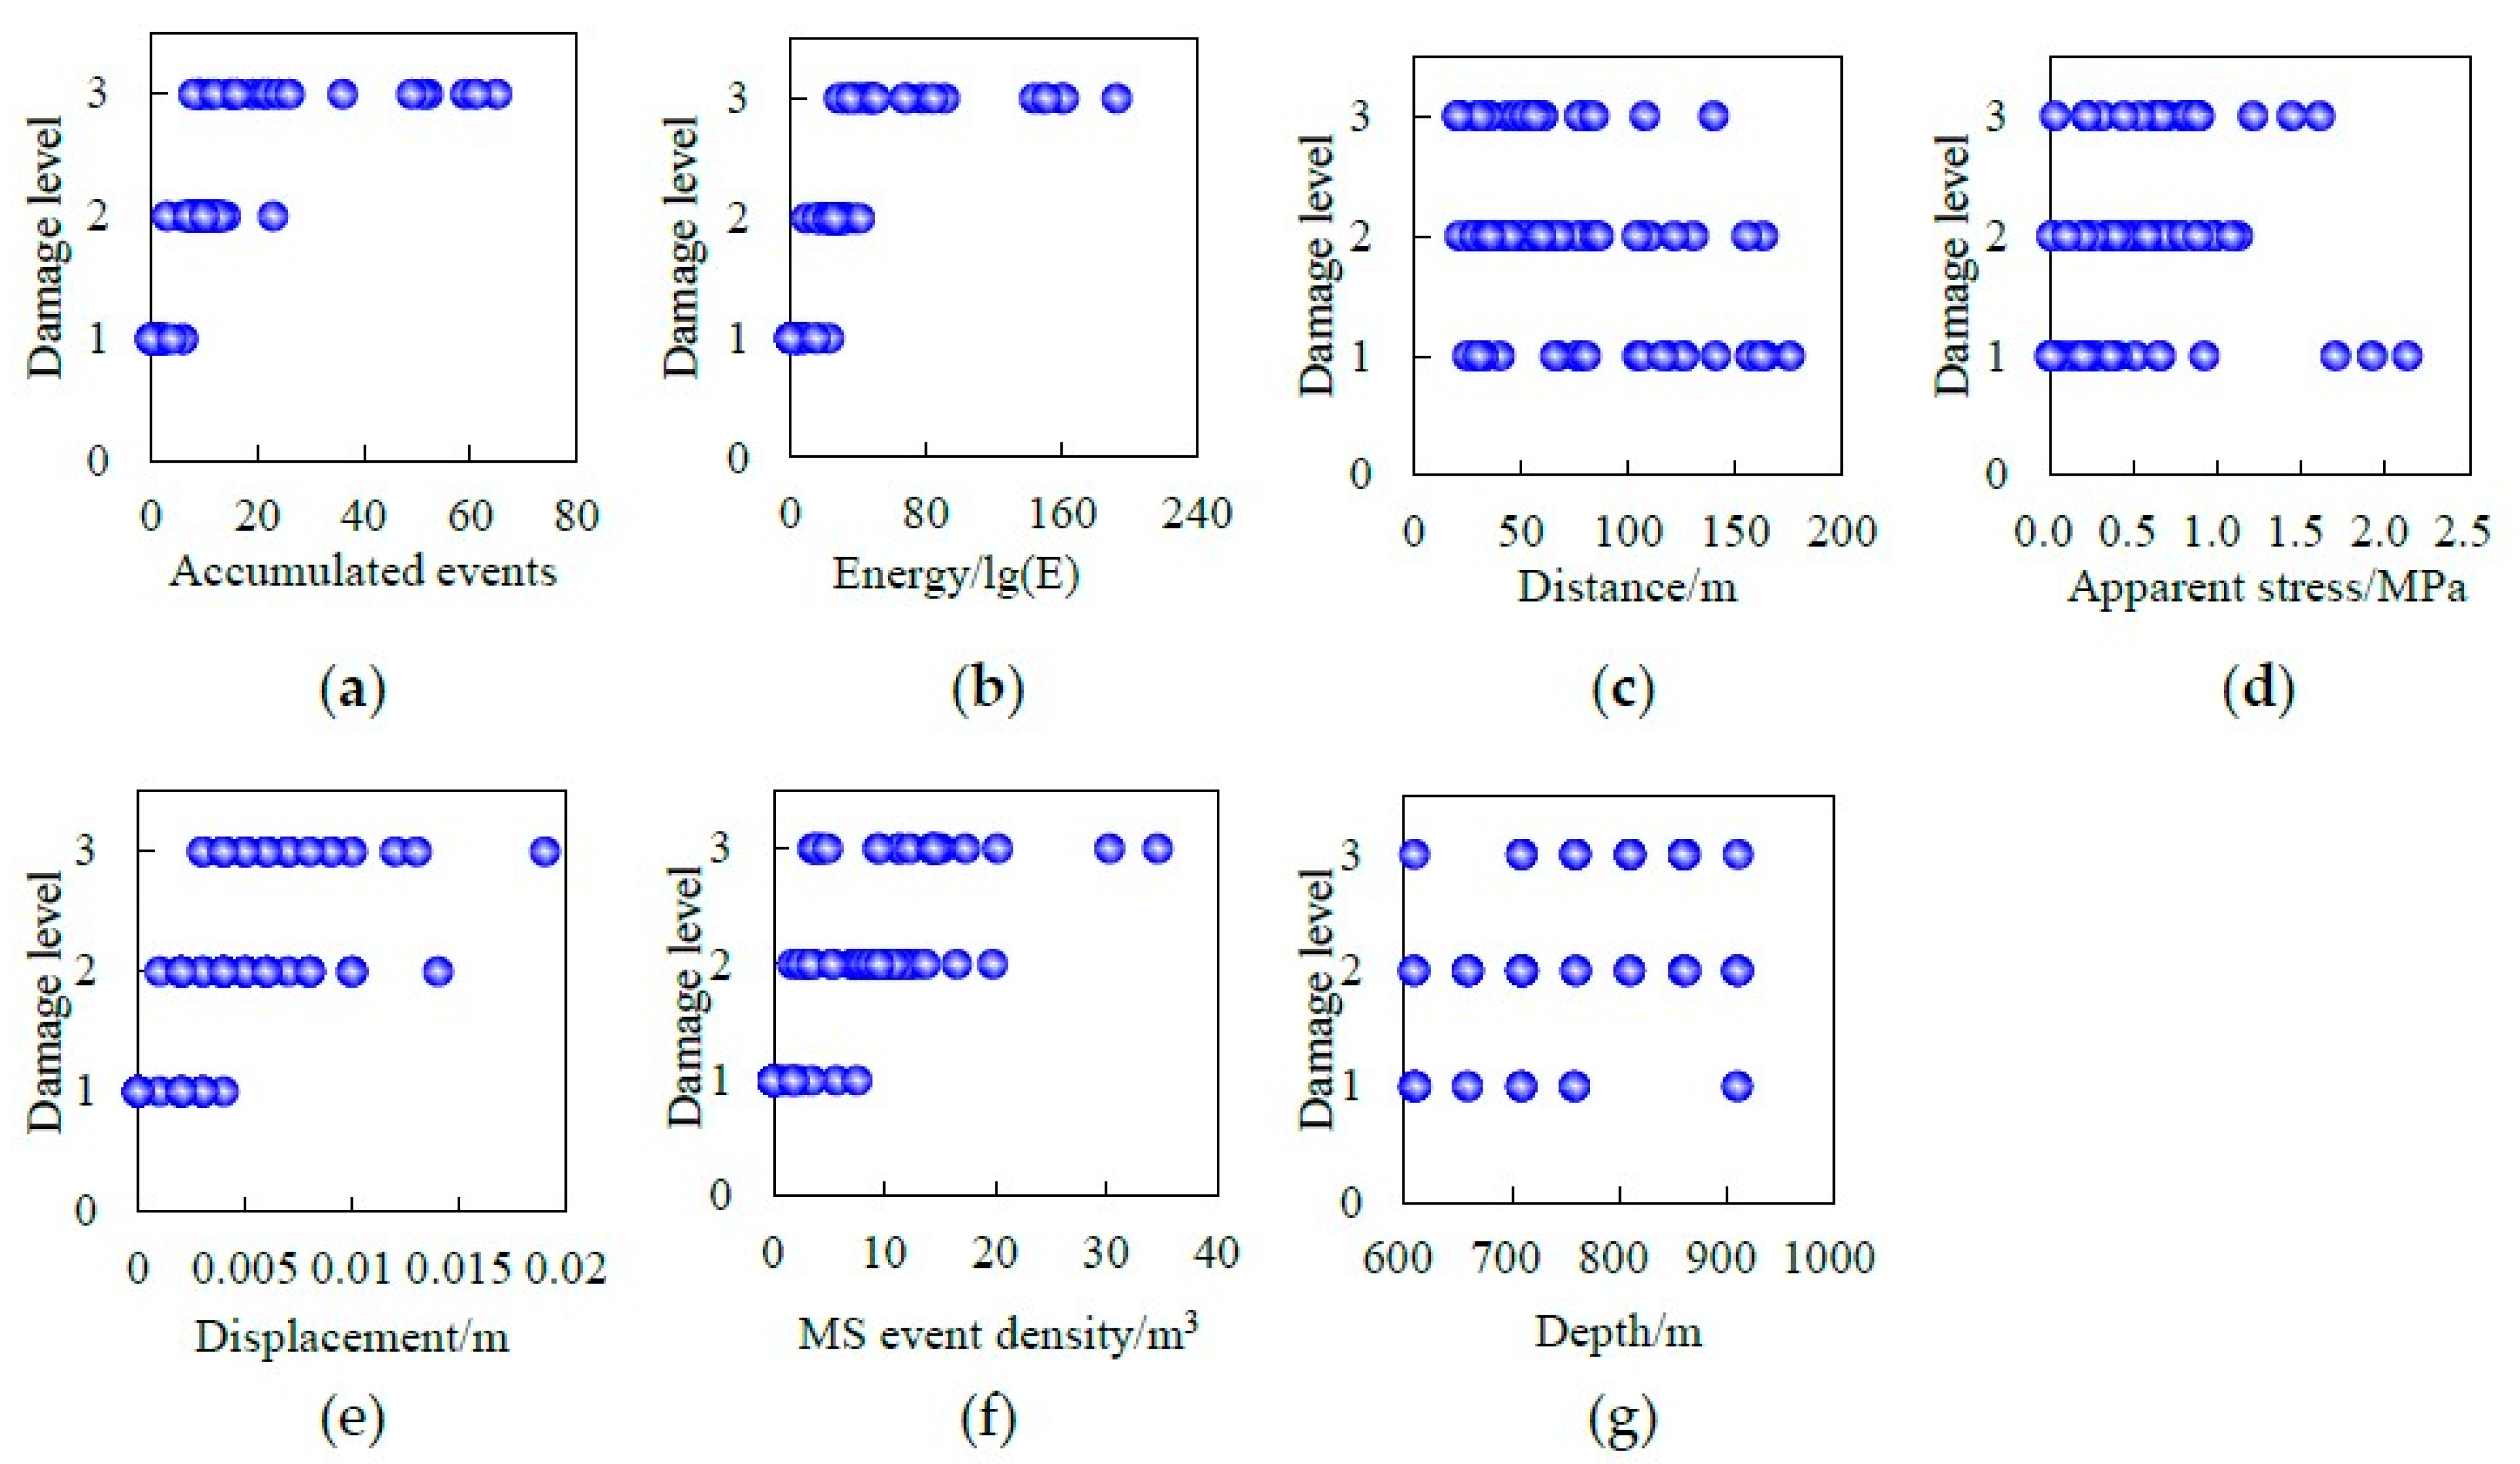
3.3. Correlation Between Evaluation Indicators and Damage Levels

The correlation between the damage levels and the nine evaluation indexes was analyzed to verify the reliability of the evaluation indexes. Table 4 displays the number of angles and lithology occurrences at different damage levels. It was observed that more slight damage observations occurred in tuff and the moderate damage observations were prone to occur in pyrite. In addition, 77 damage observations occured where the tunnel was oriented perpendicular to the maximum principal stress (angle = 90°), and only 13 damage observations occurred when the tunnel was oriented parallel to the maximum principal stress (angle = 0°). This indicates that tunnel orientation has a strong correlation to tunnel damage.
Figure 6 displays the distribution of the other seven evaluation indexes, including the accumulated MS events, the accumulated released energy from the MS events, the MS events density, the displacement, the apparent stress, distance between the tunnel and its nearest stope, and the buried depth. There are many outliers within the upper part of the boxplot for accumulated MS events and the accumulated energy. This may indicate that some sample data of the two indexes deviate from the data distribution center. If these data were used in the tunnel damage risk assessment, the accuracy of the results would be significantly affected. Due to this dispersion, the uppermost and lowermost 5% of the data were removed from each of the seven indexes prior to implementation in tunnel damage risk assessment. The data distribution of these seven evaluation indexes and their mean values after truncation are shown in Table 5. The boundaries of the statistical parameters of each evaluation index overlap between the three damage levels. However, from the scatter diagram of the distribution of evaluation indexes with different damage levels (Figure 7), it can be seen that, although the distribution of the MS events, MS events density, displacement, the apparent stress overlap in each damage category to some extent, each damage level has a distinct cluster of observations. The boundaries of distributions of the other three indexes (the angle, distance, and buried depth) are indistinct at the three damage levels. Because of this, it is not possible to conduct the tunnel damage risk assessment by using a single evaluation index, and a comprehensive analysis by using multi-indexes is necessary to improve the accuracy of the evaluation results.

3.4. Weight of Evaluation Indexes

The weight of the nine evaluation indexes was calculated by using the entropy weight method, according to Equations (1)–(4). Any single index does not play a dominant role in risk assessment compared to other indexes (Figure 8). Thus, multi-indexes models should be applied during the risk assessment of tunnel damage. Among the nine indexes, the accumulated energy and accumulated events have the largest weights (0.211 and 0.21, respectively) and have the greatest impact on the results of tunnel failure risk assessment. The weight of the buried depth index is smallest, which is consistent with the scattered distribution and indistinct boundary of this index at different damage levels (Figure 7). It is worth noting that the evaluation indexes with the five largest weights are MS parameters and account for a cumulative 83.8% of the total weight. This indicates that the MS parameters play a leading role in the risk assessment of tunnel failure.

3.5. Numerical Characteristics of Evaluation Indexes

The numerical characteristics of the evaluation indexes were obtained by using a backward cloud generator (Table 6). Based on the numerical characteristics of the evaluation indexes, the membership relationships between each evaluation index and different damage levels were obtained by the two-dimensional cloud generator, in which each cloud contains 10,000 cloud drops. The results were visualized through clustering diagrams (Figure 9). The boundaries of the cloud drops that represent the buried depth and angle indexes at different damage levels are not clear, while boundaries of the cloud drops of the accumulated events and accumulated energy indexes are distinct. This result is in agreement with the weight value of the evaluation indexes (Figure 8).

4. Risk Assessment of Rock Mass Failure in Tunnel

4.1. Eigenvalues of Damage Levels

During tunnel damage risk assessment, using a weighted mean method, it is necessary to determine the eigenvalues of the different damage levels. The expectation (Ex) is the best parameter to quantitatively describe the damage levels (i.e., it can reflect the difference between the damage levels). Ex was used to determine the eigenvalues of damage levels to avoid subjectivity in using the weighted mean method. When the weight of the evaluation indexes were obtained, the numerical characteristics can be calculated by applying the integrated cloud model (Table 7). The membership degrees of the three damage levels are displayed in Figure 10. In this paper, the Ex of the three damage levels were proceeded by normalization. The Ex of the three levels is 15.46, 22.17, and 38.03 for no damage, slight damage, and moderate damage, respectively. After normalization, the eigenvalues of the three damage levels are 1.00, 1.43, and 2.46, respectively.

4.2. Determination of the Damage Levels

Based on the weights of the evaluation indexes and the degree of membership obtained by the x-condition cloud generator, the comprehensive membership degree B, fuzzy entropy H, and comprehensive evaluation value p of the 100 data samples were calculated according to Equations (9)– (12) (Table 8). When the maximum membership rule was used to determine damage levels, portions of the evaluation information might be lost. Thus, the comprehensive evaluation value p was used to determine the damage level by using the weighted mean method. Moreover, the correctness of the eigenvalues for each damage level calculated by normalized expectations was verified (Figure 11). The comprehensive evaluation results were interrogated by using the two assignment methods for the damage levels: the first method defined the eigenvalues of different damage levels as 1, 2, and 3, while the second method defined them as 1.00, 1.43, and 2.46. The results indicate that the distribution of the later method is smaller, which verifies that using the normalized expectations to define the eigenvalues of the three damage levels was more accurate. The average value of the comprehensive evaluation values for each damage level, P No, P Slight, and P Moderate, were 1.50, 1.74, and 1.87, respectively.
Comparing the known damage levels of 100 data samples to the predicted damage levels, it was found that the accuracy rate of damage level determined based on the principle of maximum affiliation was 81.1% (Table 9). The accuracy rate of slight damage was the lowest, with 13 of 44 sample data misclassified as moderate damage, which lead to a lower accuracy rate of the model. It is worth noting that, for the majority of samples that were misclassified, the comprehensive membership degrees of the correct damage level and the chosen damage level were very close. For example, sample data No. 7 was identified as slight damage level in the mine but was classified as moderate damage. In the comprehensive membership, degrees of the slight damage and moderate damage were 0.39 and 0.40. According to the maximum membership rule, the evaluation result of this sample data is moderate damage. However, the comprehensive evaluation value p of this sample is 1.75, which is very close to the mean value of slight damage samples, P Slight = 1.74. In this case, classification of the damage level based on the comprehensive evaluation value p was more correct. By analyzing samples that were misclassified by the maximum membership rule, it was found that the fuzzy entropy of each was larger than 0.89. Therefore, the comprehensive evaluation value p was used to recalculate the damage level for misclassified samples when the fuzzy entropy was larger than 0.89. This caused four sample data that were originally misclassified to be reclassified as the correct damage level. This additional classification improved the accuracy rate of total sample data improved to 86%. Thus, the implementation of the maximum membership rule and the comprehensive evaluation value, where the maximum membership rule was used, when fuzzy entropy H < 0.89, and the comprehensive evaluation value is used when fuzzy entropy H > 0.89, can improve the evaluation accuracy of tunnel damage level.

4.3. Tunnel Failure Risk Assessment Method

To ensure the safety of mining process, it is necessary to establish a risk assessment method of tunnel damage. Using the inputs and methods of the normal cloud model above, a systematic assessment process was formulated that fit the mining conditions in the Ashele copper mine (Figure 12). First, the damage level was calculated according to the maximum membership rule and the comprehensive evaluation value. When the two results were consistent, the damage levels were assigned to risk levels (no damage = no risk, slight damage = low risk, moderate damage = medium risk, and serious damage = high risk). Second, if the two results were inconsistent, the evaluation threshold T of the fuzzy entropy was determined by comparing the actual damage level and the result obtained from the maximum membership rule. The tunnel failure risk was then retrieved from an evaluation matrix (Figure 13). Third, in the process of the application of the evaluation matrix, two cases should be considered. When the fuzzy entropy H was larger than threshold T, that is the comprehensive membership degrees of different damage levels were very close, the higher damage level was output as the result according to the conservative principle. Otherwise, when the fuzzy entropy H was smaller than threshold T, the result depended on the comprehensive evaluation value.

4.4. Application

Using the assessment method, regular risk assessment for tunnel failure was carried out every 6 months in the Ashele copper mine. Using the model created above, the average values of the comprehensive evaluation values of the three damage levels P No, P Slight, and P Moderate were 1.50, 1.74, and 1.87, respectively, and the threshold of fuzzy entropy was 0.89. The risk assessment results are visually displayed on the 3D geological model, which was used for the optimization of the mining process and support.
Results of the risk assessment performed in June 2019 show that the medium risk areas were dominantly concentrated at the footwall at the 150 m level and 100 m level (Figure 14), accounting for 2% of the total length of the tunnels. Low risk areas were mainly located in four regions: the footwall of the 200 m, 150 m, 100 m, and 50 m levels and the hang wall of the 150 m and 100 m levels. The length of these tunnels accounted for 9% of the total tunnel length. The modeled results were verified by site investigations, and secondary reinforcements were put in place through areas of medium risk. This integrated model and site investigation workflow effectively reduced the risk of ground pressure hazards during deep mining in the Ashele copper mine.

5. Conclusions

Rock mass failure in deep metal mines is complex and uncertain in terms of time, space, frequency, and intensity. Considering the complex characteristics of tunnel failure in the Ashele copper mine, a quantitative method to assess risk of tunnel failure was carried out by considering three aspects of tunnel failure (geological conditions, mining disturbances, and MS parameters). These controls were divided into numerous evaluation indexes and implemented in a normal cloud model to predict damage levels.
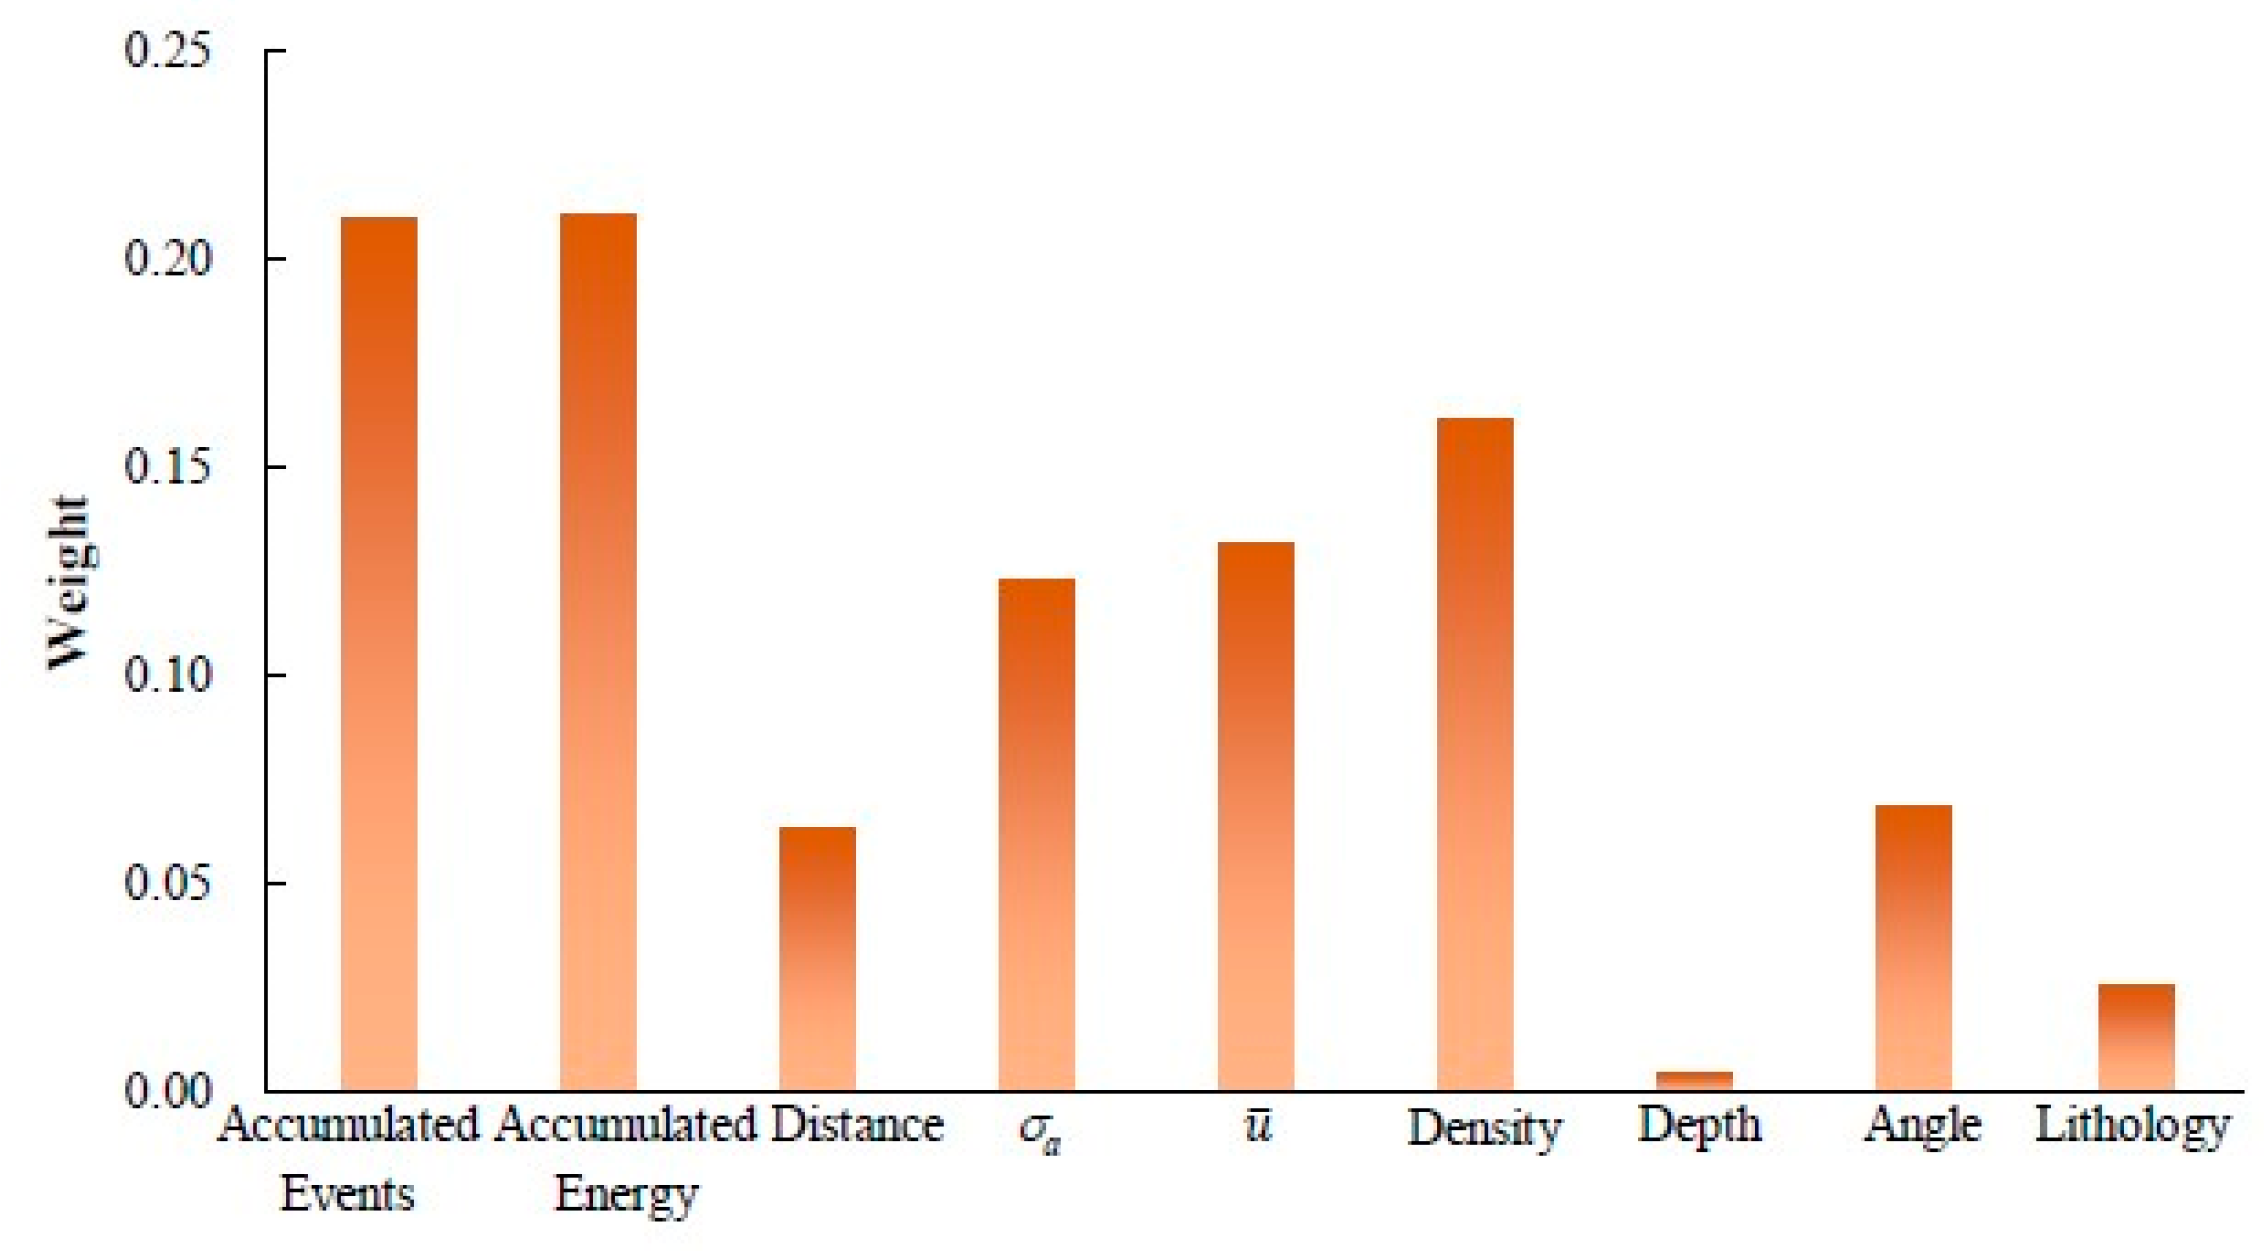
  • The evaluation indexes considered here provided different contributions to the tunnel failure model, and any single index did not lead the factor compared to other indexes. Among the nine indexes, the accumulated energy and accumulated events had the largest contributions, while the weight of the buried depth had the smallest contribution. The five largest weights within the model were attributed to MS indexes and accounted for 83.8% of the total weight. This indicates that the MS indexes play a leading role in the risk assessment of tunnel failure.
  • The eigenvalues of the three damage levels predicted within the Ashele mine were defined by using the normalized expectations (Ex), which can reduce the range of the comprehensive evaluation value of each damage level and improve the application of the weighted mean method.
  • The accuracy rate of damage level classified by the maximum membership rule was 81.1% in the Ashele copper mine. By considering the fuzzy entropy of the sample, the comprehensive application of the maximum membership rule and the comprehensive evaluation value were used to improve the evaluation accuracy of the tunnel damage level to 86%.
  • Based on the maximum membership rule, the comprehensive evaluation value, and the fuzzy entropy, a quantitative evaluation method for the tunnel damage risk was established in the Ashele Copper Mine. The application results indicate that the assessment results can provide a basis for the control of ground pressure hazards and the optimization of mining process in deep metal mines.

Author Contributions

J.L. put forward the concept and wrote the original draft of the manuscript. H.S. processed the data further and edited the manuscript. R.W., Y.S., D.W. and Y.W. collected the related references and drew the pictures in the paper. All authors have read and agreed to the published version of the manuscript.

Funding

The paper was financially supported by the National Natural Science Foundation of China (51974059) and the Fundamental Research Funds for the Central Universities (N180115010).

Institutional Review Board Statement

Not applicable.

Informed Consent Statement

Not applicable.

Data Availability Statement

The data presented in this study are available on request from the corresponding author.

Acknowledgments

Thanks are given to colleagues for their valuable contributions to the project. Finally, the authors would like to thank the editors and reviewers for their valuable comments and constructive suggestions.

Conflicts of Interest

The authors declare that the paper described has not been published before; that it is not under consideration for publication anywhere else; that its publication has been approved by all co-authors; that there is no conflict of interest regarding the publication of this article.

References

  1. Li, X.B.; Zhou, J.; Wang, S.F.; Liu, B. Review and practice of deep mining for solid mineral resources. Chin. J. Nonferrous Met. 2017, 27, 1236–1262. [Google Scholar]
  2. Cai, M.F.; Xue, D.L.; Ren, F.H. Current status and development strategy of metal mines. Chin. J. Eng. 2019, 41, 417–426. [Google Scholar]
  3. Xie, H.P. Research review of the state key research development program of China: Deep rock mechanics and mining theory. J. Chin. Coal Soc. 2019, 44, 1283–1305. [Google Scholar]
  4. Liu, J.P.; Xu, S.D.; Li, Y.H.; Lei, G. Analysis of rock mass stability based on mining-induced seismicity: A case study at the Hongtoushan copper mine in China. Rock Mech. Rock Eng. 2019, 52, 265–276. [Google Scholar] [CrossRef]
  5. Gao, Q.; Song, J.G.; Yu, W.J.; Wang, Z.H. Design and numerical simulation of rock bolting and shotcrete for deep tunnels with high stress in Jinchuan Mine. Chin. J. Geotech. Eng. 2007, 29, 279–284. [Google Scholar]
  6. Yang, Z.G.; Yu, R.C.; Guo, R.; Wang, L.H. Research of mining based on microseismic monitoring technology in high-stress area. Chin. J. Rock Mech. Eng. 2009, 28, 3632–3638. [Google Scholar]
  7. Zhang, R.L.; Luo, Z.Q. Research on Roadway roof fall prediction based on combined weighting and finite interval cloud model. Min. Metall. Eng. 2019, 39, 11–14+19. [Google Scholar]
  8. Jin, C.Y.; Lu, Y.; Han, T.; Chen, T.Y.; Cui, J.X.; Cheng, D.X. Study on refined back analysis method for stress field based on in situ and disturbed stresses. Int. J. Geomech. 2021, 21, 04021141. [Google Scholar] [CrossRef]
  9. Gu, J.C.; Chen, A.M.; Xu, J.M.; Zhao, H.L.; Zhang, X.Y.; Gu, L.Y.; Ming, Z.Q. Model test study of failure patterns of anchored tunnel subjected to explosion load. Chin. J. Rock Mech. Eng. 2008, 27, 1315–1320. [Google Scholar]
  10. Zhu, W.C.; Li, Z.H.; Zhu, L.; Tang, C.A. Numerical simulation on rockburst of underground opening triggered by dynamic disturbance. Tunn. Undergr. Space Technol. 2010, 25, 587–599. [Google Scholar] [CrossRef]
  11. Li, Y.H.; Peng, J.Y.; Zhang, F.P.; Qiu, Z.G. Cracking behavior and mechanism of sandstone containing a pre-cut hole under combined static and dynamic loading. Eng. Geol. 2016, 213, 64–73. [Google Scholar] [CrossRef]
  12. Li, X.B.; Li, C.J.; Cao, W.Z.; Tao, M. Dynamic stress concentration and energy evolution of deep-buried tunnels under blasting loads. Int. J. Rock Mech. Min. 2018, 104, 131–146. [Google Scholar] [CrossRef]
  13. Liu, J.P.; Zhang, C.Y.; Si, Y.T.; Wang, R.; Lei, G.; Xu, S.D. Temporal-spatial evolution of acoustic emission during progressive fracture processes around tunnel triggered by blast-induced disturbances under uniaxial and biaxial compression. Tunn. Undergr. Space Technol. 2020, 96, 103329. [Google Scholar]
  14. Mendecki, A.J. Seismic Monitoring in Mines; Chapman & Hall: London, UK, 1997. [Google Scholar]
  15. Poplawski, R.F. Seismic parameters and rockburst hazard at Mt Charlotte mine. Int. J. Rock Mech. Min. 1997, 34, 1213–1228. [Google Scholar] [CrossRef]
  16. Urbancic, T.I.; Trifu, C.I. Recent advances in seismic monitoring technology at Canadian mines. J. Appl. Geophys. 2000, 45, 225–237. [Google Scholar] [CrossRef]
  17. Li, S.L.; Yin, X.G.; Zeng, W.D.; Trifu, C.I. Research of multi-channel microseismic monitoring system and its application to Fankou Lead-zinc Mine. Chin. J. Rock Mech. Eng. 2005, 24, 2048–2053. [Google Scholar]
  18. Tang, L.Z.; Wang, L.H.; Zhang, J.; Li, X.B. Seismic apparent stress and deformation in a deep mine under large-scale mining and areal hazardous seismic prediction. Chin. J. Rock Mech. Eng. 2011, 30, 1168–1178. [Google Scholar]
  19. Liu, J.P.; Feng, X.T.; Li, Y.H.; Xu, S.D.; Sheng, Y. Studies on temporal and spatial variation of microseismic activities in a deep metal mine. Int. J. Rock Mech. Min. 2013, 60, 171–179. [Google Scholar] [CrossRef]
  20. Feng, X.T.; Liu, J.P.; Chen, B.R.; Xiao, Y.X.; Feng, G.L.; Zhang, F.P. Monitoring, warning, and control of rockburst in deep metal mines. Engineering 2017, 3, 538–545. [Google Scholar] [CrossRef]
  21. Mngadi, S.B.; Durrheim, R.J.; Manzi, M.S.D.; Ogasawara, H.; Yabe, Y.; Yilmaz, H.; Wechsler, N.G.; Aswegen, G.V.; Roberts, D.; Ward, A.K.; et al. Integration of underground mapping, petrology, and high-resolution microseismicity analysis to characterise weak geotechnical zones in deep South African gold mines. Int. J. Rock Mech. Min. 2019, 114, 79–91. [Google Scholar] [CrossRef]
  22. Wang, Y.; Shang, X.; Wang, Z.; Gao, R. High-accuracy location of microseismic events in a strong inhomogeneous mining environment by optimized global full waveform inversion. Appl. Sci. 2020, 10, 7205. [Google Scholar] [CrossRef]
  23. Hudyma, M.; Potvin, Y.H. An engineering approach to seismic risk management in hardrock mines. Rock Mech. Rock Eng. 2010, 43, 891–906. [Google Scholar] [CrossRef]
  24. Wu, S.C.; Huang, X.Q.; Chen, F.; Chai, J.F.; Wu, H.Y. Moment tensor inversion of rock failure and its application. Rock Soil Mech. 2016, 37, 1–18. [Google Scholar]
  25. Liu, J.P.; Si, Y.T.; Zhang, C.Y.; Wang, R. Estimation of fracturing mechanisms by the ratio of radiated energy between S and P waves of microseismic events during mining in metal mines. Appl. Geophys. 2020, 17, 465–474. [Google Scholar] [CrossRef]
  26. Zhang, P.H.; Yang, T.H.; Yu, Q.L.; Xu, T.; Zhu, W.C.; Liu, H.L.; Zhou, J.R.; Zhao, Y.C. Microseimicity induced by fault activation during the fracture process of a crown pillar. Rock Mech. Rock Eng. 2015, 48, 1673–1682. [Google Scholar] [CrossRef]
  27. Liu, J.P.; Liu, Z.S.; Wang, S.Q.; Shi, C.Y.; Li, Y.H. Analysis of microseismic activity in rock mass controlled by fault in deep metal mine. Int. J. Min. Sci. Technol. 2016, 26, 235–239. [Google Scholar] [CrossRef]
  28. Ma, J.; Dong, L.J.; Zhao, G.Y.; Li, X.B. Focal Mechanism of Mining-Induced Seismicity in Fault Zones: A Case Study of Yongshaba Mine in China. Rock Mech. Rock Eng. 2019, 52, 3341–3352. [Google Scholar] [CrossRef]
  29. Feng, G.L.; Xia, G.Q.; Chen, B.R.; Yao, Y.X.; Zhou, R.C. A method for rockburst prediction in the deep tunnels of hydropower stations based on the monitored microseismicity and an optimized probabilistic neural network model. Sustainability 2019, 11, 3212. [Google Scholar] [CrossRef] [Green Version]
  30. Ji, B.; Xie, F.; Wang, X.P.; He, S.Q.; Song, D.Z. Investigate contribution of multi-microseismic data to rockburst risk prediction using support vector machine with genetic algorithm. IEEE Access. 2020, 8, 58817–58828. [Google Scholar] [CrossRef]
  31. Hu, Y.X.; Li, X.B. Bayes discriminant analysis method to identify risky of complicated goaf in mines and its application. Trans. Nonferrous Met. Soc. China 2012, 22, 425–431. [Google Scholar] [CrossRef]
  32. Liu, Y.C.; Chen, C.S. A new approach for application of rock mass classification on rock slope stability assessment. Eng. Geol. 2007, 89, 129–143. [Google Scholar] [CrossRef]
  33. Pu, Y.Y.; Apel, D.; Xu, H.W. A principal component analysis/fuzzy comprehensive evaluation for rockburst potential in kimberlite. Pure Appl. Geophys. 2018, 175, 2141–2151. [Google Scholar] [CrossRef]
  34. Wu, S.C.; Zhang, C.X.; Cheng, Z.Q. Prediction of intensity classification of rockburst based on PCA-PNN principle. J. Chin. Coal Soc. 2019, 44, 2767–2776. [Google Scholar]
  35. Gao, C.L.; Li, S.C.; Wang, J.; Li, L.P.; Lin, P. The Risk Assessment of Tunnels Based on Grey Correlation and Entropy Weight Method. Geotech. Geol. Eng. 2018, 36, 1621–1631. [Google Scholar] [CrossRef]
  36. Gong, J.; Hu, N.L.; Cui, X.; Wang, X.D. Rockburst tendency prediction based on AHP-TOPSIS evaluation model. Chin. J. Rock Mech. Eng. 2014, 33, 1442–1448. [Google Scholar]
  37. Xue, Y.G.; Bai, C.H.; Kong, F.M.; Qiu, D.H.; Li, L.P.; Su, M.X.; Zhao, Y. A two-step comprehensive evaluation model for rockburst prediction based on multiple empirical criteria. Eng. Geol. 2020, 268, 105515. [Google Scholar] [CrossRef]
  38. Cai, W.; Dou, L.M.; Zhang, M.; Cao, W.Z.; Shi, J.Q.; Feng, L.F. A fuzzy comprehensive evaluation methodology for rock burst forecasting using microseismic monitoring. Tunn. Undergr. Space Technol. 2018, 80, 232–245. [Google Scholar] [CrossRef]
  39. Wang, Y.C.; Shang, Y.Q.; Sun, H.Y.; Yan, X.S. Study of prediction of rockburst intensity based on efficacy coefficient method. Rock Soil Mech. 2010, 31, 529–534. [Google Scholar]
  40. Qiu, D.H.; Li, S.C.; Zhang, L.W. Study on rockburst intensity prediction based on efficacy coefficient method. Appl. Mech. Mater. 2013, 353–356, 1277–1280. [Google Scholar] [CrossRef]
  41. Jia, Q.J.; Wu, L.; Li, B.; Chen, C.H.; Peng, Y.X. The comprehensive prediction model of rockburst tendency in tunnel based on optimized unascertained measure theory. Geotech. Geol. Eng. 2019, 37, 3399–3411. [Google Scholar] [CrossRef]
  42. Jiao, S.H.; Wang, J.A.; Zhou, H.L. Comprehensive evaluation of bolt and wire mesh support scheme of roadway based on set pair analysis. Adv. Mater. Res. 2014, 838–841, 1250–1255. [Google Scholar] [CrossRef]
  43. Li, D.Y.; Liu, C.Y.; Gan, W.Y. A new cognitive model: Cloud model. Int. J. Intell. Syst. 2009, 24, 357–375. [Google Scholar] [CrossRef]
  44. Wu, S.L.; Yang, S.; Du, X.D. A model for evaluation of surrounding rock stability based on D-S evidence theory and error-eliminating theory. Bull. Eng. Geol. Environ. 2021, 80, 2237–2248. [Google Scholar] [CrossRef]
  45. Liu, Z.; Shao, J.; Xu, W.; Meng, Y.D. Prediction of rock burst classification using the technique of cloud models with attribution weight. Nat. Hazards. 2013, 68, 549–568. [Google Scholar] [CrossRef]
  46. Lin, Y.; Zhou, K.P.; Li, J.L. Application of cloud model in rock burst prediction and performance comparison with three machine learning algorithms. IEEE Access 2018, 6, 30958–30968. [Google Scholar] [CrossRef]
  47. Li, D.Y.; Meng, H.J.; Shi, X.M. Membership clouds and membership cloud generator. J. Res. Dev. 1995, 32, 15–20. [Google Scholar]
  48. Li, D.Y.; Liu, C.Y.; Liu, L.Y. Study on the universality of the normal cloud. Eng. Sci. 2005, 3, 18–24. [Google Scholar]
  49. Ding, S.F.; Zhu, H.; Xu, X.Z.; Shi, Z.Z. Entropy-based fuzzy information measures. Chin. J. Comput. 2012, 35, 796–801. [Google Scholar] [CrossRef]
  50. Ke, J.K. Blasting Vibration Failure Criterion of Granite Body and Rock Cave. Combust. Explos. Shock Waves. 1987, 02, 117–122. [Google Scholar]
  51. Tian, C.G.; Chen, S.H. Application of standard for engineering classification of rock masses in underground mining engineering. Min. Tech. 2005, 5, 90–93. [Google Scholar]
  52. Feng, X.T.; Chen, B.R.; Zhang, C.Q.; Li, S.J.; Wu, S.Y. Mechanism, Warning and Dynamic Control of Rockburst Development Processes; Science Press: Beijing, China, 2013. [Google Scholar]
Figure 1. Graphic expression of different cloud generators. (a) The forward cloud generator; (b) the backward cloud generator; (c) the two-dimensional cloud generator; (d) the x-condition cloud generator.
Applsci 11 05208 g001
Figure 2. Calculation process by using the cloud model.
Applsci 11 05208 g002
Figure 3. Failure characteristics of different levels of tunnels in the Ashele Copper Mine. (a) No damage; (b) slight damage; (c) moderate damage.
Applsci 11 05208 g003
Figure 4. Distribution of tunnel damage with different damage in the Ashele Copper Mine.
Applsci 11 05208 g004
Figure 5. Distribution of MS events within the deep mining area of the Ashele Copper Mine.
Applsci 11 05208 g005
Figure 6. Box plot of the distribution of the seven evaluation indexes.
Applsci 11 05208 g006
Figure 7. Distribution of evaluation indexes across the damage levels. (a) accumulated events; (b) energy; (c) distance; (d) apparent stress; (e) displacement; (f) MS event density; (g) depth. Numbers along the y-axis (1, 2, and 3) represent the damage levels (no damage, slight damage, and moderate damage, respectively).
Applsci 11 05208 g007
Figure 8. The weight of the nine evaluation indexes.
Applsci 11 05208 g008
Figure 9. Clustering of the evaluation indexes of different damage levels generated by the cloud models.
Applsci 11 05208 g009
Figure 10. Distribution of membership degrees of different damage levels based on the integrated cloud model.
Applsci 11 05208 g010
Figure 11. Comprehensive evaluation results by using the two assignment methods for eigenvalues of each damage level. (a) No damage; (b) slight damage; (c) moderate damage.
Applsci 11 05208 g011
Figure 12. Risk assessment process of tunnel failure in the Ashele copper mine.
Applsci 11 05208 g012
Figure 13. Risk assessment matrix of tunnel damage.
Applsci 11 05208 g013
Figure 14. The assessment result of tunnel failure in June 2019 in the Ashele Copper Mine.
Applsci 11 05208 g014
Table 1. Description of the different damage levels of the tunnel.
Damage LevelDescription
No damageThere is no damage or only slight deformation in the tunnel. The current support is able to keep the rock mass stable.
Slight damageThe deformation of rock mass in the tunnel can be observed by the naked eye. A small range of rock mass has fallen or is bulking. Parts of the support appear damaged but can keep being used after small repairs.
Moderate damageThe support and rock mass in the tunnel appear to be damaged and fall in a range greater than a meter in length. Secondary support should be put in place.
Serious damageThe integrity of the support and rock mass in tunnel is severely damaged along several meters and has had serious impact on the normal production work. It is difficult to clean up the collapsed rock. Secondary reinforcement or support should be put in place.
Table 2. Description of the evaluation indexes for tunnel failure in the Ashele copper mine.
Evaluation IndexDescription
AngleDefined as the angle between the tunnel and the maximum principal stress. The majority of the damage occurred in the strike-drift that, which is oriented perpendicular to the maximum principal stress.
DepthThe deeper the tunnels are buried, the greater the vertical stress and the more serious damage that occurs.
LithologyThe lithology and the development of joints and fractures have an important influence on the damage of tunnel.
DistanceRock mass is inevitably subjected to changes in stress field after the ore is mined and during blasting disturbances. The closer the tunnel is to the stope, the more the mining disturbances and unloading effects affect the tunnel stability.
Accumulated eventsTotal number of MS events generated within a certain time period and region. The number of accumulated events is used to evaluate the change in regional fracture activities.
Accumulated energyTotal energy released by MS events within a certain time period and region. The accumulated energy is used to reflect the degree of energy released by cracks generated inside the rock mass.
Event densityNumber of MS events per unit volume of rock mass. The event density is used to describe the cluster extent of MS events.
Apparent stress σaThe apparent stress is the ratio of the total radiated seismic energy to the seismic moment. It assesses the amount of energy released per unit of deformation and is defined as: σa = μ/M0, where u is the modulus of rigidity of the source and M0 is the seismic moment.
Displacement u ¯ It is the average displacement of the source, where r0 is the source radius and is defined as: u ¯ = M 0 μ π r 0 2
Table 3. Example of observation data that includes the evaluation indexes and the damage level.
Accumulated MS EventsAccumulated Energy/lgE(J)Distance/mσa/MPa u ¯ /m Density/m3Depth/mAngle/°LithologyDamage Level
823.635.30.200.00211.7970990PyriteSlight
14.35105.880.020.0020.3260990TuffNo
27.1576.350.360.0032.477580PyriteNo
1650.583.950.440.0084.897590PyriteModerate
102558.910.260.00313.6865990PyriteSlight
1132.460.280.220.00489080TuffSlight
1329.885.980.390.0053.4265990PyriteSlight
2269.155.30.870.00720.2681090TuffModerate
723.4121.370.200.0048.7970990TuffSlight
1025.8155.10.100.0029.5591090PyriteSlight
Table 4. Statistics results between the damage levels and the angle and lithology.
Damage LevelPyriteTuffAngle/0°Angle/90°
No damage1311519
Slight damage2123539
Moderate damage139319
Table 5. Statistical distribution parameter table of evaluation indicators for different damage levels.
Damage LevelStatistical ParametersAccumulated EventsAccumulated EnergyDistanceσa u ¯ DensityDepth
No damage
(n = 24)
Minimum value0024.95000559
Maximum value622.7175.22.130.0047.58909
Truncation mean1.434.588.870.420.00130.82650.9
Standard deviation1.725.8249.070.60.00141.97103.95
Slight damage
(n = 44)
Minimum value39.0821.240.010.0011.73558
Maximum value2340.8162.741.120.01419.78910
Truncation mean9.825.6758.850.520.00478.75730.49
Standard deviation2.965.6734.340.290.00273.54104.44
Moderate damage
(n = 22)
Minimum value828.820.110.030.0033.58609
Maximum value65192.7139.831.610.01934.63910
Truncation mean26.527953.910.690.006712.21797.32
Standard deviation19.3551.9329.50.390.00388.0573.46
Table 6. Numerical characteristics of the evaluation indexes at different damage levels.
Evaluation IndexesNumerical Characteristics (Expectation Ex, Entropy En, Hyper Entropy He)
No DamageSlight DamageModerate Damage
Angle(71.25, 37.21, 3.10)(79.77, 22.72, 17.85)(77.72, 26.57, 17.13)
Depth(659.27, 103.99, 0)(730.96, 105.85, 0)(793.64, 75.24, 0)
Lithology(1.45, 0.62, 0)(1.52, 0.63, 0)(1.4, 0.61, 0)
Distance(89.92, 52.85, 0)(62.00, 32.63, 10.69)(56.37, 26.86, 12.19)
Accumulated events(1.58, 1.58, 0.66)(10.18, 2.40, 1.42)(27.5, 20.57, 0)
Accumulated energy(5.14, 5.22, 2.58)(26.22, 4.93, 1.56)(82.05, 54.28, 0)
Event density(1.10, 1.75, 0.91)(9.05, 3.11, 1.55)(12.88, 7.16, 3.68)
Apparent stress(0.48, 0.53, 0.28)(0.52, 0.31, 0)(0.70, 0.36, 0.15)
Displacement(0.0013, 0.0016, 0)(0.0049, 0.0025, 0.00094)(0.0071, 0.0035, 0.0016)
Table 7. Eigenvalues of different damage levels by normalization processing.
Damage LevelExpectation ExEntropy EnHyper Entropy HeEigenvalues
No damage15.4618.191.081.00
Slight damage22.1712.842.781.43
Moderate damage38.0328.992.562.46
Table 8. Evaluation results of partial data samples in the Ashele Copper Mine.
Sample NumberComprehensive Membership Degree BFuzzy Entropy HMaximum Membership bComprehensive Evaluation Value p
No DamageSlight DamageModerate Damage
10.210.400.380.970.40 (Slight damage)1.73
20.590.150.250.870.59 (No damage)1.44
30.540.180.290.920.54 (No damage)1.49
40.240.200.560.910.56 (Moderate damage)1.90
50.180.440.380.950.44 (Slight damage)1.75
60.170.410.420.950.42 (Moderate damage)1.80
70.210.390.400.970.40 (Moderate damage)1.75
80.150.220.630.840.63 (Moderate damage)2.01
90.180.460.370.950.46 (Slight damage)1.73
100.190.460.340.960.46 (Slight damage)1.70
Table 9. Accuracy of the tunnel damage level by using different methods.
Damage LevelData CategoryResults by the Maximum Membership RuleResults by Comprehensive Application of the Maximum Membership Rule and the Comprehensive Evaluation Value
No DamageSlight DamageModerate DamageNo
Damage
Slight DamageModerate Damage
No damageModeling data (24)22112211
Test data (0)000000
Slight damageModeling data (44)130131349
Test data (4)040040
Moderate damageModeling data (22)01210121
Test data (6)006006
AccuracyModeling data81.1%86%
Test data100%100%
Note: Bold = the number of samples of correct evaluation results.
Publisher’s Note: MDPI stays neutral with regard to jurisdictional claims in published maps and institutional affiliations.

