1. Introduction
In the past, virtual reconstructions have been the subject of debates among archaeologists [
1,
2,
3,
4,
5] because they have two main critical points: (1) they risk conveying the wrong message, namely that the reconstruction is the truth instead of one of the possible interpretations of the past; (2) they risk becoming a “black box” [
6] (p. 105) where the sources and interpretative reasoning are not declared nor available both to the scientific community and to users. Despite prudence and criticisms, many benefits have been considered by the scientific community, considering virtual reconstruction as not just a mere visualisation but as a scientific tool with great cognitive value, since it facilitates the management and understanding of complex information thanks to 3D simulations [
7,
8,
9]. After years of scientific debates, the introduction of internationally valid principles about the computer-based visualisation of Cultural Heritage (London Charter and Principles of Sevilla), have effectively oriented the scientific discussion with the aim of overcoming the initial concerns [
10,
11]. Following these regulations, virtual reconstructions are designed following accurate workflow of analysis and interpretation of data and results are no longer presented as peremptory. However, the question of data management remains open. Although imprecision and subjectivity are mitigated using structured metadata and paradata [
12], these are not always easily accessible outside the research laboratories. Furthermore, there are not yet universally accepted methods and tools to manage data and paradata and to display uncertainty and conflicting or alternative 3D reconstructions [
13].
The five-step method presented in this article is conceived to overcome such issues and use a 3D simulation tool based on the Extended Matrix (EM) [
14,
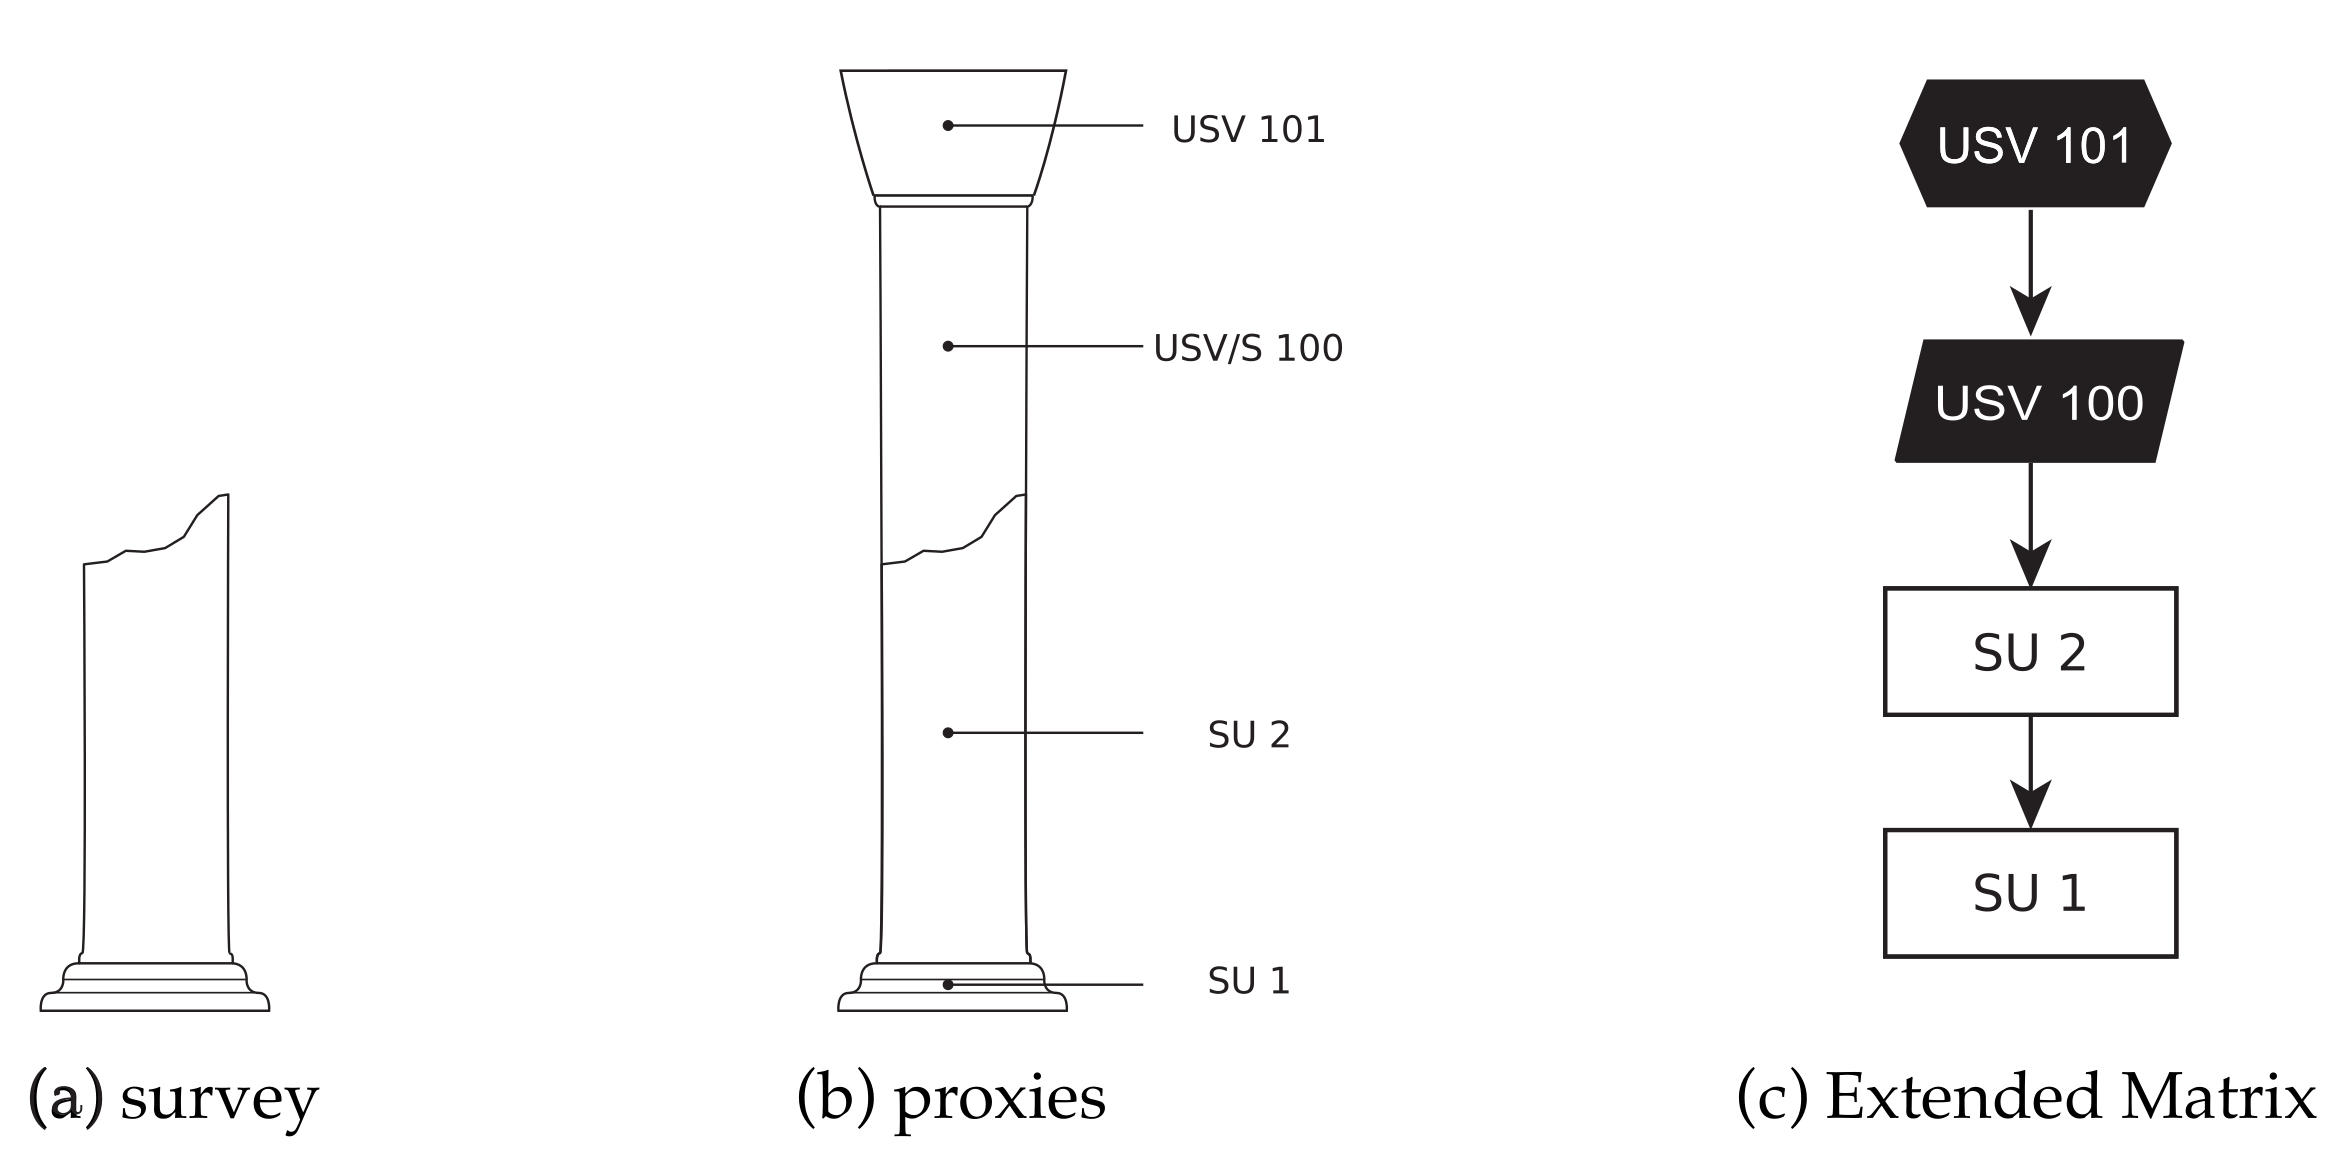
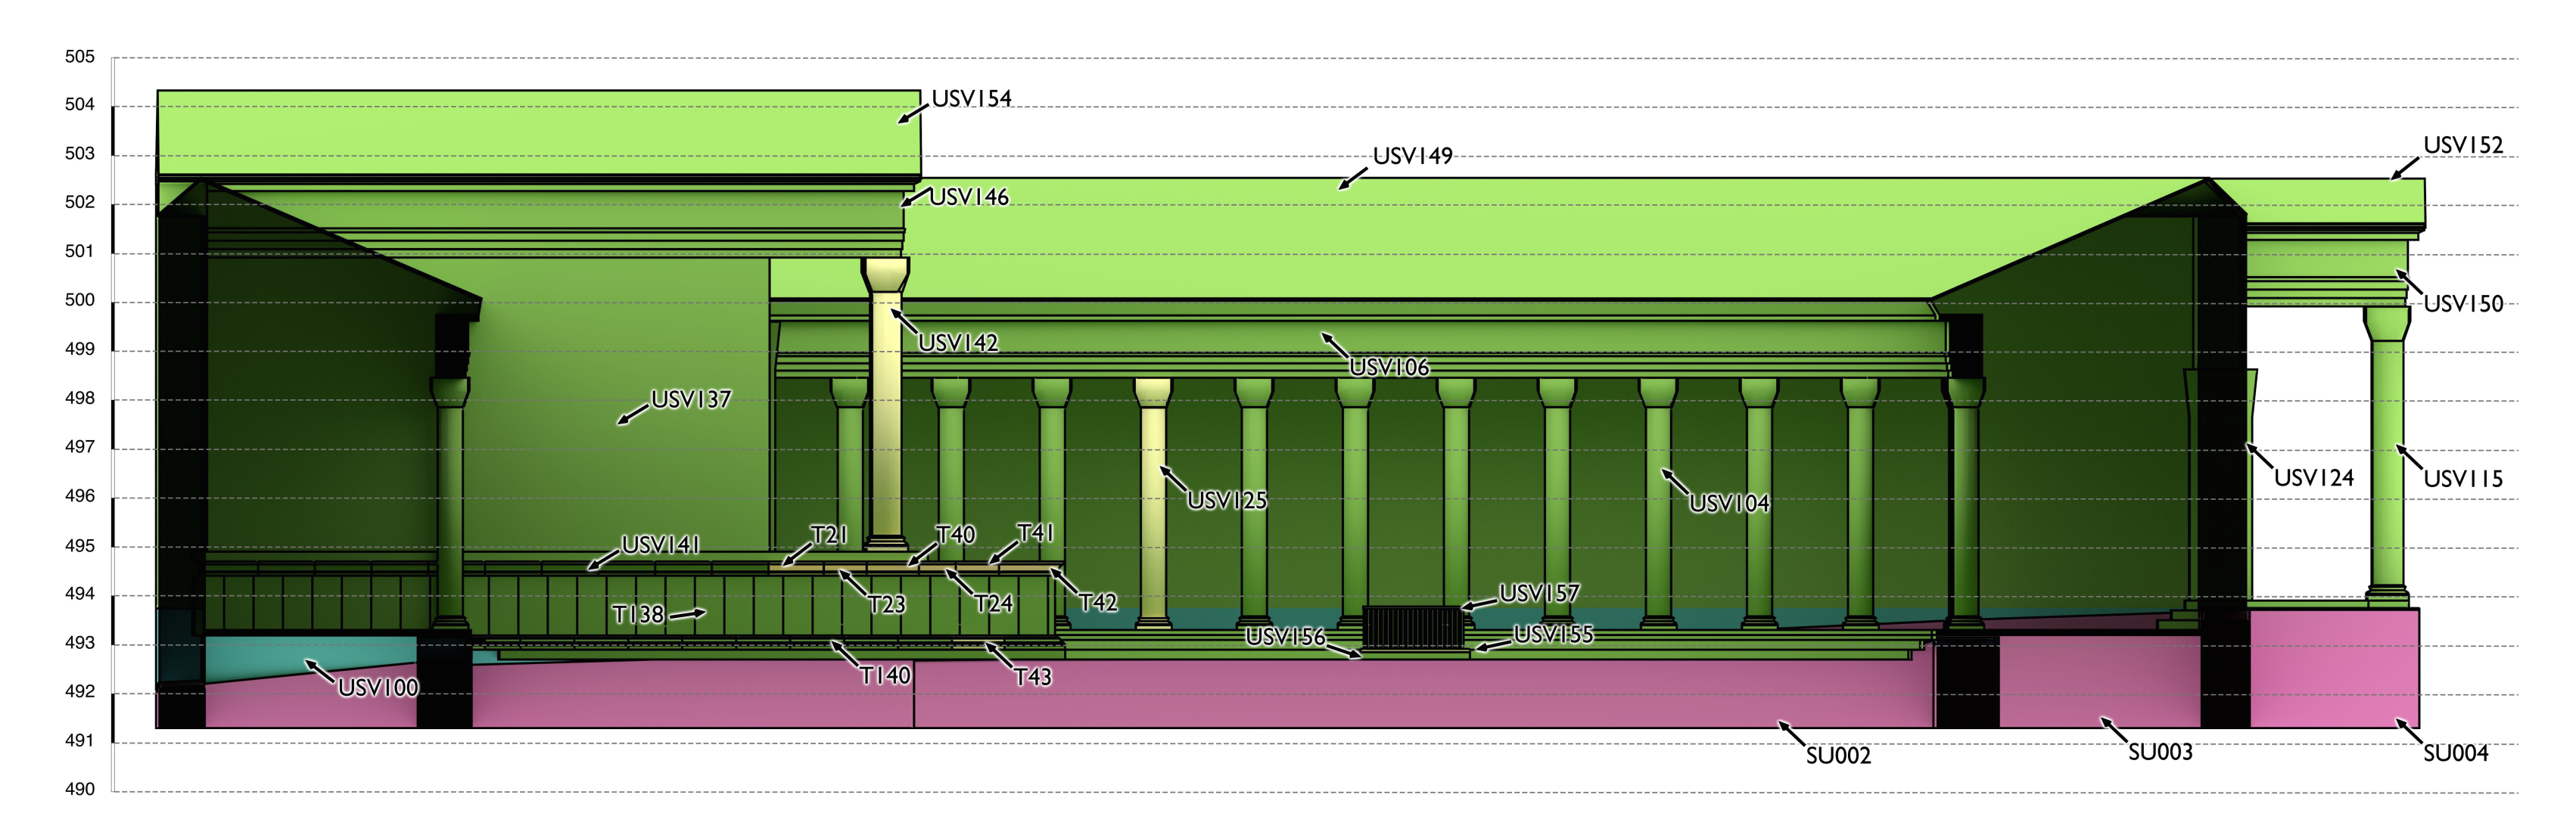
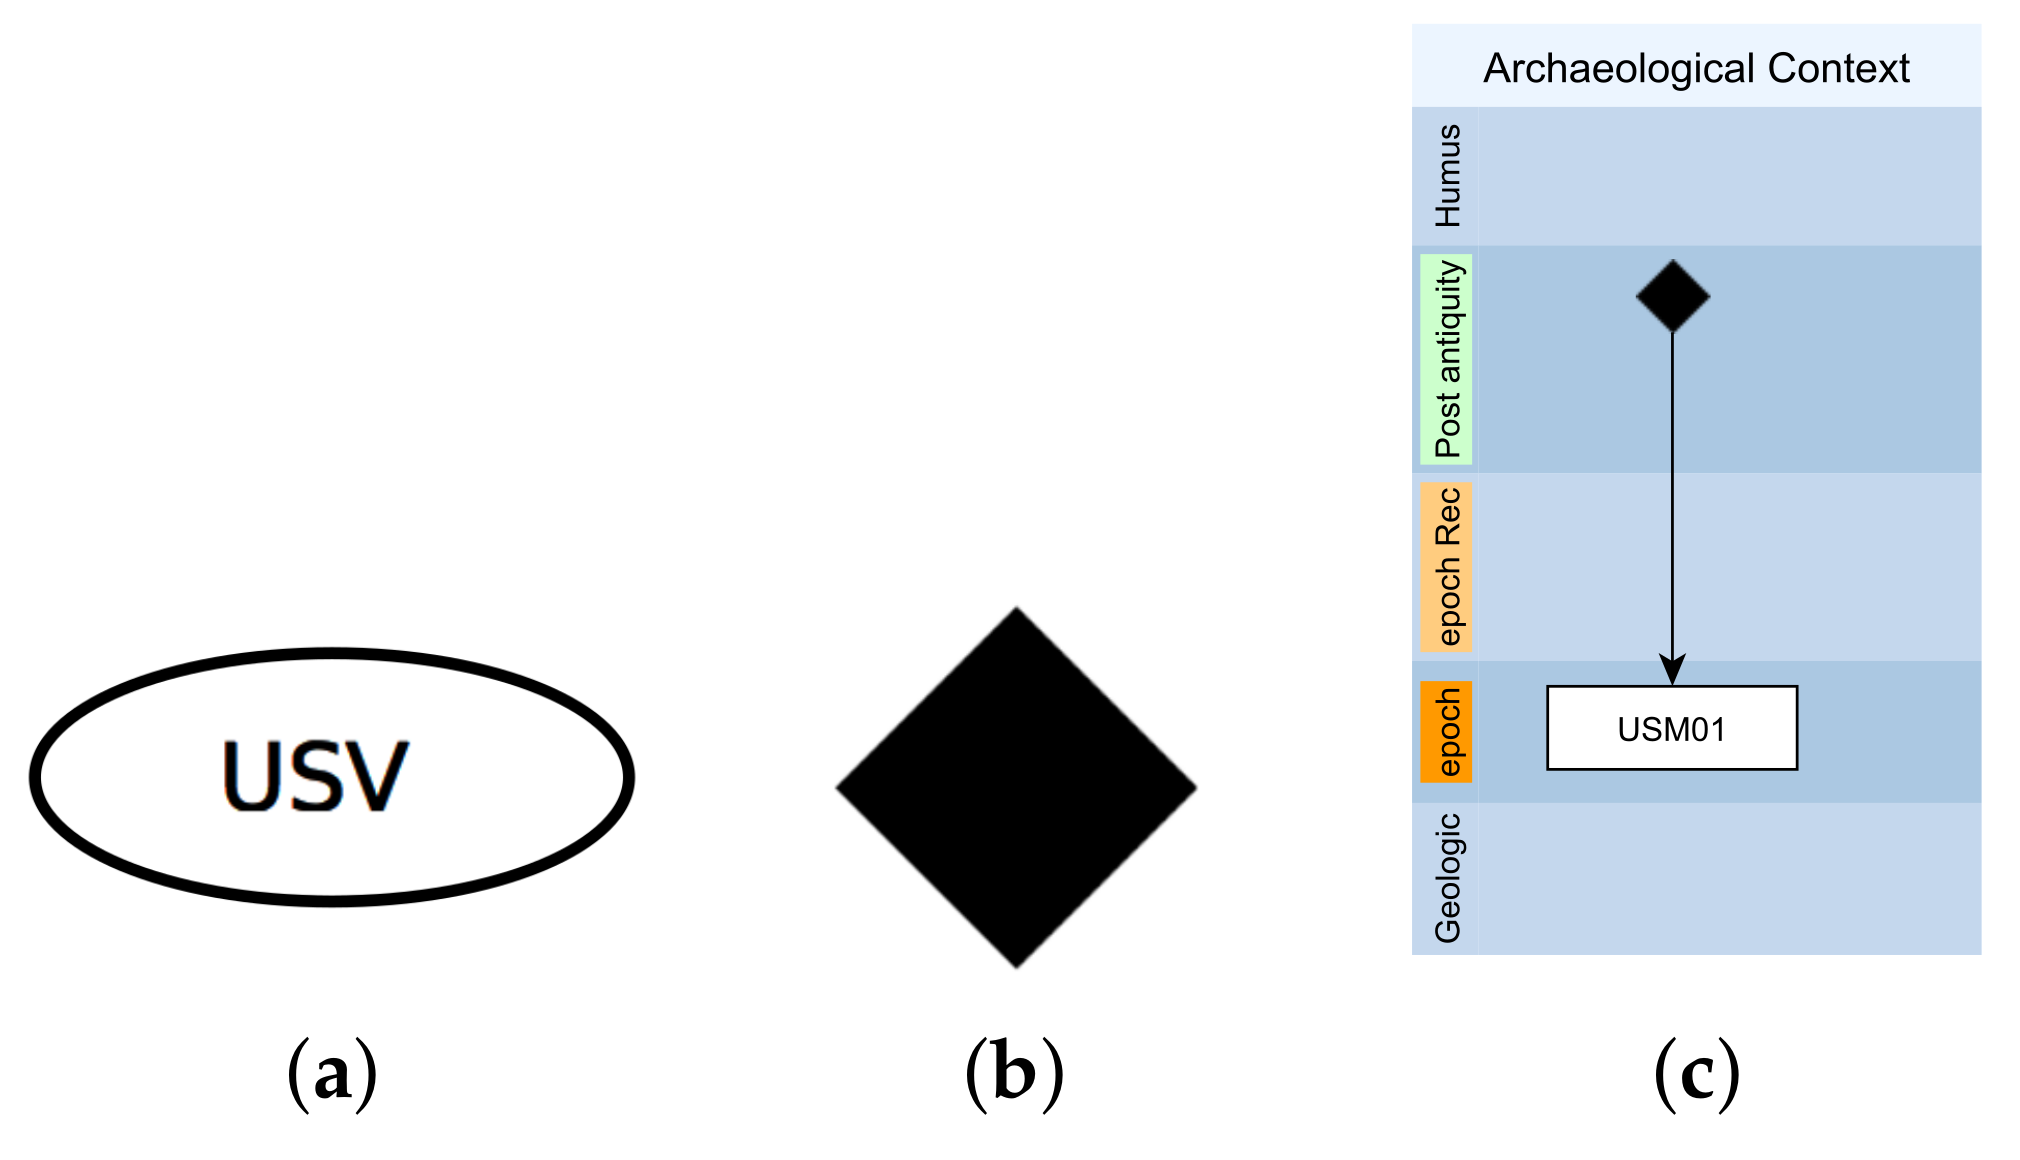
15], to answer precise archaeological questions that could arise during the analysis, synthesis and interpretation of a site. EM is a visual node-based formal language grounded on a stratigraphic approach designed for virtual archaeology and on the theory of knowledge graphs. The term ”extended” highlights that it includes and defines not only archaeological stratifications (SU) but also their hypothetical reconstructions (Virtual Stratigraphic Unit—USV, see
Figure 1). Given that, within a EM standardised ”five steps” methodology, it is possible to account, using a graph database connected to a 3D environment, all the relevant sources (data) and the logical-interpretative processes of analysis and synthesis (paradata) that have led from archaeological evidence to the reconstructive hypothesis.
The EM approach is part of a more general trend towards information management based on knowledge networks (graphs) expressed through data triplets (node, arc, node), oriented to convey the interconnection between the elements, and recorded within a graph database [
16]. Although international standards in the Cultural Heritage domain such as CIDOC-CRM or operational tools such as the Matrix are based on information triplets, graph databases are still poorly adopted in favour of “traditional” table-based databases. Thus, an EM is a knowledge graph intended to explicitly represent properties like the chronological extension by means of graphical conventions (y axis = time, black lines = stratigraphic relations, dotted lines = data provenance, etc.).
In recent years, several case studies [
17,
18,
19,
20,
21,
22,
23] have used the Extended Matrix methodology offering important test-beds to validate the theoretical framework (EM, [
14]), the formal tools (USVs [
14], proxies [
15]), and its digital ecosystem framework (Extended Matrix Framework—EMF [
15]).
Section 2 offers the result of this process of maturation as a standardised five step process that, in turn, allows to address several main issues related to the virtual reconstruction process as in
Section 3 will be discussed. In
Section 4 a selection of EM-based case studies that allowed the tool to be enriched with new features, both in terms of method and formal language and in terms of software solutions will be presented. Thus, these projects led to the definition of the version 1.2 of the EM (see
infra Section 5.1) and EMF (see
infra Section 5.2) whose change-log compared to version 1.1 [
15] will be described.
2. Results: A Standardised ”Five Steps” Protocol
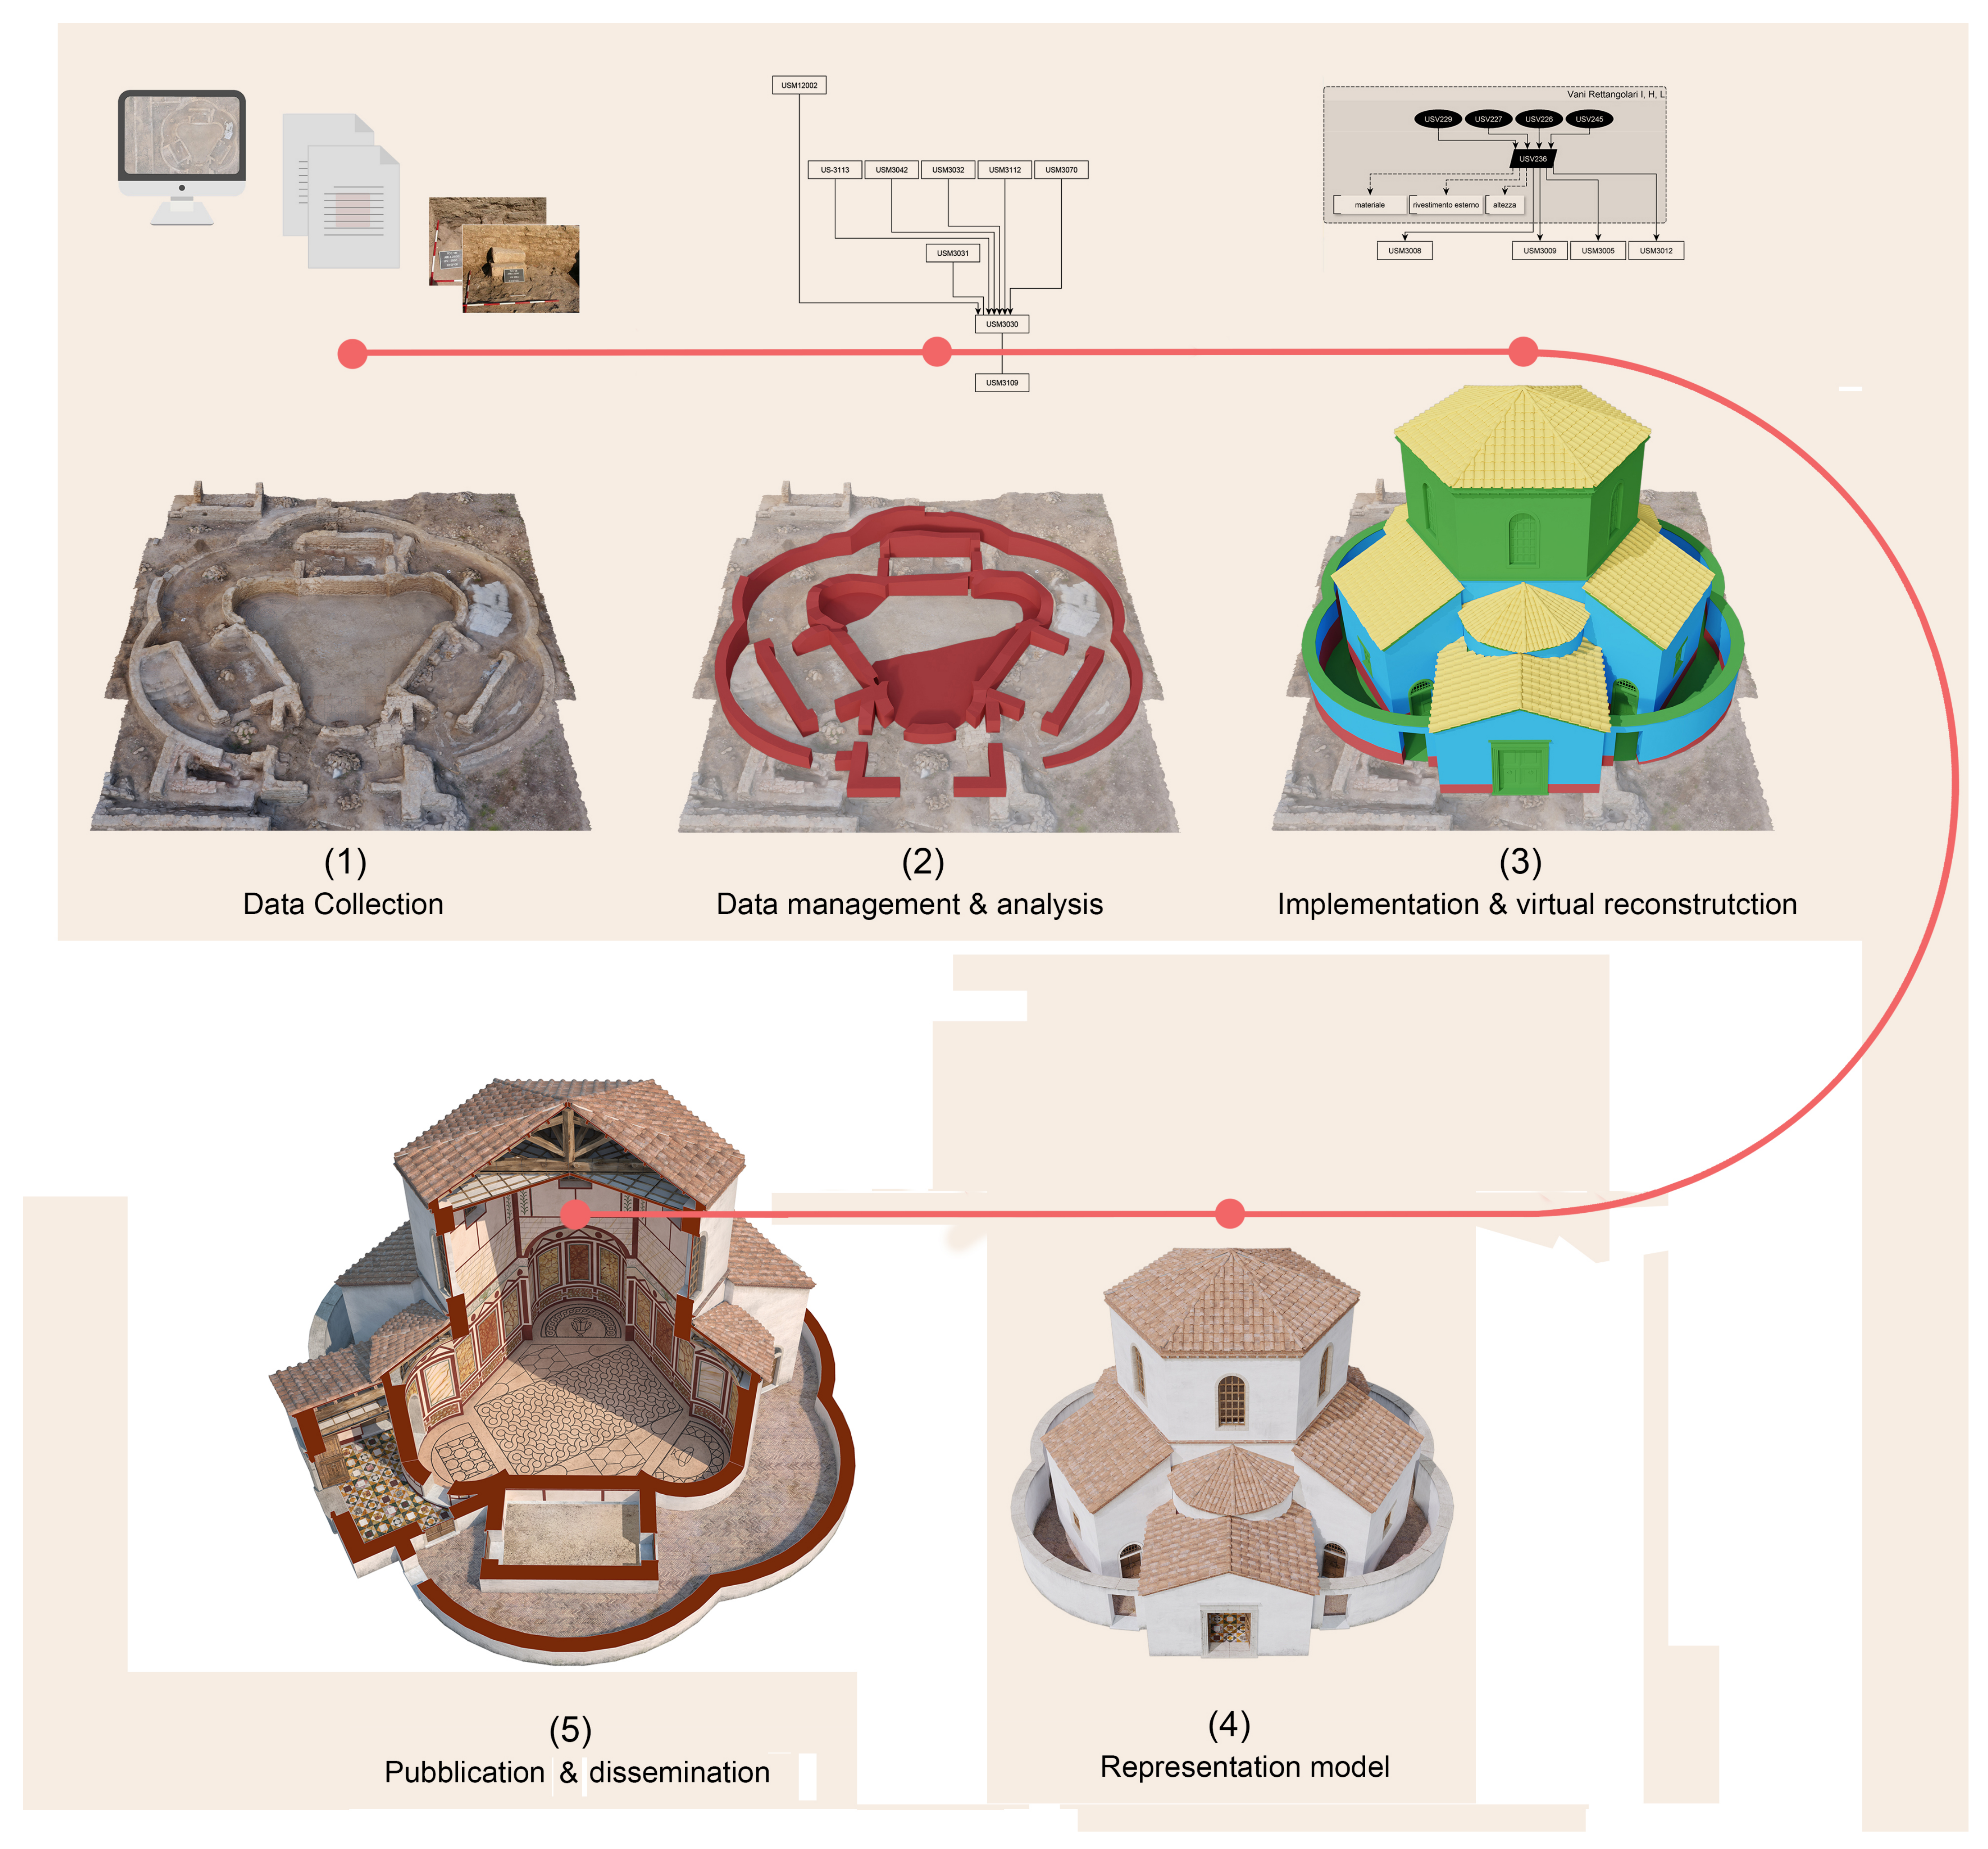
The objective of this section is to arrange a validated reference work with instructions and ready-to-use references to consciously setup a project of virtual reconstruction based on the EM five steps method (see
Figure 2).
During the description of the five steps, practical examples of applied EM methods and techniques drawn from real case studies (see
infra Section 4) will be mentioned. Information formalisation tools (Extended Matrix) and open source software tools (Extended Matrix Framework), developed to facilitate their use during the production of a reconstructive hypothesis, will be discussed in the different steps. These tools will be discussed in detail in
Section 5.1 and
Section 5.2.
2.1. Data Collection (1/5)
The reconstructive process begins with the study of the archaeological and historical context (see
Figure 2) through excavation, source collection, survey, and digitisation. Comparisons with similar contexts, belonging to the same geographical area and historical period, are a valid reference for the reconstruction. In this phase it is important to pay particular attention to the visual quality of the models representing the real data (obtained using digitization technique such as laser scanning or photogrammetry) as this has an important influence on the richness of the information available for the reconstructive hypothesis. The model should be a
digital replica [
24] (a model with a high visual resolution suitable for real-time simulation) allowing the relevant elements of the original context to be clearly perceived and recognised (e.g., colour, shape, dimensions). In other words, the reliability of archaeological interpretations is strongly influenced by the meticulousness of the work of collecting and managing archaeological records and data. According to the third principle of the London Charter in fact, ”
in order to ensure the intellectual integrity of computer-based visualisation methods and outcomes, relevant research sources should be identified and evaluated in a structured and documented way” [
10]. All the archaeological reports must be kept into account before designing a reconstructive hypothesis, however, being the remains insufficient to reconstruct an entire context, other fundamental sources should be examined and used to improve the quality of the work and mitigate the ”shadow area”:
digital replica of archaeological site (3D survey techniques such as photogrammetry or laser scanners are fundamental to obtain accurate metric documentation and effective digital models);
photographic documentation and excavation reports;
historical documentation and testimonies (including historical paintings and designs, archive photographs, cadastral map, archives, registers, deeds, etc.);
architectural studies on ancient buildings, architectural styles, theoretical rules of construction, theory of proportions and modules;
structural analyses and simulations;
dating and archaeometric analyses;
comparison with other buildings still preserved and showing similar stylistic, structural or functional solutions.
The information collected should be stored in a list of sources (see infra Table 2) and provided with an identifier. In the EM 1.2 this identifier consists of a ”D” (which stands for ”document”) followed by a dot and an incremental number (D.01, D.02,…, D.n).
This data structure will make it easy to collect information (from physical libraries or online database) and to reuse it in the Extended Matrix. A ”key” field, to be filled in, is ”properties”: here, specific features, obtained from the source and testifying useful information for the reconstruction (such as shape, colour, dimension, function, style, etc.), are annotated.
This is a fundamental step that lays the foundations for the subsequent interpretative work. The right amount of time should be allocated to this phase, bearing in mind that the whole process is iterative and going back and add sources to the list is always possible (the Extended Matrix is conceived to assist users to develop interpretative hypotheses within a ”non-destructive” expert system in which it is possible to modify the information involved in the different phases).
2.2. Data Management and Analysis (2/5)
The second step (see
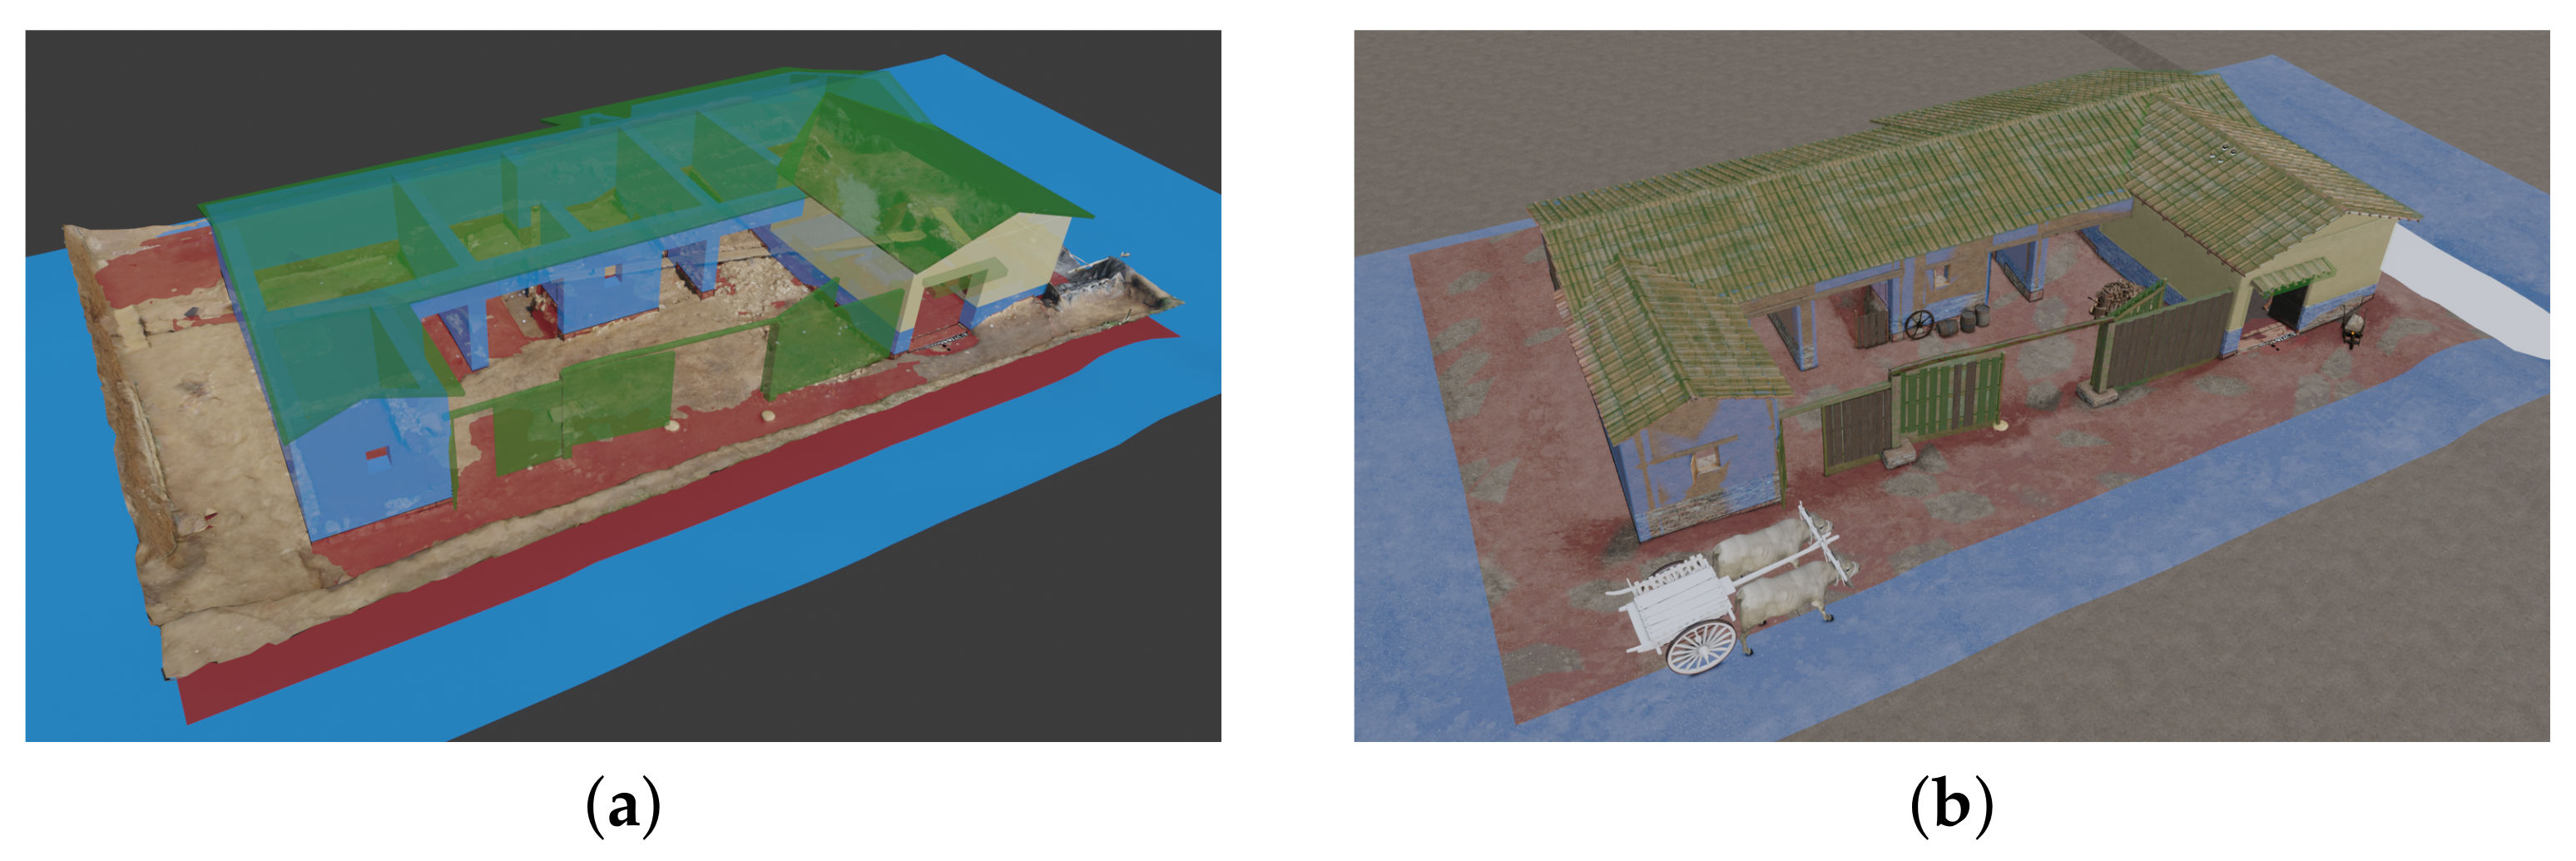
Figure 2) concerns the stratigraphic analysis and annotation of the physical remains discovered in the archaeological context and their 3D visualisation within a virtual environment by means of proxy models. A proxy model is a simplified geometric representation of a stratigraphic unit (SU) (see
Figure 2 (Subfigures 2 and 3)): as an example, the proxy of a column is a low-polygon cylinder mesh. The creation of the proxy model is performed as follow: firstly, the stratigraphic sequence (containing all the SU identified in the archaeological context) is drawn following the Matrix system proposed by Harris [
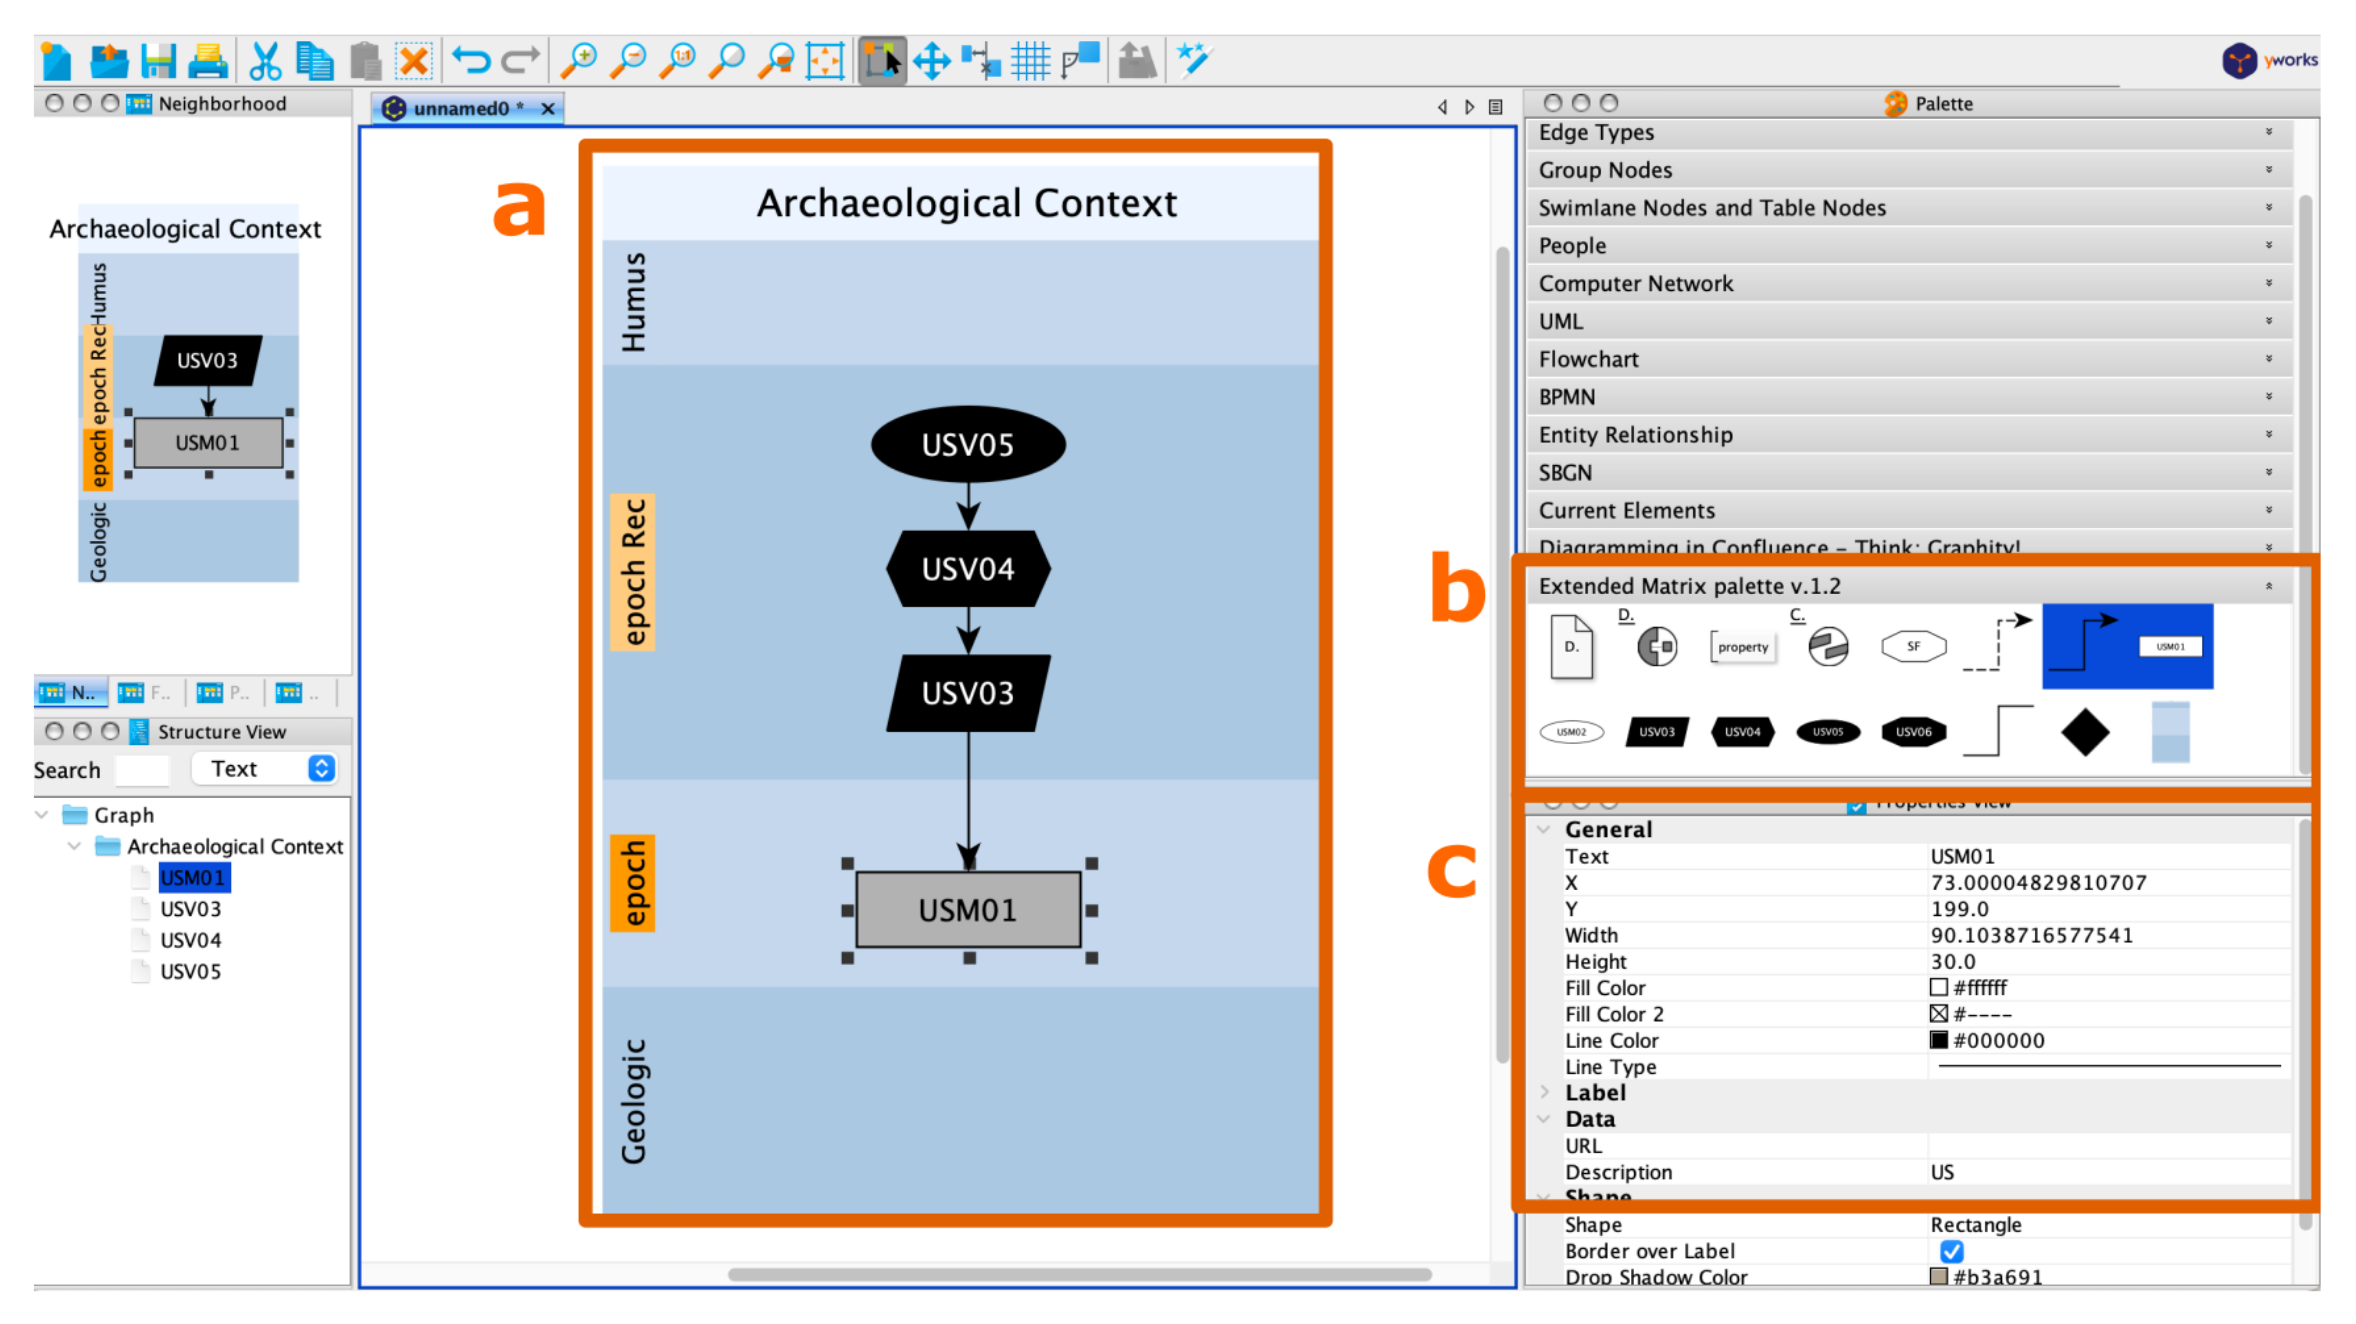
25] in order to support the analysis and to give an overview of the chronological relationships between the building elements. The stratigraphic sequence is structured within a graph database as nodes connected to each other by lines expressing relative chronological relationships. In the EMF 1.2, the yEd graph editor and an ISO standard XML GraphML format is used. In yEd, the SU are arranged within chronological periods possibly grouped into activities as happens in the classic Matrix of Harris.
Finally, the proxies are modelled within a virtual environment, using the digital replica as reference to sketch the volume, and linked to the graph database through the EMtools [
26] add-on (see
infra Section 5.2) in order to retrieve relevant information.
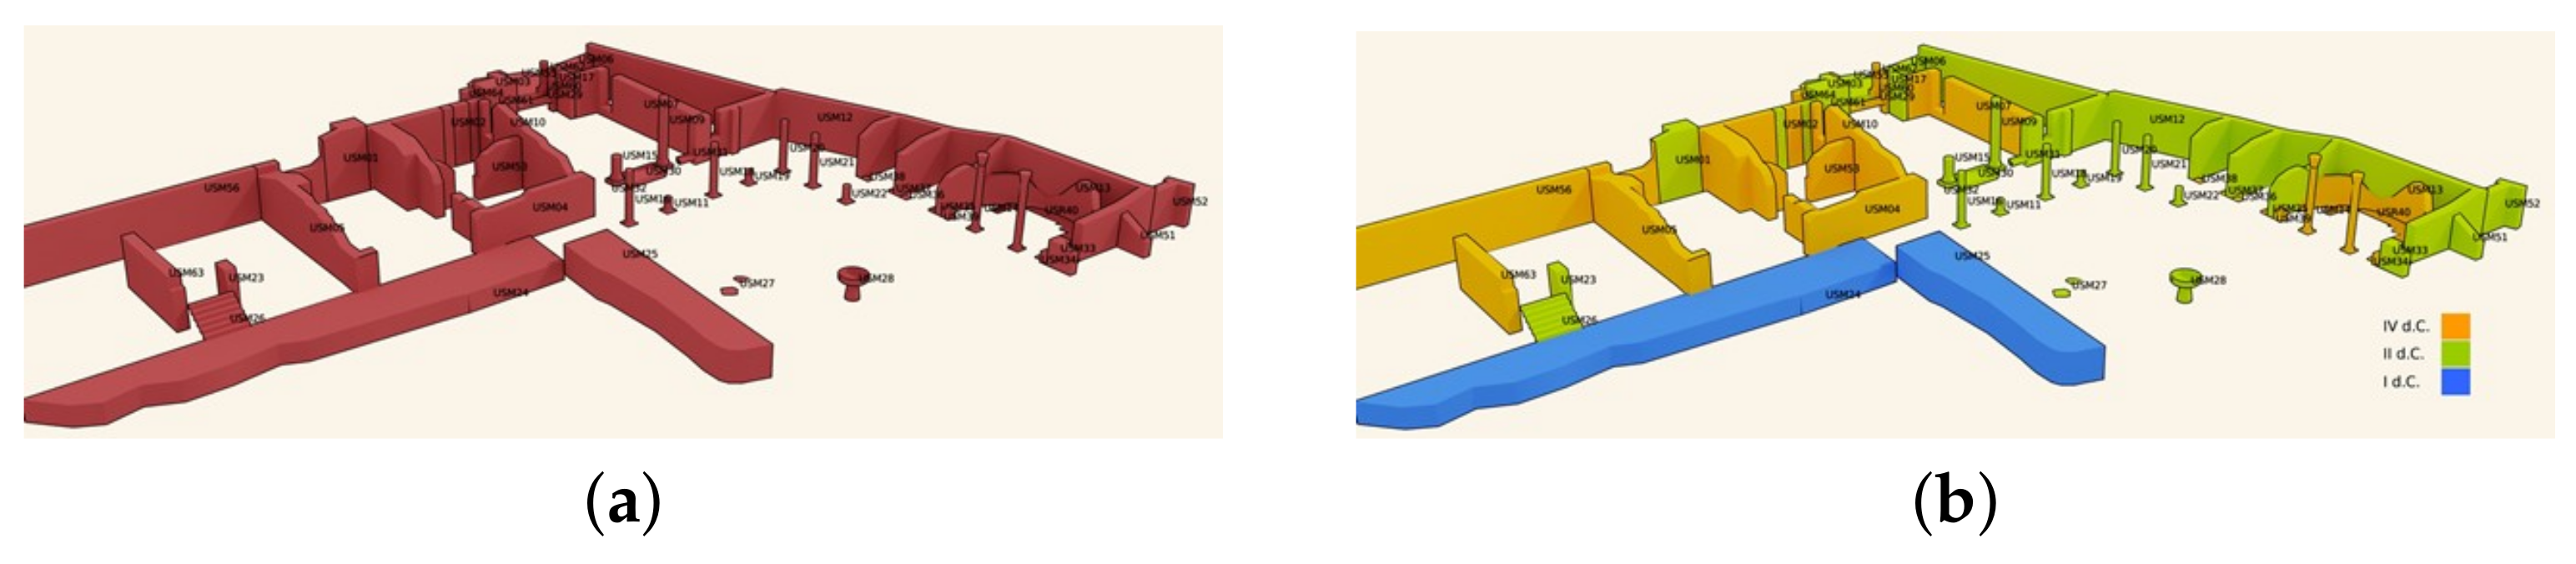
As an example, in the Porta Marina case study (see
infra Section 4.7) the stratigraphy of the remains is represented through the EMtools software as proxies using different color schema: EM and chronological (see
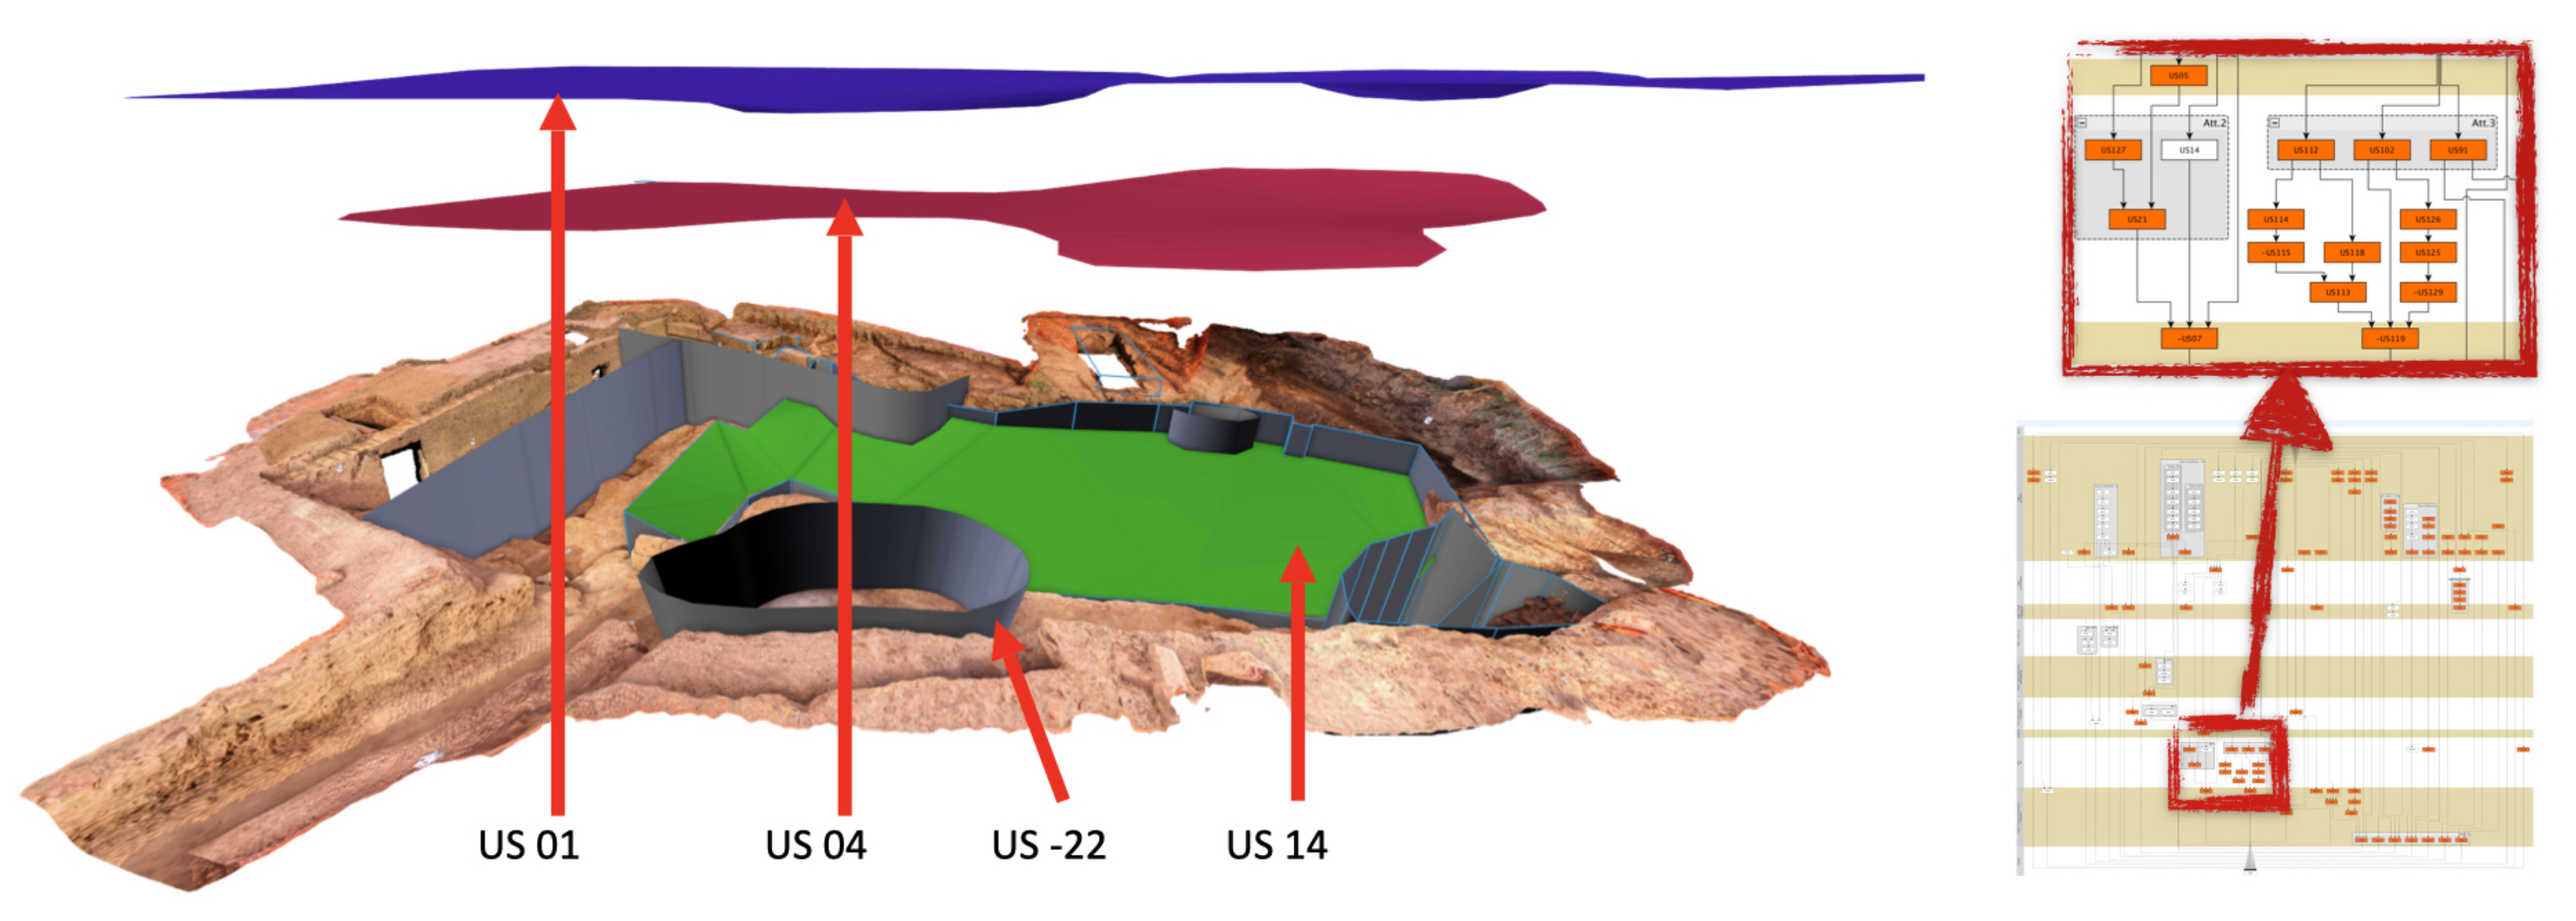
infra Figure 13a,b). In the Onde Marine case study, the proxy representation of the stratigraphy (see
infra Figure 5), related to the remains discovered during the archaeological excavation, allow a deeper understanding of the site evolution to be perceived.
In all the case studies in
Section 4, a reality based model was used as a reference to model the proxies related to the extant structures. In this way, for all the SU, chronological and physical relationship together with descriptive information, are connected to the digital replica by means of proxies.
2.3. Interpretation and Virtual Reconstruction (3/5)
In the third step (see
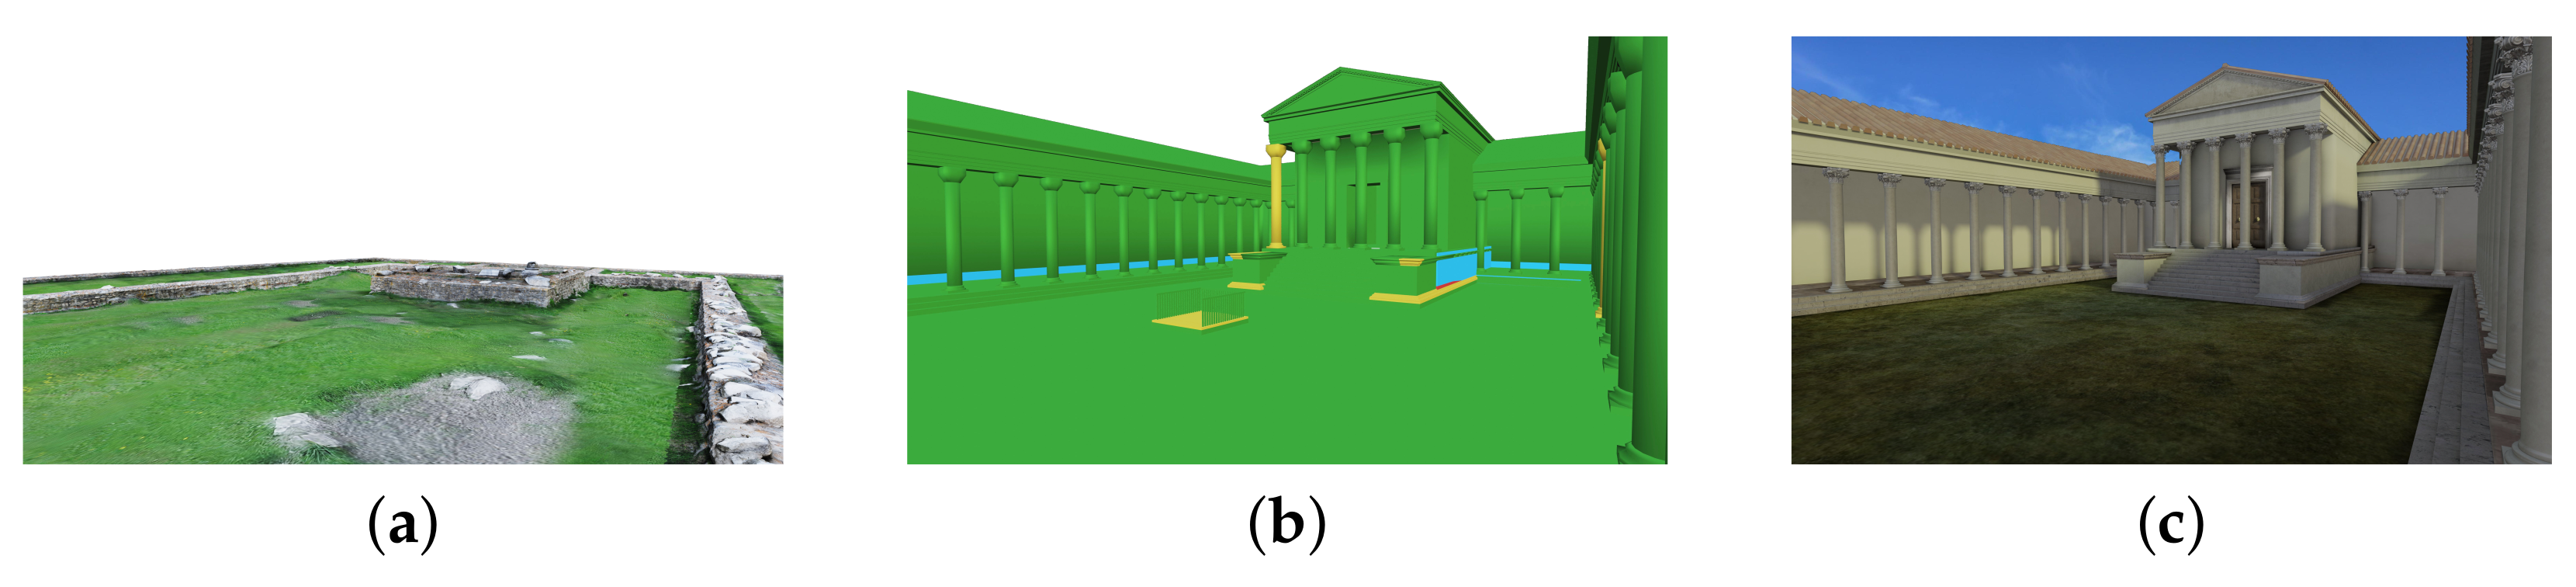
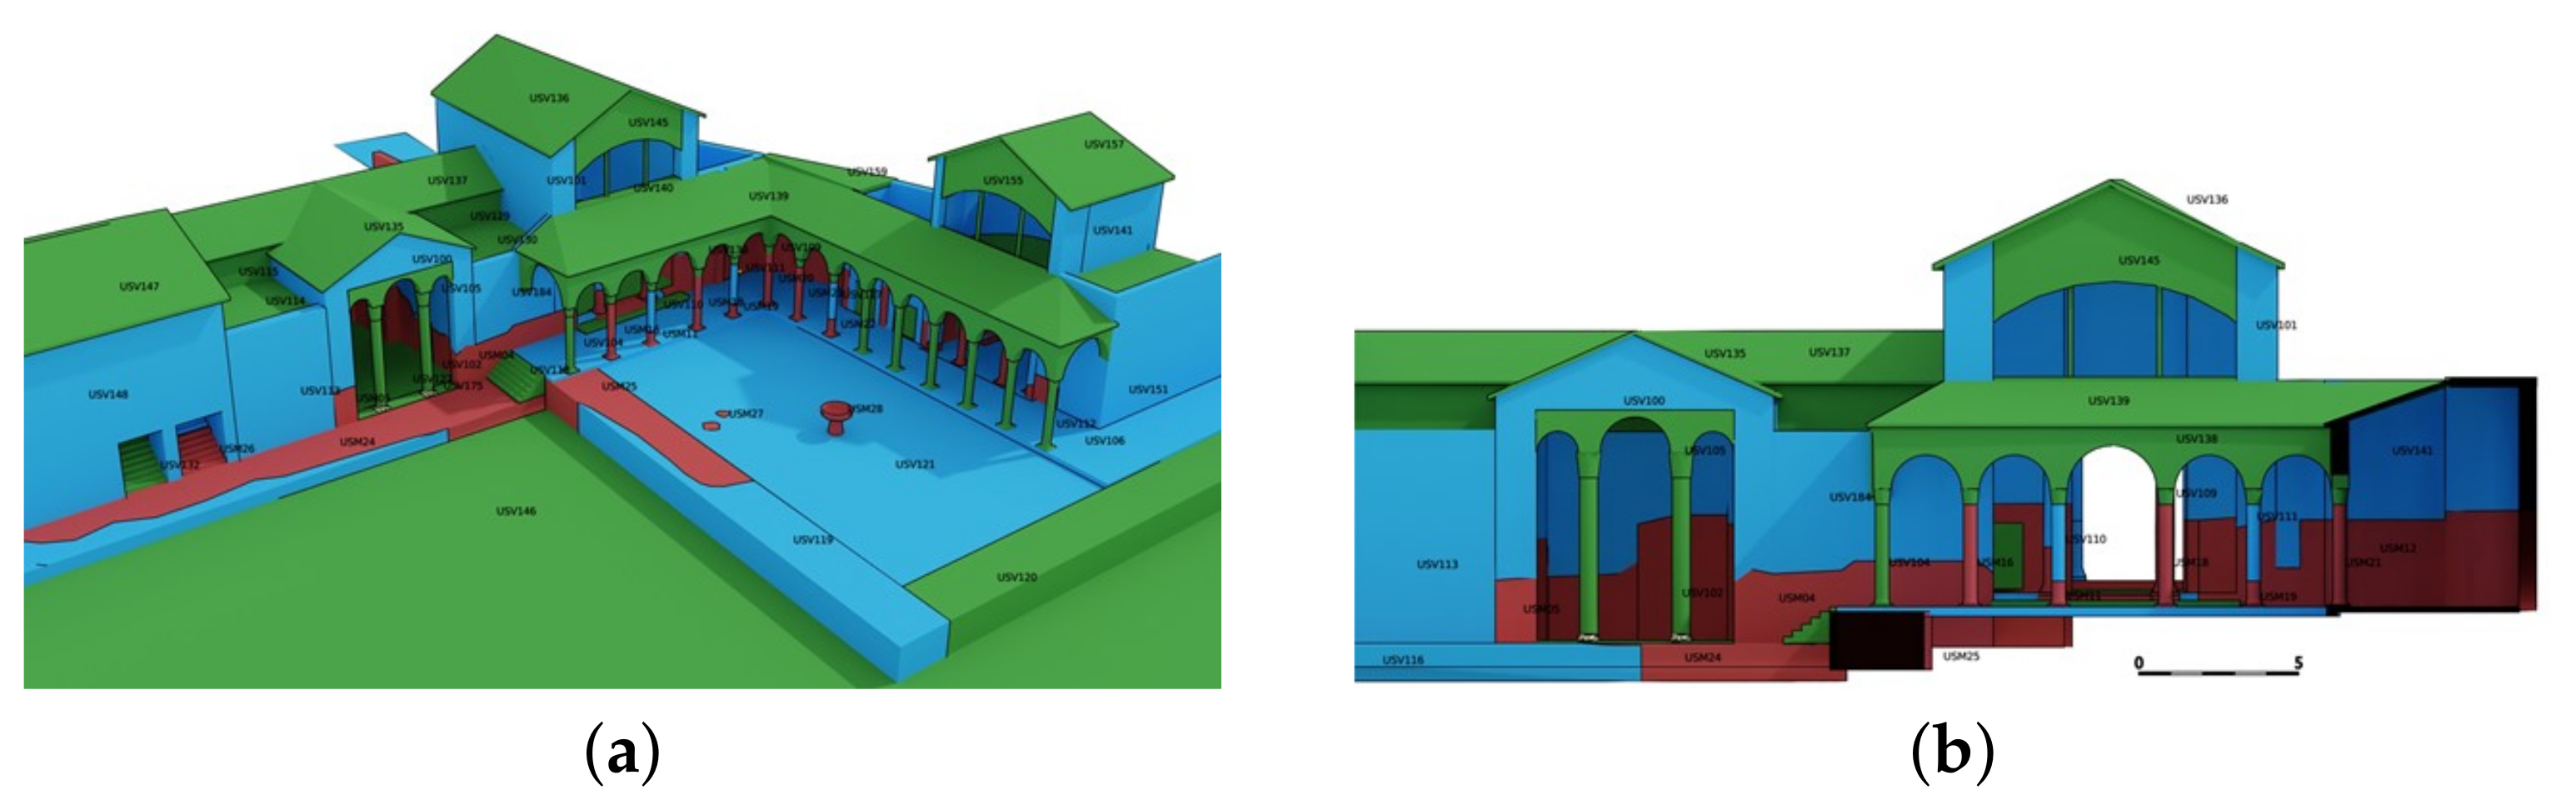
Figure 2-subfigure 3) one or more virtual reconstructive hypotheses of the archaeological context are proposed within the EM graph (using yEd) along with their representation by means of proxies. The process is similar to the previous step 3 but, in this case, the potential (virtual) stratigraphy belonging to the reconstructive hypothesis is also formalised: for each USV in the EM graph, a proxy model is provided. This process is not one-way: it is an iterative process of hypothesis making and visualisation (the EMtools simplifies this task through a ”hot reload” function of the GraphML inside Blender). During this operation a report of virtual activities, representing a textual discursive version concerning the reconstructive hypothesis, is drawn up (it is divided according to the supposed evolution/construction phases of the archaeological context). At the end of this step, a 3D proxy model representing the reconstruction hypothesis is available for a review by experts outside the team for validation and discussion. Thus, it allows to visualise and query the extended matrices containing excavation information and the sources used in the reconstructive process. Indeed when the proxy model and the EM are connected in the Blender software, a conceptual visualisation using different colour coding is provided showing different levels of certainty (that a given element existed in the past) according to archaeological evidences (see
infra colour chart in Table 3). The colours distinguish extant structures (red) from their completion and hypothetical reconstruction (blue); repositioned fragments (dark yellow) form their hypothetical completion (light yellow). The green colour finally refers to all those parts for which we have no structural or archaeological evidences, but their reconstruction is entrusted to stylistic comparisons or interpreted sources.
2.4. Representation Model (4/5)
In the fourth step (see
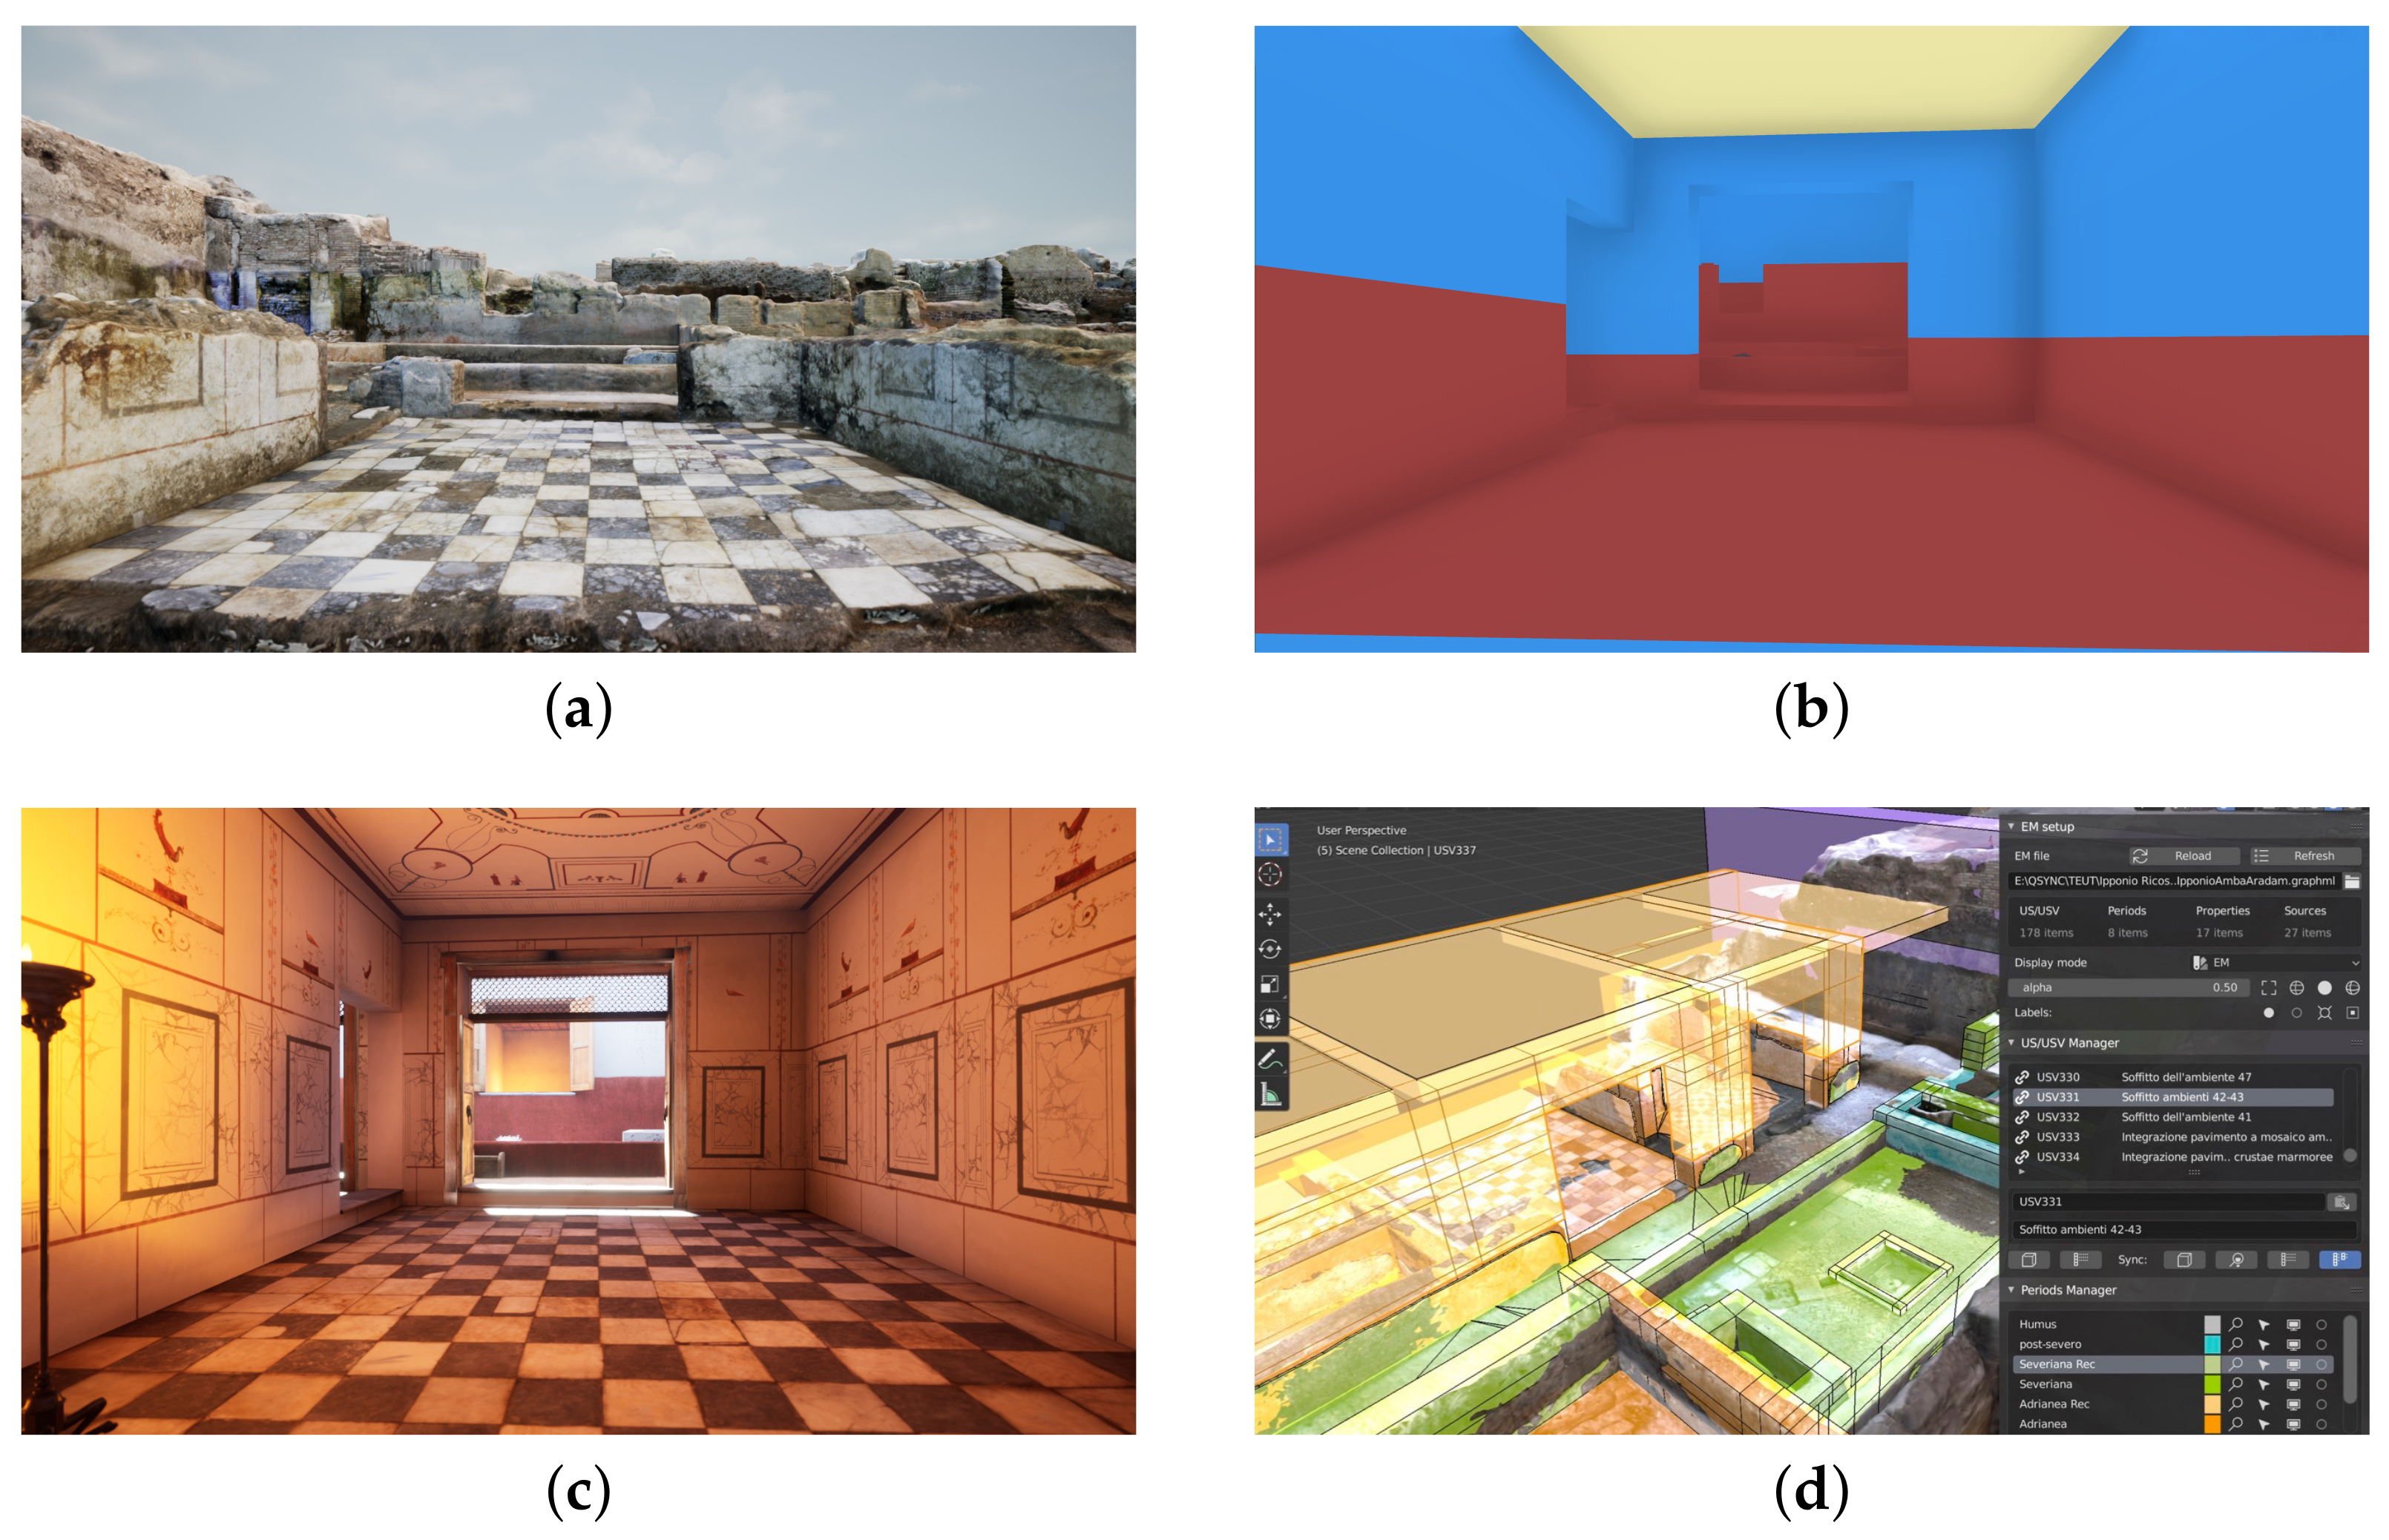
Figure 2-subfigure 4), once the reconstruction has been validated, a detailed model including materials and textures, the so-called ”representation model” (RM), is performed for each of the phases of life of the context to be reconstructed. In the Amba Aradam case study, the RM (see
infra Figure 8c) has been modelled in Blender retrieving the relevant properties (materials, references etc… that were previously stored in the EM graph in the step 3) through the
paradata manager and the
sources manager of the EMtools (see
infra Figure 18). This task can be assigned to a senior 3D modeller that can access in a convenient way to the complete reconstructive record within the 3D modelling software. The ”hot reload” function of the GraphML file (the graph database) in Blender enables fast update of the properties making it possible a tighter collaboration between experts involved in step 3 and step 4.
Making the RM, the reconstruction is designed in detail on top of the digital replica and inherits its volumes, measures and proportions allowing great accuracy and control during the modelling processes.
Among the advantages of separating the two views (proxy and RM) is the fact that the ethical issues related to the completeness of the reconstructive record are mitigated by the opportunity to visualise the site even only with proxies (conceptual reconstruction). Other benefits of this division are well known in literature [
27] and already explained in the version 1.1 of the EM [
15].
It is noteworthy that in the case of Ostia (see
infra Section 4.7) the reconstruction stopped at the creation of the proxies to allow the project partners to work on the RM model independently in the future.
2.5. Publication and Digital Dissemination (5/5)
Within a ”traditional” approach to virtual reconstruction, the creation of the metadata formalising the process and the effort devoted to dissemination and publication are tasks normally carried out at the end of the project leading to a number of drawbacks: on the one hand, these actions sometimes require extra budgets that have not been properly estimated and, on the other hand, there is a real risk of losing track of the reasons that led to certain interpretations and of having an incomplete list of employed sources.
An EM data-set instead, for its very nature, enables the possibility to publish a complete reconstructive record through standardised outputs. Although the entire workflow is based on an open source framework (see
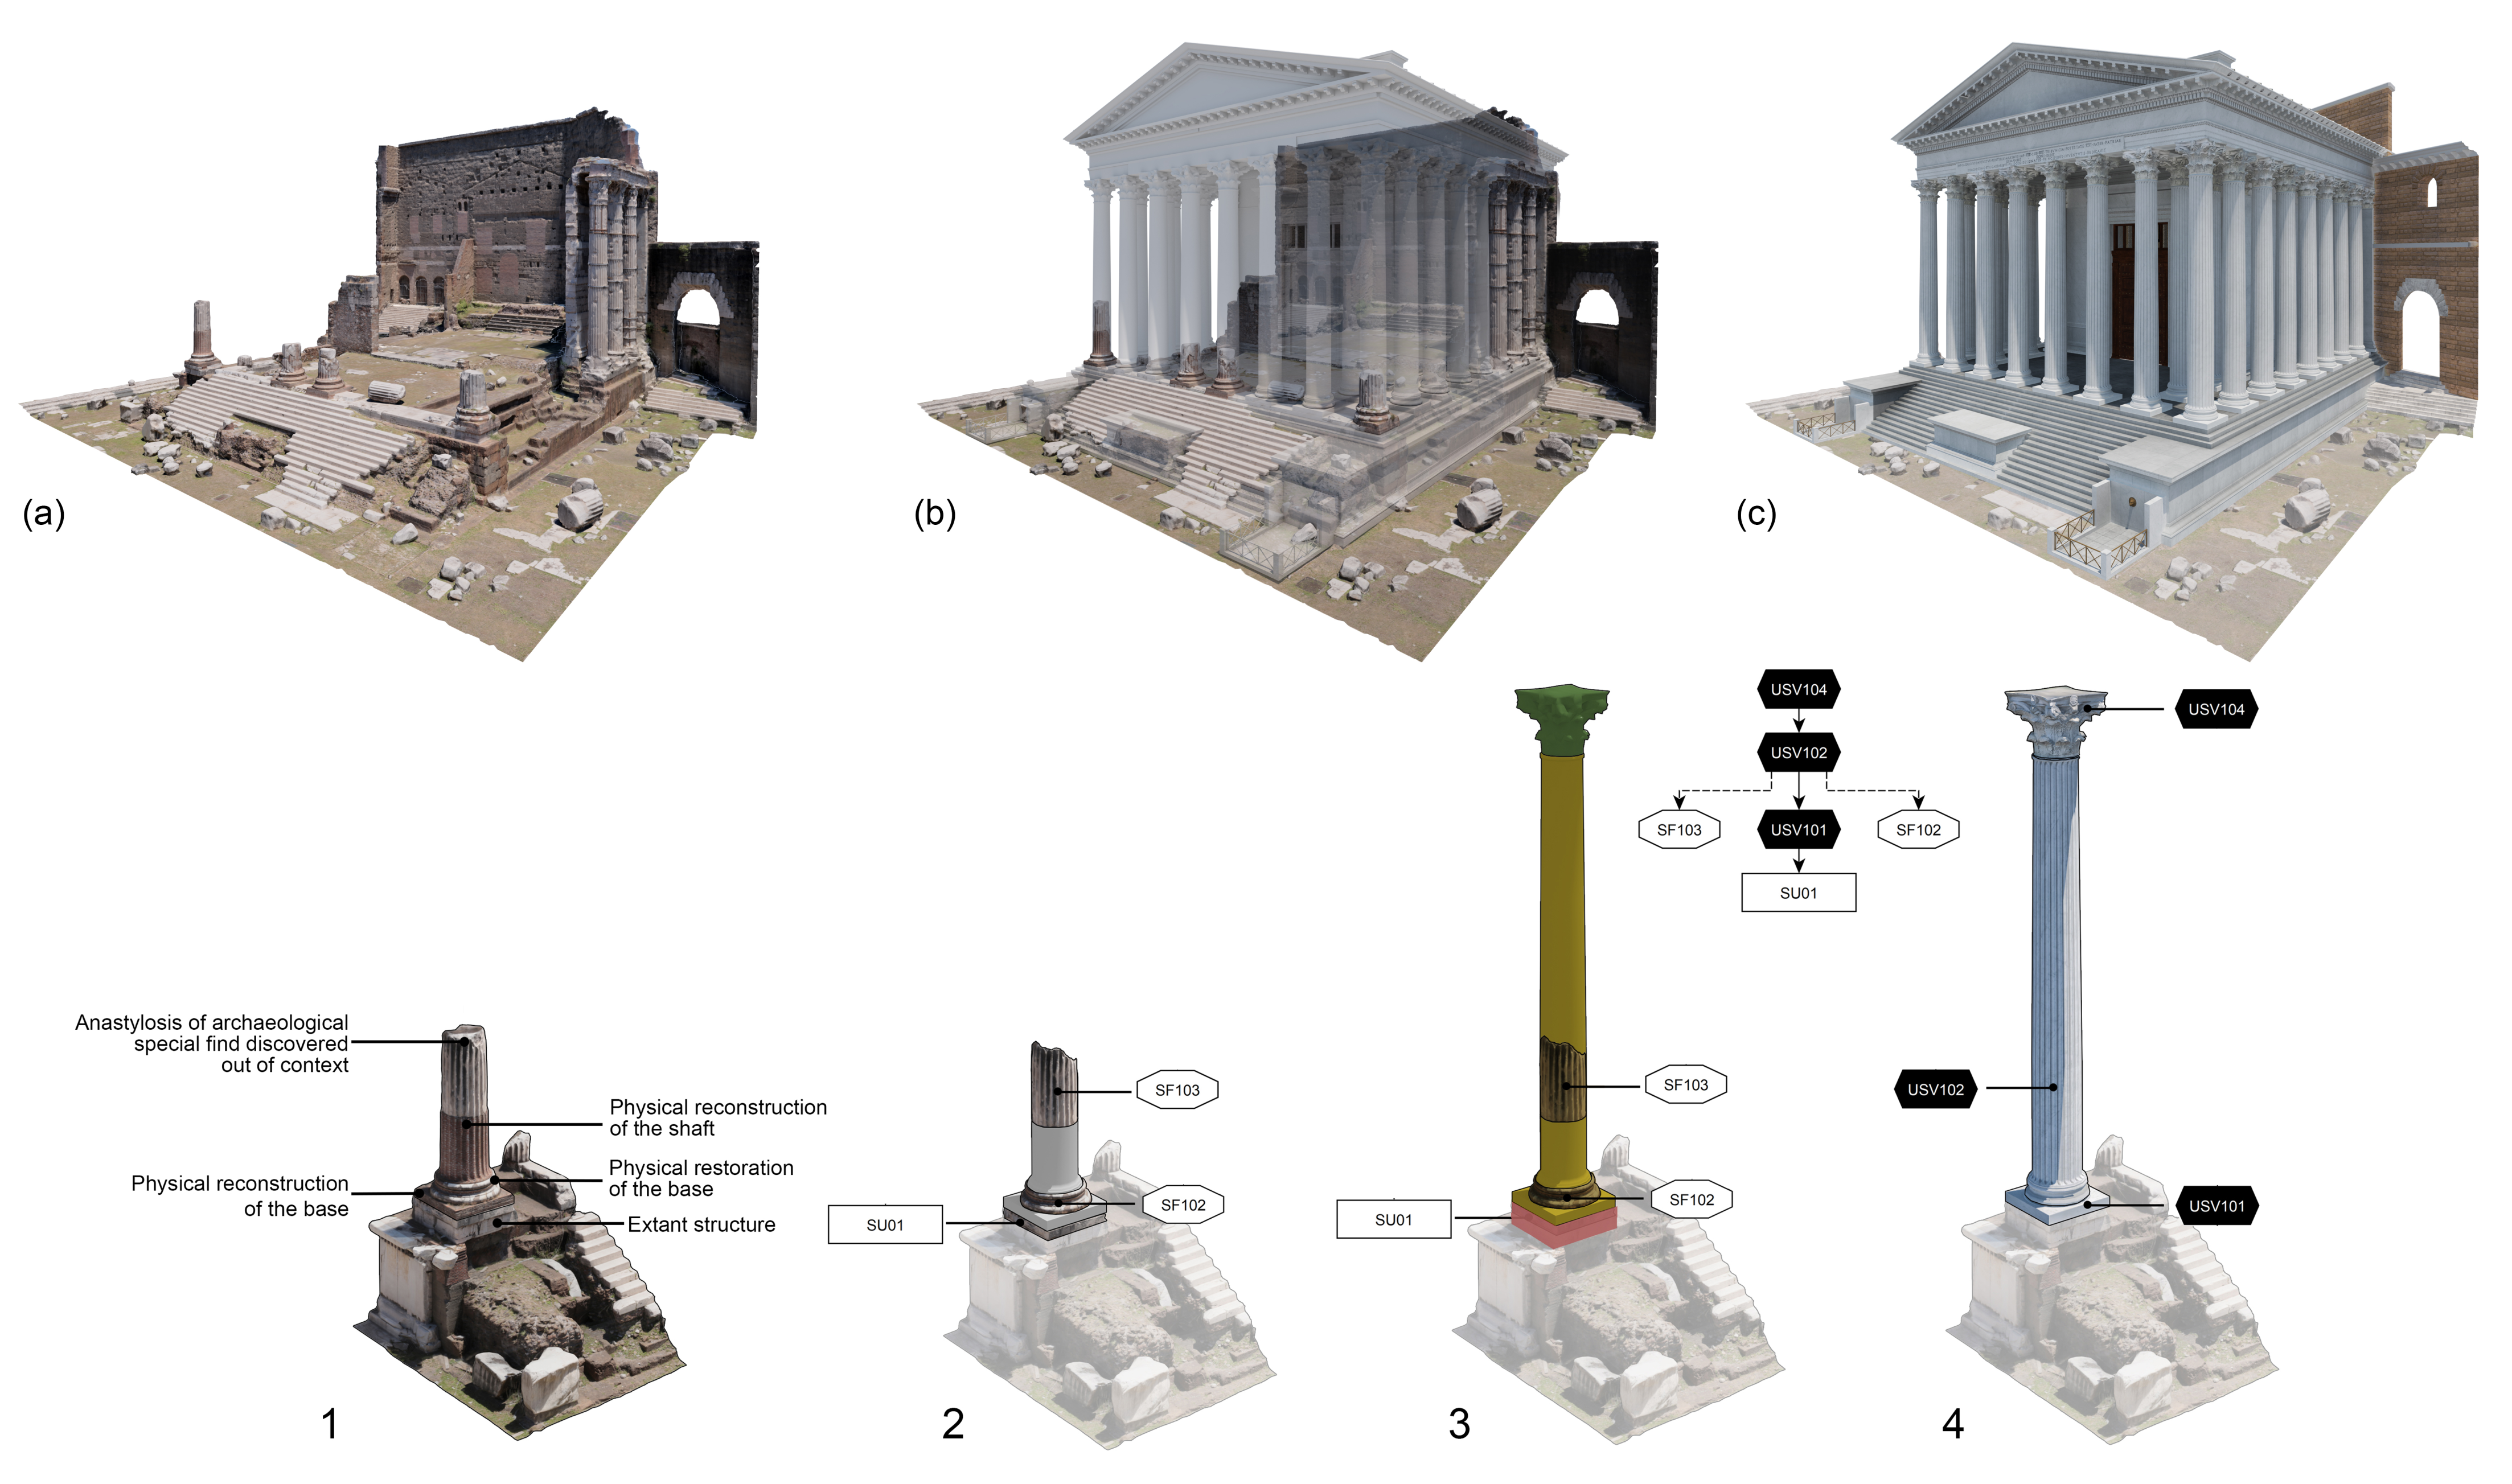
infra Section 5.2) that ensures maximum sustainability and re-usability, the method is nonetheless ”agnostic”. This means that it can be replicated regardless of the tools used, as in the case of the Forum of Augustus
Section 4.2 where the models were made using the 3D Studio Max software.
As we have seen, the data-set may include more than one reconstructed phase (e.g., Roman times, medieval times, etc.). Each epoch should be described as a section or chapter and, within each period, the Stratigraphic Units (SU) and Virtual Stratigraphic Units (USV) explained in a narrative way as part of Virtual Activities. Each Virtual Activity is accompanied by a
virtual activity report, a discursive text that puts into words the reasoning behind the stratigraphic reading and hypothesis like already formalized in the EM 1.1 [
15] (pp. 504–506). Each virtual activity is presented with the corresponding portion of the EM graph, sections and plans illustrating the proxy model and the representation model (see
infra Figure 9).
A list of relevant documents for the publication is as follows:
digital replica and related proxies;
reconstructive interpretation of a given epoch. This part includes the textual part (report of virtual activities) of the reconstructive interpretation, the creation of proxies and the representation model;
the Extended Matrix graph (2D);
2D blueprints and sections derived from the 3D models;
tables with lists of stratigraphic units, source nodes and interpretation nodes.
The publication of the reconstruction should take place on two levels: the publication of the Extended Matrix (EM graph, proxies and RM) and the derived graphic and textual documents. The publication of the whole
dataset, structured according to the scheme in the Figure 16, should be placed next to these documents. Following general FAIR principles for the management and dissemination of the scientific record, a suggested publication repository is Zenodo (
https://zenodo.org (accessed on 26 May 2021) indexed by Open Aire, maintained by CERN, and funded by the European community) which can provide unique document identifiers (DOI) that can be cited in projects where the data is reused.
The ”export manager” tool of EMtools will help users to create tables for an article or a book chapter (csv export), an ”EMviq” (see
infra Section 5.2) interactive web app or a desktop real-time environment (using Unreal, Unity, Cry-engine, or Godot just to mention some examples).
3. Discussion
As well as structuring a process, the five-step procedure offered possible solutions to some of the general issues involved in virtual reconstruction, including data management, collaborative working, dissemination and re-use of the results of a research project. This section points out the issues mentioned above and discusses some of the positive effects that have been brought about by the application of the method in case studies (see
infra Section 4).
Flexibility of the process. It should be noted that, although the five steps have a logical coherence, so that the method should start with the first and ends with the fifth, the steps in between are iterative and interconnected and do not compulsorily follow a strict chronological sequence.
Thus, it is noteworthy that the first three steps alone can be considered necessary and sufficient to obtain a complete reconstructive record. In other words, the collection of information, the analysis and management of the data, and the reconstructive interpretation shape a reconstructive data-set even if a representation model is not produced and/or publication and dissemination activities are not carried out. This is the case of the villa outside Porta Marina in Ostia (see
infra Section 4.7): in this case study the complete data-set of sources and the annotation of how they were used, have been implemented the Extended Matrix along with a complete proxy model for the late antique phase. This will provide the scientific basis for the future creation of the representation model and dissemination activities (steps 4 and 5) that have not yet taken place.
The possibility of proceeding in random order in the development of the five steps, in the absence of solid tools to trace the origin of the data and the construction processes, could have made the process of interpretation and study chaotic. This potential drawback is managed and solved by the EM: changing sources or data in the excavation database make it easy to upgrade the interpretative process, the 3D models, and the derived graphic works. As an example, in the design process of an archaeological excavation, it is not uncommon for provisional reconstructive drawings to be required in order to disseminate the discoveries that have just been made. This is the case study of Amba Aradam (see
infra Section 4.4), where an acceleration in the timing of the project required the virtual reconstruction to proceed even before the end of the stratigraphic study, making it necessary to perform subsequent adjustments to the reconstructive hypothesis when the latest and final documentation became available. The updating of a reconstructive record is not only a fundamental requirement in a long-term archaeological excavation project, but also becomes fundamental after its publication: the study by the community of such a record and above all its reuse and improvement, thanks to the acquisition of new information, makes possible a further development of knowledge without having to rebuild a data-set from scratch.
Collaboration oriented. A division into five steps, in the considered use cases, to allow a division of labour to be set up between professionals belonging to different teams, with different technical skills and different subject areas, thanks to a common formal language (the EM). In this way, it was clear at all times which process and which precise information in the database had to be made available by user A to user B: in the case of Amba Aradam (see
infraSection 4.4), the proxies, along with the graph database, were sufficient for the work of a senior modeller to create the representation model. In other words, the proposed methodology is a pivot to build a multidisciplinary team and a production process adaptable to different case scenarios.
Re-conciliate fragmentary contexts and simulation tasks. As often happens in archaeology, only the lower parts of the wall structures are preserved, while the volumes of the upper part are completely lost and partially attested only in the archaeological layers. During the simulation, the roofing systems is the most complex part to interpret. The technological solutions, in fact, depend on many factors such as the structural design of the building, on the height of the walls and their payload and finally on the construction materials used. Reconstructing missing parts of a building without following a structured protocol could be very difficult and may lead to ignore or underestimate some data. In the Aiano (see
infraSection 4.1), in Ostia Porta Marina (see
infraSection 4.7), and in the Amba Aradam (see
infraSection 4.4) case studies, simulations were crucial to test complex hypotheses and to visualise speculation about the site, its changes and developments over the centuries.
Visual tools for a simplified and synoptic access to relevant information. The stratigraphic records is chaotic and difficult to read because the documentation is complex and composed by different documents (stratigraphic sheets, drawings, photographs, plans, sections, etc.). The use of the EM tool for a management and query of archaeological records allowed a synoptic vision of the data directly on the models using different colour coding: different building phases, extant structures, reconstructions and level of certainty. In large excavations, like in the Onde Marine (see
infraSection 4.3) and in the Amba Aradam (see
infraSection 4.4) case studies, the extension of the site and the quantity of stratigraphic units involved required a tool to manage such complexity without loosing relevant information for the reconstruction hypothesis.
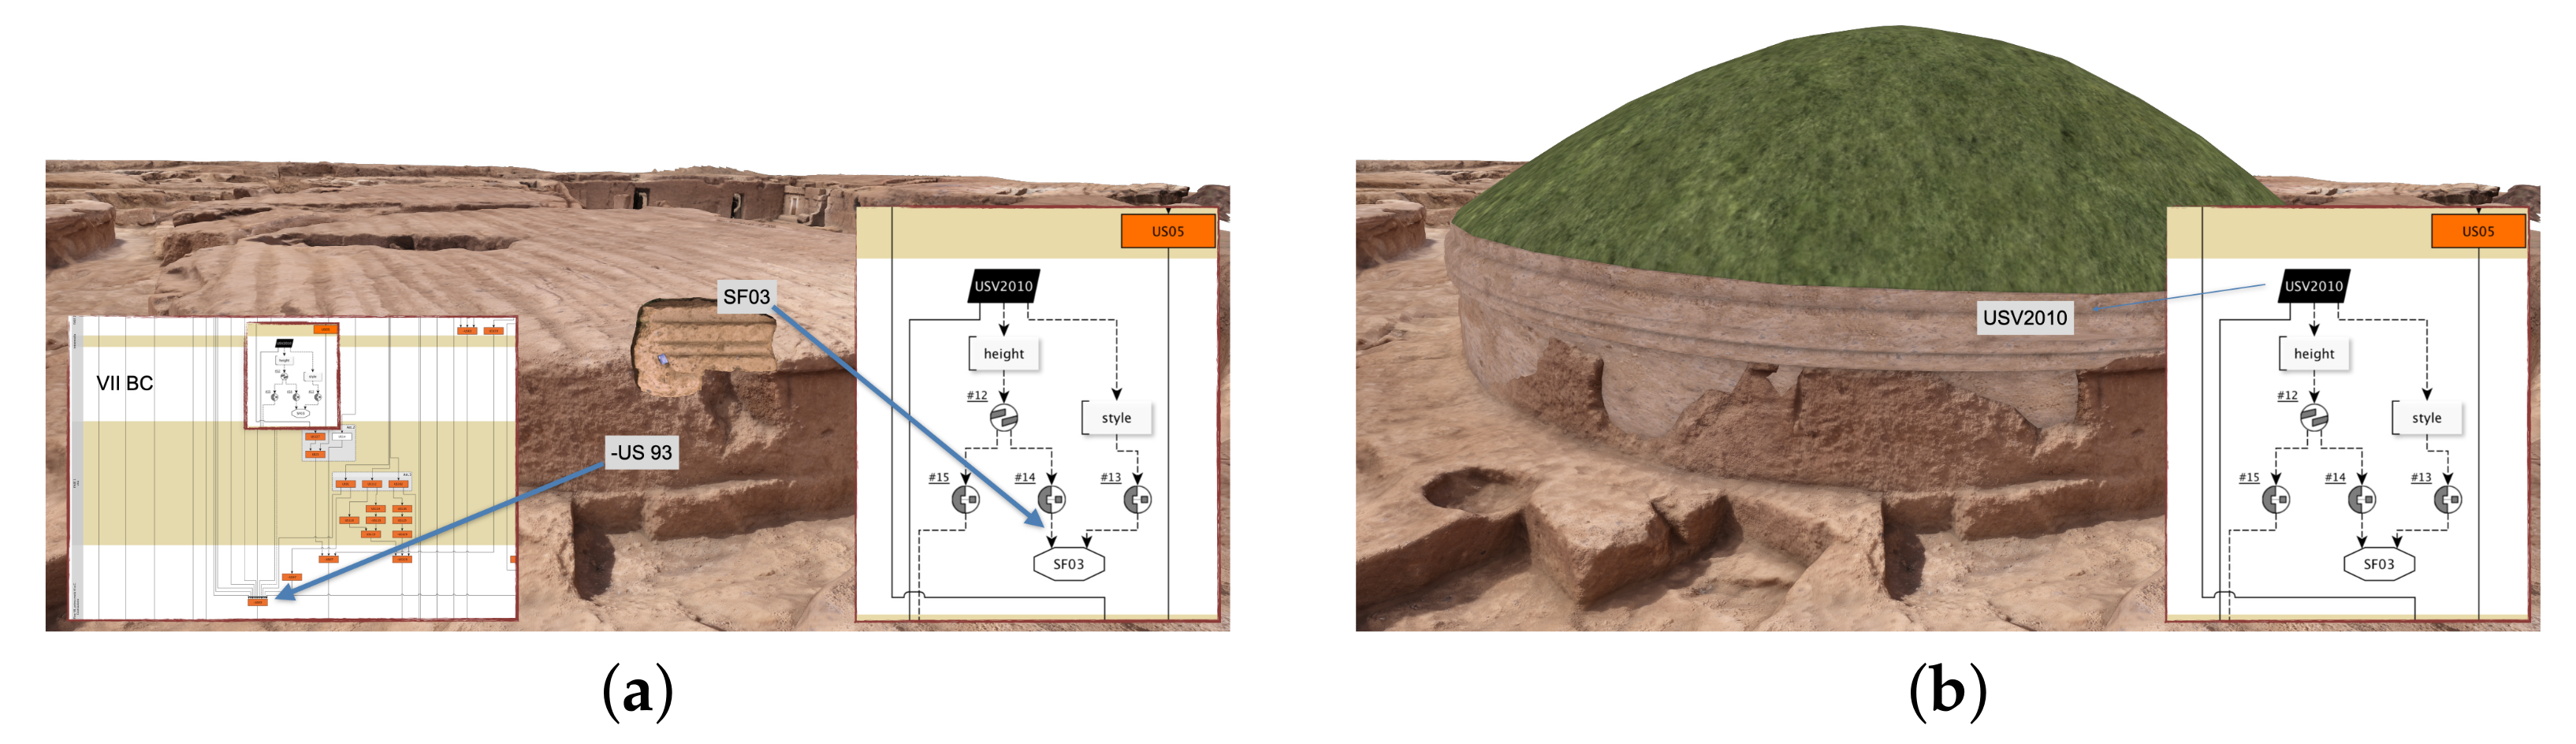
Reconstruction as part of the interpretative and cognitive process. Reconstruction is often considered as a task to be done at the end of the excavation with the risk of losing data because they have not been structured in a coherent system. Indeed, the reconstruction is not merely visualisation, but is part of the interpretative and cognitive process. In our case scenarios, before its publication, 3D models have played a fundamental role as research tool since they improved cognitive processes by transforming the raw data into visual information. The analyzed case studies show that when the activities of 3D simulation have been realised simultaneously with the excavations or during the post processing of the archaeological records, they have improved the quality of the analytical phase. They supported interpretation allowing discussion and comparison of interpretative hypotheses and their verification through simulations and visualisation. Furthermore the use of the EM tool allowed to create a ”white box” semantic model to visually display complex data-set. In the case of the Great Temple (see
infra Section 4.5) the data ingestion, analysis and interpretation tasks were performed through the EM visual formal language in order to create a stratigraphic record including the remains of the temple’s podium and a subset of 50 architectural fragments (special finds): the anastylosis and the digital restoration of the elements as well as the general reconstruction hypothesis, started at the very beginning of the project as the annotation (through the EM visual language) of attempts to interpret the remains with a continue update of the information during the ingestion of new sources. This iterative procedure empowered the cognitive process keeping reasoning patterns within safe boundaries.
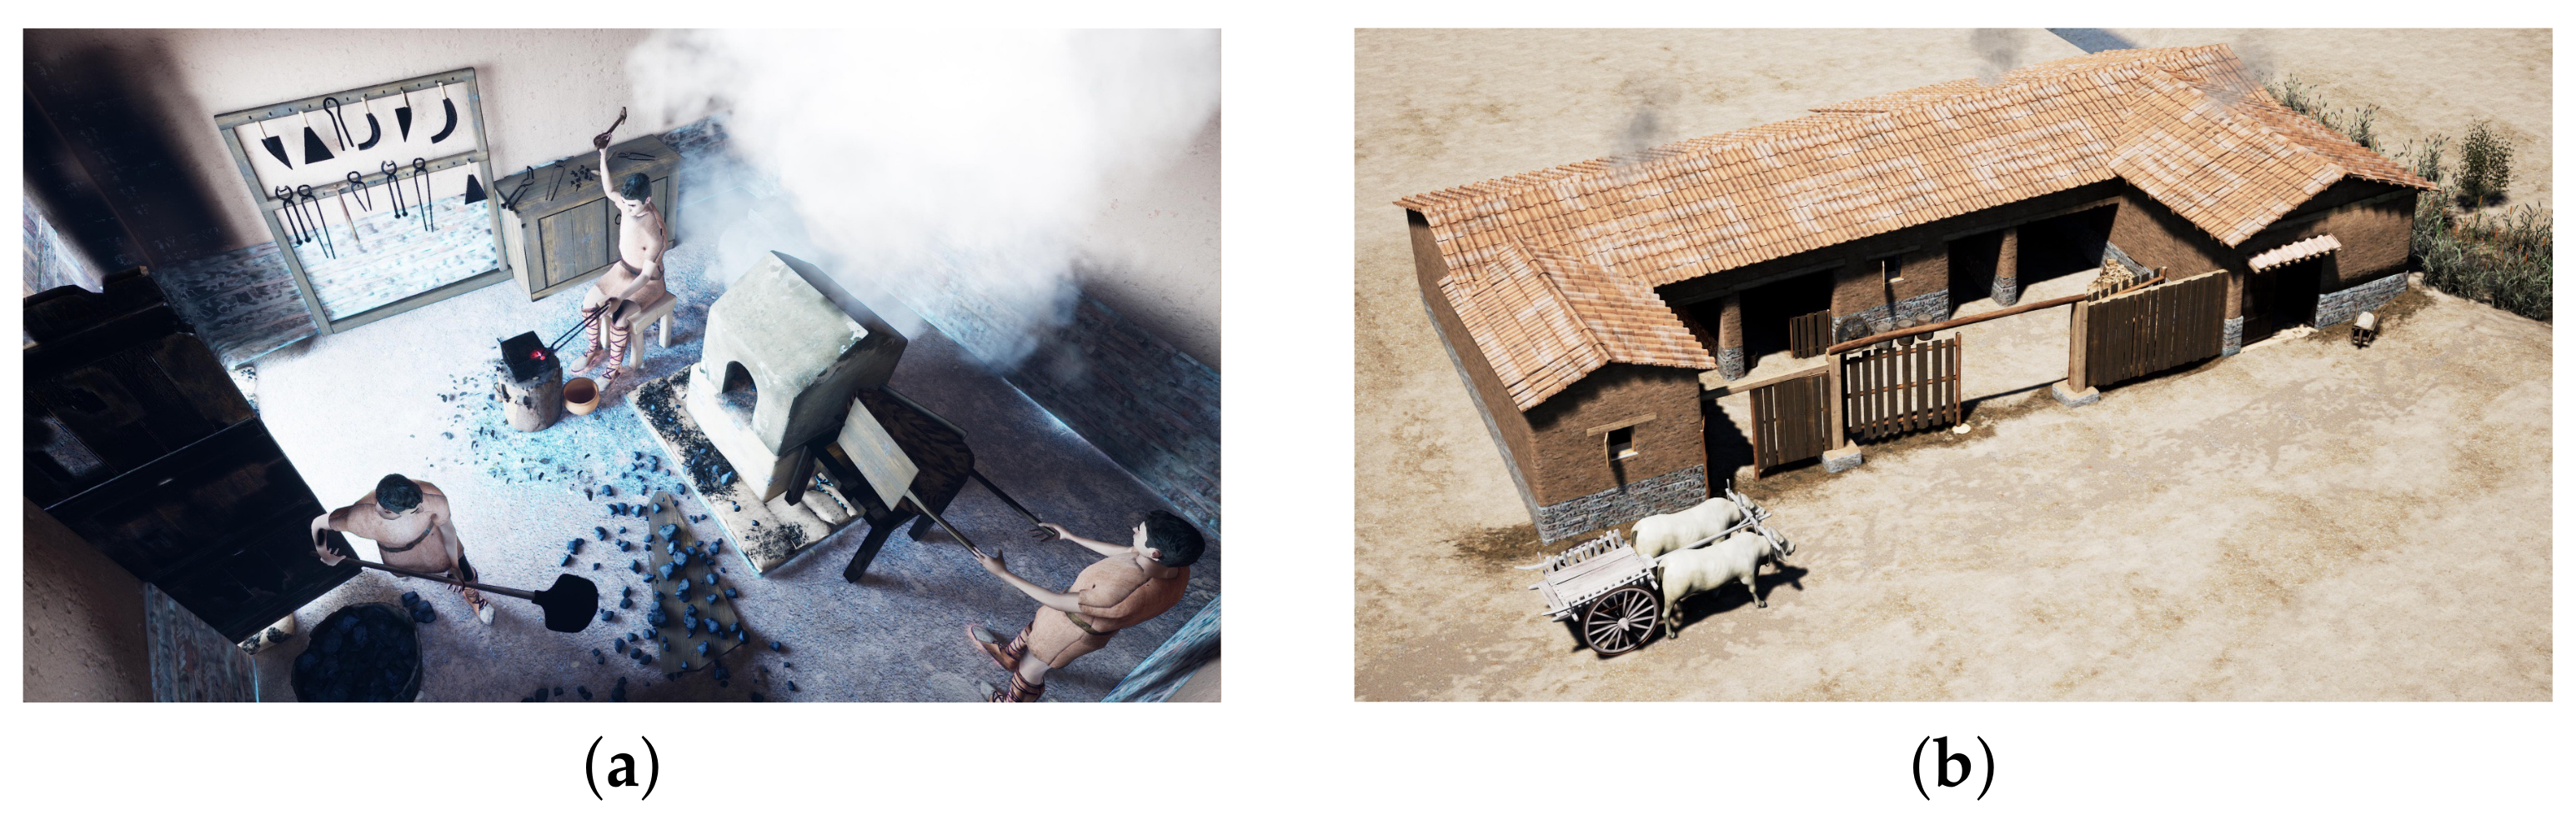
Setup a project of virtual reconstruction in practice. In recent years more and more cultural sites are upgrading their exhibitions with multimedia itineraries and virtual museums. The stakeholders (managers, curators, exhibit designers) aim at improving the educational offer and radically changing the way the cultural sites communicate to visitors. Besides, the rapid technological development has allowed the advancement of scientific-based visualisation and dissemination of virtual reconstruction of the past thanks to digital application in museums and archaeological sites (e.g., virtual reality, augmented reality and mixed reality applications, tangible interfaces, video mapping, applied games, etc.). Whenever a cultural site has to perform a virtual reconstruction of an ancient artifact, to be integrated within one of the above-mentioned applications, it must set up a project facing several problems. In our experience doubts and questions are always the same: “how to set up a project of virtual reconstruction into practice? How can we reconstruct this artefact in a scientific way? How can we communicate the uncertainty?”. The problem becomes even greater when such reconstructions are not developed within a project involving research centres or universities but are contracted out to external companies or creative industries for public dissemination. Professionals like digital archaeologist, digital asset managers, 3D artists expert of cultural heritage, are not very common. Digital Archaeology and Digital Heritage are new-born disciplines in the academic environment. For years indeed, virtual reconstructions have been belittled and relegated to mere visualisation and their role excluded from interpretative and cognitive process. This method proposes an operative protocol useful to set up a project of virtual reconstruction. The objective is to convey the results from scientific research along with reference, instruction and procedures, not only to scientific communities but, above all, to the market. It is addressed both to all those public and private institutions that have to contract out such works to improve the educational offer through digital products and to the creative industries that have to implement them into digital application and virtual museums. In the case study of Montebelluna (see
infraSection 4.6), the municipality’s museum needed to create a permanent exhibition focused on a roman craft building: the five steps method made the reconstructive process understandable both to the partners of the University of Padua and the Montebelluna Museum during the planning and fundraising activities of the project, and to visitors during the exhibition.
5. Methods
Over the last few years, we have been working on the development and improvement of the Extended Matrix, the approach and methodology of which has been described in the introduction and in
Section 2. The above mentioned case studies allowed us to put the theoretical aspects into practice and to improve the method and application tools. We have now delivered the version 1.2, which introduces substantial innovations by resolving some gaps and responding to needs that have arisen over the years.
5.1. Extended Matrix 1.2
The Extended Matrix in both the 1.0 [
14] and 1.1 [
15] versions limited itself to ‘extending’ the classical Matrix by adding the nodes relating to the reconstructive discourse but, at a later stage, the need was felt to also improve the formal tools for describing the ‘existing’ stratigraphy. Thus, in order to better understand the tools and the formal language of the EM, a reading of the 1.0 and 1.1 versions reference paper is suggested. It has to be clarified that the EM versions propose incrementally new features so that elements and schematics of every previous version are still valid. Here we see some examples of extensions provided by EM 1.2. Often, in the stratigraphic analysis, one has to deal with a series of units rather than a single stratigraphic unit: a series of column plinths, a series of capitals, a series of thermal pavement foundations
pilae, and so forth. In these situations, rather than giving a different number to each element, where it is desired to express elements arising from the same action, it is possible to use the “seriation” node (
Figure 15a): it allows to formalize them in a convenient way, avoiding redundant information within the EM.
Another aspect that has been lacking in the matrix for many years is how to express the
lifespan of a stratigraphic unit, enclosed between the moment of its execution and the moment of its destruction or defunctionalization. Although there have been several hypotheses and proposals, there was no solution in the literature consistent with the ‘graph structure’ of the matrix. In the EM the continuity of life is expressed through a continuity node (a black rhombus,
Figure 15b) that marks the end of the life of the stratigraphic unit (the beginning is marked by the stratigraphic unit itself).
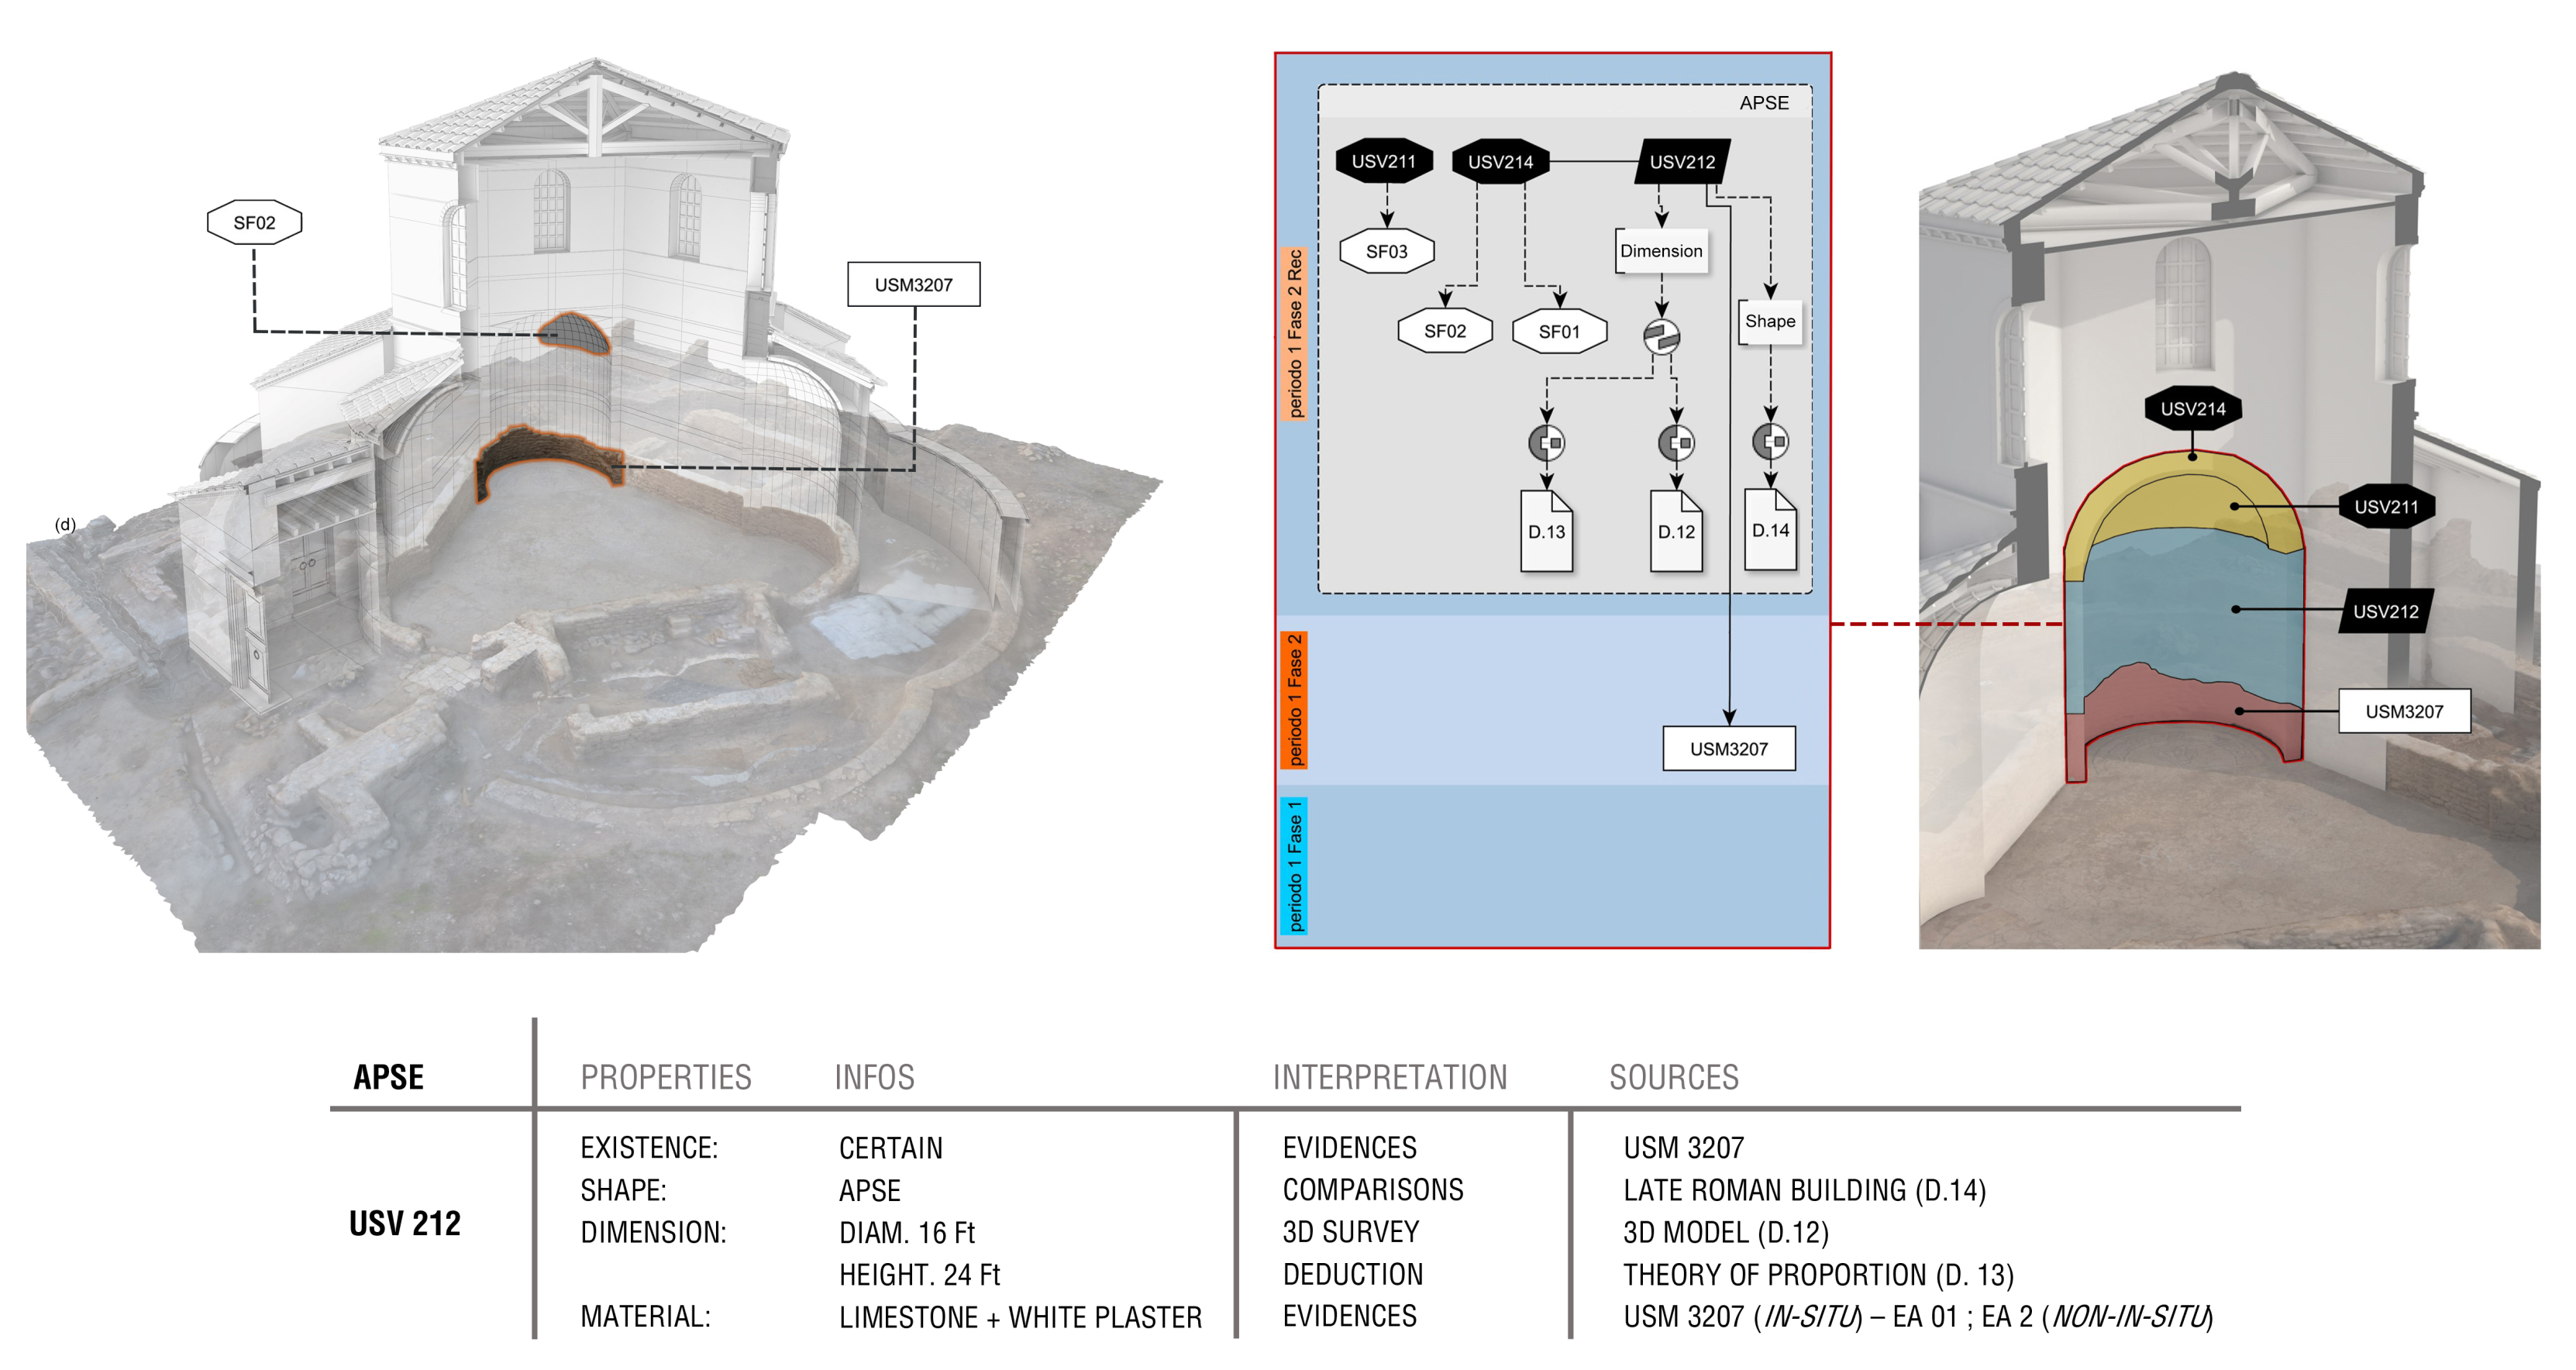
The aspect that marks a greater distance of the EM with regard to the classical matrix is the introduction of paradata (expressing data provenance). In order to understand the importance of documenting the origin of the data collected, it is necessary to make an aside on how a US is described through the textual and graphic apparatus.
Each stratigraphic unit is identified starting from an autoptic analysis that is formalised through textual information (name of the stratigraphic unit, site of belonging, day of discovery, etc.) and through visual aids such as a technical drawing (an excavation blueprint, a photogrammetric survey, a photograph with a metric pole and arrow of the North etc.).
The representation of the stratigraphic unit is a crucial tool for documenting its shape, spatial positioning and dimensions in a coherent manner. However, it is not unusual for the documentation of a stratigraphic unit to be entrusted to several documents.
Let us consider an example. In some cases, the analysis of the walls of buildings that are still preserved, as in the case of a historical building, does not allow us to appreciate the real thickness of some wall structures built by leaning against and subsequent stratification, precisely because of the lack of structural gaps. In this case the information of height and length of the wall readable in the photogrammetric survey, must be integrated with the information of a micro-carving or another non-invasive technique to determine the thickness of the wall.
In this example, it is necessary to combine several graphical drawings in order to document the dimensional properties of a stratigraphic unit. In an Extended Matrix it is possible to input this information. Through document nodes (in which the aforementioned graphic works are cited), extractor nodes (in which it is specified how these sources are interpreted) and through a combiner node (to illustrate the scientific reasoning), the origin of the information is formalised.
A proxy model is therefore designed to provide a picture as complete as possible of the stratigraphic unit, taking into account the various graphic and textual documents available that contribute to the description of its dimensional characteristics and positioning.
In EM 1.2 the task of collecting sources has now a reference table (see
Table 2) that helps experts to focus on relevant information. The use of a table, instead of a graph database at this initial stage, makes data entry quicker and easier for staff, without specific skills, to join the team.
EM 1.2 comes with an updated color chart (see
Table 3) that now includes the proxies that represent the re-positioned non in situ (Virtual anastylosis) architectural fragments (Special Finds—SF) along with their virtual completion (Virtual completion of Special Finds—VSF).
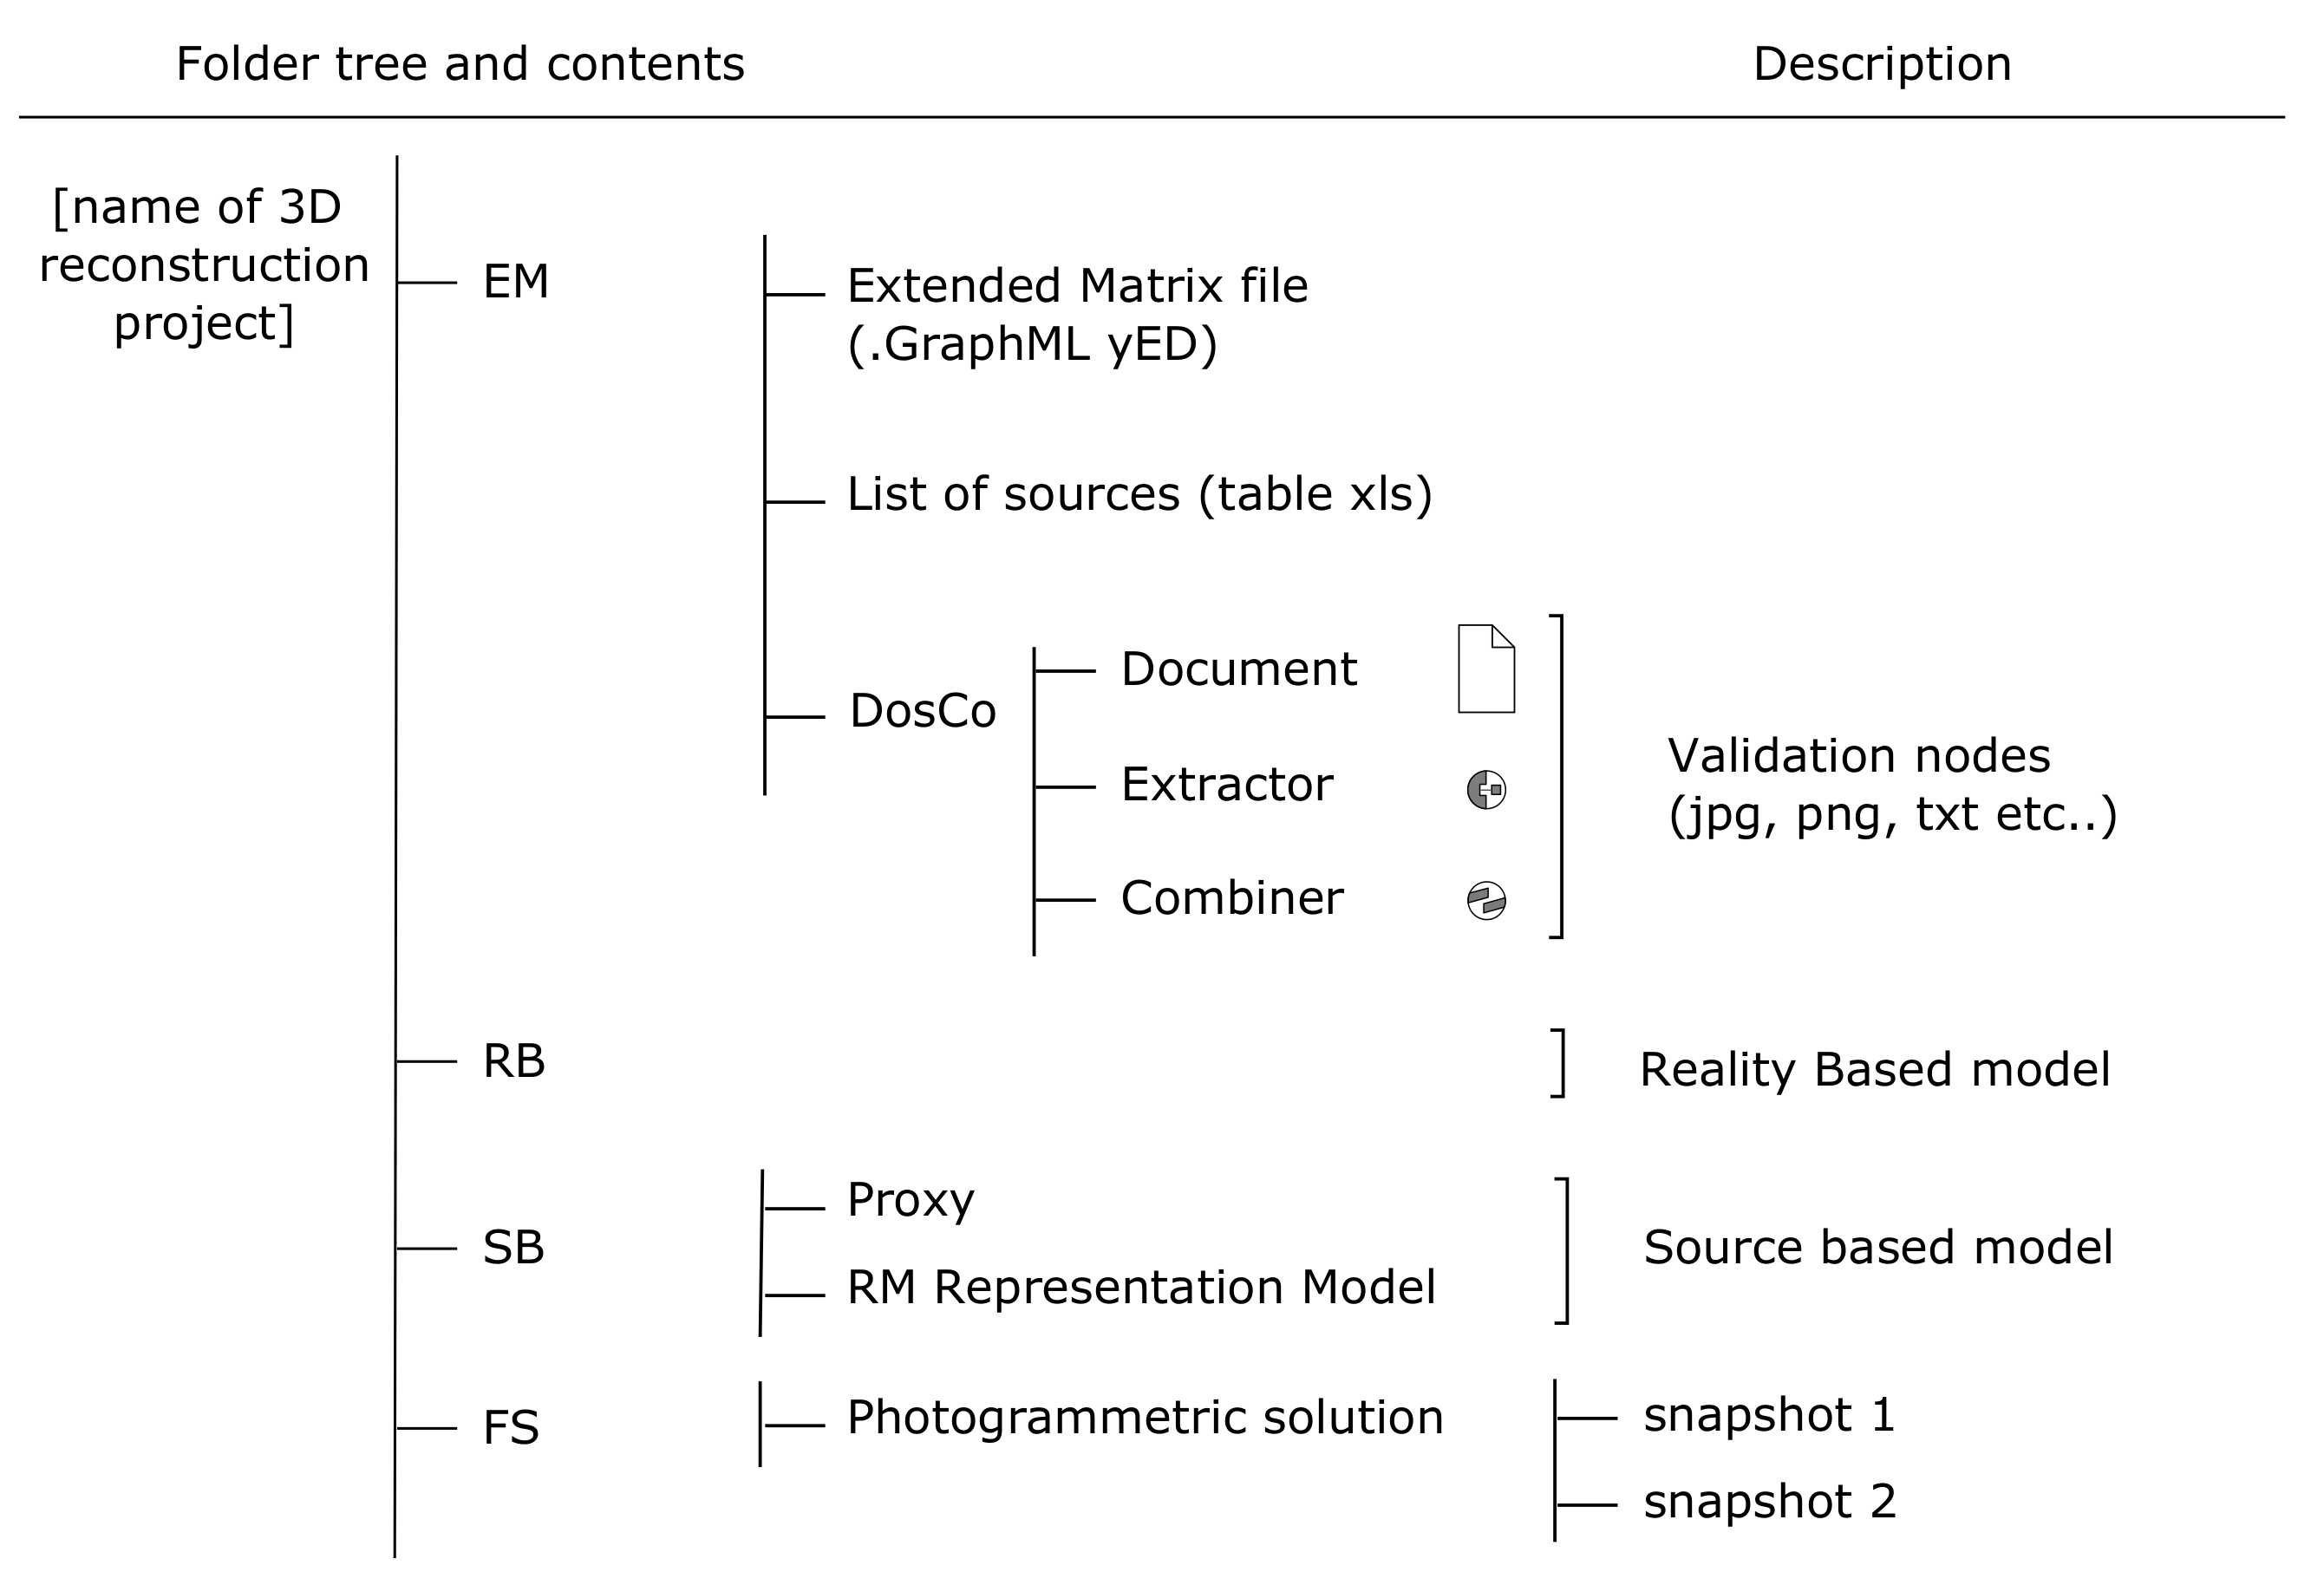
EM 1.2, thanks to the validation process made through several case studies, can finally propose a mature folder structure (see
Figure 16) for a reconstruction project including the EM (Extended Matrix), the RB (Reality Based model, coming from image-based or range-based survey), the SB (Source Based model with proxies and, eventually, the Representation Model -RM), and the FS of Photogrammetric Solution (with the results of the Structure from Motion algorithms: camera position, Ground Control Points, and errors etc.).
5.2. Extended Matrix Framework 1.2: Software Tools for Reconstruction
EMtools [
26] is an original software for semantic annotation and creation of reconstructive hypotheses in connection with an Extended Matrix (EM). The software, developed in Python as an add-on for the open source package Blender 3D (
www.blender.org (accessed on 26 May 2021)), aims to enhance the processes of analysis, synthesis and dissemination in the field of cultural heritage sciences. The tool makes it possible to connect graph databases to proxy models within a 3D space according to the EM methodology. It is freely available under GPL3 license on Github (
https://github.com (accessed on 26 May 2021)) and is under active development within the European SSHOC project (
https://sshopencloud.eu (accessed on 26 May 2021)).
EM tools allows to:
overcome the limitations currently present in BIM and GIS with regard to their lack of compatibility with graph databases;
semantically annotate the stratigraphy within a 3D environment;
create a critical edition of a reconstructive hypothesis.
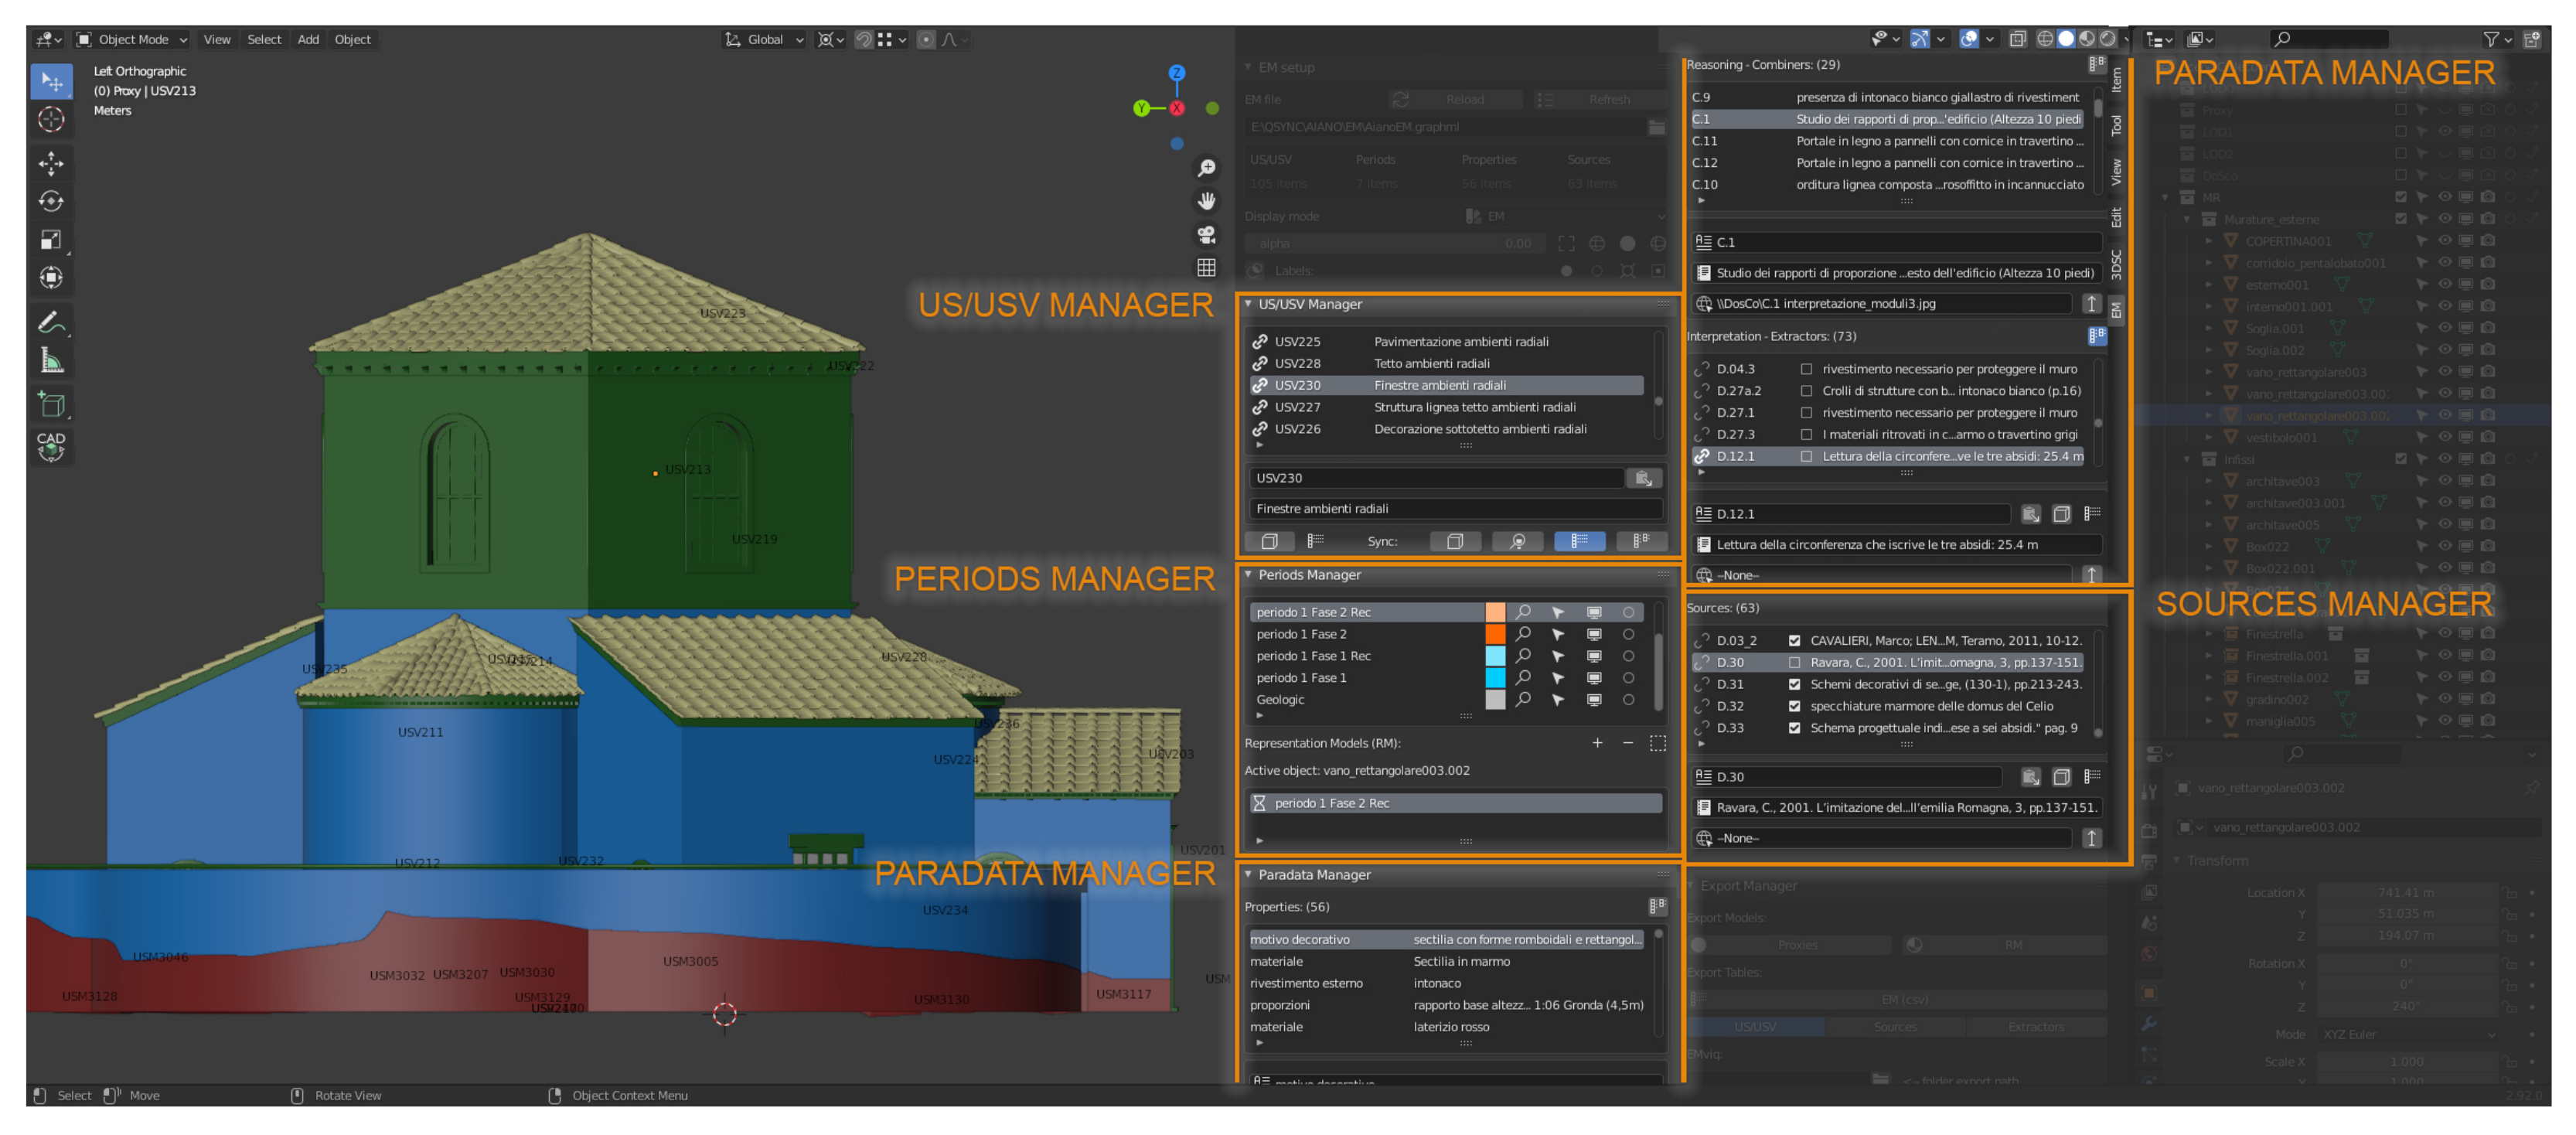
Once activated, the EM add-on is visible in the sidebar and allow to query the 3D model gathering the semantic data directly from the graph database. The add-on is composed by many tools allowing to query the proxy models and to activate different visualisation mode (see
Figure 18). The tools are organised as follows:
US/USV Manager: this tool allow to visualise US/USV ID’s and descriptions; activate and locate labels; select and zoom on selected item;
Periods Manager: it allow to activate a specific colour coding on the proxy model. (1) Periods: in case the digital replica consists of multi-layered archaeological remains formed in different historical periods, the tool assigns a different colour to the proxy model depending on the historical period; (2) Levels of certainty: the tool assign to each segment of the proxy model one of the five coded colour according to archaeological evidences (see
Table 3 and
Section 2.3);
Paradata Manager: This section displays the properties of each reconstructed element (USV), such as material, shape, appearance and size. In addition, specific information extracted from the sources (Extractors) and combined with each other (Combiners) in order to perform interpretative reasoning and deduce the above properties, is here accessible;
Sources: finally, in this section, one can view the list of sources (Documents) and access the files previously saved in the data repository.


