Article

A Method to Minimize the Effort for Damper–Blade Matching Demonstrated on Two Blade Sizes

Politecnico di Torino, Corso Duca degli Abruzzi 24, 10129 Torino, Italy
*
Author to whom correspondence should be addressed.
These authors contributed equally to this work.
Appl. Sci. 2021, 11(11), 5171; https://doi.org/10.3390/app11115171
Submission received: 26 April 2021 / Revised: 27 May 2021 / Accepted: 31 May 2021 / Published: 2 June 2021
(This article belongs to the Special Issue Bladed Disks Structural Dynamics)

Abstract

:
A method called PCR (Platform Centered Reduction) is designed to more effectively perform complex iterative and nonlinear calculations required for the dynamic response of turbine blades damped by dry friction contacts between rigid dampers and airfoil-to-neck platform. The key feature of PCR is to represent all nonlinear forces on the blade platform by means of only six degrees of freedom at a point located within the platform volume, regardless of the number of damper–platform contact elements. Despite reducing the effort and computational time by more than one order of magnitude, the method proves to be fully accurate by a check against the corresponding nonlinear Finite Elements (FE) calculation. It is also shown that the limit exciting force, indicating the upper capability to dampen vibrations, can be calculated with a simple linear modal analysis. In order to search for the best blade–damper match, the preferred graph represents relevant bending stresses on the airfoil against excitation forces. A detailed application of the method concerns two significantly different blade sizes, by varying parameters such as neck length and damper centrifugal force. Finally, it is emphasized that a final check by a complete FE analysis is still possible as a purely linear solution fed by sets of contact forces previously determined through the PCR at any desired frequency and excitation.

1. Introduction

Gas turbines operate under dynamic loads and in a wide range of temperatures. Due to the circumferential non-uniformity of the gas flow, severe dynamic stresses may be induced in the bladed arrays, thus leading to high cycle fatigue (HCF) failures. The reduction and control of these dynamic stresses is paramount to ensure a reliable and long operating life of gas turbines. This goal is typically achieved by increasing structural damping through friction [1]. Friction damping devices are available in different configurations: they may be integral to the blade, such as shrouds [2,3,4] or blade roots [5], or may be separate components, such as underplatform dampers. The last type of device is a relatively simple prismatic component inserted between the blade platforms and performs three functions:
  • It seals the high temperature gas stream from the blade root cooling air.
  • It provides friction damping.
  • It serves as an elastic constraint between adjacent blades.
Points 2 and 3 co-operate to reduce resonant vibration amplitudes and to shift the blades’ resonant frequency. Points 2 and 3 are a by-product of contact and friction and, as such, are influenced by the amplitude of the dynamic excitation force on the blade, i.e., their effect is linked through a nonlinear relation to the amplitude of the excitation force. A convenient way to characterize underplatform dampers is to exploit the two linear limits corresponding to minimum excitation levels (highest resonance frequency) and to maximum excitation levels (lowest resonance frequency). The former when the damper is in full-stick, i.e., its effect is reduced to a pure elastic coupling between the blade platforms, and the latter when the damper slides freely against the corresponding platform interfaces.
Studies available in the literature dwell both on measuring and on predicting the frequency response of blades under various sources of nonlinearity. The Frequency Response Function (FRF) of the blade is the object of experimental observations that are compared with those produced by numerical models: this is the case from the early pioneering 1980 studies [1] through the decades down to the latest achievements where numerical models have reached a high level of complexity and, as increasingly claimed, “fidelity”: see [6,7,8,9,10] just to quote a few. To achieve this goal, several numerical tools are necessary, e.g., a proper representation of friction contacts [11,12,13,14], an efficient computational strategy to solve the nonlinear equilibrium equations in the frequency domain [15,16,17,18] and finally methods to reduce the size of the nonlinear system of equations [4,19,20]. Apart from testing their predictive capabilities against experimental evidence, numerical codes can be used to perform optimization studies and sensitivity analyses during the design stage [7]. With this goal in mind, the authors have developed a 3-step optimization procedure.
Step 1 is to filter out all those geometries that would lead to undesirable kinematics and contact forces [21,22].
Step 2 is to identify those ranges of parameters that are better in terms of added stiffness and damping [23].
Step 3 comes from the need to complete the picture by exploring how the basic geometrical design parameters of blades interact with the damper parameters, then for which parameters combination a designer may find the best blade–damper match in view of the vibratory response under resonant excitation.
While the first two steps are stand-alone, i.e., they are performed independently of the blades and only as a function of the damper shape and the relative displacement between adjacent blade platforms, the search for the best match between a damper and a given blade is very demanding from the computational point of view as it requires repeated dynamic nonlinear coupled analyses of the blade–damper system. The approach to Step 3 proposed in this paper aims at drastically reducing the size of the nonlinear system by adopting a special representation of the dynamic behavior of the blade. In detail, platform and neck can be accurately represented using simple beam elements, while realistic airfoils can be modeled using standard FE codes and Component Mode Synthesis (CMS) techniques. The advantages of this approach are:
  • representing the kinematics of the platform by means of the displacements and the rotations of just one appropriate single point allows all the nonlinear contact forces distributed on the underplatform/damper interfaces to be represented by means of the “dynamically equivalent” concentrated forces and moments applied at that point;
  • modeling the neck by means of beams represents the reality in its most simple, straightforward and time-honored way, and is fully compatible with the advantages of describing the kinematics of cross-sections (of neck and platform) in terms of a single point displacements and rotations;
  • the airfoil CMS reduction is performed only once, as the airfoil is kept constant during optimization calculations.
A consequence of point 1 is that, as shown in [24,25], the whole effect of friction forces on a platform can be reduced to time-variable nonlinear forces and moments (half of them dynamically irrelevant due to neck shape), i.e., the size of the linear system to be solved reduces to that of one beam element node, independently of the number of contact points. This makes the proposed approach very convenient in capturing, representing, and clarifying the role of frictional phenomena on the blade/damper system.
Section 2 of this paper offers a brief description of the method, i.e., the reduction strategy here called Platform Centered Reduction first presented in [25], proves its accuracy and shows a sample of results to demonstrate the potential of the platform-centered representation of friction forces.
The novel contributions of the present paper can be found in Section 3, Section 4 and Section 5 and are summarized in the following.
Section 3 presents two realistic models of gas turbine blades of different sizes and derives the key parameters to build the corresponding PCR reduced representations.
Section 4 takes advantage of the efficiency ensured by the PCR to investigate the influence of the blade size on the sensitivity of the response to design parameters. The insights provided by the combined use of the limit excitation force and allowable stress concepts are highlighted.
Section 5 emphasizes the benefits of the PCR in terms of computational time reduction and proposes a procedure to obtain a full FE response featuring friction effects through the combined use of PCR pre-computed contact forces and a simple full FE linear response.

2. Method

2.1. Model

It has been shown in [24] that it is possible to define a modeling procedure and a related numerical treatment capturing the essential elements of a turbine blade for its damper-coupled optimization. In more detail:
  • the neck is represented through a series of beam elements;
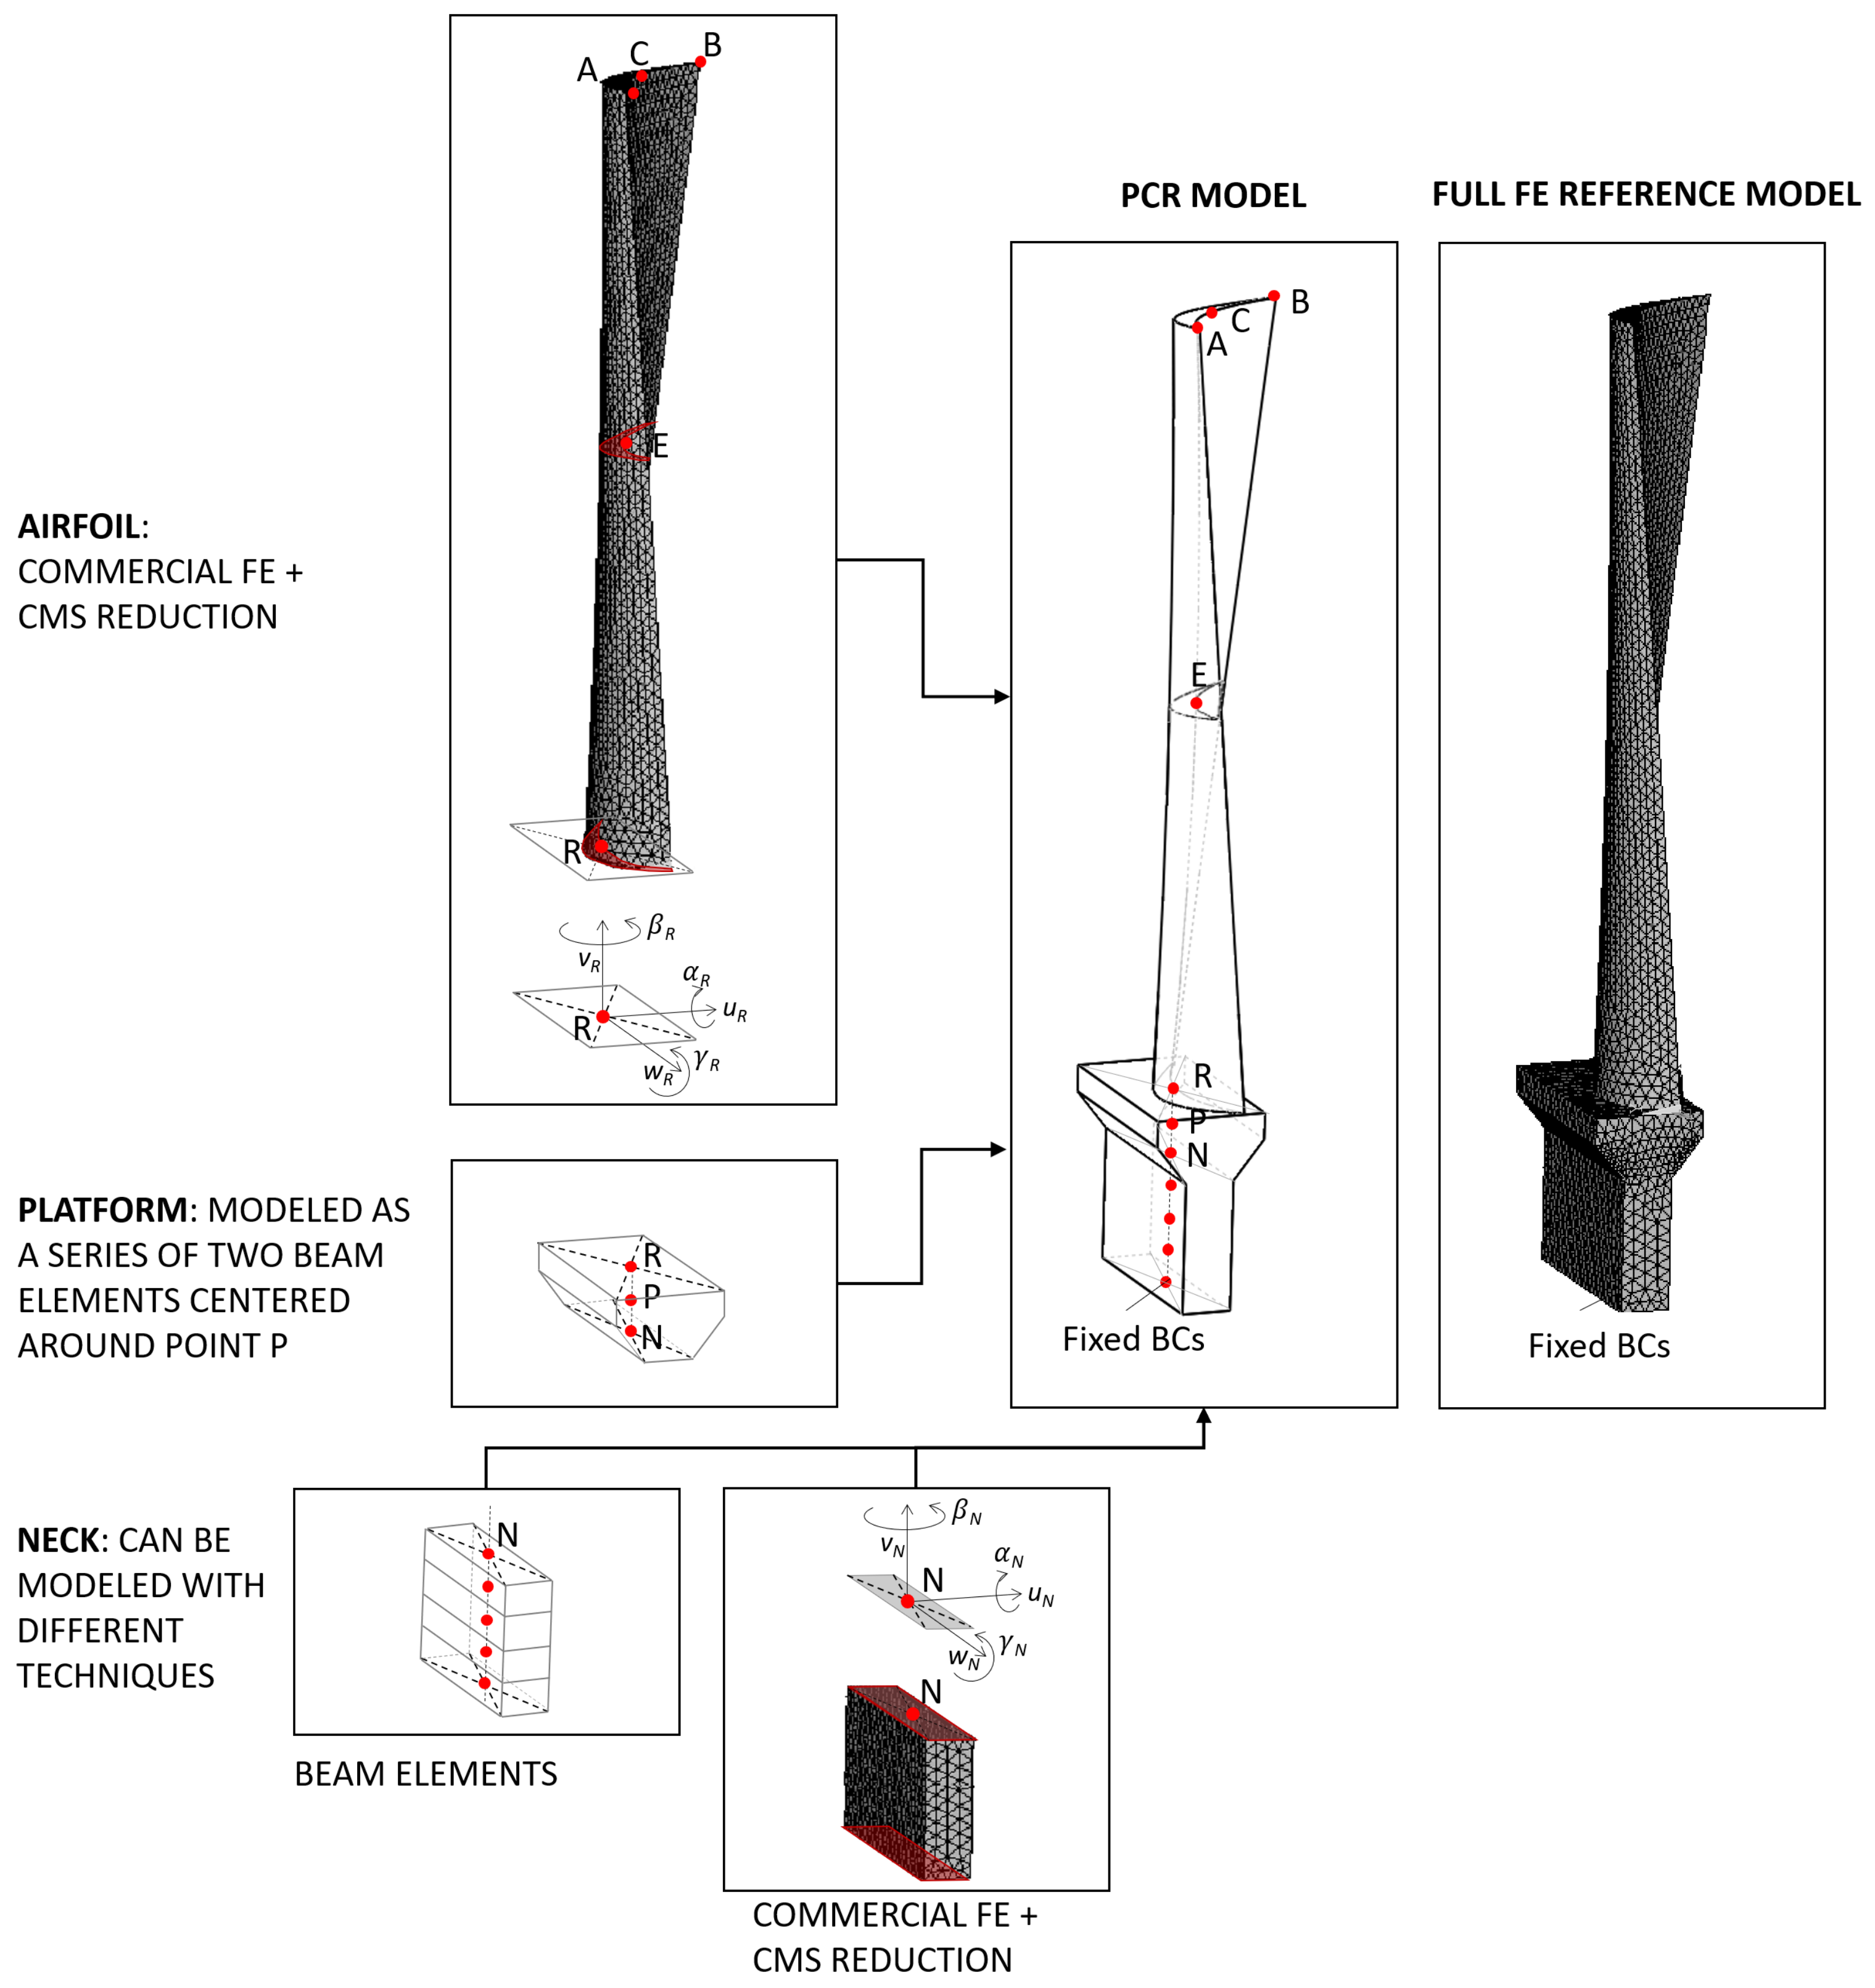
  • the platform, due to its size and shape behaves as a rigid body, in particular regarding the kinematic relationship between its central point P and its contact points with the dampers (see Figure 1);
  • although it is sure that points R and N are connected rigid body kinematics and equilibrium, it is expedient here to represent the platform as a series of two beams;
  • this modeling choice allows the beam area moments of inertia to be adjusted in such a way that local contributions to elastic deformabilities at the airfoil–platform junction (point R) and at the neck–platform junction (point N) are correctly taken into account [24].
Contrary to the previous paper [24], where a simplified airfoil was represented by a series of beam elements, in this paper, a realistic airfoil with taper and torsion is introduced (see Figure 2). After a Component Mode Synthesis (CMS) reduction of the airfoil, its root cross-section DoFs are mutually constrained on a rigid translating and rotating plane, then coupled to the upper surface of the platform (point R), in a manner consistent with the model of the platform and of the neck beams. With reference to Figure 2, the reduced airfoil retains only those points that are strictly necessary for the application of the aerodynamic forces (a single point E is here considered), for monitoring of the main movements tracing the oscillation amplitudes (points A,B,C), for coupling the airfoil to the platform (points N and R).
Obviously, no one prevents that, in a case of special geometric complexity of the neck, it can be represented with a solid FEM model instead of beams (see Figure 2), reducing it with the CMS procedure after having constrained the points of the end surfaces on planes, as described above for the airfoil. However, the decisive advantage of representing the neck with a series of beam elements is to allow the exploration of different geometries without having to modify a CAD model and re-mesh it.

2.2. Proof of Accuracy

It should be noted that, regardless of the chosen number of contact points (reduced to the strict minimum compatible with bending an torsion in the example of Figure 1 even if there is no theoretical limit to their number), the maximum size of the nonlinear problem to be solved never exceeds the value 6, i.e., the number of rigid body DoFs at point P. Nonetheless, this platform-centered reduction is performed without any significant sacrifice in the accuracy of blade/damper dynamics and stress at those critical points that have bearing on fatigue behavior because the platform effectively behaves, to a high degree, as a rigid body.
The statement above has been proven by comparing the results of the PCR model to that of the full FE reference model shown in Figure 2. Further details on Blade A chosen as a test case are given in Section 3. The full FE-PCR comparison has been performed both on linear (i.e., no damper) and nonlinear cases. Table 1 gives a summary of the assessment of equivalence.
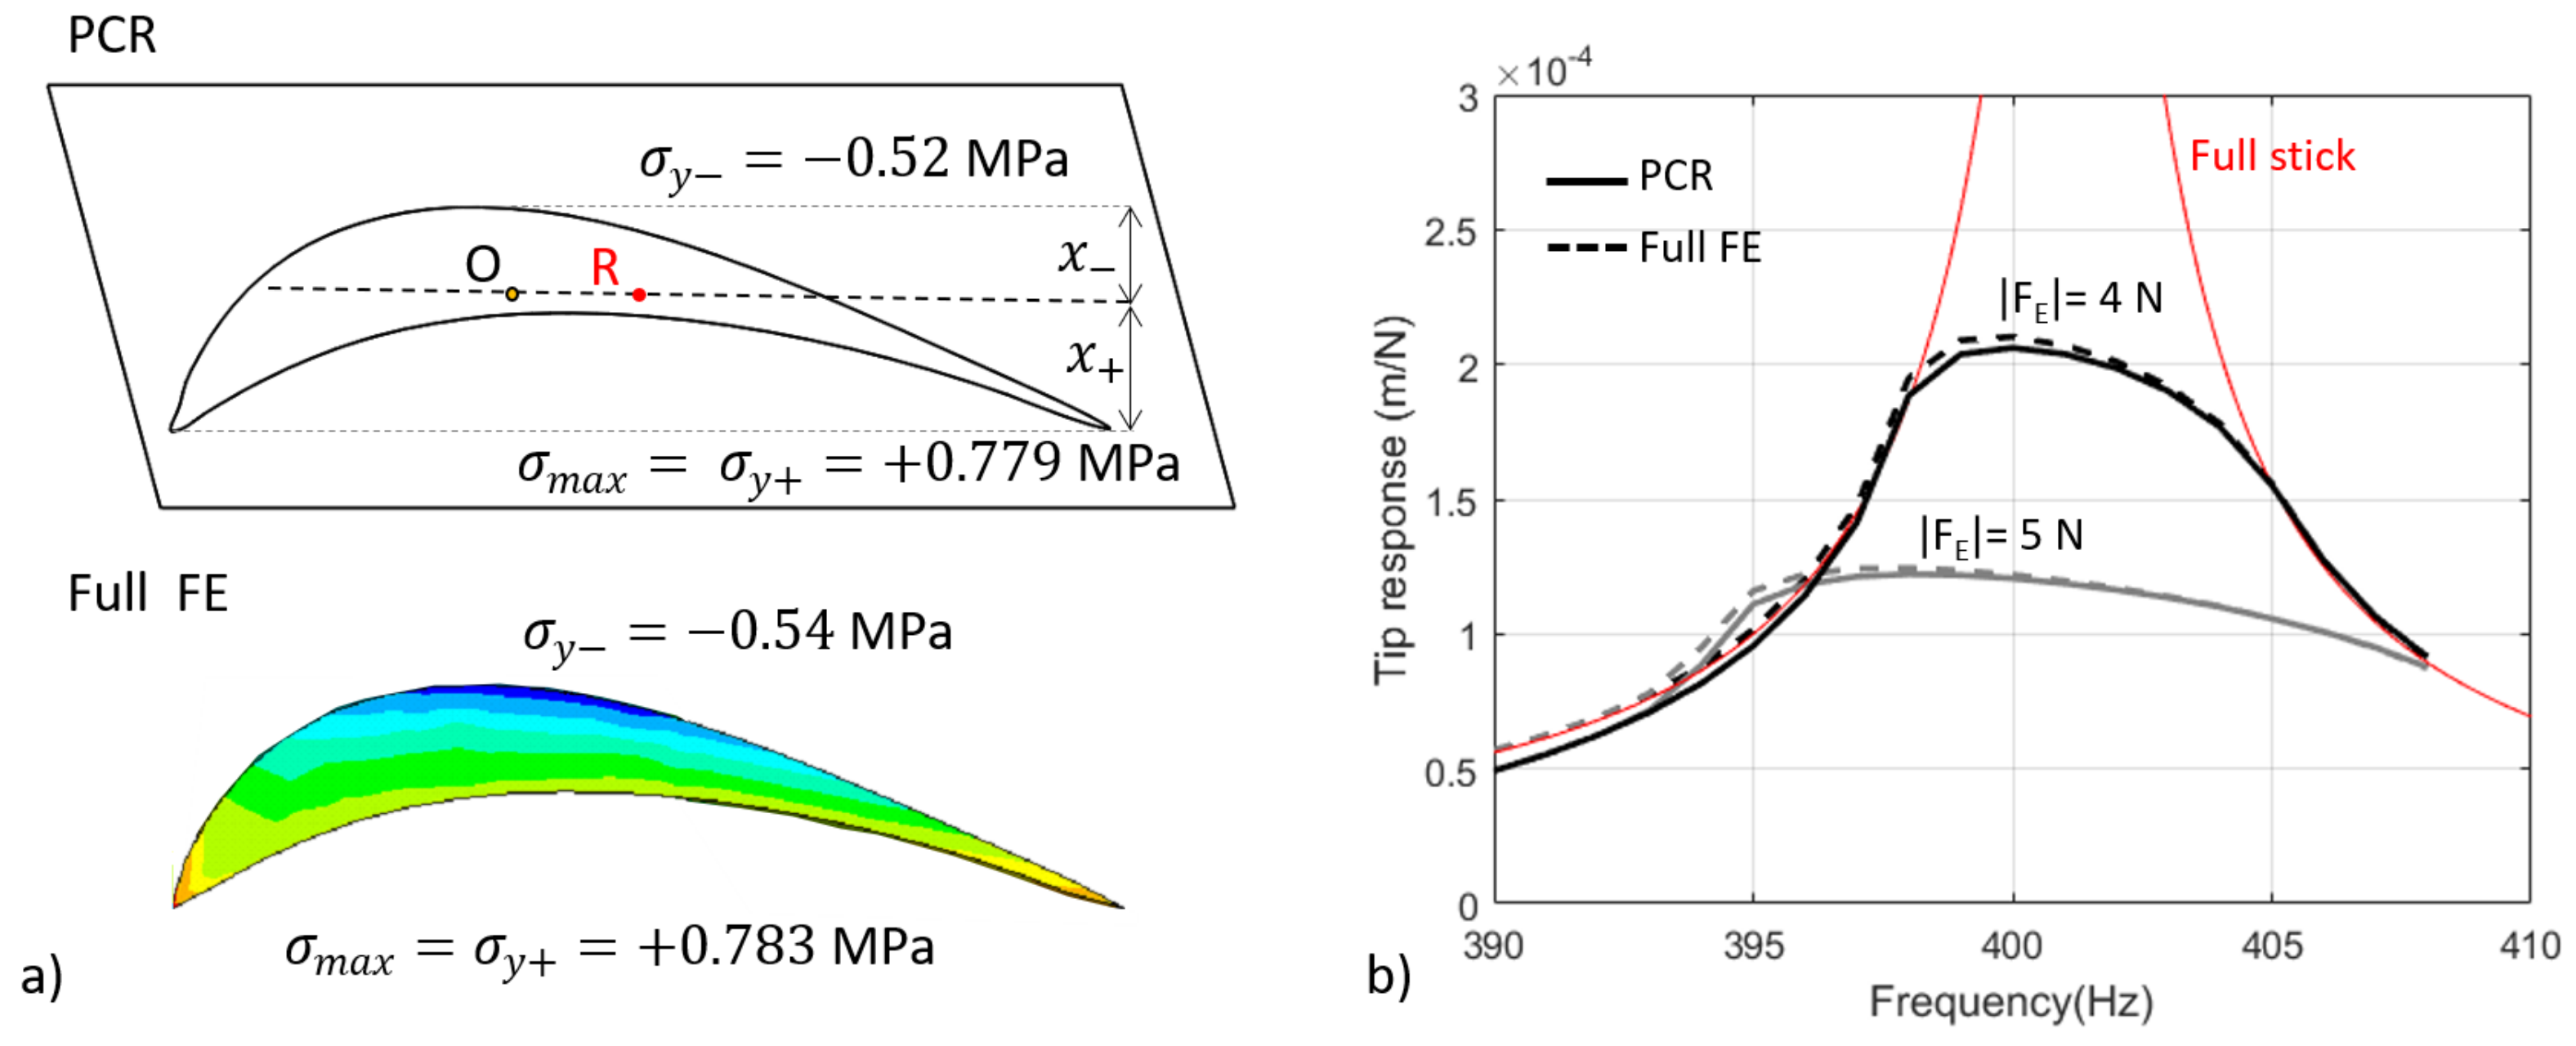
The full FE model allows displacements (static and modal) to be determined together with stresses at any location. The PCR model allows displacements to be calculated at any point which was predetermined on the airfoil (in our case, points E,A,B,C are the essential ones) plus displacements and rotations at beam-end points. While knowledge of cross-sectional moments at point R produces nominal stresses including σ m a x at the airfoil root (see Figure 3a), which is the maximum stress location for the first mode of vibration with and without damper. For the sake of the comparison shown in Table 1, radial stresses are taken 1 mm above the airfoil–platform junction to avoid the influence of the notch effect dependent on the local fillet radius, a factor to be determined separately.
Finally, the equivalence between PCR and full FE has been further confirmed by comparing the results of the PCR model to those of the full FE model, shown in Figure 3b for two representative nonlinear response cases, i.e., under mid-length periodic excitation force F E having amplitude 4 and 5 N.

2.3. A Worked-Out Example of Application

Through the example illustrated in this section, we can understand the reason why the proposed method is effective in offering the designer indications regarding the most important trends and relationships between the design parameters and the performance of the system.
It should be noted that the validity of the proposed method is independent of the chosen blade–damper pair used as a test case. Further details on the test case used to produce the results shown in Figure 3b, Figure 4 and Figure 5 and Table 1 can be found in Section 3 (see Blade A).
As shown in Figure 3b, the nonlinear frequency response function changes the location and value of its maximum depending on the dynamic excitation here represented by the “proof” force F E . Providing an estimate of F E is not an easy task. If experimental data are available, methodologies typical of output-only methods [26], such as operational modal analysis may be used to estimate the excitation levels starting from the recorded mode shape. However, predicting the actual operating conditions and linking them to the excitation level during the early design stage may not be possible. It is therefore convenient to monitor, at the present stage, blade–damper configurations as a function of the F E level and to rank them according to the maximum F E they can withstand before reaching their HCF limit.
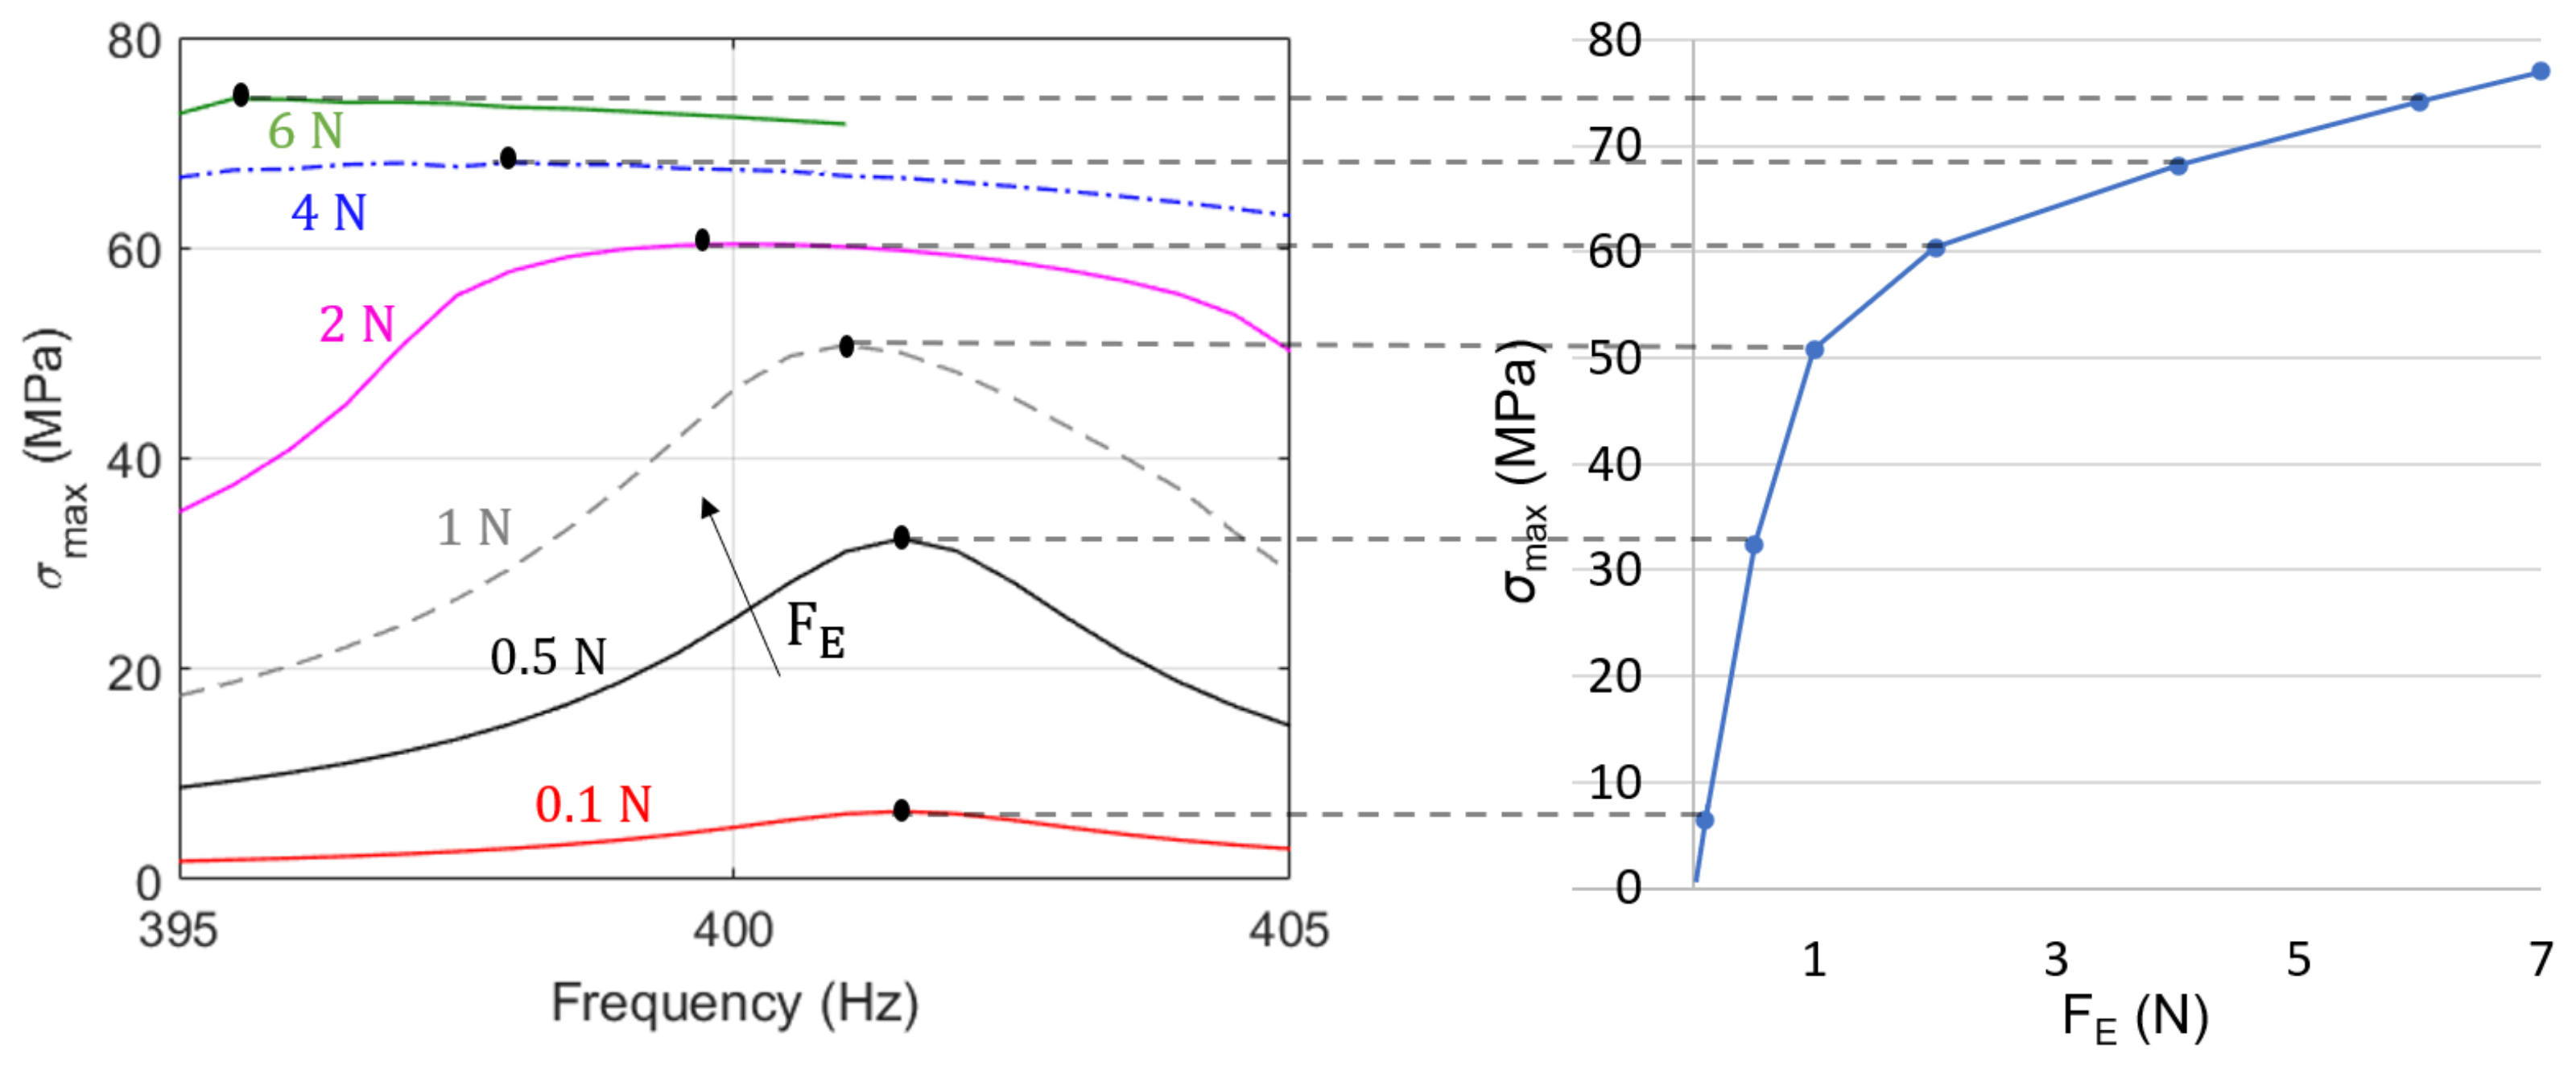
The left-hand portion of Figure 4 shows the results of the forced response in terms of maximum bending stress of the blade. The forced response is run for different excitation levels F E ranging from 0.1 N to 6 N. It is convenient to condense the information on the location of the peak of the different responses (see black points in Figure 4) in terms of frequency and stress amplitude. The right-hand portion of Figure 4 tracks the stress amplitude of the peak as a function of the excitation level F E .
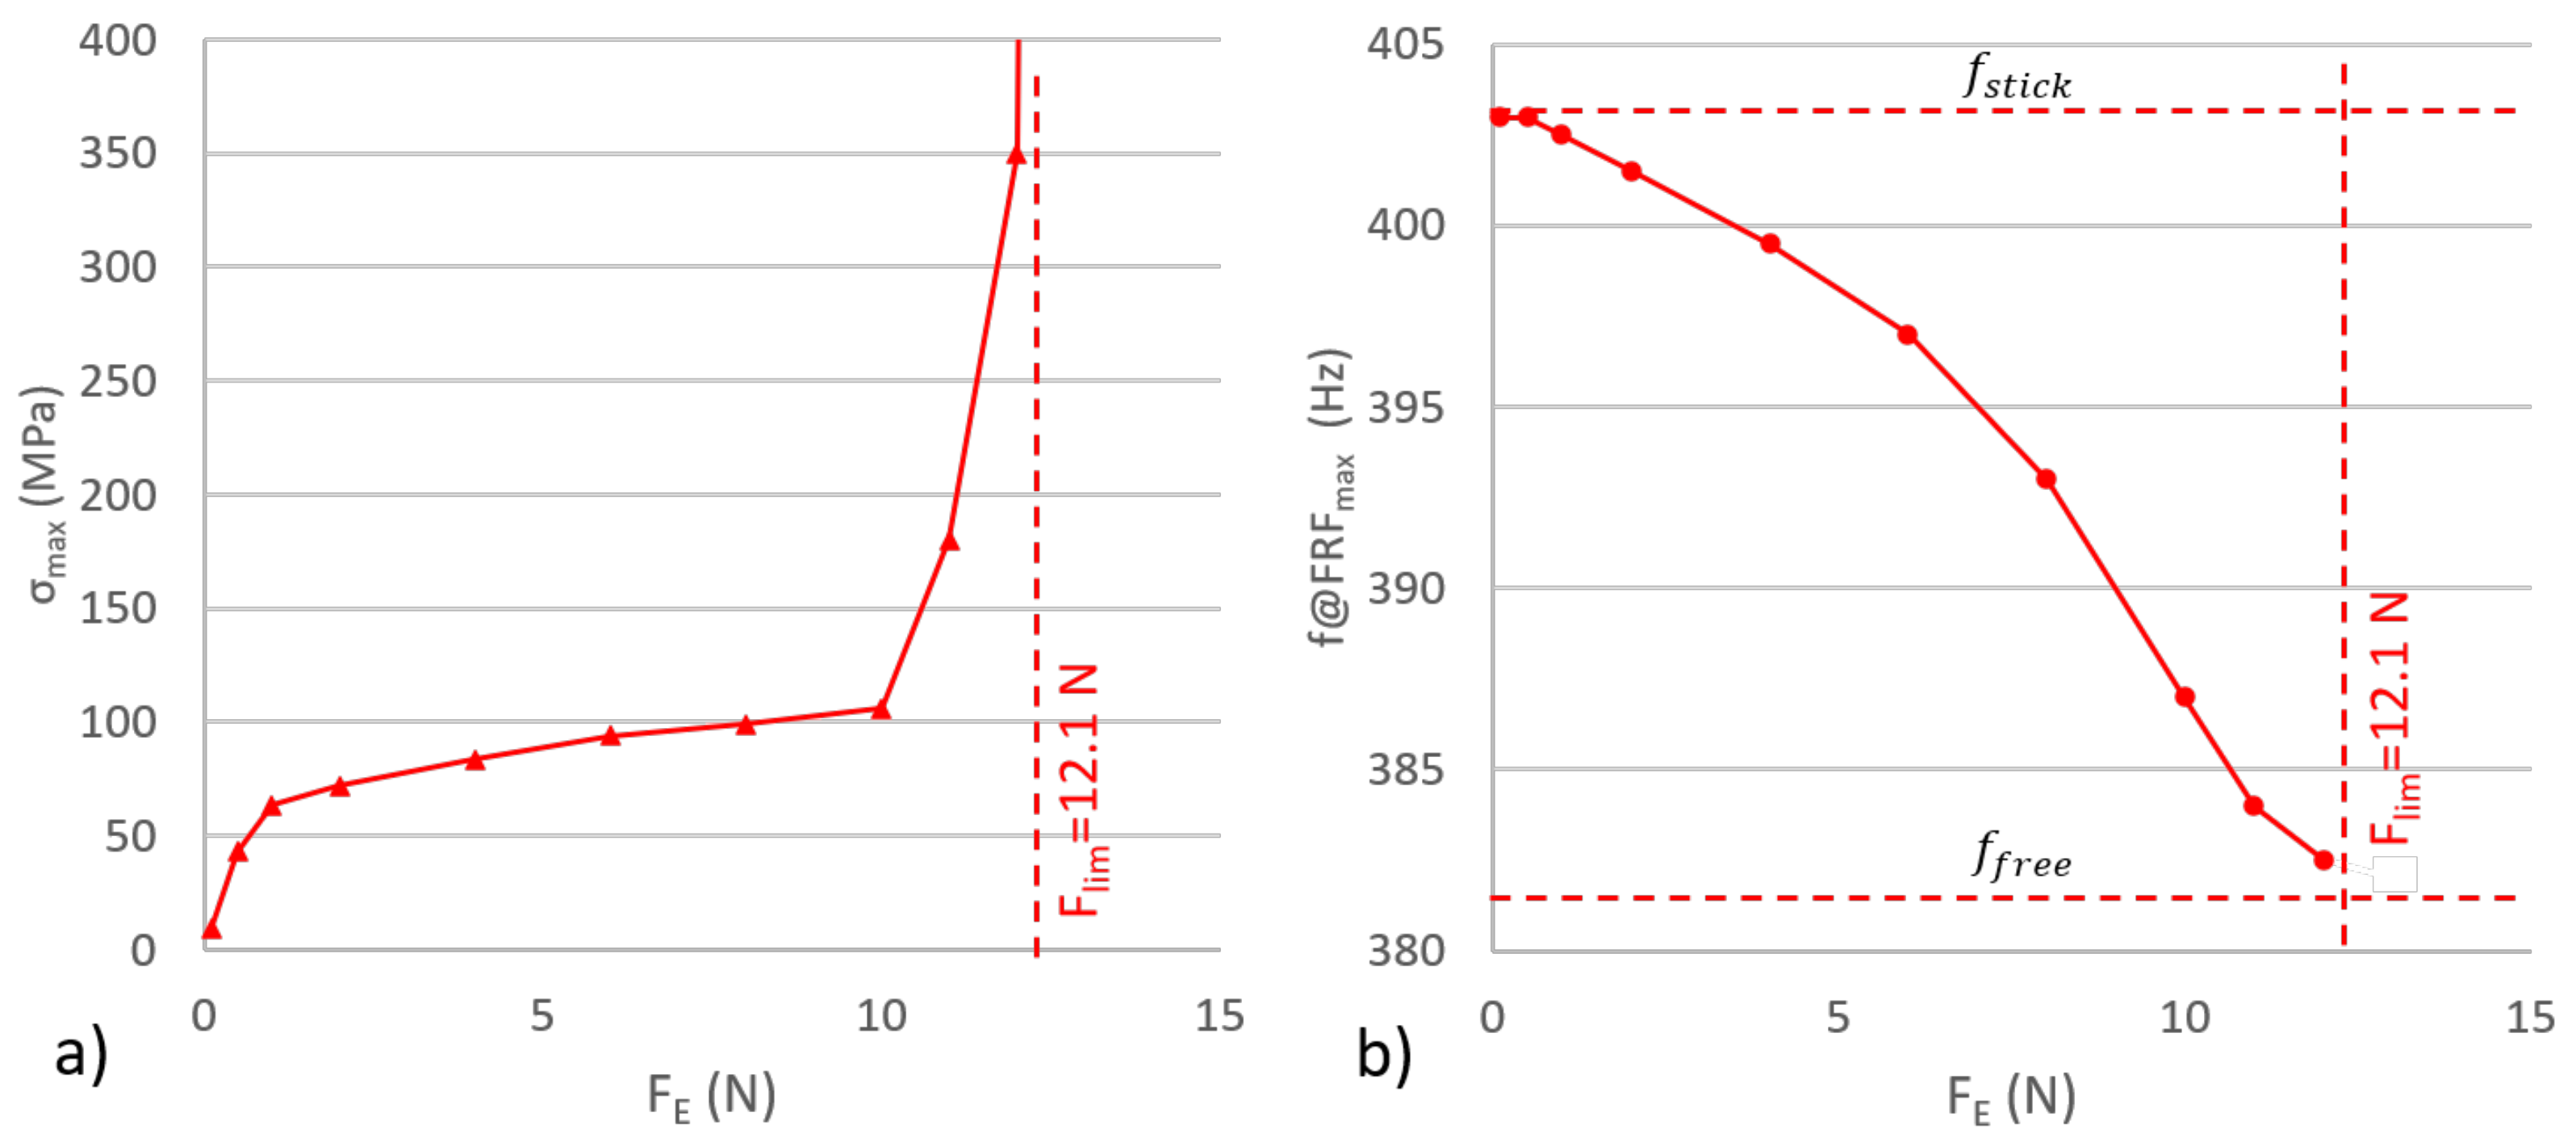
Figure 5a shows why it is convenient to perform the same “tracking” procedure for an extended range of F E values. Figure 5b adds the frequency for the FRF maximum. The curve in Figure 5a can be split into three regimes:
  • Stick/Microslip: the resonance frequency is close to f s t i c k , the (low) hysteretic damping prevails and the stress levels are growing ≈ linearly with F E .
  • Gross Slip: the resonance frequency is lower than f s t i c k but still higher than f f r e e . This is the preferred working condition, dominated by friction and not by hysteretic damping. The stress levels still increase with a constant rate; however, the slope of the F E σ m a x curve is significantly lower if compared with the one detected at regime 1.
  • Advanced gross slip: the resonance frequency is close to f f r e e as the damper slides freely between the platforms for the majority of the period of vibration. At the level of a single contact point, it can be observed that the distance traveled by the damper with respect to the platform in stick condition is negligible (i.e., lower by more than one order of magnitude) with respect to the distance traveled in slip. In this condition, friction becomes incapable of dissipating the input energy, as already observed by [27]. This regime is once again dominated by hysteretic damping, which is typically low. As a result, the slope of the F E σ m a x starts increasing exponentially. It can be argued that the higher the value of this F E limit value, the better the matching between blade and damper.

2.4. A Priori Estimate of the Excitation Limit Force

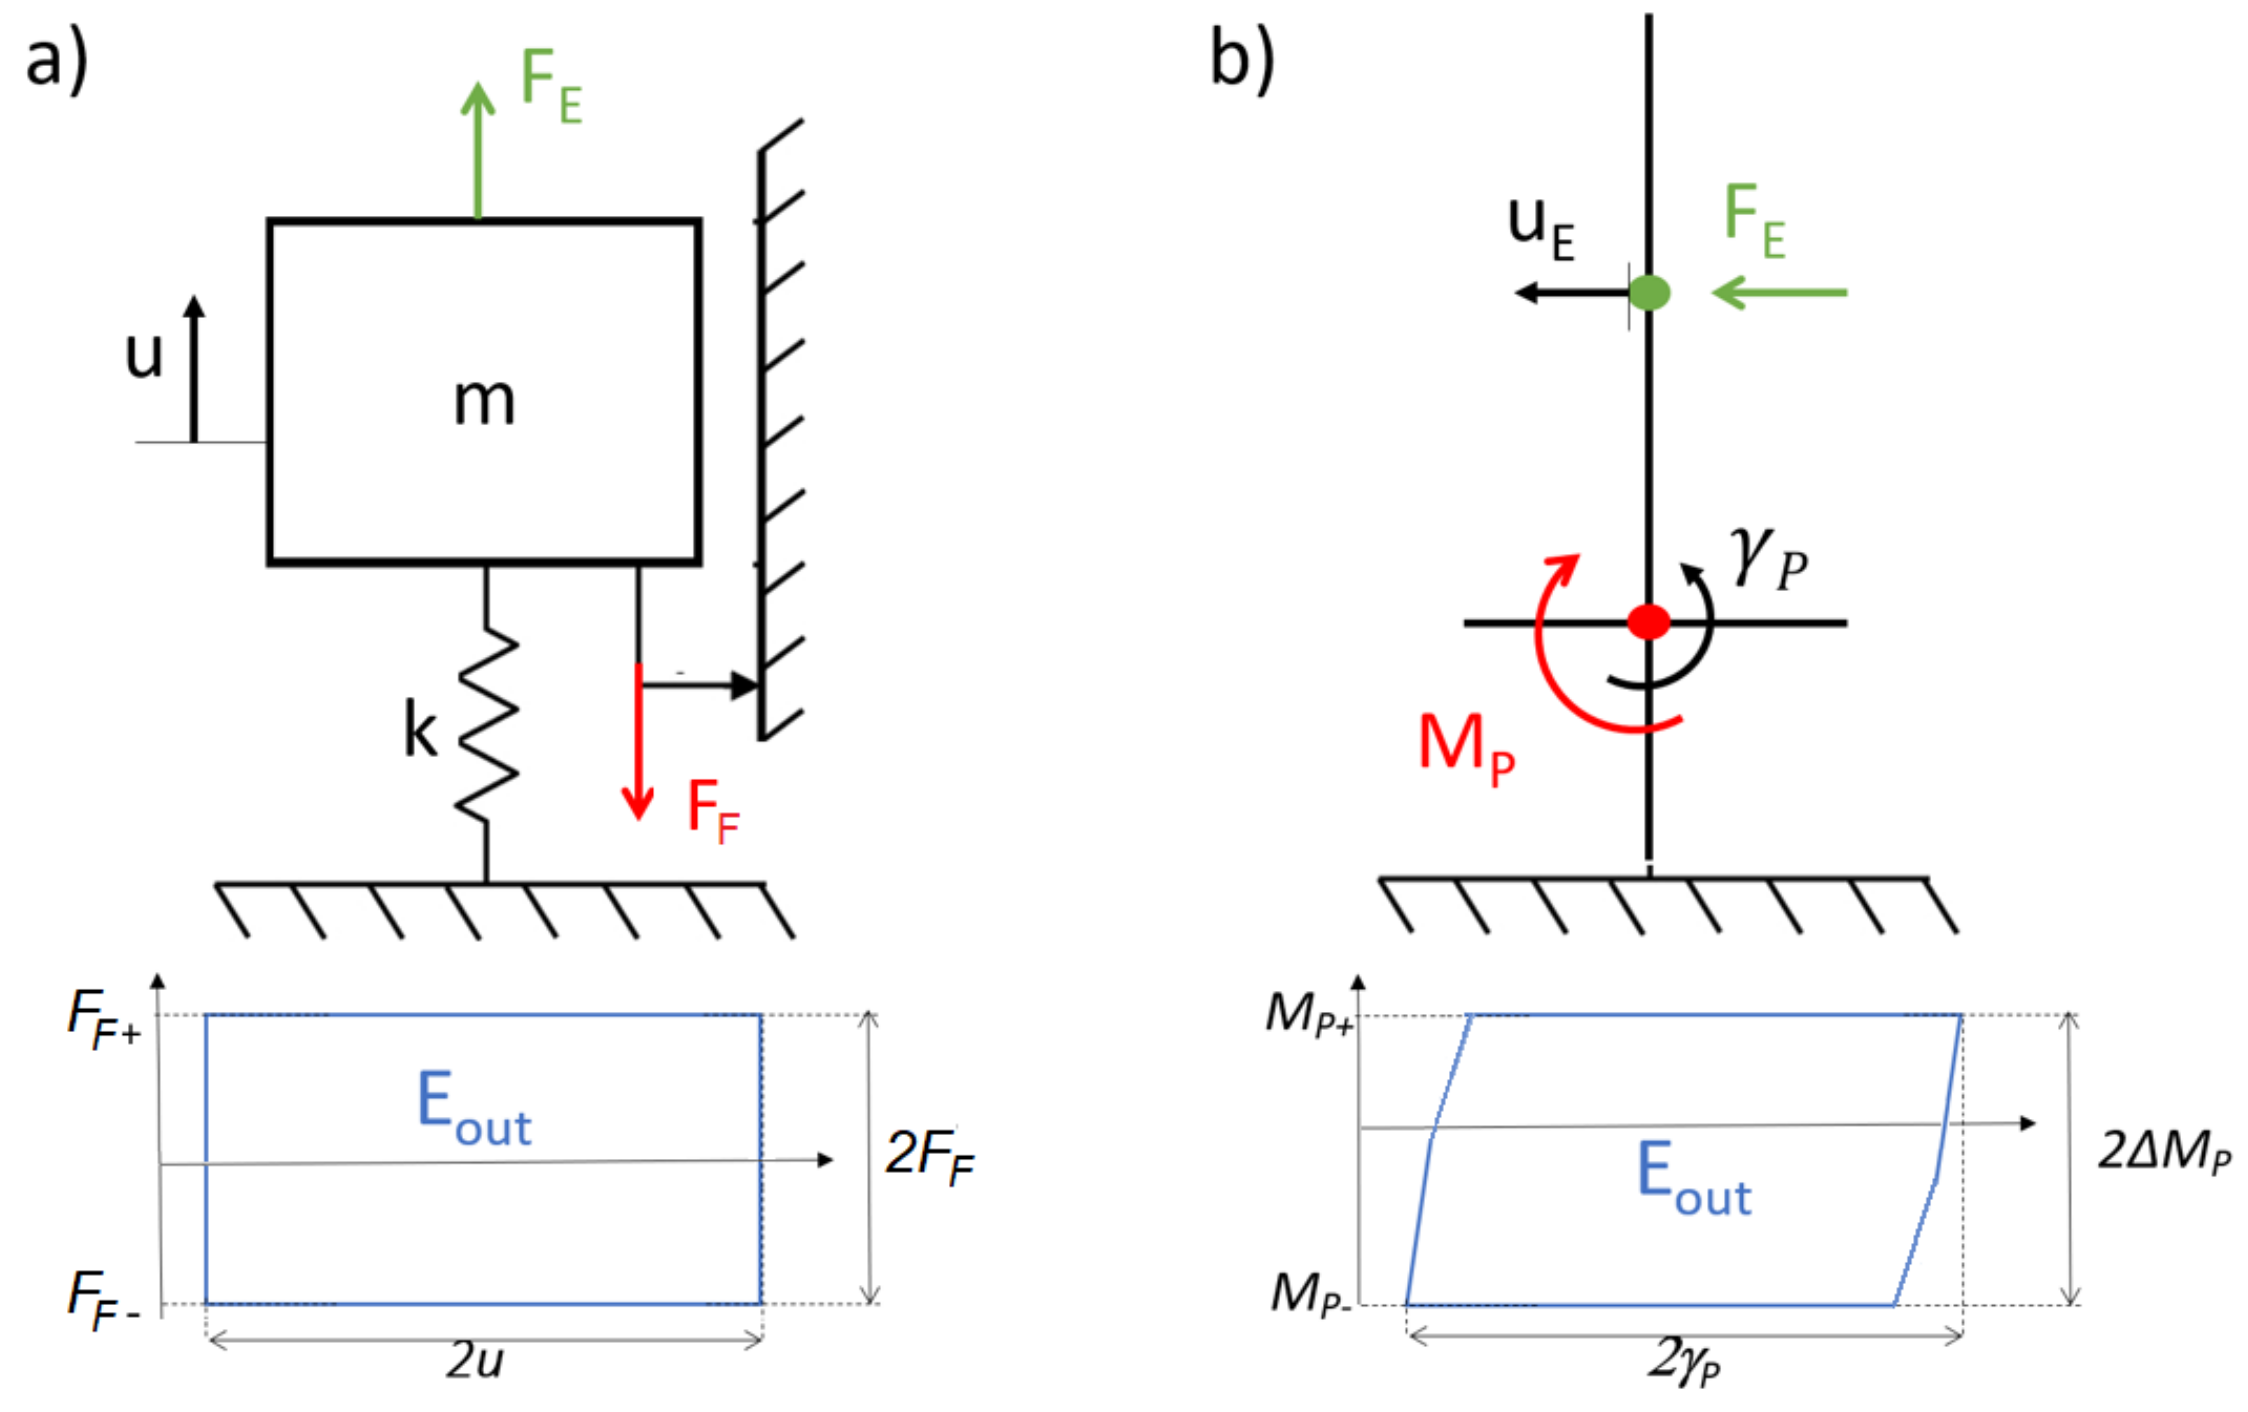
The combined analysis of Figure 5a,b reveals the presence of an upper limit value for the excitation force, here called F l i m , for which the damper ceases to be effective and the blade frequency (and mode shape) tends to its free-standing value. Being able to estimate a priori the limit force F l i m , without resorting to nonlinear calculations, is undoubtedly a huge asset for blade–damper designers. The concept of limit excitation force is not new. In 1930, Den Hartog [27] remarked that, in the case of a single mass-spring system (Figure 6a), when the ratio between the energy dissipated by a constant friction force F F over a sliding range of 2 u ( E o u t = 4 · F F · u ) and the energy injected in the system by the external sinusoidal excitation E i n = π · F E · u falls below one, i.e., F F / F E π 4 , the amplitude of motion of the system will grow infinitely large (limited only by hysteretic damping if present).
This limit is valid for any friction damped system; however, its expression needs to be corrected if multiple DoFs are present. Indeed, when f f f r e e , the mode shape tends to that of the free standing blade. It is therefore possible to express the displacement u E of point E, as a function of the rotation of the platform γ P using the quantity u E , f r e e / γ P , f r e e , readily available through the computation of the eigenvector of the free-standing blade corresponding to the mode of interest (the first in the present case). Therefore, when the system tends to the free vibration condition:
E i n = π · F E · u E = π · F l i m · γ P u E , f r e e γ P , f r e e
E o u t = η · 4 · Δ M P · γ P
where:
  • E o u t is the area within the γ P M P hysteresis cycle shown in Figure 6b;
  • η is an efficiency coefficient < 1 due to the fact that, unlike the Den Hartog case, the cycle area is reduced due to the non-infinite stiffness of the tangential contact; however, at resonance, the gross-slip part prevails and η 1 .
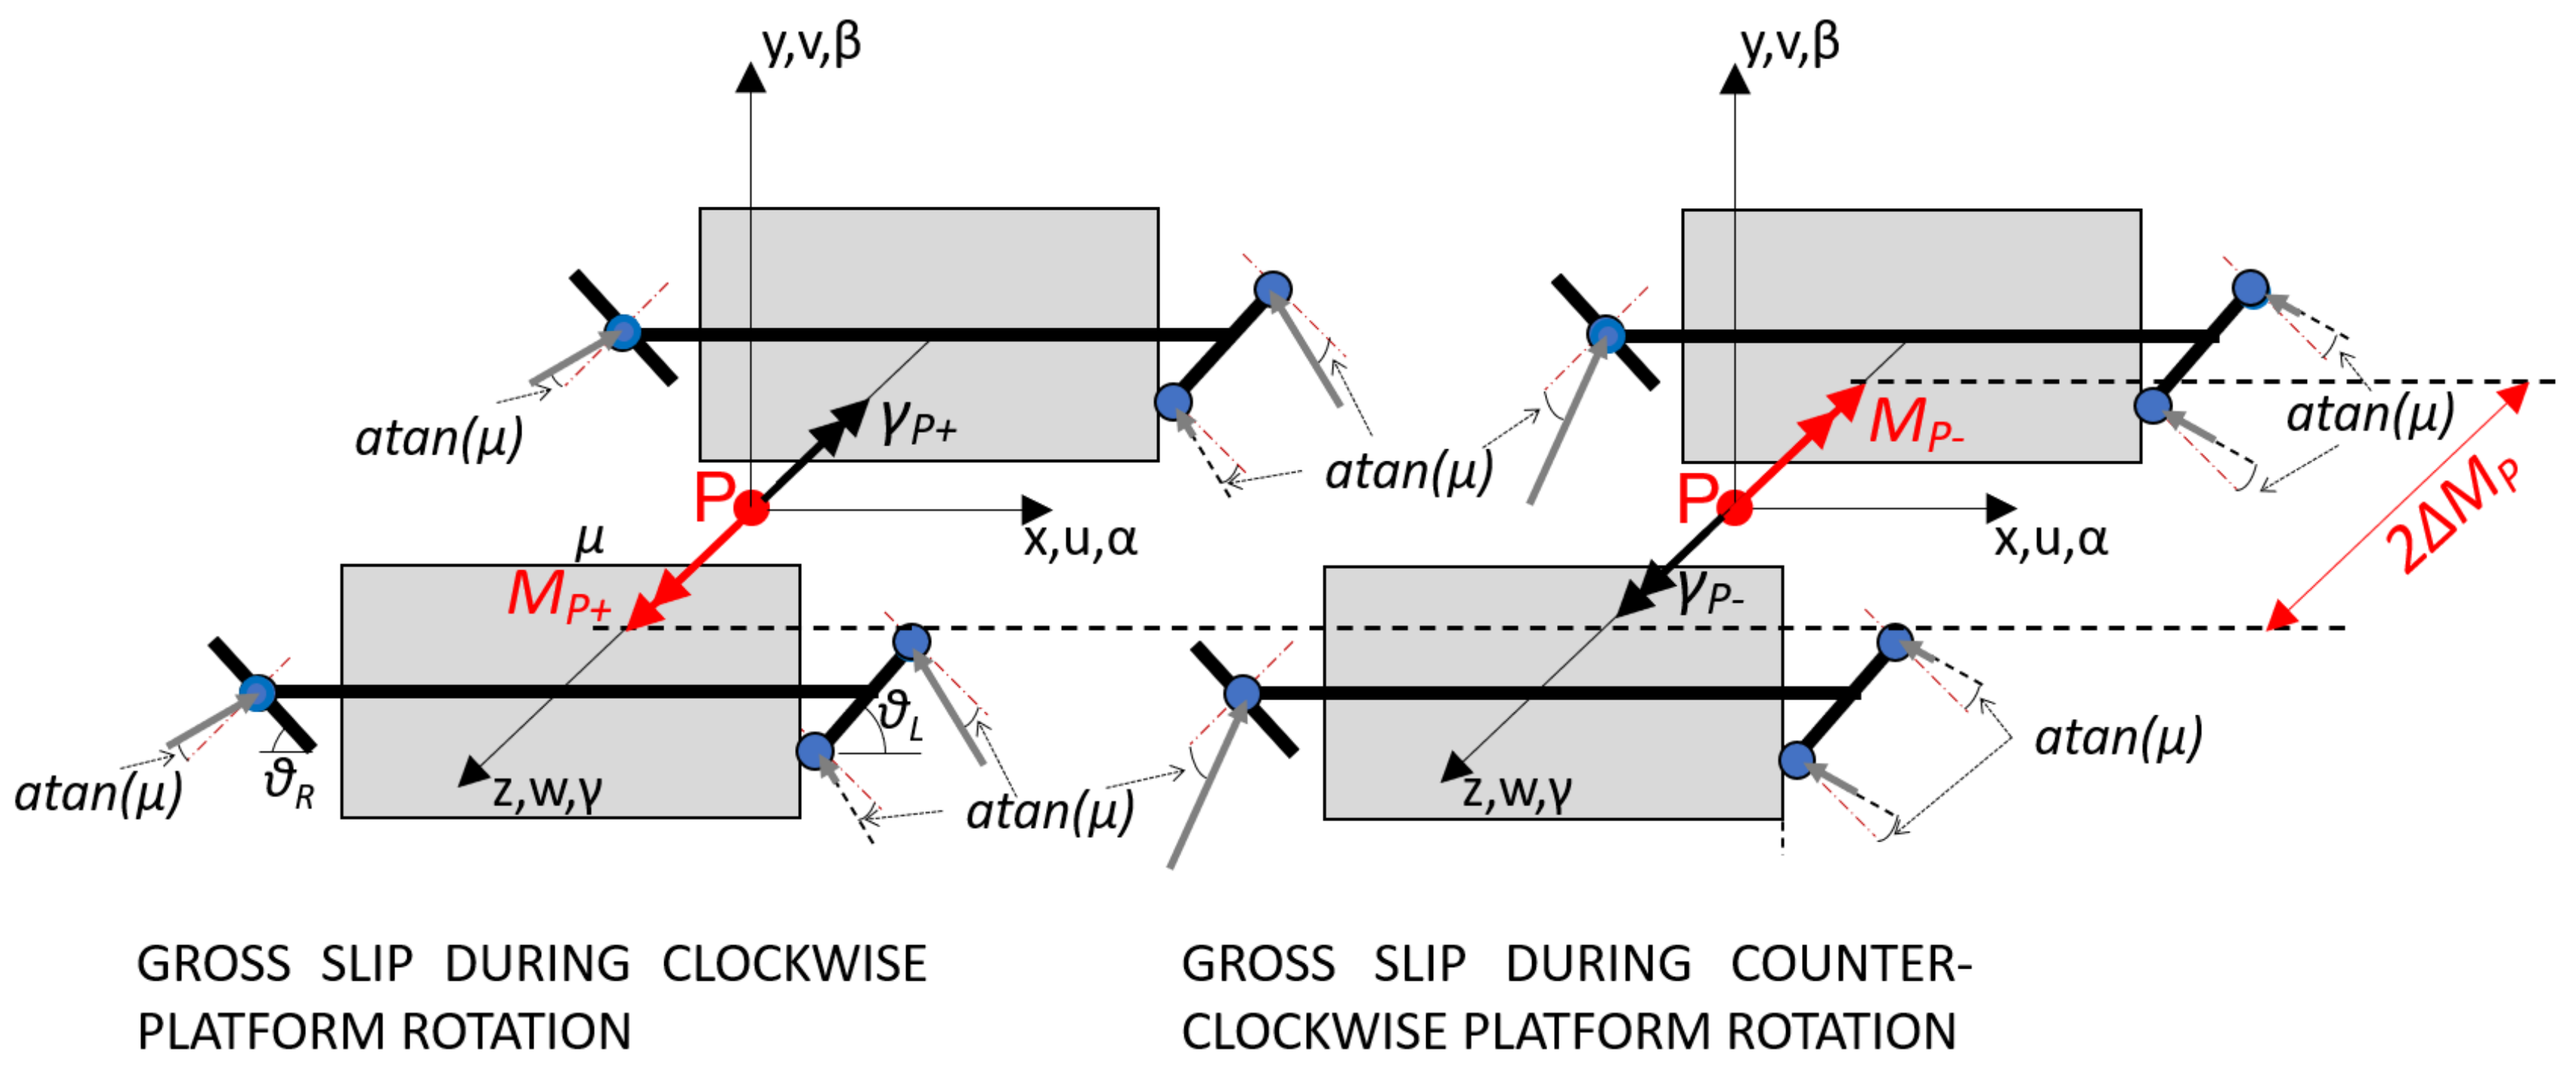
The moments of the contact forces about point P are, see Figure 7, M P + during clockwise rotation γ P + and M P during counter-clockwise rotation γ P . However, what matters here is the amplitude 2 Δ M P = M P + M P .
It should be noted that the gross slip limits M P + and M P are simple functions of the gross-slip contact forces, then of platform angles θ L and θ R , the friction coefficient μ , the centrifugal load on the damper [23]. As an example, with reference to the simplified 2D representation shown in Figure 8 valid for a pure bending mode, one can express M P + as:
M P + = ( | F L 1 + · ( x L 1 x P ) | + | F L 2 + · ( x L 2 x P ) | ) cos ( θ L arctan ( μ ) ) | F R + · ( x R x P ) | cos ( θ R + arctan ( μ ) ) + | F L 1 + · ( y L 1 y P ) | sin ( θ L arctan ( μ ) ) | F L 2 + · ( y L 2 y P ) | sin ( θ L arctan ( μ ) )
Finally, F l i m can be written as:
F l i m = 4 Δ M P π u E , f r e e γ P , f r e e
Through a very straightforward linear procedure, Equation (4) can easily be extended to cases other than a single “proof” excitation force.

3. The Test Cases

This section presents the two blades used as demonstrators within this paper. Their CAD models are shown in Figure 9, while their relevant dimensions and features for the first bending mode of vibration are reported in Table 2. Both blades are modeled after real turbine blades known to the authors. Blade A represents a blade from the last-stage of an aircraft Low Pressure Turbine (LPT), while Blade B is modeled after a turbine for power generation. Apart from the overall size, Blade A is more slender, as reflected by the higher L n / h n ratio. Another relevant difference is the L a / L n ratio, higher in the case of Blade B. This results in significant differences in the free-standing mode shape (check u E , f r e e / γ P , f r e e values in Table 2).
Both blades are equipped with the same pre-optimized damper cross-section shape [21] and are tested for the same In-Phase mode of vibration. Contact parameters (contact stiffness values and friction coefficients) necessary for the simulation are taken from experiments recounted in [21,22,28].

4. Representation and Interpretation of Results

This section applies the PCR method described in Section 2 to illustrate its results in the case of two damper-blade combinations characterized by very different dimensions, and how their suggested graphical representation effectively supports the analysis (and helps to draw conclusions) about blade–damper coupling. To this purpose:
  • the neck length L n is assigned the values (20,30) mm to explore the influence of neck flexibility, which bears on the blade mode shape; it is worth noting that the stiffness and mass matrices of the PCR blade are parametrically linked to L n , and no re-meshing procedure is required;
  • the centrifugal load on the damper is assigned its nominal value C F * and 0.5 · C F * ; the 0.5 scaling factor is compatible with a realistic 50% reduction of the mass of the damper (e.g., by removing the lower portion not in contact with the blades) or with a 30% reduction of the disk rotational speed.
The evaluation of the best match between the different possible combinations for the two blade sizes is based on the method that leads to Figure 5a and its interpretation.
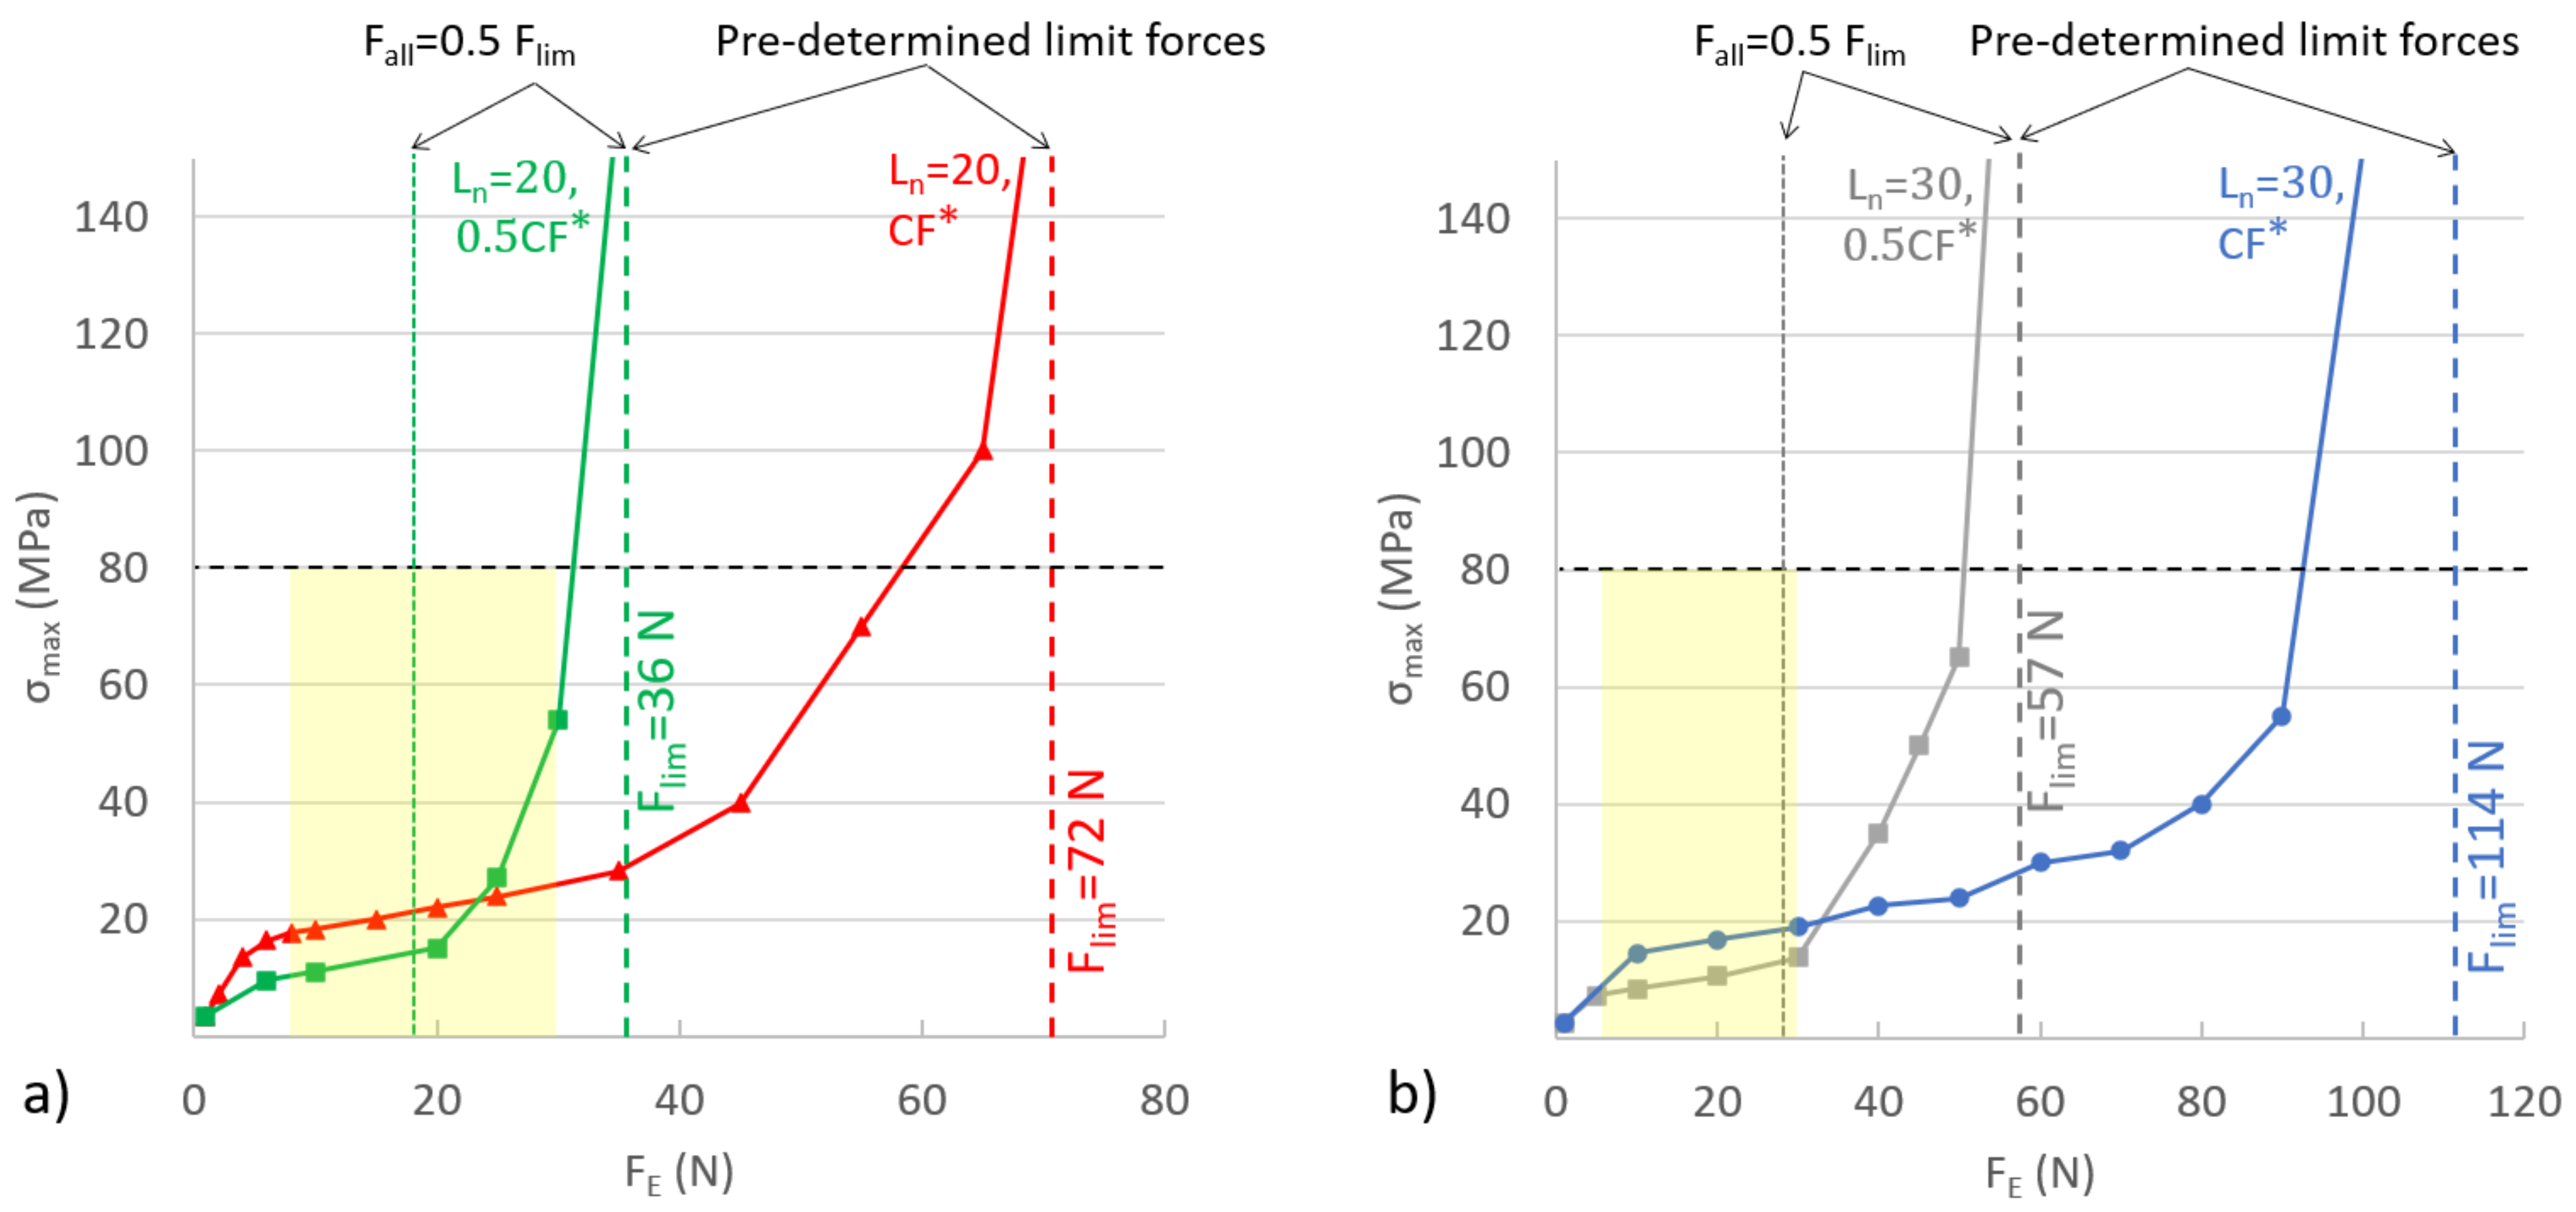
Preliminarily, it should be noticed that the diverging trend followed by the curves as they approach the respective F l i m asymptote is obtained here by calculating the nonlinear response for F E = 0.9 F l i m . However, the corresponding points are not visible in Figure 10 and Figure 11 as the stress level is well above the 150 MPa value chosen for the representation. The cross-comparison of Figure 10 and Figure 11 allows us to put into evidence what follows.
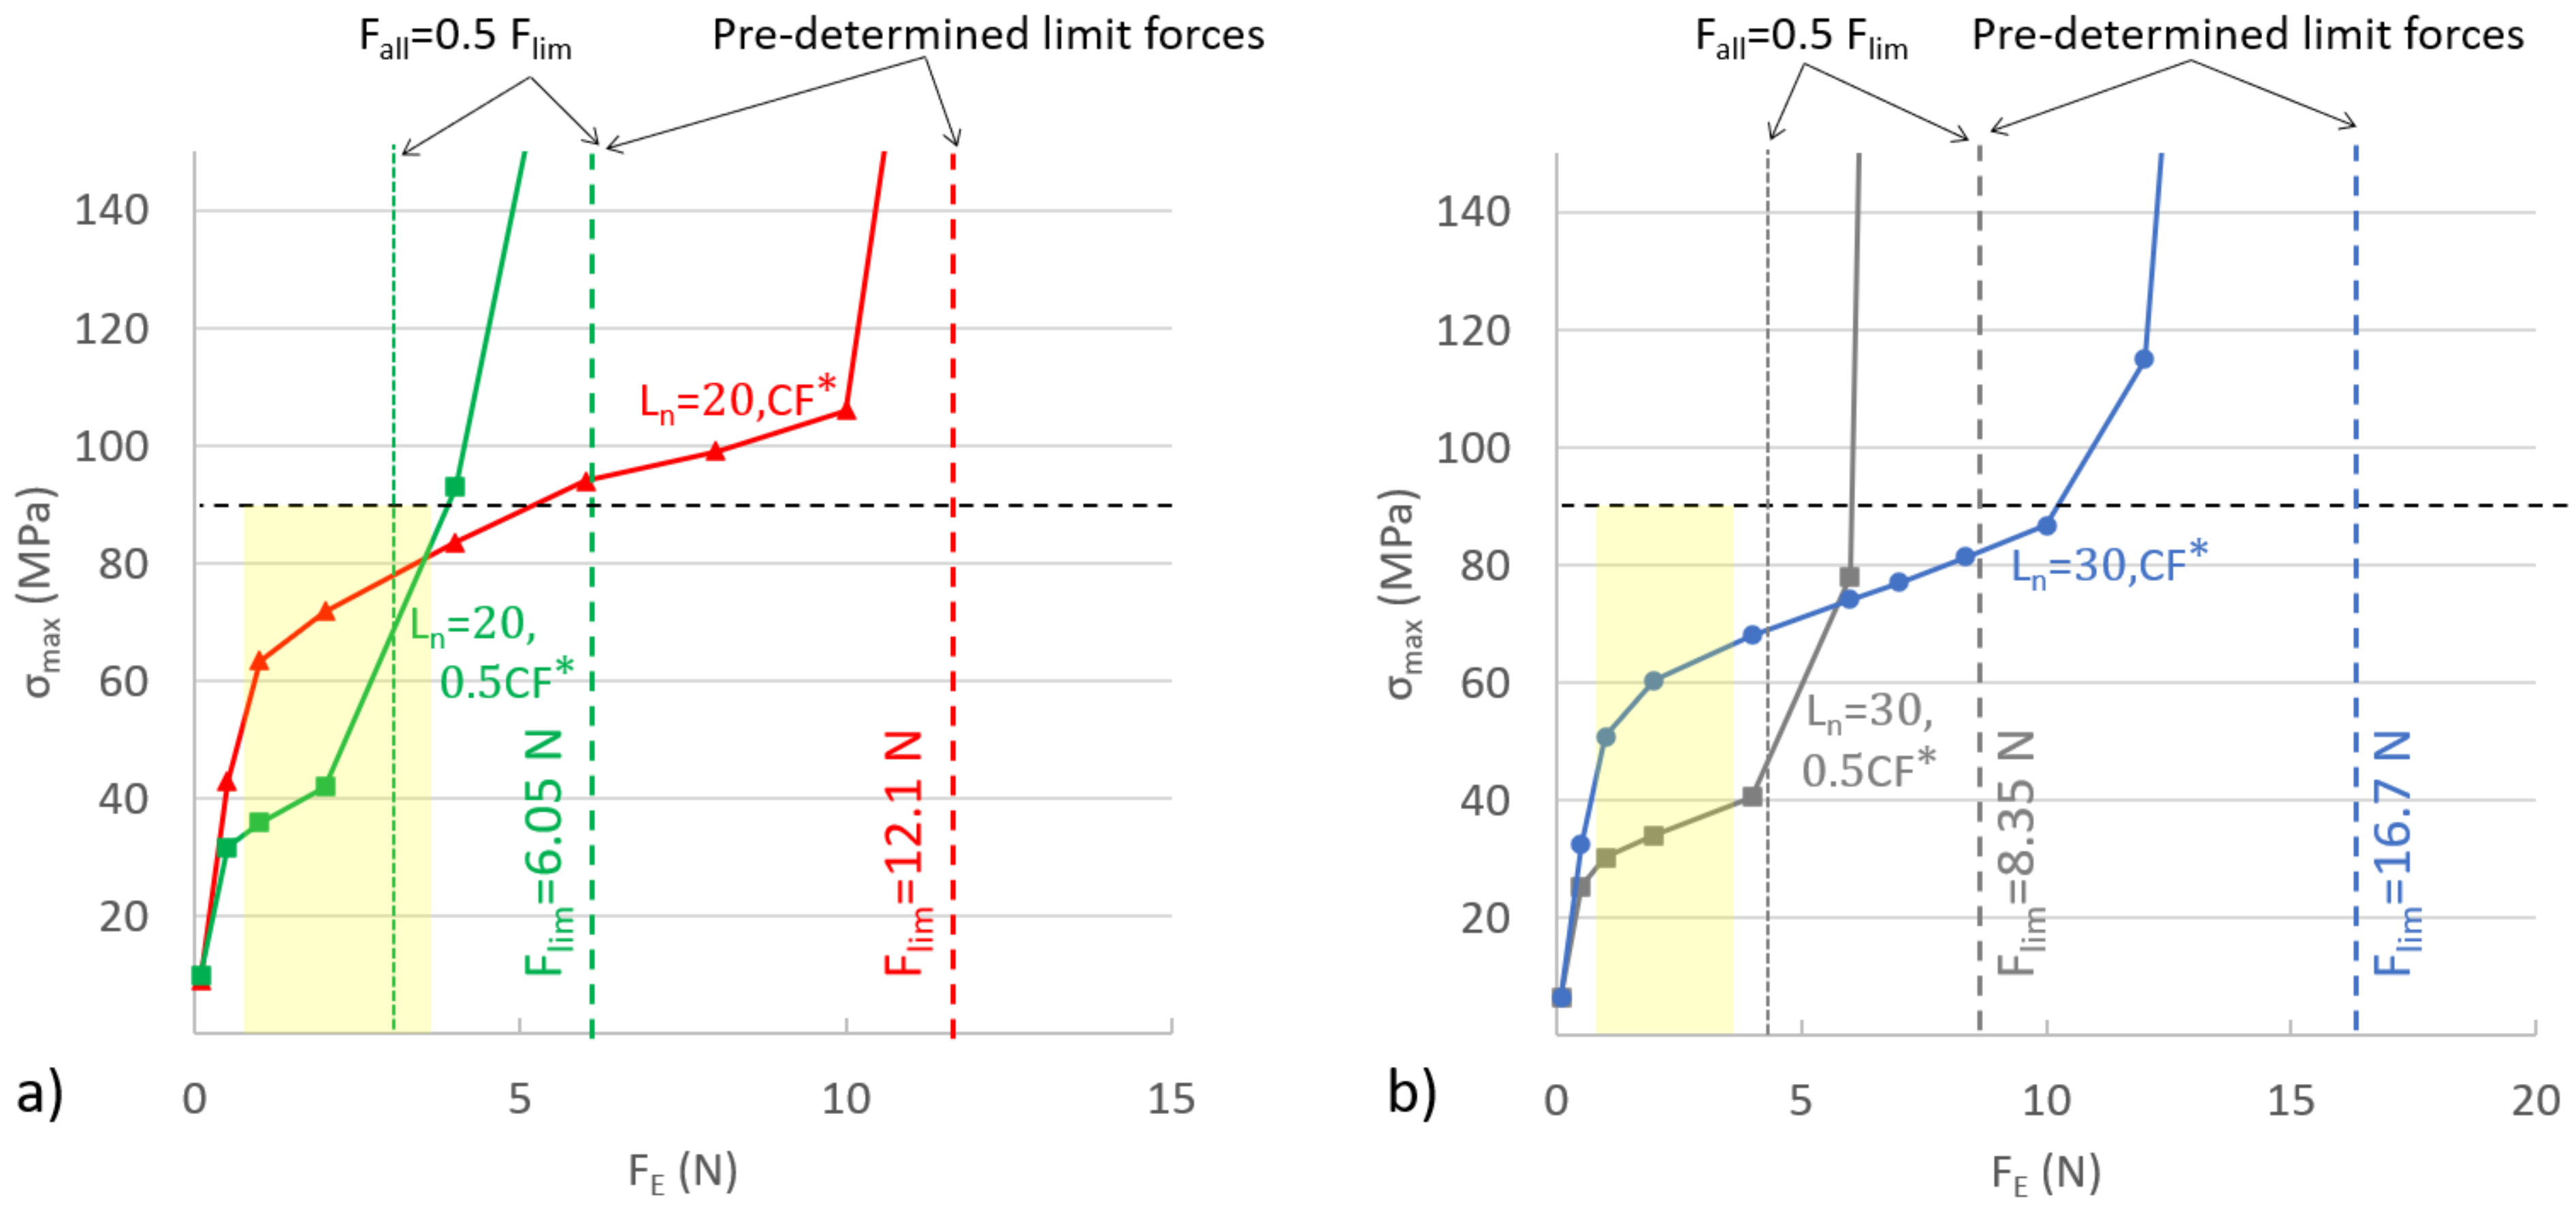
  • For both blades A and B, a longer, more flexible, neck is always beneficial: the limit “proof” excitation force F l i m is higher and the maximum fatigue bending stresses σ m a x are lower than in the case of a shorter neck through the whole F E span. This is mainly due to the fact that the ratio γ P , f r e e / u E , f r e e is larger (i.e., the platform rotation is larger for the same displacement at the excitation point) when the neck is more flexible. In the present case, the values of this ratio range from 2.5 to 3.5 for blade A, from 0.8 to 1.3 for blade B. It must be remembered that the damper’s capability for In Phase blade vibration increases with the amount of rotation of the platform.
  • The consequence of reducing the C F value looks more complex, due to the curve crossing, but is readily justified. In effect, since in full sliding all the forces are proportional to the value of C F , so are those of the frictional moment Δ M P and of F l i m . Thus, with a reduced C F , the asymptote is reached earlier. However, on the other hand, regardless of C F , the initial full stick section on the curve is mostly determined by the stick constraint between damper and platform, which is independent on neck length. Since the first slip initiation in one of the contacts occurs for a lower contact force, the curve for smaller C F breaks off from full stick at a lower F E value than that for higher C F . This combination necessarily produces the intersection of curves.
A first criterion for judging the effectiveness of the damper in relation to the blade is certainly the F l i m limit value of the “proof” excitation force, which must be kept away from danger through a safety factor. In Figure 10 and Figure 11, allowable limits F a l l are tentatively set at 50% of F l i m . They are based on the observation that in the curves for the lowest values of C F = 0.5 C F * , and 0.5 F l i m corresponds to the beginning of the steeper asymptotic slope. A caveat to avoid misunderstandings: due to this choice, the F a l l = 0.5 F l i m for C F = C F * happens to coincide with the F l i m for the C F = 0.5 C F * .
However, second criterion, it is also necessary to judge the exciting forces by the alternating fatigue stresses they produce. Figure 10 and Figure 11 show on the ordinates a maximum stress information (dotted line), which is a key parameter, being directly linked to the HCF safety of the blade. The procedure used to estimate the allowable nominal bending stress σ a , b e n d is based on the airfoil data shown in Table 3 and is thoroughly described in the following paragraphs.
Table 3 summarizes the relevant data for both blades. In the same line adopted in [24,25], the variable part of the excitation force due to flow irregularities is a sinusoidal component whose amplitude is estimated within the limits of 1% to 5% of the nominal aerodynamic force on the blade.
Blade A, already presented in [24,25], has a circumferential force at 60 N and a bending component at 73 N; hence, the two limits for the time-variable bending force amplitude are 0.7 and 3.5 N, respectively.
Blade B, scaled for the same velocity triangles, has a circumferential force at 490 N, a bending component at 590 N, hence 1% to 5% limits for the bending force amplitude at 5.9 and 30 N, respectively.
From data on Table 3, for Blade A—at an airfoil temperature of 650 °C—the 10 6 cycles alternating fatigue limit of René 41 is set at about 205 MPa, the constant mean stress is at σ m = 120 MPa, which times the stress intensity factor K f gives a constant maximum stress at the junction with the platform (due to the centrifugal force on the airfoil cross-section) at 180 MPa. According to the Goodman line on the Haigh diagram, the 10 6 alternating fatigue limit at that constant maximum stress is about 170 MPa, which divided times K f and a 1.3 safety factor gives an allowable nominal bending stress rounded at σ a , b e n d = 90 MPa.
Similarly for Blade B—at an airfoil temperature of 450 °C—the 10 6 cycles alternating fatigue limit of René 80 is set at about 940 MPa, the constant mean stress is at σ m = 100 MPa, which multiplied by the stress intensity factor K f is 150 MPa and gives the constant maximum stress at the junction with the platform. According to the Goodman line on the Haigh diagram, the 10 6 alternating fatigue limit at that constant maximum stress is about 155 MPa, which divided times K f and a 1.3 safety factor gives an allowable nominal bending stress at σ a , b e n d = 80 MPa.
The constant bending effect of the blade due to constant aerodynamic force is not introduced here because the centroid line of the blade can be tilted slightly forward of the radial line, thus making it possible to design for a centrifugal bending stress which cancels that aerodynamic bending component.
It is easily seen in Figure 10 that, for the smaller blade A, the shorter neck (20 mm) is always problematic: for both dampers ( C F * and 0.5 C F * ), the 5% excitation gives a maximum nominal bending stress at 90% of its limit, but, for 0.5 C F * (Figure 10a), the excitation force F E is slightly above (is about 60% of) the corresponding F l i m , while, for C F = C F * , it is, of course, just 30%. The situation is slightly better for the longer 30 mm neck (Figure 10b), where the corresponding values are respectively 44 and 22%. This blade–damper match is a quite balanced design against both limit stresses and limit excitation force.
On the contrary, in the case of the much larger blade B (Figure 11) in the whole 1–5% span of the excitation forces, the limit on the excitation force F E largely dominates: in the 1–5% excitation span, the bending stresses at the airfoil root are always lower than 25% of the σ a , b e n d limit. Then, this blade–damper match is designed against the limit excitation force.
However, it must be noticed inside the lower part of the excitation span, the nominal bending stresses in blade A, with the shorter neck and damped at C F = 0.5 C F * , amount to about 50 ÷ 60% of those for the 100% damper (i.e., C F = C F * ), the advantage being extended to the whole range in the case of the longer neck. In the case of blade B, the reduction is slightly less pronounced. However, in all the cases examined here, the 1–5% excitation range coincides with the F E range in which the 50% damper has an advantage over the 100% damper, thus recommending the choice of the lighter damper.

5. Platform-Centered Reduction into the Larger Picture

The results presented in Section 2 and Section 4 prove that concentrating all nonlinearities in the rigid body DOFs of the platform point P and of the damper center of mass D is an accurate and effective modeling choice. Namely, it draws attention to essential features of the blade–damper dynamic system such as the existence of a limit excitation force (Section 2.4) and the interaction between the most important design parameters and the resulting stress levels.
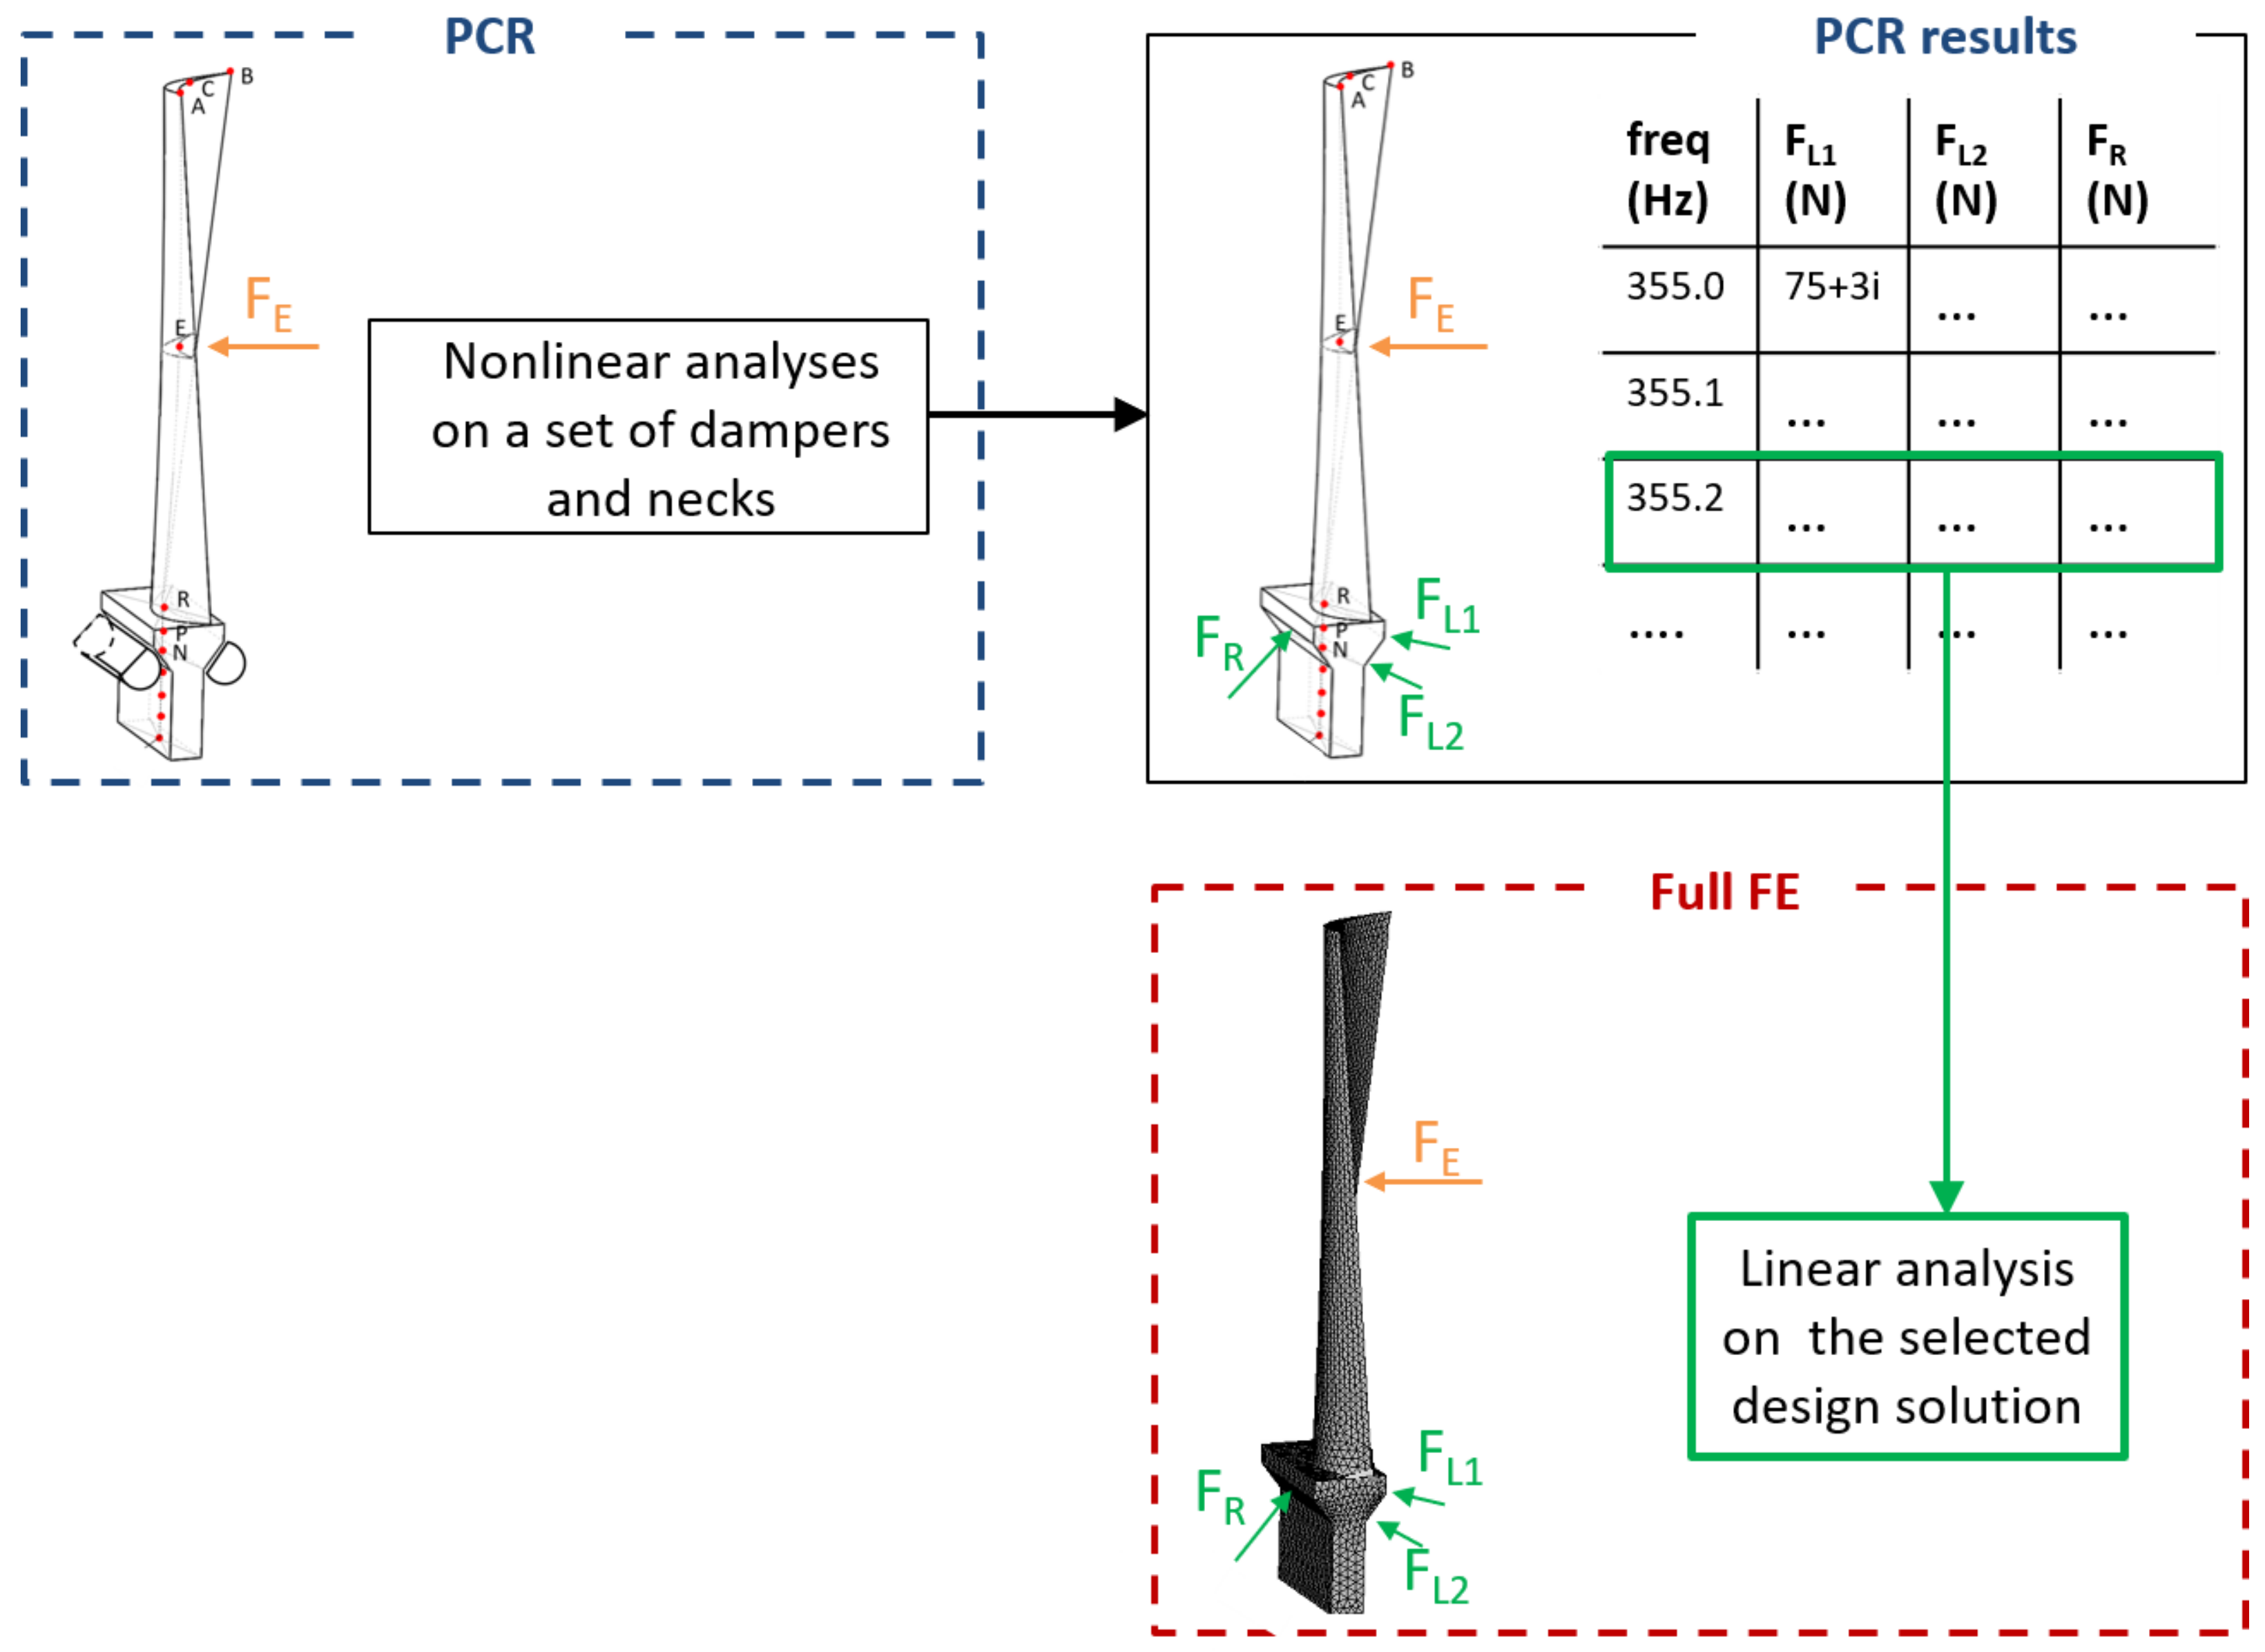
The purpose of this section is to highlight the advantages of the PCR in terms of computational effort. As shown in Figure 12, this modeling choice produces a set of 12 nonlinear equations concentrated at points P and D, regardless of the chosen number of contact points, which cease to be nonlinear degrees of freedom. The PCR method has shown that, for applications where contact occurs between structures or portions of structures behaving as rigid bodies, it is possible to drop the proportionality between the number of contact points and the size of the system. This challenging task has been undertaken in the past with numerical reduction techniques [20,29,30] based on purposely developed projection bases. In this context, PCR configures as an alternative in which the limit on the number of contact points is inherently overcome. Another significant advantage of the PCR is that the «time to result» is reduced both by the size of the system and by the fact that a smaller system needs fewer iterations to reach convergence.
Nevertheless, the PCR should not be intended as a substitute for a full nonlinear FE calculation, when it is a must to take into account the complete geometry of the bladed disk to offer a complete stress map at all points on the blade. A solution to the need of exploring different design configurations, while, at the same time, running a full FE nonlinear analysis, has been met by the use of a reduced surrogate model trained on data obtained through a Box–Behnken sampling of the design space [7]. As shown in Figure 13, we suggest here, instead, to use the PCR method to isolate a few optimized blade–damper configurations. These configurations will then be screened by a final full FE linear analysis. In fact, once contact forces have been calculated with the PCR, they can be fed ex-post into the full FE model excited with the corresponding force(s) and frequency. This workflow ensures the determination of displacements and stresses at all points on the blade with a straightforward linear solution, which can be used both for final design/certification purposes and as an ultimate check on the accuracy of the PCR.

6. Conclusions

After having illustrated the rationale of the PCR method, it was shown how it must be applied in order to choose the most convenient coupling between a blade with given airfoil, but having a neck of variable flexibility, and a damper type invariable in shape but variable in mass and therefore in centrifugal force.
For greater adherence to concrete needs in the design phase, the method was applied to two models of turbine blades, conforming to real cases but of very different sizes.
Overall, the authors are confident to claim the following advantages of the PCR to the computation:
  • it is computationally inexpensive to change the shape and size of neck and damper and damper when exploring different design configurations (no remeshing required);
  • the PCR runs in a fraction of the time needed for the customary Full FE nonlinear forced response calculation;
  • the PCR’s synthetic representation makes it possible to easily observe the presence of an excitation limit force beyond which the damper becomes ineffective and to predict its value through a simple formula;
  • once contact forces have been calculated with the PCR, they can be fed ex-post into the Full FE model excited with the corresponding force(s) and frequency, to allow the determination of all displacements and stresses with a straightforward linear solution.
Moreover, the claims about the advantages of the PCR to the designer are:
  • the ”Platform-Centered Reduction” is proved to be effective in offering indications to the designer on the most important trends and relationships between the design parameters and the performance of the system;
  • the very fact of concentrating all nonlinearities in the rigid body DOFs of the platform makes it easy to draw attention to the essential: the interaction between the kinematics of the platform (+ neck) and the airfoil;
  • the proposed representation of the outcomes of the procedure in terms of a “designer’s diagram” which shows maximum bending stress on the airfoil against excitation force at resonance proves to effective as an engineering development tool;
  • by way of an engineering application in the design phase, this was demonstrated for two blade sizes showing the effect of varying both the neck length and the damper centrifugal force.

Author Contributions

Conceptualization, C.G. and M.M.G.; methodology, C.G. and M.M.G.; software, C.G.; validation, C.G. and M.M.G.; writing—original draft preparation, C.G.; writing—review and editing, M.M.G.; supervision M.M.G. All authors have read and agreed to the published version of the manuscript.

Funding

This research received no external funding.

Conflicts of Interest

The authors declare no conflict of interest.

References

  1. Griffin, J. Friction Damping of Resonant Stresses in Gas Turbine Engine Airfoils. J. Eng. Power 1980, 102, 329. [Google Scholar] [CrossRef]
  2. Szwedowicz, J. Cyclic Finite Element Modeling of Shrouded Turbine Blades Including Frictional Contacts. Volume 4: Manufacturing Materials and Metallurgy: Ceramics: Structures and Dynamics: Controls, Diagnostics and Instrumentation: Education: IGTI Scholar Award: General. In Turbo Expo: Power for Land, Sea, and Air; ASME: New York, NY, USA, 1999. [Google Scholar] [CrossRef]
  3. Sextro, W. The Calculation of the Forced Response of Shrouded Blades with Friction Contacts and its Experimental Verification. Volume 4: Structures and Dynamics. In Turbo Expo: Power for Land, Sea, and Air; ASME: New York, NY, USA, 2000. [Google Scholar] [CrossRef]
  4. Pourkiaee, S.M.; Zucca, S. A Reduced Order Model for Nonlinear Dynamics of Mistuned Bladed Disks With Shroud Friction Contacts. In Proceedings of the ASME Turbo Expo 2018: Turbomachinery Technical Conference and Exposition. Volume 7C: Structures and Dynamics, Oslo, Norway, 11–15 June 2018; ASME: New York, NY, USA, 2018. [Google Scholar] [CrossRef]
  5. Zucca, S.; Firrone, C.M.; Gola, M.M. Numerical assessment of friction damping at turbine blade root joints by simultaneous calculation of the static and dynamic contact loads. Nonlinear Dyn. 2011, 67, 1943–1955. [Google Scholar] [CrossRef]
  6. Pesaresi, L.; Salles, L.; Jones, A.; Green, J.; Schwingshackl, C. Modelling the nonlinear behaviour of an underplatform damper test rig for turbine applications. Mech. Syst. Signal Process. 2017, 85, 662–679. [Google Scholar] [CrossRef] [Green Version]
  7. Hüls, M.; von Scheidt, L.P.; Wallaschek, J. Influence of Geometric Design Parameters Onto Vibratory Response and HCF Safety for Turbine Blades With Friction Damper. Volume 7C: Structures and Dynamics. In ASME Turbo Expo 2018: Turbomachinery Technical Conference and Exposition; ASME: New York, NY, USA, 2018. [Google Scholar] [CrossRef]
  8. Petrov, E.P. Stability Analysis of Multiharmonic Nonlinear Vibrations for Large Models of Gas Turbine Engine Structures with Friction and Gaps. J. Eng. Gas Turbines Power 2016, 139. [Google Scholar] [CrossRef] [Green Version]
  9. Hartung, A.; Hackenberg, H.P.; Krack, M.; Gross, J.; Heinze, T.; von Scheidt, L.P. Rig and Engine Validation of the Non-Linear Forced Response Analysis Performed by the Tool OrAgL. Volume 7C: Structures and Dynamics. In ASME Turbo Expo 2018: Turbomachinery Technical Conference and Exposition; ASME: New York, NY, USA, 2018. [Google Scholar] [CrossRef]
  10. Fantetti, A.; Gastaldi, C.; Berruti, T. Modeling and Testing Friction Flexible Dampers: Challenges and Peculiarities. Exp. Tech. 2018, 42, 407–419. [Google Scholar] [CrossRef] [Green Version]
  11. Yang, B.D.; Menq, C.H. Characterization of Contact Kinematics and Application to the Design of Wedge Dampers in Turbomachinery Blading: Part 2—Prediction of Forced Response and Experimental Verification. J. Eng. Gas Turbines Power 1998, 120, 418. [Google Scholar] [CrossRef]
  12. Sextro, W. Dynamical Contact Problems with Friction–Models, Methods, Experiments and Applications; Habilitationsschrift, Lecture Notes in Applied Mechanics; Springer: Berlin/Heidelberg, Germany, 2002; Volume 3. [Google Scholar] [CrossRef]
  13. Gastaldi, C.; Gola, M. On the relevance of a microslip contact model for under-platform dampers. Int. J. Mech. Sci. 2016, 115–116, 145–156. [Google Scholar] [CrossRef]
  14. Armand, J.; Pesaresi, L.; Salles, L.; Schwingshackl, C.W. A Multiscale Approach for Nonlinear Dynamic Response Predictions With Fretting Wear. J. Eng. Gas Turbines Power 2016, 139, 022505. [Google Scholar] [CrossRef] [Green Version]
  15. Cardona, A.; Coune, T.; Lerusse, A.; Geradin, M. A multiharmonic method for nonlinear vibration analysis. Int. J. Numer. Methods Eng. 1994, 37, 1593–1608. [Google Scholar] [CrossRef]
  16. Grolet, A.; Thouverez, F. On a new harmonic selection technique for harmonic balance method. Mech. Syst. Signal Process. 2012, 30, 43–60. [Google Scholar] [CrossRef] [Green Version]
  17. Gastaldi, C.; Berruti, T.M. A method to solve the efficiency-accuracy trade-off of multi-harmonic balance calculation of structures with friction contacts. Int. J. Non-Linear Mech. 2017, 92, 25–40. [Google Scholar] [CrossRef]
  18. Krack, M.; Gross, J. Harmonic Balance for Nonlinear Vibration Problems; Springer International Publishing: Cham, Switzerland, 2019. [Google Scholar] [CrossRef]
  19. Baek, S.; Epureanu, B. Reduced Order Modeling of Bladed Disks With Friction Ring Dampers. In Proceedings of the ASME Turbo Expo 2016: Turbomachinery Technical Conference and Exposition. Volume 7A: Structures and Dynamics, Seoul, Korea, 13–17 June 2016; ASME: New York, NY, USA, 2016. [Google Scholar] [CrossRef]
  20. Gastaldi, C.; Zucca, S.; Epureanu, B.I. Jacobian projection reduced-order models for dynamic systems with contact nonlinearities. Mech. Syst. Signal Process. 2018, 100, 550–569. [Google Scholar] [CrossRef]
  21. Gastaldi, C.; Gola, M. Pre-optimization of Asymmetrical Underplatform Dampers. J. Eng. Gas Turbines Power 2016, 139, 012504. [Google Scholar] [CrossRef]
  22. Gastaldi, C.; Berruti, T.M.; Gola, M.M. The Relevance of Damper Pre-Optimization and its Effectiveness on the Forced Response of Blades. Volume 7B: Structures and Dynamics. In Turbo Expo: Power for Land, Sea, and Air; American Society of Mechanical Engineers: New York, NY, USA, 2017. [Google Scholar] [CrossRef]
  23. Gastaldi, C.; Gola, M.M. Criteria for Best Performance of Pre-Optimized Solid Dampers. ASME Turbo Expo 2018 Volume 7C: Structures and Dynamics. In Turbo Expo: Power for Land, Sea, and Air; ASME: New York, NY, USA, 2018. [Google Scholar] [CrossRef]
  24. Gastaldi, C.; Gola, M.M. Design Tools to the Best Coupling of Dry-Friction Solid Underplatform Dampers to Turbine Blades. Volume 7B: Structures and Dynamics. In ASME Turbo Expo 2019: Turbomachinery Technical Conference and Exposition; American Society of Mechanical Engineers: New York, NY, USA, 2019. [Google Scholar] [CrossRef]
  25. Gastaldi, C.; Gola, M.M. Platform-Centered Reduction: A Process Capturing the Essentials for blade–damper Coupled Optimization. J. Eng. Gas Turbines Power 2021, 143. [Google Scholar] [CrossRef]
  26. Sadhu, A.; Narasimhan, S.; Antoni, J. A review of output-only structural mode identification literature employing blind source separation methods. Mech. Syst. Signal Process. 2017, 94, 415–431. [Google Scholar] [CrossRef]
  27. Hartog, J. Forced vibrations with combined viscous and coulomb damping. Lond. Edinb. Dublin Philos. Mag. J. Sci. 1930, 9, 801–817. [Google Scholar] [CrossRef]
  28. Botto, D.; Lavella, M.; Gola, M.M. Measurement of Contact Parameters of Flat on Flat Contact Surfaces at High Temperature. Volume 7: Structures and Dynamics, Parts A and B. In ASME Turbo Expo 2019: Turbomachinery Technical Conference and Exposition; ASME International: New York, NY, USA, 2012. [Google Scholar]
  29. Zucca, S.; Epureanu, B. Bi-linear reduced-order models of structures with friction intermittent contacts. Nonlinear Dyn. 2014, 77, 1055–1067. [Google Scholar] [CrossRef]
  30. Mitra, M.; Zucca, S.; Epureanu, B. Adaptive Microslip Projection for Reduction of Frictional and Contact Nonlinearities in Shrouded Blisks. J. Comput. Nonlinear Dyn. 2016, 11, 041016. [Google Scholar] [CrossRef]
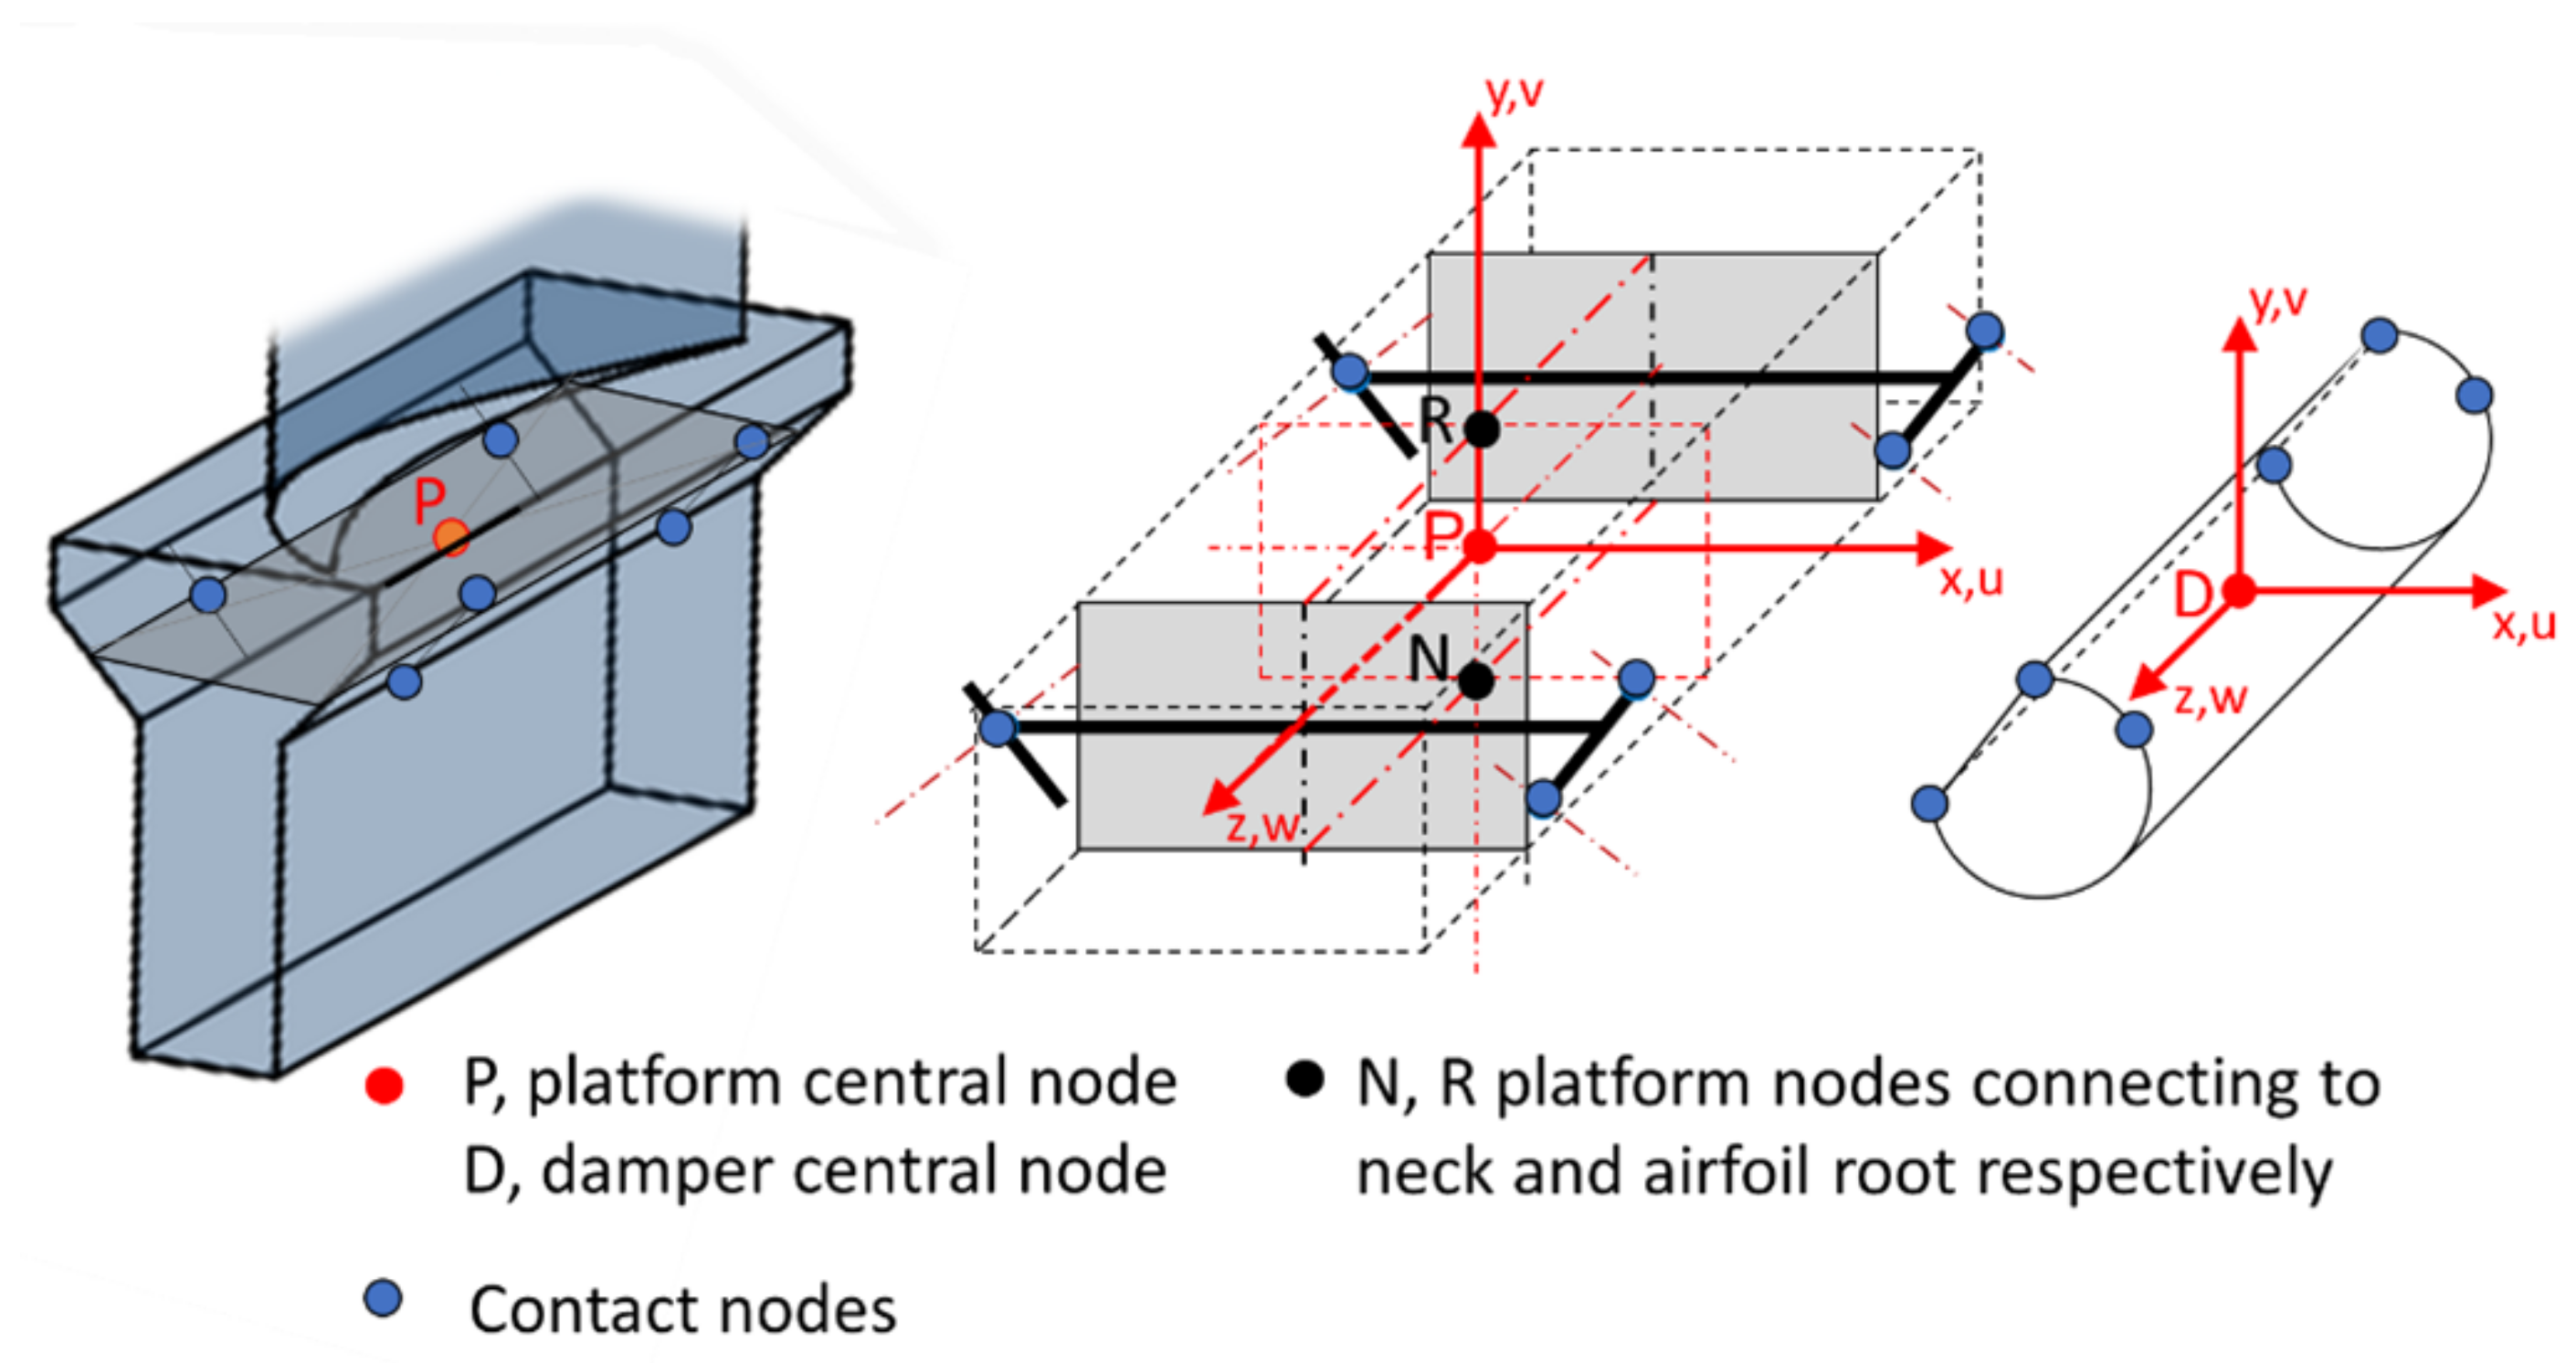
Figure 1. (Left) 3D view of the platform PCR representation through six DoFs (three displacements and three rotations) at point P. (Right) 3D view of the damper rigid body representation through six DoFs (three displacements and three rotations) at point D.
Applsci 11 05171 g001
Figure 2. (Left) Assembling procedure to build the PCR model. (Right) Full FE (ANSYS) model: used for tuning the PCR model and for a final linearized response check. Fixed boundary conditions are applied at the connecting end of both models.
Applsci 11 05171 g002
Figure 3. Full FE model vs. PCR model, Blade A. (a) Comparison of stresses at airfoil root; (b) comparison of nonlinear forced response results (tip trailing edge, point B) for increasing values of the excitation force | F E | . The response is here normalized by the excitation force magnitude | F E | .
Applsci 11 05171 g003
Figure 4. (Left) Maximum bending stress on the blade (at airfoil root) as a function of frequency. Different excitation levels are explored | F E | = 0.1 , 6 N. (Right) Maximum bending stress vs. F E .
Applsci 11 05171 g004
Figure 5. (a) Maximum bending stress on the blade (at airfoil root) as a function of F E , same case as Figure 4 for extended | F E | range; (b) resonance frequency as a function of F E .
Applsci 11 05171 g005
Figure 6. (a) Den Hartog 1 DoF oscillator; (b) simplified representation of a blade. The hysteresis cycles produced by friction are shown below each system.
Applsci 11 05171 g006
Figure 7. Representation of contact forces and their moments about platform point P for an In-Phase mode of vibration.
Applsci 11 05171 g007
Figure 8. Detail of forces on a damper (bottom row) and corresponding forces and their moments on the two adjacent platforms in contact with that damper for an In-Phase mode of vibration.
Applsci 11 05171 g008
Figure 9. CAD model front and top view of the two blades investigated with this paper. The figure indicates proportions, and the values for symbols are shown in Table 2.
Applsci 11 05171 g009
Figure 10. Blade A. Maximum “nominal” bending stress vs. F E for: (a) the shorter neck L n = 20 mm, full and half C F values, (b) the longer neck L n = 30 mm, full and half C F values. Shaded areas represent the maximum assumed span of the proof excitation force F E . The horizontal dashed line represents the allowable nominal bending stress σ a , b e n d .
Applsci 11 05171 g010
Figure 11. Blade B. Maximum “nominal” bending stress vs. F E for : (a) the shorter neck L n = 20 mm, full and half C F values; (b) the longer neck L n = 30 mm, full and half C F values. Shaded areas represent the maximum assumed span of the proof excitation force F E . The horizontal dashed line represents the allowable nominal bending stress σ a , b e n d .
Applsci 11 05171 g011
Figure 12. Flowchart representing a typical PCR nonlinear analysis.
Applsci 11 05171 g012
Figure 13. Flowchart representing the role of the PCR reduction in a typical design loop.
Applsci 11 05171 g013
Table 1. Comparison between the Full FE and the PCR freestanding blade models for the smaller Blade A (see Section 3). Static analysis results refer to a unit force F E applied at point E along the x-axis. Modal analysis results refer to the first bending mode.
Equivalence IndicatorSymbolFull FEPCR
(dyn.) Resonance Frequency f 1 (Hz)381.2381.3
(dyn.) Mode shape u A / u E 2.7972.792
u B / u E 3.0653.061
u C / u E 2.9482.943
α P / u E (rad/m) 8.98 · 10 3 8.67 · 10 3
γ P / u E (rad/m)2.4072.402
(static) Platform rotation γ P (rad) 4.148 · 10 6 4.146 · 10 6
(static) Airfoil tip displacement at point C u C w C (m) 3.45 · 10 6 2.92 · 10 7 3.46 · 10 6 2.69 · 10 7
(static) Max. stress at airfoil “root” σ m a x (MPa)0.7830.779
Table 2. Relevant geometrical parameters and characteristics of Blades A and B. C F * is the nominal centrifugal force on the damper (rounded to the next hundred) based on information on damper mass, disk radius, and rotational speed (not shown).
ParameterBlade ABlade B
L n 20 mm20 mm
L p 10 mm15 mm
L a 120 mm400 mm
h n -25 mm
h n + -35 mm
h n 8 mm-
b45 mm180 mm
C F * 900 N4000 N
f 1 , f r e e 381 Hz211 Hz
u E , f r e e / γ P , f r e e 0.4 m/rad1.2 m/rad
Table 3. Data relevant to the estimate of fatigue limits of blades A and B.
Blade ABlade BComments
MaterialRené 41René 80
Airfoil mass0.12 kg4.17 kg
Airfoil root area119 mm22707 mm2
Mean radius320 mm530 mm
Mean blade speed198 m/s198 m/s
Rotation speed6000 rpm3600 rpm
Temperature650 °C450 °C
Number of blades4433
Root chord40 mm160 mm
Mean pitch45 mm110 mm
Blade circumf. force60 N490 N
Blade bending force73 N590 N
1% bend. force amplitude0.73 N5.9 NAlternating comp.
5% bend. force amplitude3.5 N30 NAlternating comp.
Mass radius296 mm454 mm
Centrifugal force14 kN27 kN
Nominal root stress σ m 120 MPa100 MPaMean on section
Ultimate stress σ u 1060 MPa940 MPaAt temperature
Yield stress σ y 810 MPa680 MPaAt temperature
10 6 cycl. fatigue limit σ a 1 205 MPa185 MPaAlternating stress
Stress intens. factor Kf ≈1.51.5At airfoil root fillet
10 6 cycl. fatigue limit σ a 185 MPa165 MPaAt mean root stress
Allow bend stress σ a , b e n d 90 MPa80 MPaNominal at root
Publisher’s Note: MDPI stays neutral with regard to jurisdictional claims in published maps and institutional affiliations.