Article

Frictional Behavior of Cochlear Electrode Array Is Dictated by Insertion Speed and Impacts Insertion Force

1
Department of Otorhinolaryngology, Head and Neck Surgery “Otto Körner”, Rostock University Medical Center, Doberaner Straße 137–139, 18057 Rostock, Germany
2
Institute for Biomedical Engineering, Rostock University Medical Center, Doberaner Straße 137–139, 18057 Rostock, Germany
*
Author to whom correspondence should be addressed.
Appl. Sci. 2021, 11(11), 5162; https://doi.org/10.3390/app11115162
Submission received: 6 May 2021 / Revised: 28 May 2021 / Accepted: 31 May 2021 / Published: 2 June 2021
(This article belongs to the Section Biomedical Engineering)

Abstract

:
Background: During cochlear implantation, the electrode array has significant friction with the sensitive endocochlear lining and causes mutual mechanical trauma while the array is being inserted. Both, the impact of insertion speed on electrode friction and the relationship of electrode insertion force and friction have not been adequately investigated to date. Methods: In this study, friction coefficients between a CI electrode array (31.5 mm) and a tissue simulating the endocochlear lining have been acquired, depending on different insertion speeds (0.1, 0.5, 1.0, 1.5, and 2.0 mm/s). Additionally, the electrode insertion forces during the placing into a scala tympani model were recorded and correlated with the friction coefficient. Results: It was shown that the friction coefficient reached the lowest value at an insertion speed of 0.1 mm/s (0.24 ± 0.13), a maximum occurred at 1.5 mm/s (0.59 ± 0.12), and dropped again at 2 mm/s (0.45 ± 0.11). Similar patterns were observed for the insertion forces. Consequently, a high correlation coefficient (0.9) was obtained between the insertion forces and friction coefficients. Conclusion: The present study reveals a non-linear increase in electrode array friction, when insertion speed raises and reports a high correlation between friction coefficient and electrode insertion force. This dependence is a relevant future parameter to evaluate and reduce cochlear implant insertion trauma. Significance statement: Here, we demonstrated a dependence between cochlear electrode insertion speed and its friction behavior and a high correlation to insertion force. Our study provides valuable information for the evaluation and prevention of cochlear implant insertion trauma and supports the optimization of cochlear electrode arrays regarding friction characteristics.

1. Introduction

Cochlear implants (CIs) are the treatment of choice for the rehabilitation of severe to profound sensorineural hearing loss. Trending upwards, over 324,000 patients worldwide have received cochlear implants [1]. In a CI, an electrode array is inserted into the scala tympani (the lower tubular cochlear space) and electrically stimulates cochlear spiral ganglion cells. Unfortunately, implant insertion in such a sensitive area causes trauma to fragile endocochlear structures due to mechanical irritation [2,3,4,5,6].
Various researchers have tried to investigate the factors contributing to cochlear structures’ trauma [7,8,9,10] and have reported a dependence on insertion depth and consequently to the electrode array length. It is shown that insertion trauma increased with deep insertions [10] combined with electrode kinking [11]. Furthermore, it was reported that cochlear trauma is determined by electrode insertion force [12,13]. Some papers describe the relationship between cochlear anatomy and basilar membrane trauma. Ishii et al., [12] have shown that forces of only 0.029 to 0.039 N were required to rupture the cochlear basilar membrane. However, identification of the parameters determining this insertion force has not been performed so far.
A crucial parameter that determines the extent of insertion trauma is the speed of implant insertion [14,15]. It was reported that high insertion speeds of Nucleus 24 contour electrode arrays cause a significant increase in insertion force [14].
During implantation, the electrode array has large sliding contact to the inner cochlear wall, which is covered with thin endosteum. This suggests that the friction between the electrode array and the thin endosteum lining strongly dictates the electrode sliding behavior and the insertion force. While several studies focused on frictional behavior between joint implants [16] or contact lenses to standard solid material [17], Kha et al. [18] have shown frictional behavior of Nucleus standard straight and contour cochlear electrode array to endosteum lining. They reported decreased friction properties when applying glycerin as a lubricant in a slippage model. Additionally, Kontorinis and Paasche et al. [19] revealed that insertion forces of the Nucleus 24 contour electrode array are reduced following the application of glycerine if compared to water.
However, neither the friction behavior of a 31.5 mm standard cochlear electrode array to endosteum lining under the impact of speed nor a correlation between the electrode friction and the insertion force has been investigated yet. This study aimed to examine the friction forces between the electrode array and endosteum lining mimicking tissue under the influence of different pulling speeds using a custom-made pulling device system. Friction coefficient calculation and comparison are also reported. Additionally, the electrode array was inserted in a scala tympani model and insertion forces were investigated, depending on different insertion speeds. Based on this data, we calculated a correlation between the friction coefficient and the insertion force to obtain the correlation coefficient.

2. Materials and Methods

2.1. Electrode Array

All experiments were performed with a straight standard insertion electrode array (MED-EL, Innsbruck, Austria) (Figure 1a). The insertion part is 31.5 mm long, with a diameter between 0.5 and 1.3 mm. It contains 24 platinum electrode contacts separated by a 2.4 mm distance. Electrode ends are distinguished into a proximal and a distal end, while the distal end is inserted into the cochlear.

2.2. Friction Measurements and Friction Coefficient Calculation

2.2.1. Friction Partner and Lubricant

A porcine endothoracic fascia was used as a friction partner for mimicking inner cochlear slippery conditions. The tissue was obtained from the cadaver of two-year-old female pigs after they were used for surgeon training. Animals were kindly provided by the local Institute of Experimental Surgery. Following euthanization, the fascia was carefully removed from pig ribs and stored in phosphate-buffered saline at 4 °C. Two fasciae of two different pigs were used in this study. Artificial perilymph was used as a lubricant. It was prepared by a mix of 145 mM NaCl (sodium chloride, Merck KGAA, Darmstadt, Germany), 2.7 mM KCl (potassium chloride, Merck KGAA, Darmstadt, Germany), 2 mM MgSO4 (magnesium sulfate, Merck KGAA, Darmstadt, Germany), 1.2 mM CaCl2 (calcium chloride, Merck KGAA, Darmstadt, Germany), and 5 mM HEPES (HEPES, Merck KGAA, Darmstadt, Germany).

2.2.2. Friction Test Bench

Friction forces were recorded by a modified pulling device [20] (Figure 1b). The friction test bench comprises two main parts, the fixed part and the mobile part. The fixed part consists of a mount containing a cylinder and a deflection pulley. The deflection cylinder was covered with the friction partner (endothoracic fascia), fixed by cable ties after cutting it into a 4 × 4 cm piece, and washed three times with artificial perilymph. The mobile part consists of the electrode array, weight, a 5 N load cell, and the pulling device with linear feed. The electrode (Figure 1a) was wound over the deflection cylinder covered with the friction partner, was proximal clamped to the weight, and distal to a wire rope with a diameter of 0.5 cm and length of 25 cm. The wire rope was deflected by the deflection pulley and connected to the load cell and pulling device with a linear feed. The weight attached to the proximal electrode end was chosen so that a weight force of 0.1 N acts on the electrode.

2.2.3. Experimental Procedure

Electrode and friction partner were fixed as described above. Subsequently, the electrode was pulled over the friction partner using five different pulling speeds (0.1, 0.5, 1.0, 1.5, and 2.0 mm/s), representing cochlear electrode insertion speed. The pulling distance was 30 mm, along the electrode contacts. The friction partner was constantly wetted with artificial perilymph and friction forces were recorded every 0.5 mm. For each speed friction partner was renewed and three electrodes were used. Experiments were repeated five times using the same electrode.

2.2.4. Frictional Coefficient Calculation

Based on the impending slippage model [21] and the calculation performed by Kha et al. [18] friction coefficient µ was determined using the following formula:
μ = 1 β ln F f r i c t i o n F G   .
In this formula β is the radiant of the friction partner covering cylinder, Ffriction is the friction force recorded over a distance of 30 mm and FG is the weight force (0.1 N) that acts on the electrode.

2.3. Insertion Force Measurements

2.3.1. Artificial Scala Tympani Model

Electrodes were inserted into a transparent, artificial scala tympani model (MED-EL, Innsbruck, Austria). This model is made of polyester and represents the geometrical shape of an adult human scala tympani. The insertion opening has the average size and position of a cochleostomy [22]. The scala tympani model and the electrode array were aligned in a way that the insertion angle was 60° [23]. The model cavity was lubricated with a soap solution for optimized friction conditions.

2.3.2. Insertion Force Test Bench

Insertion forces were recorded by a universal testing system for tensile and compression tests which was controlled by Software testXpert II version 3.31 (ZwickRoell GmbH & Co. KG, Ulm, Germany). A 10 N load cell was used to record forces in an interval of 500 Hz. The testing system comprises two opposite holders. The upper holder was used to fix the electrode and was connected to the 10 N load cell driven by linear feed. The lower holder was used to fix the human scala tympani model (Figure 1c).

2.3.3. Experimental Procedure

The electrode array was fixed as described above and inserted into the lubricated scala tympani model. Electrodes were inserted into the entire model lumen over a distance of 30 mm under five different insertion speeds (0.1, 0.5, 1.0, 1.5, and 2.0 mm/s). Experiments were repeated ten times using the same electrode and insertion speed. After insertion electrodes were straightened back manually to their original form by slightly rotating the electrode array without tension to protect it from damage.

2.4. Statistical Analysis

Data visualization and statistical analyses were performed with GraphPad Prism (version 8.02). Comparisons of multiple groups were performed by Analysis Of Variance (ANOVA) followed by Dunnett’s Multiple Comparison post-hoc test. In addition, a correlation analysis was used to calculate the correlation coefficient of two independent parameters. Significance levels are indicated by “*” for p < 0.05, “**” for p < 0.01, “***” for p < 0.001 and “****” for p < 0.0001.

3. Results

3.1. Impact of Pulling Speed to Electrode Friction Forces

To investigate the impact of pulling speed on electrode friction between the electrode array and the endosteum lining mimicking tissue, friction forces at different pulling speeds (0.1, 0.5, 1.0, 1.5, 2.0 mm/s) were recorded. Data were acquired over a distance of 30 mm along the electrode contacts.
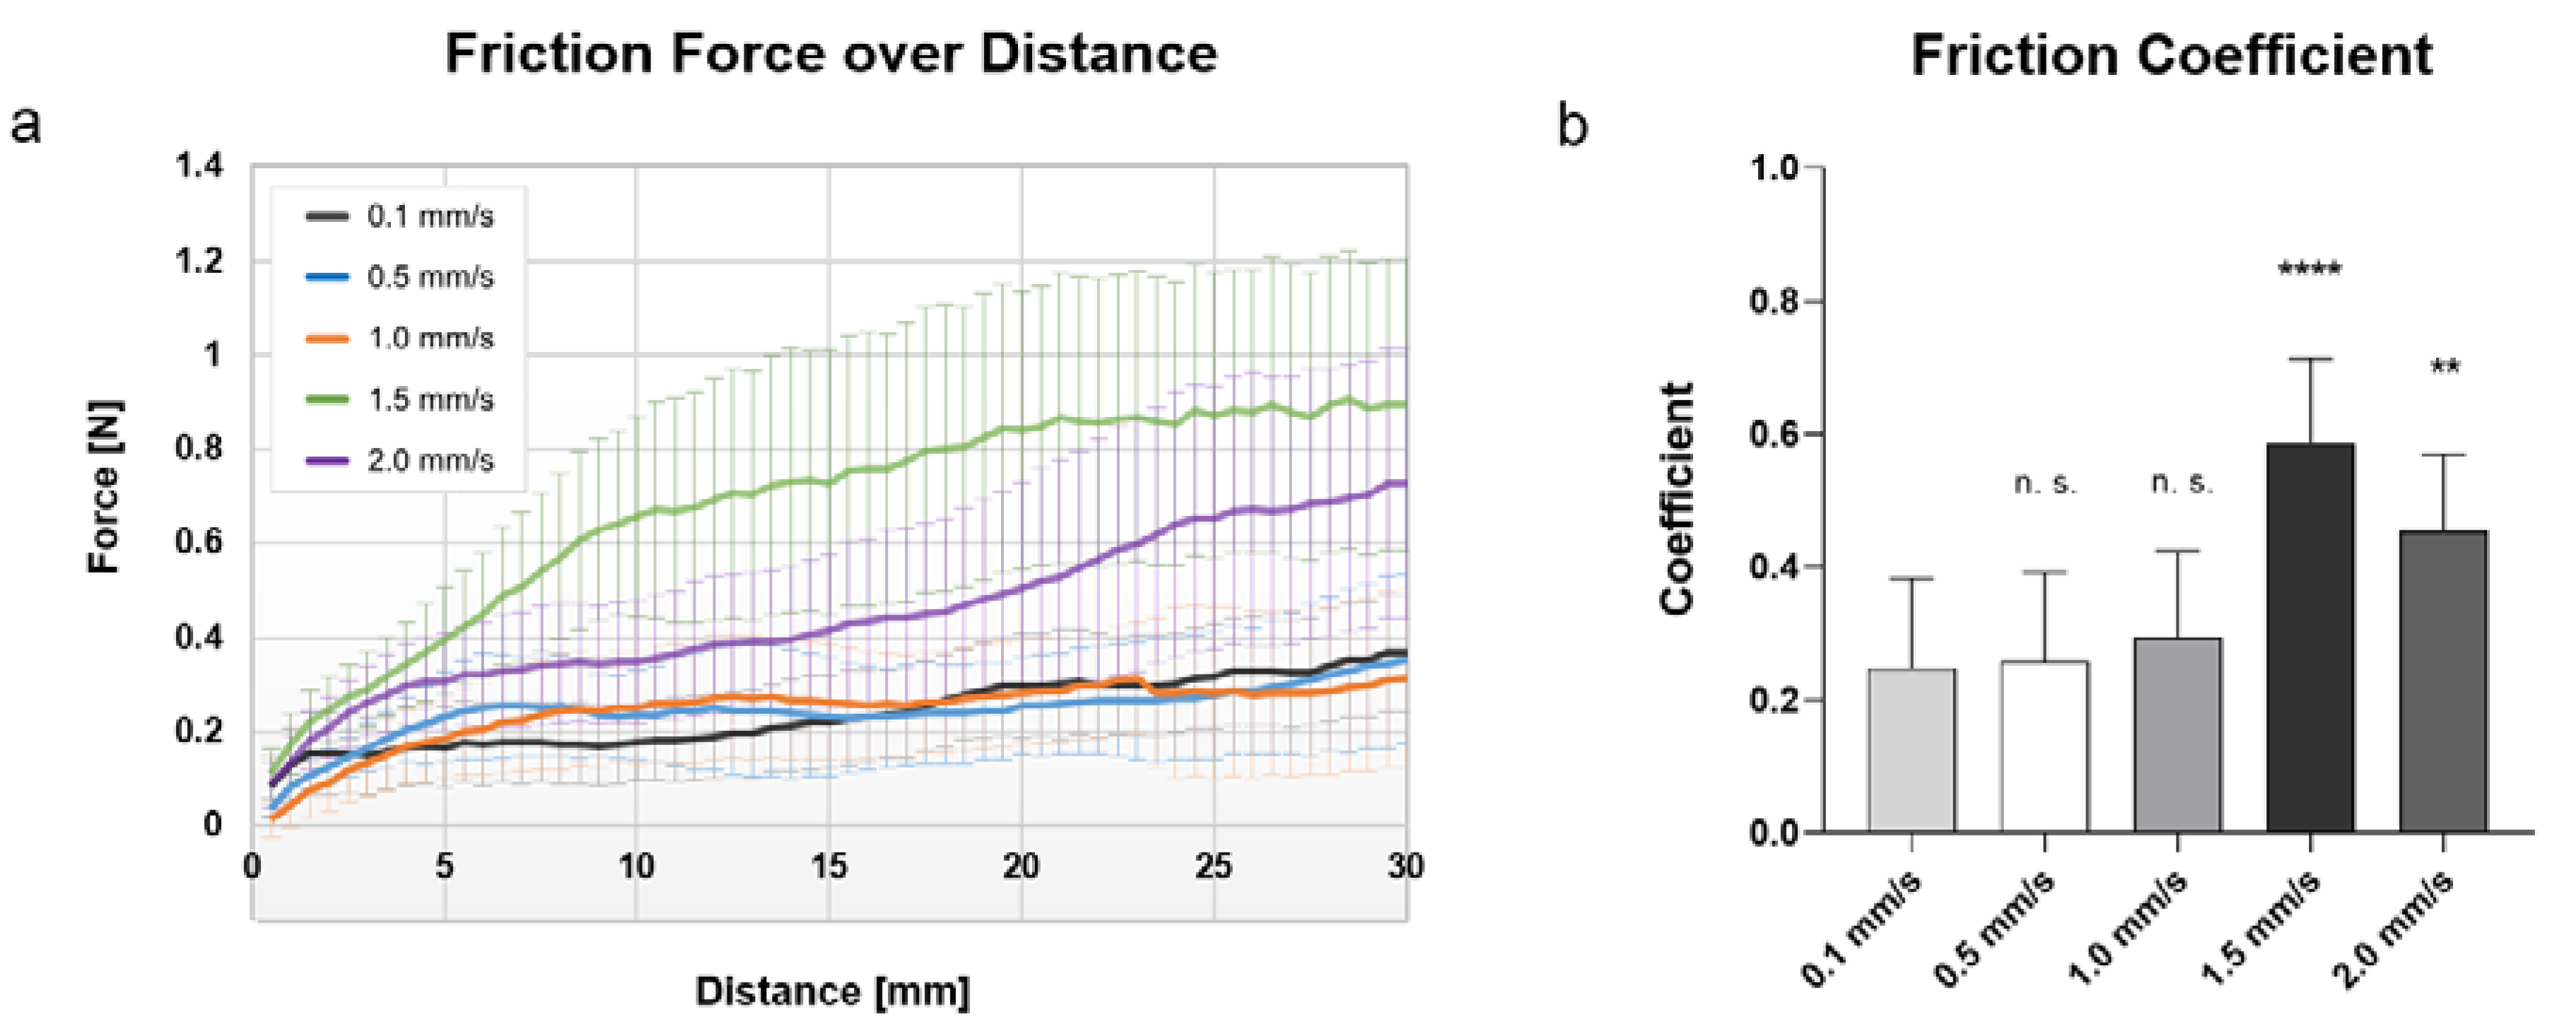
As demonstrated in Figure 2a, friction forces between 0.014 N and 0.90 N were measured, depending on the distance. Friction forces strongly rise at the beginning of electrode pulling, approaching a slight plateau-like phase as distance increased. Notably, while the plateau phase is characterized by a smooth pattern of the friction force, a pulling speed of 1.5 mm/s induced a more variable course of the friction force, indicated by a fluctuated graph pattern. Moreover, a speed of 2.0 mm/s leads to a second steep of the friction force between a distance of 15–20 mm. The highest friction force maximum were detected at a speed of 1.5 mm/s (0.90 N), followed by 2.0 mm/s (0.73 N), while friction force maxima of 0.1 (0.37 N), 0.5 mm/s (0.35 N), and 1 mm/s (0.31 N) were found to be similar.

3.2. Calculation and Comparison of Friction Coefficient

For better comparison of recorded friction forces, friction coefficients were calculated (Figure 2b). As expected, the highest friction coefficient was found at a speed of 1.5 mm/s (0.59 ± 0.12) followed by 2.0 mm/s (0.45 ± 0.11), 1.0 mm/s (0.27 ± 0.11) and 0.5 mm/s (0.26 ± 0.11). The lowest friction coefficient was calculated for a pulling speed of 0.1 mm/s (0.24 ± 0.13). Statistical analysis revealed that friction coefficients obtained at 1.5 and 2.0 mm/s are significantly higher compared to 0.1 mm/s, while friction coefficient at 0.5 and 1.0 mm/s showed no significant difference.
Taken together, obtained data clearly indicate a significant impact of the pulling speed on friction forces and friction coefficients. Friction coefficients are significantly increased when pulling speed raises. Interestingly, significant highest values were recorded at 1.5 mm/s followed by 2.0 mm/s and significant lowest values occur at 0.1 mm/s.

3.3. Impact of Insertion Speed to Electrode Insertion Forces

To investigate the dependence between electrode insertion force and electrode friction, insertion forces at different insertion speeds (0.1, 0.5, 1.0, 1.5, 2.0 mm/s) were recorded. Data was acquired from a distance of 30 mm, inside the scala tympani model lumen.
As shown in Figure 3a, electrode insertion forces between −0.0008 N and 0.018 N were recorded, depending on insertion depth. Minima forces were detected within the first 10 mm of insertion, approaching force maxima towards the end of the feed and subsequently with a force decrease. All recorded force maxima were found to be similar. However, the highest insertion force maximum were detected at a speed of 1.5 mm/s (0.018 N), followed by 0.1 mm/s (0.17 N) and 2.0 mm/s (0.16 N). Complementary, insertion force maxima recorded at the speeds of 0.5 mm/s and 1.0 mm/s were 0.14 N and 0.13 N. Interestingly, we observed three force peaks at each insertion speed as distance increased. The insertion force reaches the first peak between insertion distances of 3 and 4 mm/s, the second peak between 13–15 mm, while the third peak is reached between 25–28 mm. Notably, the steepest insertion force progression and the highest second peak were recorded at a speed of 1.5 mm/s (26.7 mm/0.082 N) followed by 0.1 mm/s (26.7 mm/0.067 N), 2.0 mm/s (26.3 mm/0.050 N) and 1.0 mm/s (26.25 mm/0.049 N). In contrast, the flattest force progression and the lowest second peak are detected at an insertion speed of 0.5 mm/s (26.74 mm/0.034 N). Moreover, while most recorded insertion forces are characterized by smooth pattern, the insertion speed of 0.1 mm/s induced a more variable course of the insertion force, indicated by a fluctuated graph pattern.
For quantitative evaluation of insertion forces, we calculated mean insertion forces at different insertion speeds (Figure 3b). As expected, a speed of 1.5 mm/s leads to the highest mean insertion force (0.25 N ± 0.007 N), followed by 0.1 mm/s (0.02 N ± 0.008 N), 2.0 mm/s (0.019 N ± 0.003 N) and 1.0 mm/s (0.016 N ± 0.001 N). The lowest mean insertion force was detected at a speed of 0.5 mm/s (0.014 N ± 0.003 N). Statistical analysis revealed that the mean insertion forces recorded at 0.1 and 1.5 mm/s are significantly increased, while the insertion speeds of 2.0 and 1.0 mm/s showed no significant difference if compared to 0.5 mm/s.
In conclusion, the attained data demonstrates a profound impact of the electrode array insertion speed on the insertion force. Notably, insertion speeds of 0.5 and 1.0 mm/s result in significantly lower insertion forces, while an insertion speed of 1.5 mm/s leads to the significantly highest insertion force, followed by 0.1 and 2.0 mm/s.

3.4. Correlation between Insertion Force and Friction Coefficient

As shown above, insertion or rather pulling speed strongly influences insertion force and friction conditions. Interestingly, the speed-induced impact on these biomechanical properties was found to be similar (Figure 2b and Figure 3b). Referring to this observation, a correlation analysis between the insertion force and the friction coefficient were performed to investigate a statistical dependence.
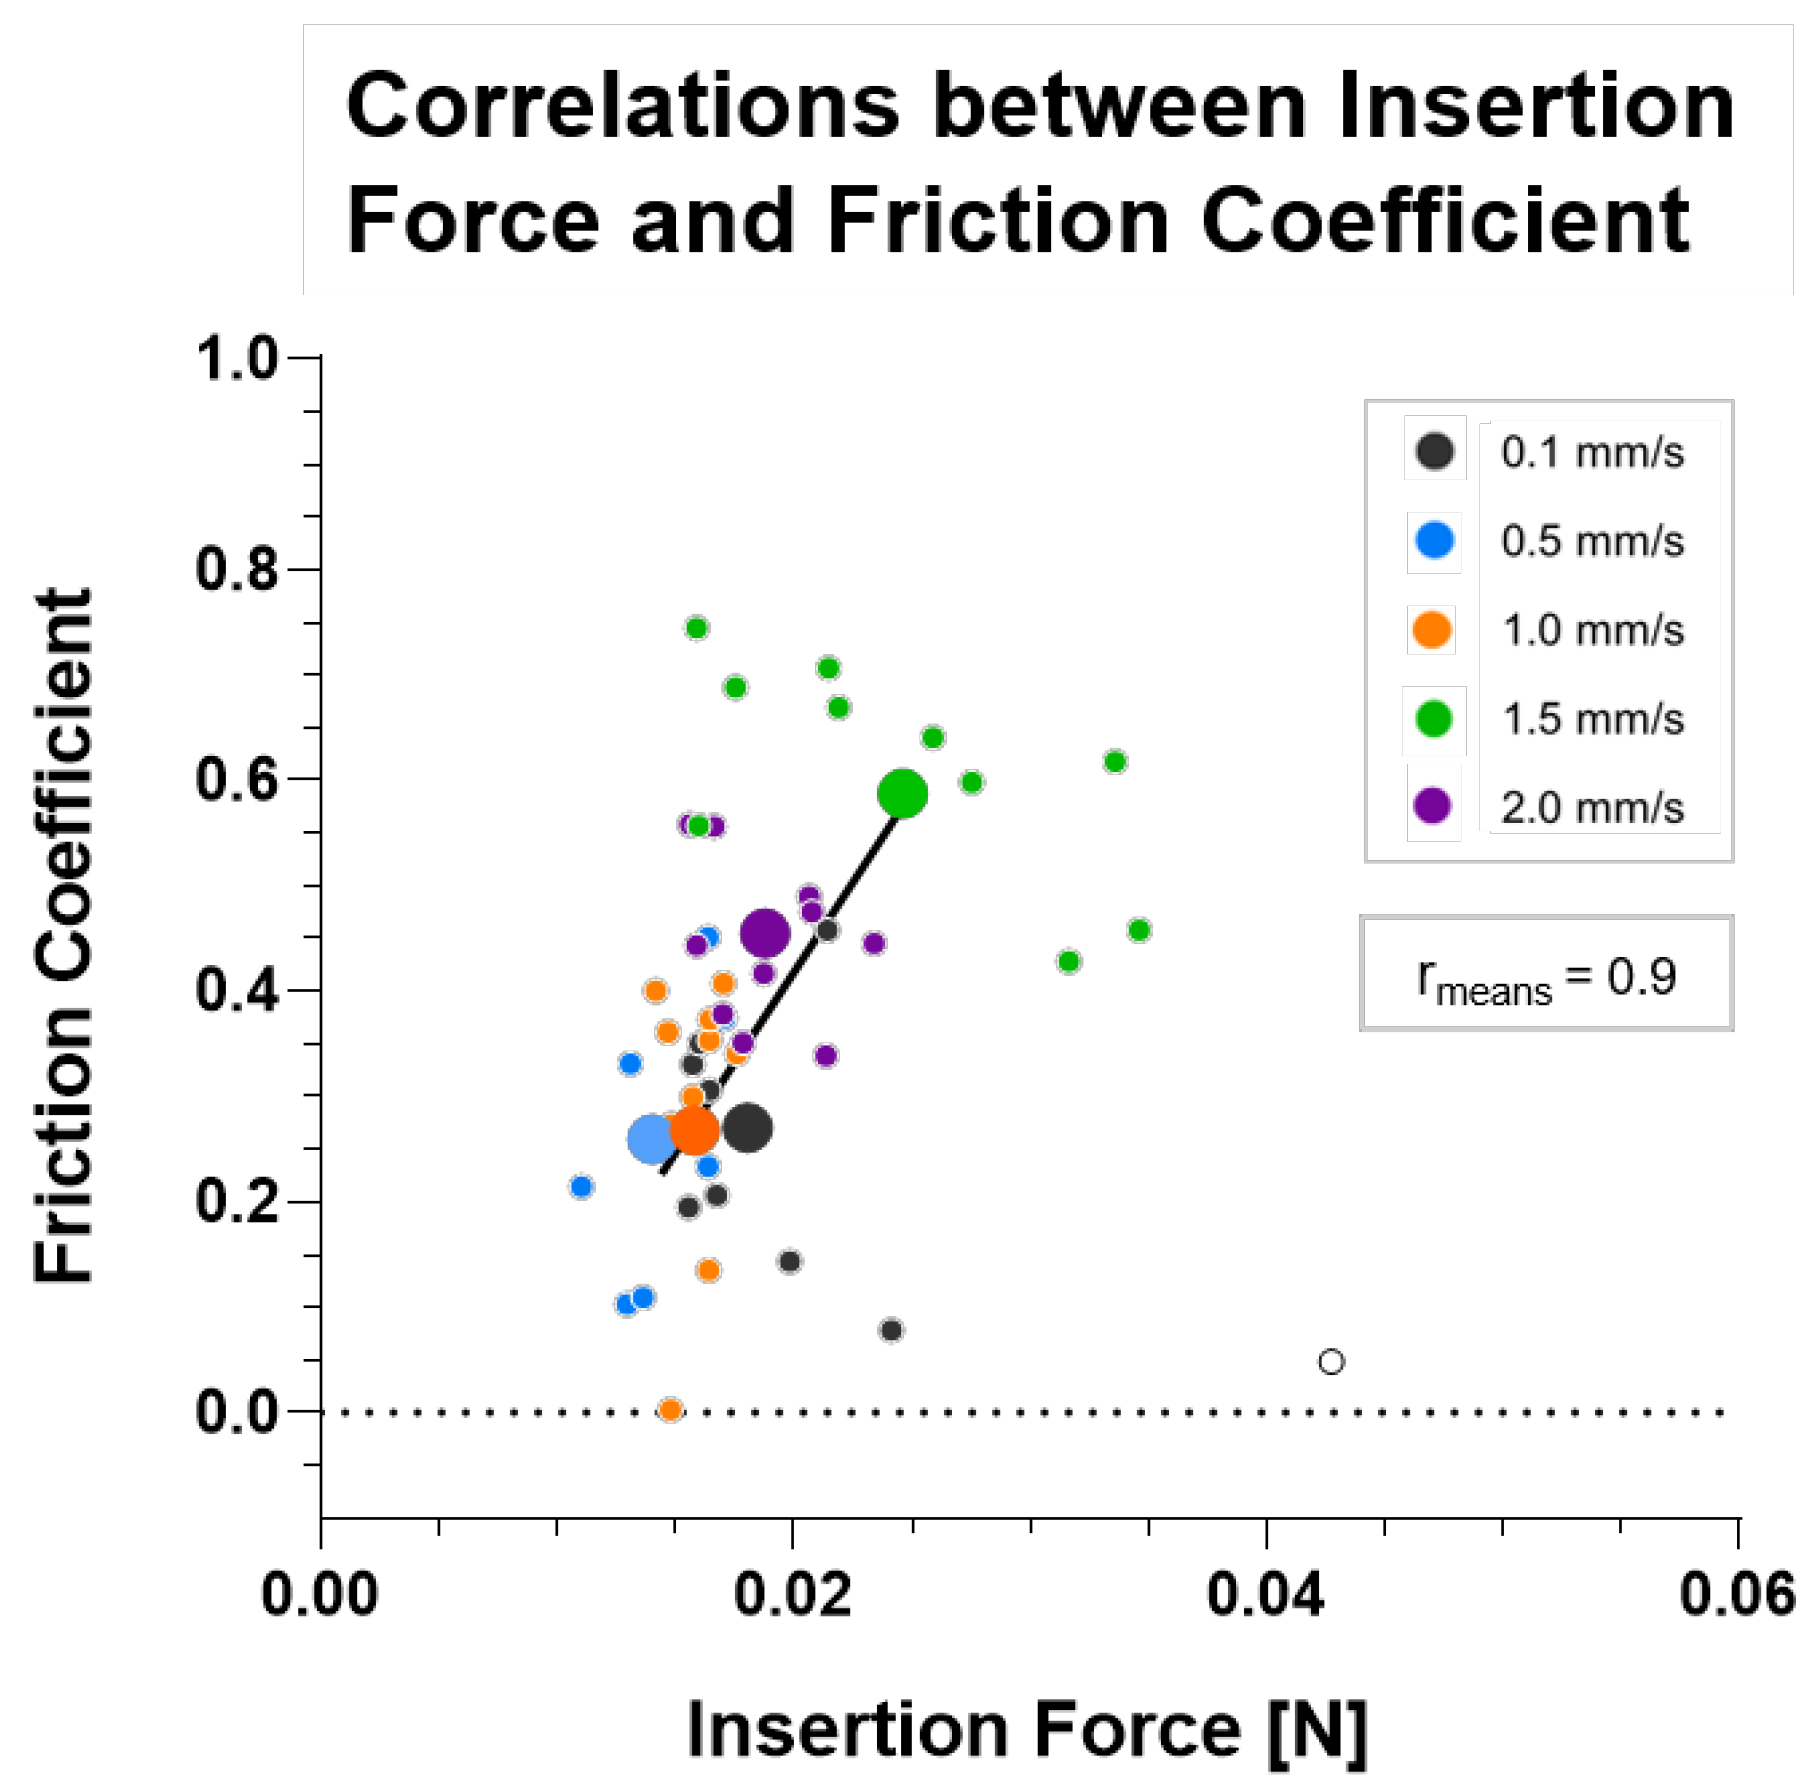
In Figure 4, the correlation of insertion force and friction coefficient showing cluster formation, depending on different insertion speeds. Analyzing cluster location, these two biomechanical properties showing a non-linear course, depending on applied speeds. While the correlation of the insertion forces and friction coefficients, detected at the speed of 1.5 mm/s, showing cluster formation farthest from the zero point (Table S4), values detected at the speed of 2.0 mm/s are formatting a cluster closer to zero point (Table S5) followed by 1.0 mm/s (Table S3). Complementary, a speed of 0.5 mm/s leads to a cluster formation nearest to the zero point (Table S2). Especially, no cluster formation was found at a speed of 0.1 mm/s (Table S1).
Correlation analysis between insertion force mean values and friction coefficient mean values (outlier excluded) reveal a correlation coefficient (rmeans) of 0.9. The p-value between the insertion force and the friction coefficient is 0.03 (Table 1).
In summary, our data reveal a statistical dependence between electrode insertion force and friction behavior under the impact of applied speeds, shown by the pointed-out cluster formations and subsequent correlation coefficient (rmeans) of 0.9. Certain insertion speed generates a specific friction coefficient that correlates with the insertion force of the electrode array.

4. Discussion

In the current study, it is shown that cochlear electrode insertion speed and pulling speed has a significant impact on its biomechanical behavior. For the first time, it is indicated (i) a significant dictation of pulling speed to the frictional behavior of the cochlear electrode array acting on endosteum lining mimicking tissue and (ii) revealed a statistical dependence between the electrode insertion force and the friction coefficient with a correlation coefficient of approximately 1 (0.9).
During CI implantation, the endosteum lining of the scala tympani acts as a friction partner, and the perilymph usually acts as a lubricant for the electrode array. To simulate these clinical conditions a custom-made pulling device was established. Porcine endothoracic fascia was used for mimicking endosteum lining since both consist mainly of the same tissue type [24]. Moreover, artificial perilymph was used as a lubricant. Applied pulling speeds were identical to the insertion speed used in cochlear implant studies. Since most force-related reports have applied insertion speed of 0.16–3.3 mm/s [14,22,25,26], a similar speed ranging from 0.1 to 2.0 mm/s was used in this study.
The present experiments show that the friction coefficient increases when the speed is increased. Interestingly, this dependence is non-linear. Lowest friction coefficient was calculated at 0.1 mm/s (0.24 ± 0.13), rises to a maximum at 1.5 mm/s (0.59 ± 0.12) and decreased at 2 mm/s (0.45 ± 0.11). The fluctuated curve plateau at 1.5 mm/s indicates a constant change of adherence and sliding between the electrode array and friction partner at a given speed. The second steep ascent in friction force, observed at a speed of 2.0 mm/s, could be attributed to the fact that the wetting rate was too low. Hence, insufficient lubrication of the entire electrode resulting in an increased friction force. Incidentally, all statistical analyses refer to the lowest calculated coefficient.
Kha et al. [18] reported multiple frictional coefficients when applying different lubricates or electrode array types in a slippage model. Compared to the frictional coefficients in our study (0.27–0.59) the authors have calculated lower coefficients (0.04–0.19). Nonetheless, our calculated coefficients are difficult to directly compare with the aforementioned study since the tested electrode arrays and used conditions were different. Uniquely, artificial perilymph was used as a lubricant to better simulate physiological conditions. In addition and in contrast to Kha et al. [18], the electrode in our setup was moved mechanically along the friction partner, which is similar to the steady surgical movement during implantation of a CI electrode.
In comparison, an impact of the electrode insertion speed on the insertion force was demonstrated in this work. Thereby, previous studies which reported the dependence of the electrode insertion speed to the insertion force [14,15] were followed up. Noteworthy, Kontorinis and Lenarz et al. [14] reported that high insertion speeds cause a significant increase of insertion force and investigated a quiet linear dependence between both parameters. In contrast, our data suggest a non-linear dependence. Lowest insertion force was recorded at 0.5 mm/s (0.014 N ± 0.003 N), rises to a maximum at 1.5 mm/s (0.25 N ± 0.007 N) and decreased at 2 mm/s (0.019 N ± 0.003 N). However, the comparability with the antecedent study is limited, since the used scala tympani model and electrode arrays were different.
In contrast to our friction data demonstrated in this study, insertion forces detected at a speed of 0.1 mm/s are significantly increased, if compared to insertion forces recorded at a speed of 0.5 mm/s. This could be related to the fact that the insertion force at 0.1 mm/s is subject to high statistical variance and more variable course of the force progression at a given speed. Additionally, the fluctuated graph pattern at 0.1 mm/s indicates a constant change of adherence and sliding between the electrode array and scala tympani model lumen. Moreover, the first force peak (within 3–4 mm/s) recorded at each insertion speed is formed when the electrode array touches the lateral wall of the scala tympani model for the first time. The force peaks within 14–15 and 25–27 mm are due to the scala tympani model lumen shape. These force peaks corresponding to the distance where the model lumen turns. The detected negative forces are measurement artifacts based on the background noise (measurement range is 0.02 N–10 N). Notable, insertion distance is defined by test bench settings but terminated by the scala tympani model lumen length. Reasonably, the electrode array reached the end of the lumen before the total set insertion distance is attained. Therefore, the recorded insertion forces initially increase. Afterward, the electrode kinked, which causes the insertion forces to drop. Hence, mean values are more representative to compare than maximum forces.
Due to the different materials used in the two test benches, different lubricants were used. While the porcine fascia together with artificial perilymph used in the friction test bench simulates closely the physiological conditions in the cochlea, the interaction between the scala tympani model (polyester) and the electrode (silicone) in the force test bench results in increased adhesion. Consequently, to better simulate the physiological conditions in force measurements (by decreasing adhesion) and improve the comparability to friction measurement, soap was used as a lubricant.
Against expectations, despite different friction conditions, a high correlation coefficient of 0.9 between the insertion force and friction coefficient was calculated during measurements. This finding emphasizes the strong influence of applied speed. Moreover, the fact that no cluster formation was detected in the correlation plot at a speed of 0.1 mm/s might be attributed to the high statistical variance of the force values at a given speed. That the point 0.043 N/0.048 was defined as an outlier is due to the case that these values were recorded at the very beginning of the experiment and can be considered as not representative. However, the strong dependency between these biomedical properties suggests that the electrode insertion force depends not only on insertion speed but also on the friction conditions within the cochlear implantation. Matching results are reported by Radeloff et al. [27]. They compared hydroxy-ethyl-cellulose-coated electrode carriers with uncoated electrode carriers and showed that insertion forces were markedly reduced during the insertion of coated carriers. Additionally, the insertion depth [10] and consequently the electrode array length determine biomechanical properties. This correlates with the occasional clinical observations in 31.5 mm electrode arrays incomplete insertion into the human cochlear. These incomplete insertions can be attributed to the fact of a high friction contact between the electrode array and endocochlear structures and causes the electrode array to stick. Accordingly, this contradicts the opinion in the literature where incomplete inserted electrodes are discussed to be due to variations in cochlear duct length [28].
To our knowledge, this is the first study investigating the impact of the insertion speed on friction conditions between the cochlear electrode array and endosteum lining mimicking tissue. The present study reveals high insertion speed causes increased electrode array friction properties with a non-linear dependence. Also, it is demonstrated that at defined insertion speeds, generated friction coefficients correlate with the insertion forces of the electrode array. Hence, the insertion speed and frictional conditions play a crucial role as a parameter to evaluate and reduce electrode insertion force and subsequently cochlear trauma. Future studies need to aim for the correlation between electrode friction behavior and insertion force in human cochlear, depending on speed and the impact of electrode array coating on friction properties.

Supplementary Materials

The following are available online at https://www.mdpi.com/article/10.3390/app11115162/s1, Table S1: Insertion speeds and friction coefficients detected at the applied speed of 0.1 mm/s; Table S2: Insertion speeds and friction coefficients detected at the applied speed of 0.5 mm/s; Table S3: Insertion speeds and friction coefficients detected at the applied speed of 1.0 mm/s; Table S4: Insertion speeds and friction coefficients detected at the applied speed of 1.5 mm/s; Table S5: Insertion speeds and friction coefficients detected at the applied speed of 2.0 mm/s.

Author Contributions

Conceptualization, N.G., R.M., and S.P.S.; data curation, D.D.; formal analysis, D.D.; funding acquisition, N.G., R.M., and S.P.S.; investigation, D.D. and S.P.S.; methodology, D.D., N.F., and W.S.; project administration, D.D. and S.P.S.; resources, N.G. and R.M.; software, W.S.; supervision, W.S., R.M., and S.P.S.; validation, W.S.; visualization, D.D.; writing—original draft, D.D.; writing—review and editing, D.D. All authors have read and agreed to the published version of the manuscript.

Funding

Partial financial support by the European Regional Development Fund (ERDF) and the European Social Fund (ESF) within the collaborative research between economy and science of the state Mecklenburg-Vorpommern and by the Federal Ministry of Education and Research (BMBF) within RESPONSE “Partnership for Innovation in Implant Technology” is gratefully acknowledged. The funding agency had no role in study design, data collection, and analysis, the decision to publish, or preparation of the manuscript. This research received no external funding.

Institutional Review Board Statement

Not applicable.

Informed Consent Statement

Not applicable.

Data Availability Statement

This research received no external funding. The raw data required to reproduce these findings cannot be shared at this time as the data also forms part of an ongoing study.

Acknowledgments

A sincere thanks to Brigitte Vollmar from the Rudolf-Zenker Institute for Experimental Surgery, Rostock University Medical Center for kindly providing porcine tissue and MED-EL, Innsbruck, Austria for allocating standard electrode arrays and scala tympani model.

Conflicts of Interest

The authors declare no conflict of interest.

Image Manipulation

No specific feature within an image may be enhanced, obscured, moved, removed, or introduced.

Abbreviations

CICochlear Implant
µfriction coefficient
Ffriction force
FGweight force

References

  1. D’Haese, P.S.; Van Rompaey, V.; De Bodt, M.; Van de Heyning, P. Severe Hearing Loss in the Ageing Population poses a Global Public Health Challenge. How can we better realise the Benefits of Cochlea Implantation to Mitigate this Crisis? Front. Public Health 2019, 7, 227. [Google Scholar] [CrossRef] [PubMed] [Green Version]
  2. Shepherd, R.K.; Pyman, B.C.; Clark, G.M.; Webb, R.L. Banded intracochlear electrode array: Evaluation of insertion trauma in human temporal bones. Ann. Otol. Rhinol. Laryngol. 1985, 94, 55–59. [Google Scholar] [CrossRef] [Green Version]
  3. Tykocinski, M.; Saunders, E.; Cohen, L.T.; Treaba, C.; Briggs, R.J.; Gibson, P.; Clark, G.M.; Cowan, R.S. The contour electrode array: Safety study and initial patient trials of a new perimodiolar design. Otol. Neurotol. 2001, 22, 33–41. [Google Scholar] [CrossRef] [Green Version]
  4. Marx, M.; Risi, F.; Escudé, B.; Durmo, I.; James, C.; Lauwers, F.; Deguine, O.; Fraysse, B. Reliability of cone beam computed tomography in scalar localization of the electrode array: A radio histological study. Eur. Arch. Oto-Rhino-Laryngol. 2014, 271, 673–679. [Google Scholar] [CrossRef] [PubMed]
  5. Wanna, G.B.; Noble, J.H.; Carlson, M.L.; Gifford, R.H.; Dietrich, M.S.; Haynes, D.S.; Dawant, B.M.; Labadie, R.F. Impact of electrode design and surgical approach on scalar location and cochlear implant outcomes. Laryngoscope 2014, 124, S1–S7. [Google Scholar] [CrossRef] [PubMed]
  6. Zhou, L.; Friedmann, D.R.; Treaba, C.; Peng, R.; Roland, J.T., Jr. Does cochleostomy location influence electrode trajectory and intracochlear trauma? Laryngoscope 2015, 125, 966–971. [Google Scholar] [CrossRef] [PubMed]
  7. Fayad, J.; Linthicum, F.H., Jr.; Galey, F.R.; Otto, S.R.; House, W.F. Cochlear implants: Histopathologic findings related to performance in 16 human temporal bones. Ann. Otol. Rhinol. Laryngol. 1991, 100, 807–811. [Google Scholar] [CrossRef] [PubMed]
  8. Eshraghi, A.A.; Yang, N.W.; Balkany, T.J. Comparative study of cochlear damage with three perimodiolar electrode designs. Laryngoscope 2003, 113, 415–419. [Google Scholar] [CrossRef] [Green Version]
  9. Wardrop, P.; Whinney, D.; Rebscher, S.J.; Roland, J.T., Jr.; Luxford, W.; Leake, P.A. A temporal bone study of insertion trauma and intracochlear position of cochlear implant electrodes. I: Comparison of Nucleus banded and Nucleus Contour™ electrodes. Hear. Res. 2005, 203, 54–67. [Google Scholar] [CrossRef]
  10. Adunka, O.; Kiefer, J. Impact of electrode insertion depth on intracochlear trauma. Otolaryngol. Head Neck Surg. 2006, 135, 374–382. [Google Scholar] [CrossRef] [PubMed]
  11. Gstoettner, W.; Plenk, H.; Franz, P.; Hamzavi, J.; Baumgartner, W.; Czerny, C.; Ehrenberger, K. Cochlear implant deep electrode insertion: Extent of insertional trauma. Acta Oto-Laryngol. 1997, 117, 274–277. [Google Scholar] [CrossRef]
  12. Ishii, T.; Takayama, M.; Takahashi, Y. Mechanical properties of human round window, basilar and Reissner’s membranes. Acta Oto-Laryngol. 1995, 115, 78–82. [Google Scholar] [CrossRef] [PubMed]
  13. De Seta, D.; Torres, R.; Russo, F.Y.; Ferrary, E.; Kazmitcheff, G.; Heymann, D.; Amiaud, J.; Sterkers, O.; Bernardeschi, D.; Nguyen, Y. Damage to inner ear structure during cochlear implantation: Correlation between insertion force and radio-histological findings in temporal bone specimens. Hear. Res. 2017, 344, 90–97. [Google Scholar] [CrossRef] [PubMed] [Green Version]
  14. Kontorinis, G.; Lenarz, T.; Stöver, T.; Paasche, G. Impact of the insertion speed of cochlear implant electrodes on the insertion forces. Otol. Neurotol. 2011, 32, 565–570. [Google Scholar] [CrossRef] [PubMed]
  15. Zhang, J.; Bhattacharyya, S.; Simaan, N. Model and Parameter Identification of Friction during Robotic Insertion of Cochlear-Implant Electrode Arrays. In Proceedings of the IEEE International Conference on Robotics and Automation, Kobe, Japan, 12–17 May 2009; pp. 3859–3864. [Google Scholar]
  16. Damm, P.; Bender, A.; Duda, G.; Bergmann, G. In vivo measured joint friction in hip implants during walking after a short rest. PLoS ONE 2017, 12, e0174788. [Google Scholar] [CrossRef] [Green Version]
  17. Koller, A.W. The Friction Coefficient of Soft Contact Lens Surfaces in Relation to Comfort and Performance. Ph.D. Thesis, City University London, London, UK, March 2014. [Google Scholar]
  18. Kha, H.N.; Chen, B.K. Determination of frictional conditions between electrode array and endosteum lining for use in cochlear implant models. J. Biomech. 2006, 39, 1752–1756. [Google Scholar] [CrossRef]
  19. Kontorinis, G.; Paasche, G.; Lenarz, T.; Stöver, T. The effect of different lubricants on cochlear implant electrode insertion forces. Otol. Neurotol. 2011, 32, 1050–1056. [Google Scholar] [CrossRef] [PubMed]
  20. Schmidt, W.; Grabow, N.; Behrens, P.; Schmitz, K.P. Trackability, crossability, and pushability of coronary stent systems-an experimental approach. Biomed. Tech. Biomed. Eng. 2002, 47, 124–126. [Google Scholar] [CrossRef]
  21. Meriam, J.L.; Kraige, L.G. Engineering Mechanics: Statics, 3rd ed.; John Wiley & Sons Inc.: New York City, NY, USA, 1993; pp. 389–390. [Google Scholar]
  22. Rau, T.S.; Hussong, A.; Leinung, M.; Lenarz, T.; Majdani, O. Automated insertion of preformed cochlear implant electrodes: Evaluation of curling behaviour and insertion forces on an artificial cochlear model. Int. J. Comput. Assist. Radiol. Surg. 2010, 5, 173–181. [Google Scholar] [CrossRef]
  23. Avci, E.; Nauwelaers, T.; Hamacher, V.; Kral, A. Three-dimensional force profile during cochlear implantation depends on individual geometry and insertion trauma. Ear Hear. 2017, 38, e168–e179. [Google Scholar] [CrossRef]
  24. Willard, F.H. Visceral Fascia. Fascia: The Tensional Network of the Human Body-E-Book: The Science and Clinical Applications in Manual and Movement Therapy; Elsevier Health Sciences: Philadelphia, PA, USA, 2013; p. 54. [Google Scholar]
  25. Roland, J.T., Jr. A model for cochlear implant electrode insertion and force evaluation: Results with a new electrode design and insertion technique. Laryngoscope 2005, 115, 1325–1339. [Google Scholar] [CrossRef] [PubMed]
  26. Todd, C.A.; Naghdy, F.; Svehla, M.J. Force application during cochlear implant insertion: An analysis for improvement of surgeon technique. IEEE Trans. Biomed. Eng. 2007, 54, 1247–1255. [Google Scholar] [CrossRef] [PubMed] [Green Version]
  27. Radeloff, A.; Unkelbach, M.H.; Mack, M.G.; Settevendemie, C.; Helbig, S.; Mueller, J.; Hagen, R.; Mlynski, R. A coated electrode carrier for cochlear implantation reduces insertion forces. Laryngoscope 2009, 119, 959–963. [Google Scholar] [CrossRef] [PubMed]
  28. Johnston, J.D.; Scoffings, D.; Chung, M.; Baguley, D.; Donnelly, N.P.; Axon, P.R.; Gray, R.F.; Tysome, J.R. Computed tomography estimation of cochlear duct length can predict full insertion in cochlear implantation. Otol. Neurotol. 2016, 37, 223–228. [Google Scholar] [CrossRef]
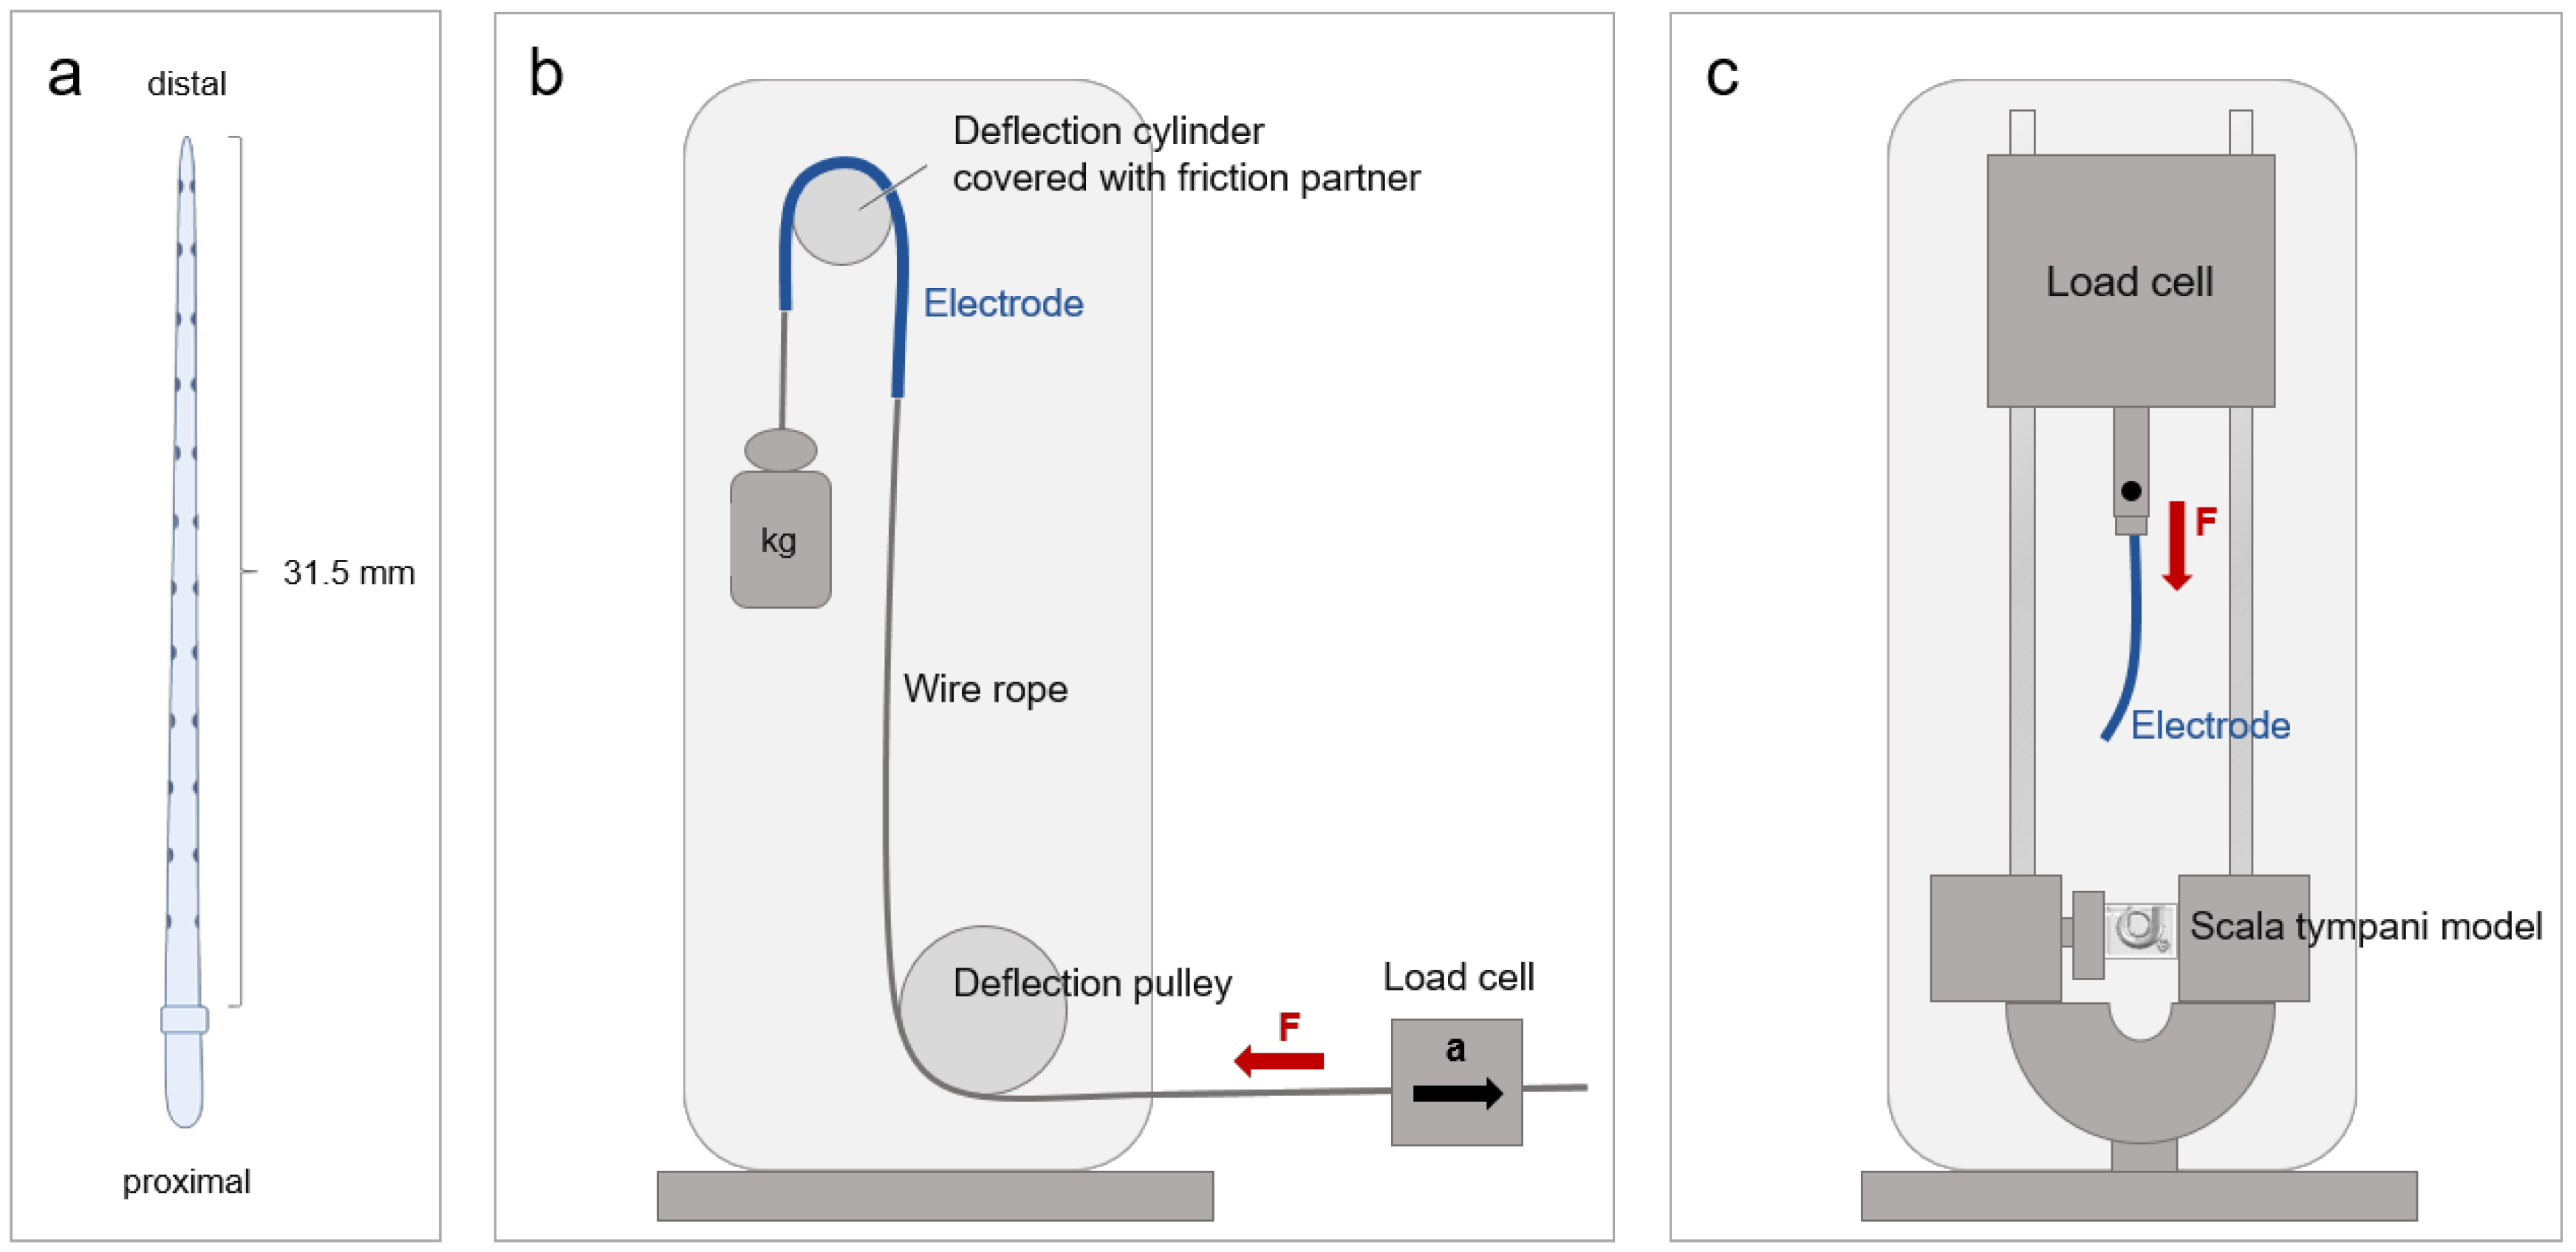
Figure 1. Schematic view of test benches used to analyze the biomechanical properties of a standard cochlear electrode array. (a) Schematic illustration of the standard cochlear electrode array (MED-EL) used in this study. The electrode array insertion part is 31.5 mm long. The ends of the electrode array are distinguished into the proximal and distal end. (b) Illustration of the friction force test bench. The friction force test bench comprises the load cell, deflection pulley, wire rope, deflection cylinder covered with friction partner, weight, and a cochlear electrode array. The red arrow indicates the recorded direction of the friction force (F) and the black arrow indicates the pulling direction (a). (c) Illustration of the insertion force test bench. Insertion force test bench comprises the load cell, linear feed, scale model, and cochlear electrode. The red arrow indicates the recorded direction of the friction force (F).
Applsci 11 05162 g001
Figure 2. Cochlear electrode friction force and friction coefficient at five different pulling speeds. (a) Friction forces of the cochlear electrode recorded during pulling along a friction partner. Mean friction force curves over 30 mm pulling track (distance) are shown. Pulling speeds were set to 0.1 mm/s (black), 0.5 mm/s (blue), 1.0 mm/s (orange), 1.5 mm/s (green), 2.0 mm/s (violet). n = 7 repetitions with 0.5 mm/s, n = 10 repetitions with 0.1 mm/s and 1.0 mm/s, n = 12 repetitions with 1.5 mm/s and n = 14 repetitions with 2.0 mm/s pulling speed were performed. Lines represent the standard deviation. (b) Cochlear electrode friction coefficient calculated from mean friction force. Pulling track was 30 mm and pulling speeds are 0.1, 0.5, 1.0, 1.5, and 2.0 mm/s. n = 7 repetitions with 0.5 mm/s, n = 10 repetitions with 0.1 mm/s and 1.0 mm/s, n = 12 repetitions with 1.5 mm/s and n = 14 repetitions with 2.0 mm/s pulling speed were performed. Data are presented as mean with positive standard deviation (lines). p-values were calculated by one-way ANOVA followed by Dunnett’s Multiple Comparison post hoc test. ** p < 0.01, **** p < 0.0001 and n. s. = not significant compared to mean friction coefficient at 0.1 mm/s.
Applsci 11 05162 g002
Figure 3. Cochlear electrode insertion force at five different insertion speeds. (a) Insertion forces of the cochlear electrode recorded during the placement into a scale model. Mean insertion force curves over a 30 mm insertion depth (distance) are shown. Insertion speeds were set to 0.1 mm/s (black), 0.5 mm/s (blue), 1.0 mm/s (orange), 1.5 mm/s (green), 2.0 mm/s (violet). n = 10 independent repetitions were performed for each insertion speed. Lines represent the standard deviation. (b) Insertion forces of the cochlear electrode over a 30 mm distance. Insertion speeds are 0.1, 0.5, 1.0, 1.5, and 2.0 mm/s. n = 10 independent repetitions were performed for each insertion speed. Data are presented as mean with positive standard deviation (lines). p-values were calculated by One-Way ANOVA followed by Dunnett’s Multiple Comparison post hoc test. * p < 0.05, *** p < 0.001 and n. s. = not significant compared to mean insertion force at 0.5 mm/s.
Applsci 11 05162 g003
Figure 4. Correlation dot plot showing relationship between insertion force and friction coefficient. Small dots represent the average values of each individual measurement of insertion force and friction coefficient at different speeds (0.1, 0.5, 1.0, 1.5, and 2.0 mm/s). Big dots represent means of average values at each individual speed (0.1, 0.5, 1.0, 1.5, and 2.0 mm/s). Average values are assigned to one another according to their measurement sequence. n = 10 average values at 0.1 mm/s (black dots, black circle = outlier), 1.0 mm/s (orange dots), 1.5 mm/s (green dots), 2.0 mm/s (violet dots) and n = 7 average values at 0.5 mm/s (blue dots) are shown. rmeans is the correlation coefficient between means of average values from independent repetitions generated at 0.1, 0.5, 1.0, 1.5, or 2.0 mm/s speed. Straight represents the regression line of means.
Applsci 11 05162 g004
Table 1. Insertion force and friction coefficient of electrode array generated at five different speeds and calculated correlation coefficient. Mean values with standard deviation are listed. Correlation coefficient rmeans and p-value were calculated between insertion force and friction coefficient at 0.1 mm/s (n = 9, outlier excluded), 0.5 mm/s (n = 7), 1.0 mm/s (n = 10), 1.5 mm/s (n = 10) and 2.0 mm/s (n = 10).
Speed [mm/s]Insertion Force [N]Friction Coefficient
0.10.020 ± 0.0080.24 ± 0.13
0.50.014 ± 0.0030.26 ± 0.12
1.00.016 ± 0.0010.27 ± 0.14
1.50.025 ± 0.0070.59 ± 0.12
2.00.019 ± 0.0030.45 ± 0.11
Correlation coefficient (rmeans)0.9129
p-value (insertion force vs. friction coefficient)0.03
Publisher’s Note: MDPI stays neutral with regard to jurisdictional claims in published maps and institutional affiliations.