Communication

Light Scattering and Absorption Complementarities to Neutron Scattering: In Situ FTIR and DLS Techniques at the High-Intensity and Extended Q-Range SANS Diffractometer KWS-2

1
Physikalisches Institut (IA), Rheinisch-Westfälische Technische Hochschule (RWTH), Otto-Blumenthal Str., 52074 Aachen, Germany
2
Forschungszentrum Jülich GmbH, Jülich Centre for Neutron Science (JCNS) at Heinz Maier-Leibnitz Zentrum (MLZ), 85747 Garching, Germany
3
Graduate School of Science, Osaka University, 1-1 Machikaneyama, Toyonaka, Osaka 560-0043, Japan
*
Author to whom correspondence should be addressed.
Appl. Sci. 2021, 11(11), 5135; https://doi.org/10.3390/app11115135
Submission received: 30 April 2021 / Revised: 28 May 2021 / Accepted: 29 May 2021 / Published: 31 May 2021
(This article belongs to the Special Issue Recent Advances in Small-Angle Neutron Scattering)

Abstract

:
Understanding soft and biological materials requires global knowledge of their microstructural features from elementary units at the nm scale up to larger complex aggregates in the micrometer range. Such a wide range of scale can be explored using the KWS-2 small-angle neutron (SANS) diffractometer. Additional information obtained by in situ complementary techniques sometimes supports the SANS analysis of systems undergoing structural modifications under external stimuli or which are stable only for short times. Observations at the local molecular level structure and conformation assists with an unambiguous interpretation of the SANS data using appropriate structural models, while monitoring of the sample condition during the SANS investigation ensures the sample stability and desired composition and chemical conditions. Thus, we equipped the KWS-2 with complementary light absorption and scattering capabilities: Fourier transform infrared (FTIR) spectroscopy can now be performed simultaneously with standard and time-resolved SANS, while in situ dynamic light scattering (DLS) became available for routine experiments, which enables the observation of either changes in the sample composition, due to sedimentation effects, or in size of morphologies, due to aggregation processes. The performance of each setup is demonstrated here using systems representative of those typically investigated on this beamline and benchmarked to studies performed offline.

1. Introduction

Small-angle neutron scattering (SANS) is a powerful technique that yields important low-resolution structural information on macromolecular systems. The small-angle neutron diffractometer, KWS-2 [1], operated by the Jülich Centre for Neutron Science (JCNS) at the Heinz Maier-Leibnitz Zentrum (MLZ), Garching, Germany, is dedicated to the investigation of mesoscopic multi-scale structures and structural changes in soft condensed matter and biophysical systems. Following demands from the user community, it was recently considerably upgraded to boost its performance with respect to the intensity on the sample, instrumental resolution, counting rate capabilities, and maximum Q-range (Q = (4π/λ)sinθ is the momentum transfer, where λ is the neutron wavelength and 2θ is the scattering angle). The instrument, with high-intensity, extended Q-range and tunable resolution, is optimized for the study of mesoscopic structures and structural changes due to rapid kinetics.
The ability to observe chemical and physical processes simultaneously with small-angle scattering (SAS) is highly desirable for a deeper understanding of biological and soft matter systems. This is particularly crucial for dynamic systems, to ensure sample stability, purity, chemical conditions, to reduce ambiguities in data reduction, and for when it is not possible to perform further measurements or characterization on intermediate states ex situ. Given the high brilliance of synchrotron radiation, simultaneous analyses by X-ray and differential scanning calorimetry (DSC) or Raman spectroscopy were developed quite early at the Synchrotron Radiation Source in Daresbury, U.K. [2,3], and used successfully since then [4,5]. More recently, in situ size-exclusion chromatography (SEC) with SAXS [6] was developed for the first time at the Advanced Photon Source of Argonne National Laboratory (ANL, Lemont, IL, USA). This brought advantages in the field of protein scattering, in which samples very often typically show poor stability or aggregation tendency.
As unique probes, neutrons interact differently with the 1H and 2H (deuterium, D) hydrogen isotopes: the large difference in the coherent scattering length density between H and D represents the basis of the contrast variation and contrast matching methods. As most of the soft matter and biological samples consist of hydrocarbon systems, the H/D substitution offers the possibility to vary the coherent scattering length density of a compound over a broad range. With this technique, selected constituents in a complex multi-component system can be labeled by isotope exchange. Depending on the created contrast—the squared difference between the scattering length density of one component and that of the other components or the environment medium—selected components or regions within a complex soft matter or biophysical morphology can be made visible or invisible in the scattering experiment without the chemical alteration of the system.
Owing to technological developments in high-intensity specialized SANS instruments such as detectors and neutron guides [7,8], exciting developments in the nature and number of characterization techniques that can be performed in situ on large-scale SANS instruments started to emerge. For example, the first implementation of an in situ SEC-SANS system was reported with a D22 instrument at the Institute Laue-Langevin (ILL, Grenoble, France) [9], while first results obtained with a simultaneous SANS and FTIR measuring system were collected with the KWS-2 instrument [10]. In situ DLS setups have also been developed to complement SANS at several neutron beamlines so far, for example a SANS-I instrument at the SINQ spallation source (Paul-Scherrer Institute, PSI, Villigen, Switzerland) [11], D11 instrument at the Institute Laue-Langevin (ILL, Grenoble, France) [12,13], and LOQ and ZOOM instruments at the ISIS Pulsed Neutron and Muon Source (Rutherford Appleton Laboratory, Didcot, UK) [14].
Therefore, the simultaneous combination of light scattering or absorption methods with SANS (or WANS) represents very powerful experimental approaches to be used in the microstructural characterization of soft and biological systems.
In this paper we communicate recent upgrades to the sample environments available using the KWS-2, which is now equipped to perform in situ FTIR and dynamic light scattering (DLS). All of which can be performed simultaneously with standard or real-time SANS and enable in-beam monitoring of the sample quality or provide complementary information to neutrons.

2. Materials and Methods

Small-angle neutron scattering (SANS) experiments were performed using the KWS-2 instrument at the JCNS at MLZ in Garching, Germany [1]. The measurements were typically performed using sample-to-detector distances of 1.5, 8, and 20 m, and neutron λ of 5 and 10 Å (Δλ/λ = 10%), to achieve a maximum dynamic q-range of 1 × 10⁻³–0.7 Å−1. Scattering data was collected in static and real-time modes. Each raw scattering data set was corrected for detector sensitivity, electronics background, and empty cell contribution and converted to scattering cross-section data using instrument software QtiKWS [15]. Data was then converted to the absolute scale (cm−1) through reference to the scattering from a secondary standard sample (Plexiglass).
Hydrogenated polyethylene glycol dimethyl ether (hPEGDME, MW = 20,000 g mol−1 with a polydispersity of D = 1.01) that was synthesized in house [16] was dissolved in deuterated tetrahydrofuran (dTHF, Sigma-Aldrich Chemie GmbH, Munich, Germany) by weighing the components in appropriate amounts to ensure a polymer volume fraction (vol/vol%) ϕpol = 2% in the final solution. The solution was first heated to 50 °C under stirring, to achieve a homogeneous distribution of polymer chains in solution and then transferred into a sample container with ZnSe windows (Laser components GmbH, Olching, Germany), which is appropriate for simultaneous FTIR and SANS measurements. The sealed sample container with a beam path length of 1 mm was installed in a Peltier-controlled holder of own production that can enable the variation of temperature on the sample between 5 °C and 130 °C in a controlled way. To determine the crystallization temperature of PEGDME from the dTHF solution in decreasing temperature, the system was investigated by differential scanning calorimetry (DSC) using a DSC131 EVO Calorimeter (SETARAM Instrumentation, KEP Technologies EMEA, Kirchheim unter Teck, Germany) prior to the simultaneous FTIR and SANS analysis.
Uniaxially oriented amorphous deuterated syndiotactic polystyrene (d-sPS) films, about 50 µm thick, were prepared by quenching a melt of d-sPS in an ice water bath, drawing the melt-quenched film four times at 373 K, and clipping well-oriented portions from the drawn films [17]. d-sPS co-crystal films containing protonated toluene as guest (d-sPS/hTol) were obtained by exposing the oriented amorphous films to a vapor of hTol (Sigma-Aldrich Chemie GmbH, Munich, Germany). The d-sPS/hTol co-crystalline films were transferred into the sample container with ZnSe windows for simultaneous FTIR and SANS analysis at room temperature.
In situ FTIR investigations were carried out during the SANS measurements with a JASCO VIR-200 spectrometer (JASCO Deutschland GmbH, Pfungstadt, Germany) installed at the sample position of the KWS-2 in an appropriate geometry that enabled a simultaneous irradiation of the sample using IR and neutron coaxial beams. Polarized IR beams were obtained by using a precision automated PIKE polarizer KRS-5 (PIKE Technologies, Madison, WI, USA).
For the in situ DLS measurements, a 15 mg/mL solution of apomyoglobin (apoMb) molten globule was prepared. ApoMb was obtained from horse heart myoglobin (Sigma-Aldrich Chemie GmbH, Munich, Germany) by the butanone method (as performed in [18]) and then refolded by dialysis in 20 mM NaH2PO4/Na2HPO4 (Sigma-Aldrich Chemie GmbH, Munich, Germany) pH 7 buffer. Before storage in the freezer at −20 °C, the solution was lyophilized. To replace the exchangeable protons by deuterium, the freeze-dried apoMb powder was dissolved in heavy water (D2O, 99.9% D, Sigma-Aldrich Chemie GmbH, Munich, Germany), incubated for 1 day, and lyophilized again. To obtain the molten globule state of apoMb the powder was dissolved in D2O and centrifuged to remove the large aggregates. In the supernate solution of concentration 2 mg/mL and pD 6, DCl 0.1 M (Sigma-Aldrich Chemie GmbH, Munich, Germany) was added until the pH value was 3.6 (monitored by pH meter Methrom), corresponding to a pD value of 4. The buffer exchanged protein solution was centrifuged (Heraeus Instruments) to the final concentration of 10 mg/mL using Vivaspin 3000 MWCO concentration units (Sartorius, Göttingen, Germany). The protein concentration was determined in a 0.1 mm thick cell (Hellma, Germany), using the molar extinction coefficient (ϵ280 nm = 13,980 M−1 cm−1) which was calculated from the amino acid sequence [19].
All samples were prepared in deuterium solvents or using deuterated polymer films to provide low incoherent neutron background and enable appropriate scattering contrasts for neutrons.

3. Results

In the following sections we will present results and discussion of the proof-of-principle tests on the in situ FTIR and DLS setups performed using the KWS-2 simultaneously with the SANS characterization of samples.

3.1. In Situ FTIR

FTIR allows for the determination of the chemical and physical structure of material via interpretation of the spectrum of characteristic bands that is produced by the excitation vibrations of molecular bonds following absorption of IR photons in the material [20]. FTIR is particularly powerful in the analysis of the polymeric systems under different environmental conditions. The chemical identity of the chains is achieved by detecting the chemical groups present in the polymer, the monomer sequences, and the stereoregularity. Additionally, one can observe the local conformation of individual chains as well as conformational change when macroscopic fields such as temperature, pressure, and relative humidity are applied to the sample. Due to these advantages, a combination of FTIR and SANS represents an outstanding investigation approach for understanding the detailed mechanism of structure formation and structural changes in multiphase polymeric systems such as semi-crystalline polymers, copolymers, or polymer composites: the conformational change of the molecules that make up such a complex system can be monitored by FTIR, while the hierarchy of morphologies occurring in different phases can be qualitatively and quantitatively characterized by SANS with contrast variation. Polymeric materials are very sensitive to slight variations of external conditions; therefore, it is more useful to apply the combination of these techniques in a simultaneous approach, when in situ or time-resolved analyses of rapid structural changes or irreversible processes can be performed.
We previously conducted pioneering work in developing a simultaneous SANS and FTIR spectroscopy measuring system using the KWS-2 diffractometer in 2014. Using this approach we studied the structure of a d-sPS co-crystalline film with various guest molecules [10]: higher-order crystalline structures were characterized by SANS while the local molecular configuration and molecular packing were characterized by FTIR. We demonstrated that the FTIR data were useful for interpreting and analyzing SANS profiles when larger molecules are included in the sPS films [21]. To extend the measurable Q-range for wide-angle neutron scattering (WANS), we used this approach on the time-of-flight SANS instrument TAIKAN installed at the Material and Life Science Experimental Facility (MLF), Japan Proton Accelerator Research Complex (J-PARC, Tokai, Japan) [22,23]. The old measurement system tested with the KWS-2 consisted of a portable FTIR spectrometer Perkin-Elmer Spectrum Two (PerkinElmer, Rodgau, Germany) and an optical system made up of six mirrors. For an easier optical path adjustment, higher light utilization efficiency, and proper use of the available space on the sample stage of the KWS-2, and for the installation of a device for the measurement of polarization-dependent infrared absorption and a more complex sample environment, the optical system including the FTIR spectrometer was redesigned, using the experience accumulated in [22]. A new FTIR spectrometer (JASCO VIR-200, JASCO Deutschland GmbH, Pfungstadt, Germany) is currently in regular use for conducting FTIR measurements in transmission geometry, with the IR beam going through the sample coaxially with the neutron beam (Figure 1): the two optical ports in the same lateral face, the outlet port for emitting parallel light and the inlet port for the incoming light, enable a great flexibility in designing the optical system and accommodating special sample environments (Figure 1b,c). At the same time, this geometry is paving the way for the installation of an in situ ATR-FTIR option that can be used simultaneously with SANS in the near future for an optimal investigation of liquid samples. In the current geometry, only the two Al-coated quartz plates (LASER COMPONENTS GmbH, Olching, Germany) are left (elements 3 and 4 in the scheme of Figure 1a).
Figure 1b,c shows photos of the new setup for simultaneous FTIR and SANS analysis using the KWS-2: the components indicated by numbers in the scheme in Figure 1a are identified in the photographs, which show the complete experimental arrangement at the sample position of the KWS-2 between the “collimation nose” that holds the sample aperture on the left side of photos, and the entrance window of the evacuated SANS detector tank, which is visible on the right side of the images. The new FTIR setup is entirely built on a breadboard (Thorlabs GmbH, Bergkirchen, Germany) which is equipped with “zero-point” fixation systems (AMF GmbH, Fellbach, Germany) for pneumatic clamping (activated with pressurized air) for an easy and precise installation on the sample stage of the KWS-2.
The control of the FTIR spectrometer, IR polarizer position (in beam and out of beam) and orientation were implemented in the NICOS instrument control software of the KWS-2 [24]. This is mainly meant for time-resolved investigations when FTIR measurements with the selected time acquisition can be carried out simultaneously with SANS measurements on samples in different external fields or composition conditions. The start of the FTIR acquisition is triggered by the detector start of the SANS instrument and runs until the SANS acquisition time is consumed. All relevant parameters for SANS: wavelength λ, collimation length LC, detection length LD, beam-size on sample, etc. [15], sample field parameters (temperature), and the FTIR setup parameters (polarizer position and orientation, etc.) can be combined in a single complex experimental routine. For conventional SANS measurements, standard FTIR acquisitions can be carried out in parallel using the operation menu of the FTIR spectrometer. A precise synchronization of the results obtained with the two methods is possible by using the SANS data acquisition in list mode [8], which enables the assignment of the SANS pattern collected at a specific time to the corresponding FTIR spectrum.
Proof-of-principle measurements were carried out by simultaneous use of FTIR in transmission geometry and SANS on soft matter systems that are relevant for the research topics developed using the KWS-2: (i) a hPEGDME solution in dTHF (ϕpol = 2%) at 30 °C and 12 °C and (ii) a d-sPS film in co-crystalline δ-form with hTol as guest molecules in the cavities between the sPS helices.

3.1.1. FTIR Sample Holder and Neutron Background

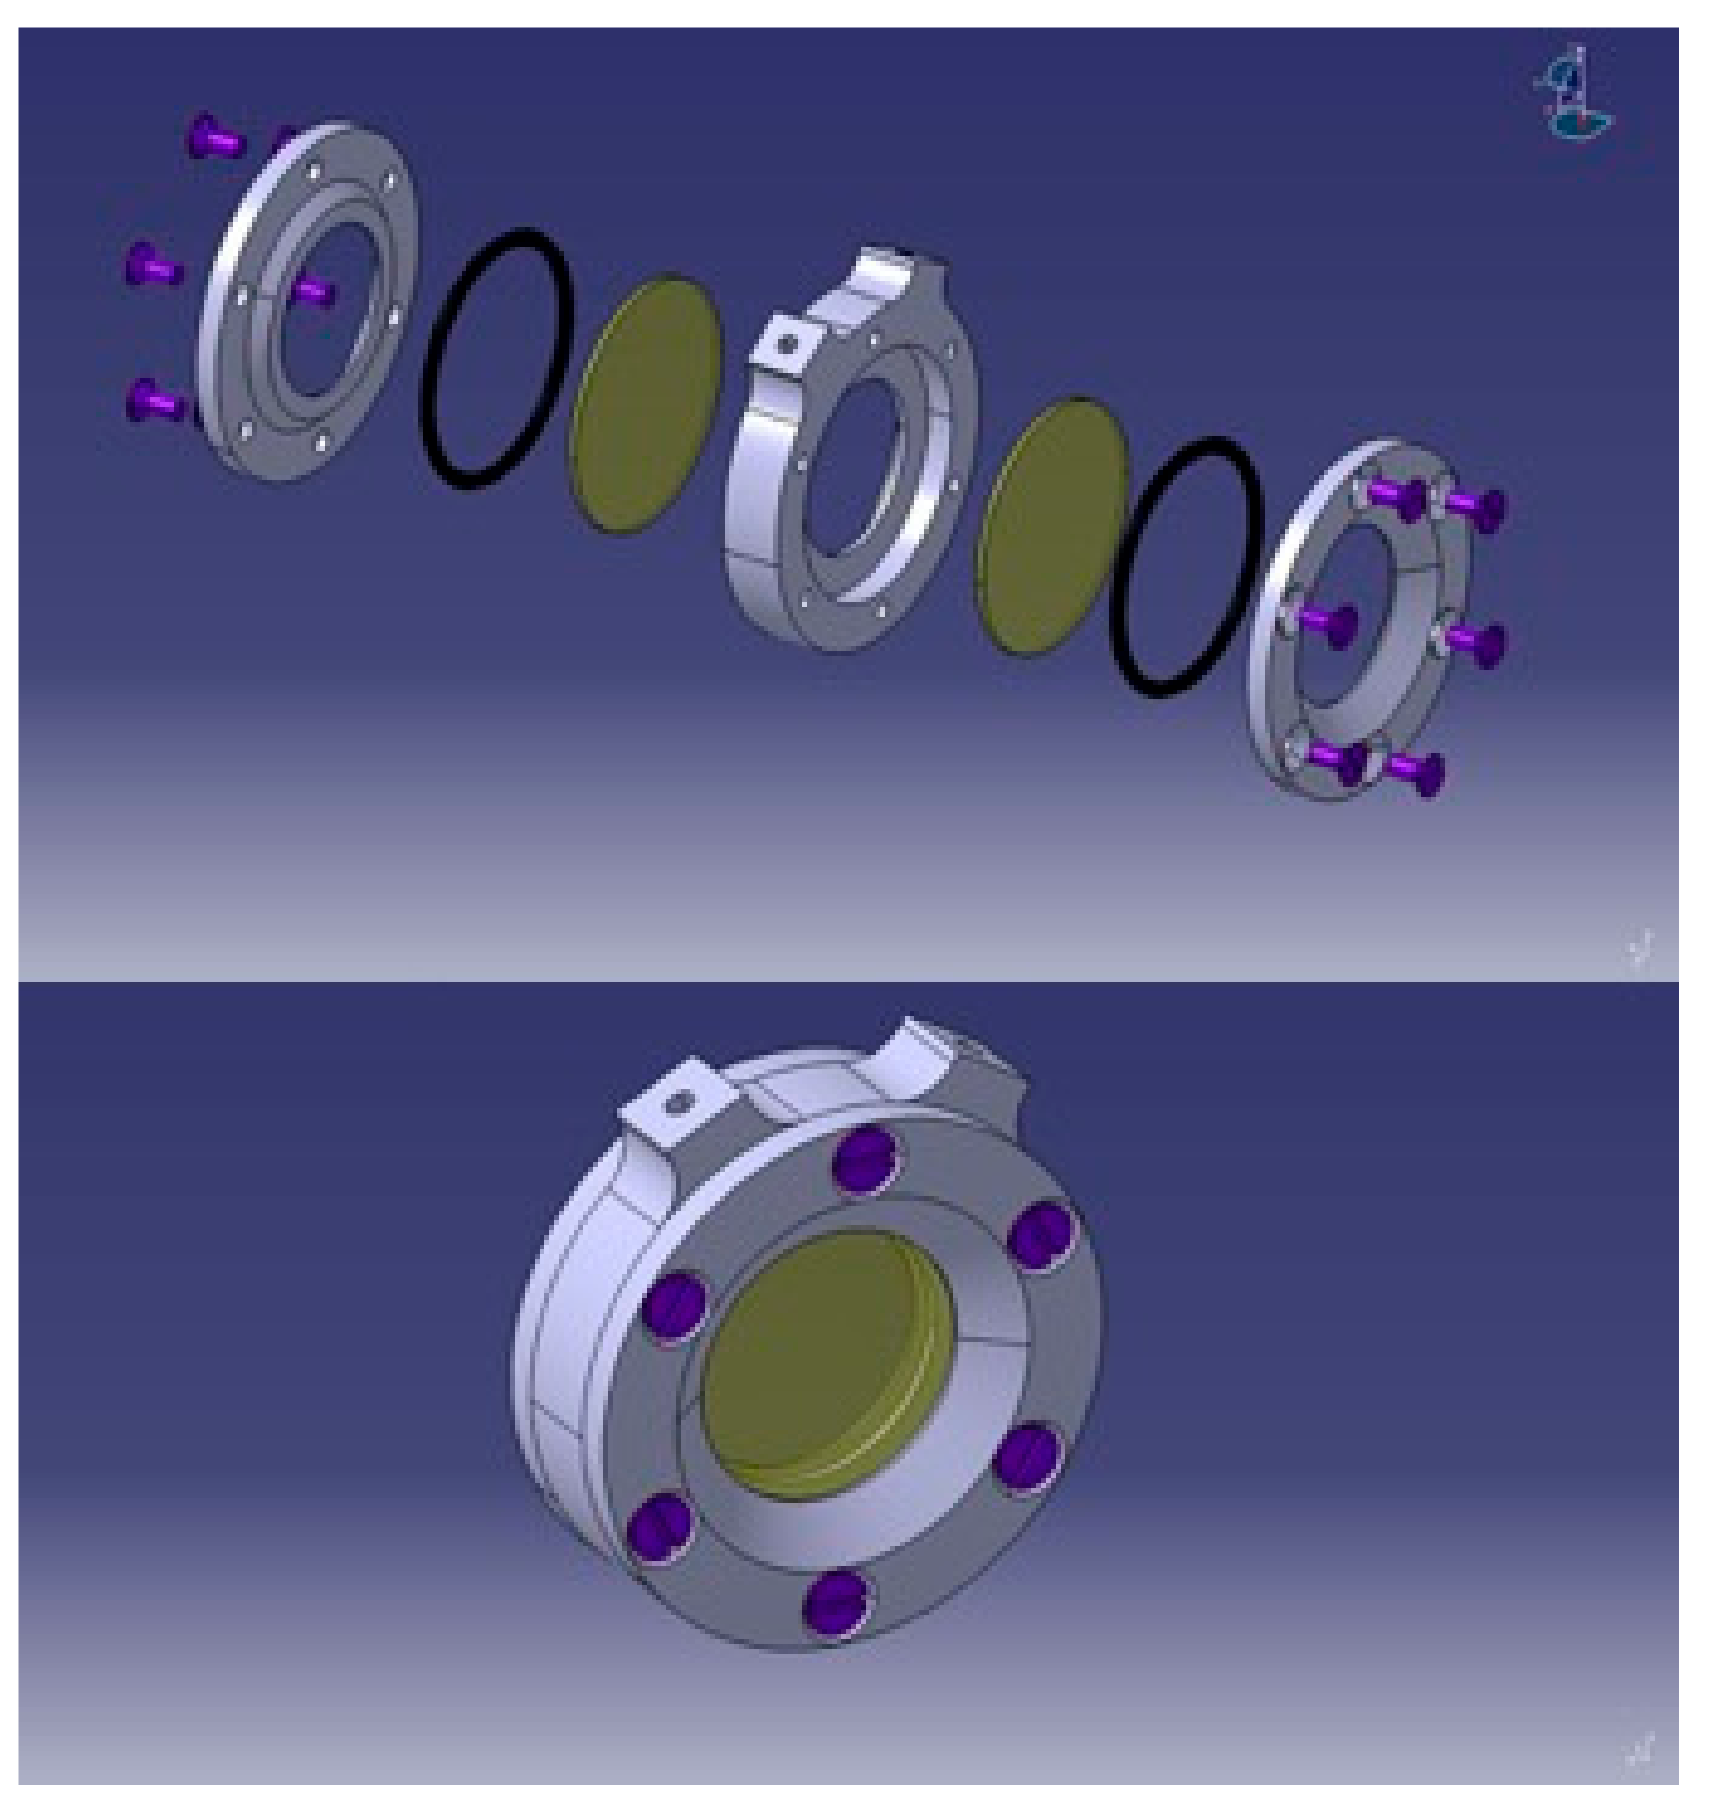
Figure 2 shows a technical drawing of the sample cells designed for the liquid and film samples for the simultaneous FTIR and SANS setup using the KWS-2. The cell is equipped with two ZnSe windows, each with a thickness of 1 mm, which enable a beam path of either 1 mm or 2 mm. A shorter beam path can be obtained by placing an additional ZnSe window with a thickness of 0.5 mm and an appropriate diameter inside of the holder. The chosen geometry allows for an easy filling and a tight closing of cells using the series of lateral screws, appropriate O-rings, and Teflon screws for the top openings used for filling in the samples. Tests of the holders have shown that they remain tight up to a temperature of at least 120 °C.
The background yielded by the set of Al-coated mirrors and ZnSe windows in SANS is low (Figure 3) and, despite the weak Bragg reflexes from the ZnSe material, which can be observed in the high-Q scattering conditions (the small spots indicated by arrows in Figure 3c), very good background subtraction for SANS data of high quality can be achieved.

3.1.2. Simultaneous FTIR and SANS on PEGDME in Solution

Unlike crystallization from bulk or melt, a variety of processes, such as the formation of polymer and solvent compounds, a physical gelation, or a liquid–liquid phase separation, may take place when polymers crystallize from solution, depending on the solvent type and polymer concentration and molecular weight [25].
PEGDME is a semi-crystalline polymer, soluble in water and compatible with most organic solvents. When PEGDME crystallizes from solution, crystallites grow as aggregates of small layers of lamellae with branching and splitting. The morphology of this hierarchical organization of structures over a wide length scale, between nm and μm, can be resolved by SANS. In the crystalline state, PEGDME takes a regular helical conformation, which can be regarded approximately as a uniform (7/2) helix [26,27]. When taking a long helical structure, PEGDME chains exhibit some sharp conformational regularity IR bands, such as the 1345 cm−1 A2 band [28,29]. Thus, the combination between SANS and in situ FTIR is a powerful method for the study of the kinetics and morphology of polymer crystallization from solution.
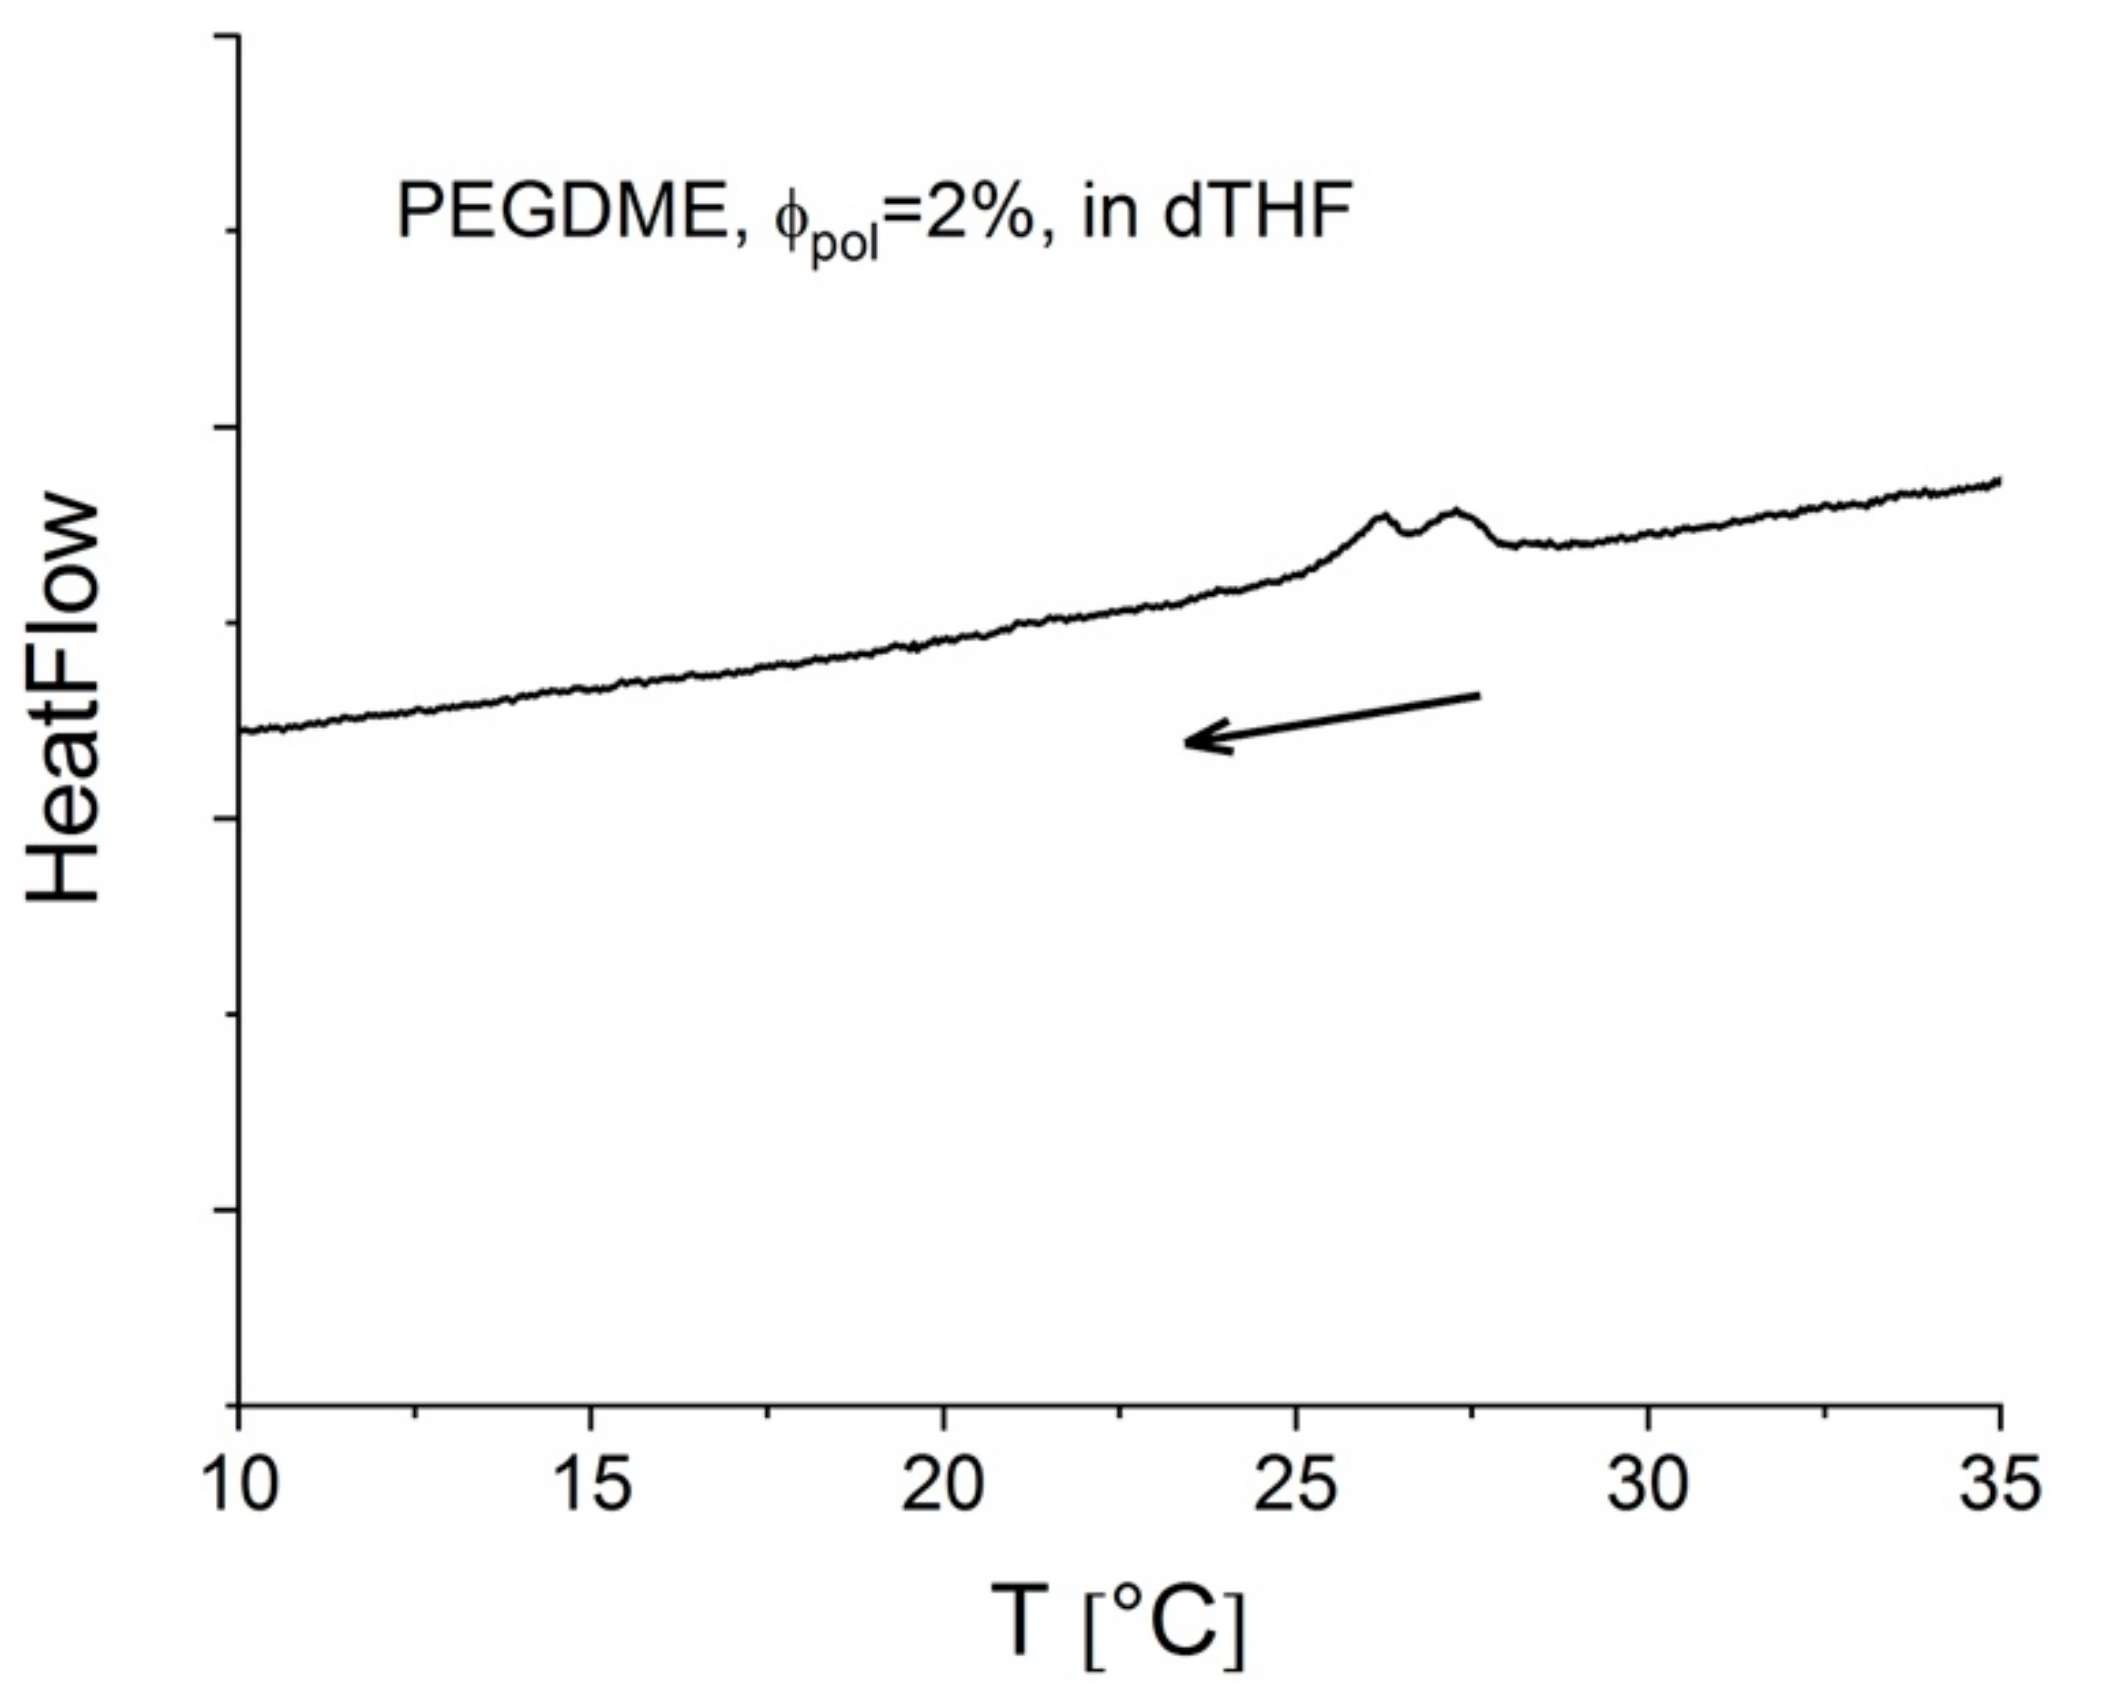
In Figure 4 we report the results of the DSC scan taken under nitrogen atmosphere between 50 °C and 10 °C from the solution of the PEGDME in dTHF with a cooling rate of 5 °C/min. The polymer crystallization occurs at about TC = 26–27 °C, with two peaks observed in the heat flow curve, an effect similar to that observed for the bulk crystallization of PEG [30]. Therefore, in order to investigate the change in conformation of PEGDME chains and the formation of polymer crystalline morphology at mesoscopic scale when passing through the TC, we performed the simultaneous FTIR and SANS analysis of the hPEGDME in dTHF solution at 30 °C, above the TC, followed by a rapid cooling to 12 °C, below the TC.
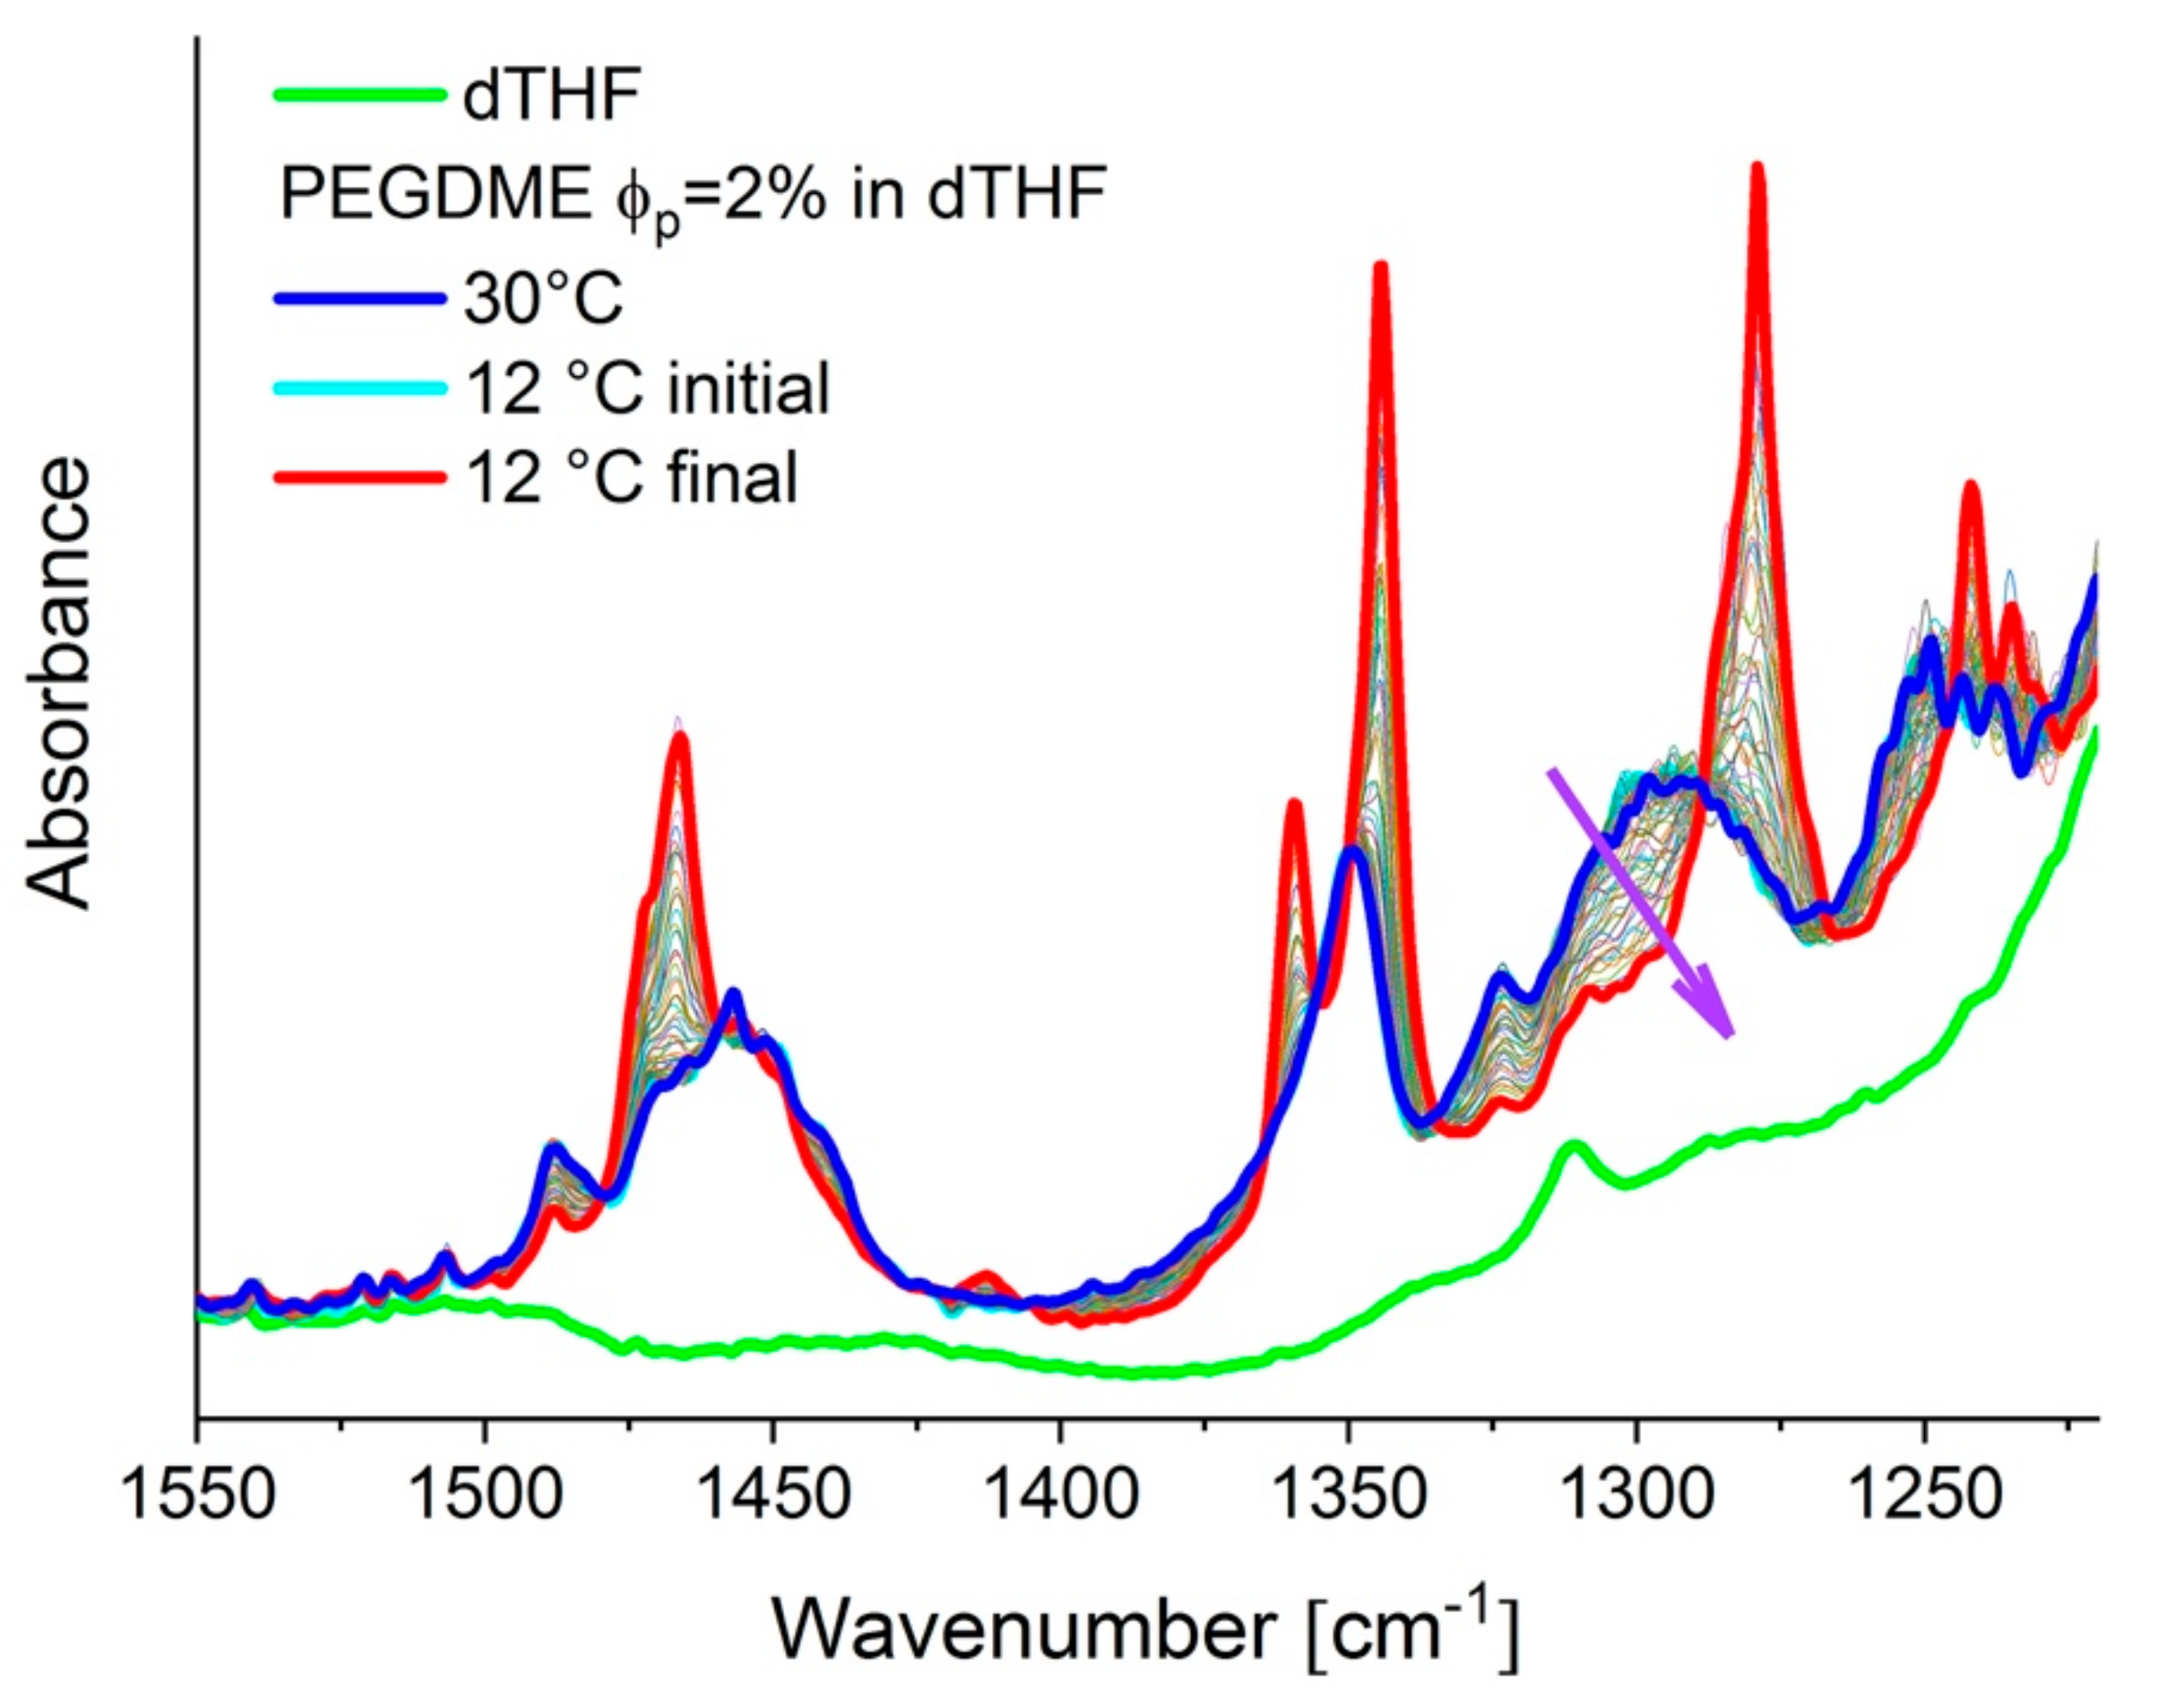
Figure 5 shows a selected range of the infrared spectra from the hPEGDME in dTHF at 30 °C (blue line) and at 12 °C (with the cyan and red lines indicating the initial and final stages, and the other lines in between depicting the time evolution of the spectrum at this temperature) in parallel with the spectrum of dTHF taken at 30 °C. Upon reaching the temperature of 12 °C, infrared spectra from the sample were collected every 30 s within a time interval of 35 min, to follow the kinetics for isothermal crystallization of polymer in solution. The time-resolved analysis clearly shows the evolution and transformation of the band at 1352 cm−1, which is characteristic of amorphous polymer structure (single coil in solution) and well visible in the initial stage at 12 °C, into the bands at 1345 cm−1 and 1364 cm−1, which are characteristic of the helical conformation of polymer chain in the crystalline state and well visible in the final stage at 12 °C. All other bands, corresponding to either the amorphous conformation in the initial stage or the helical conformation in the final stage, correspond to frequencies reported for the PEG system [31,32].
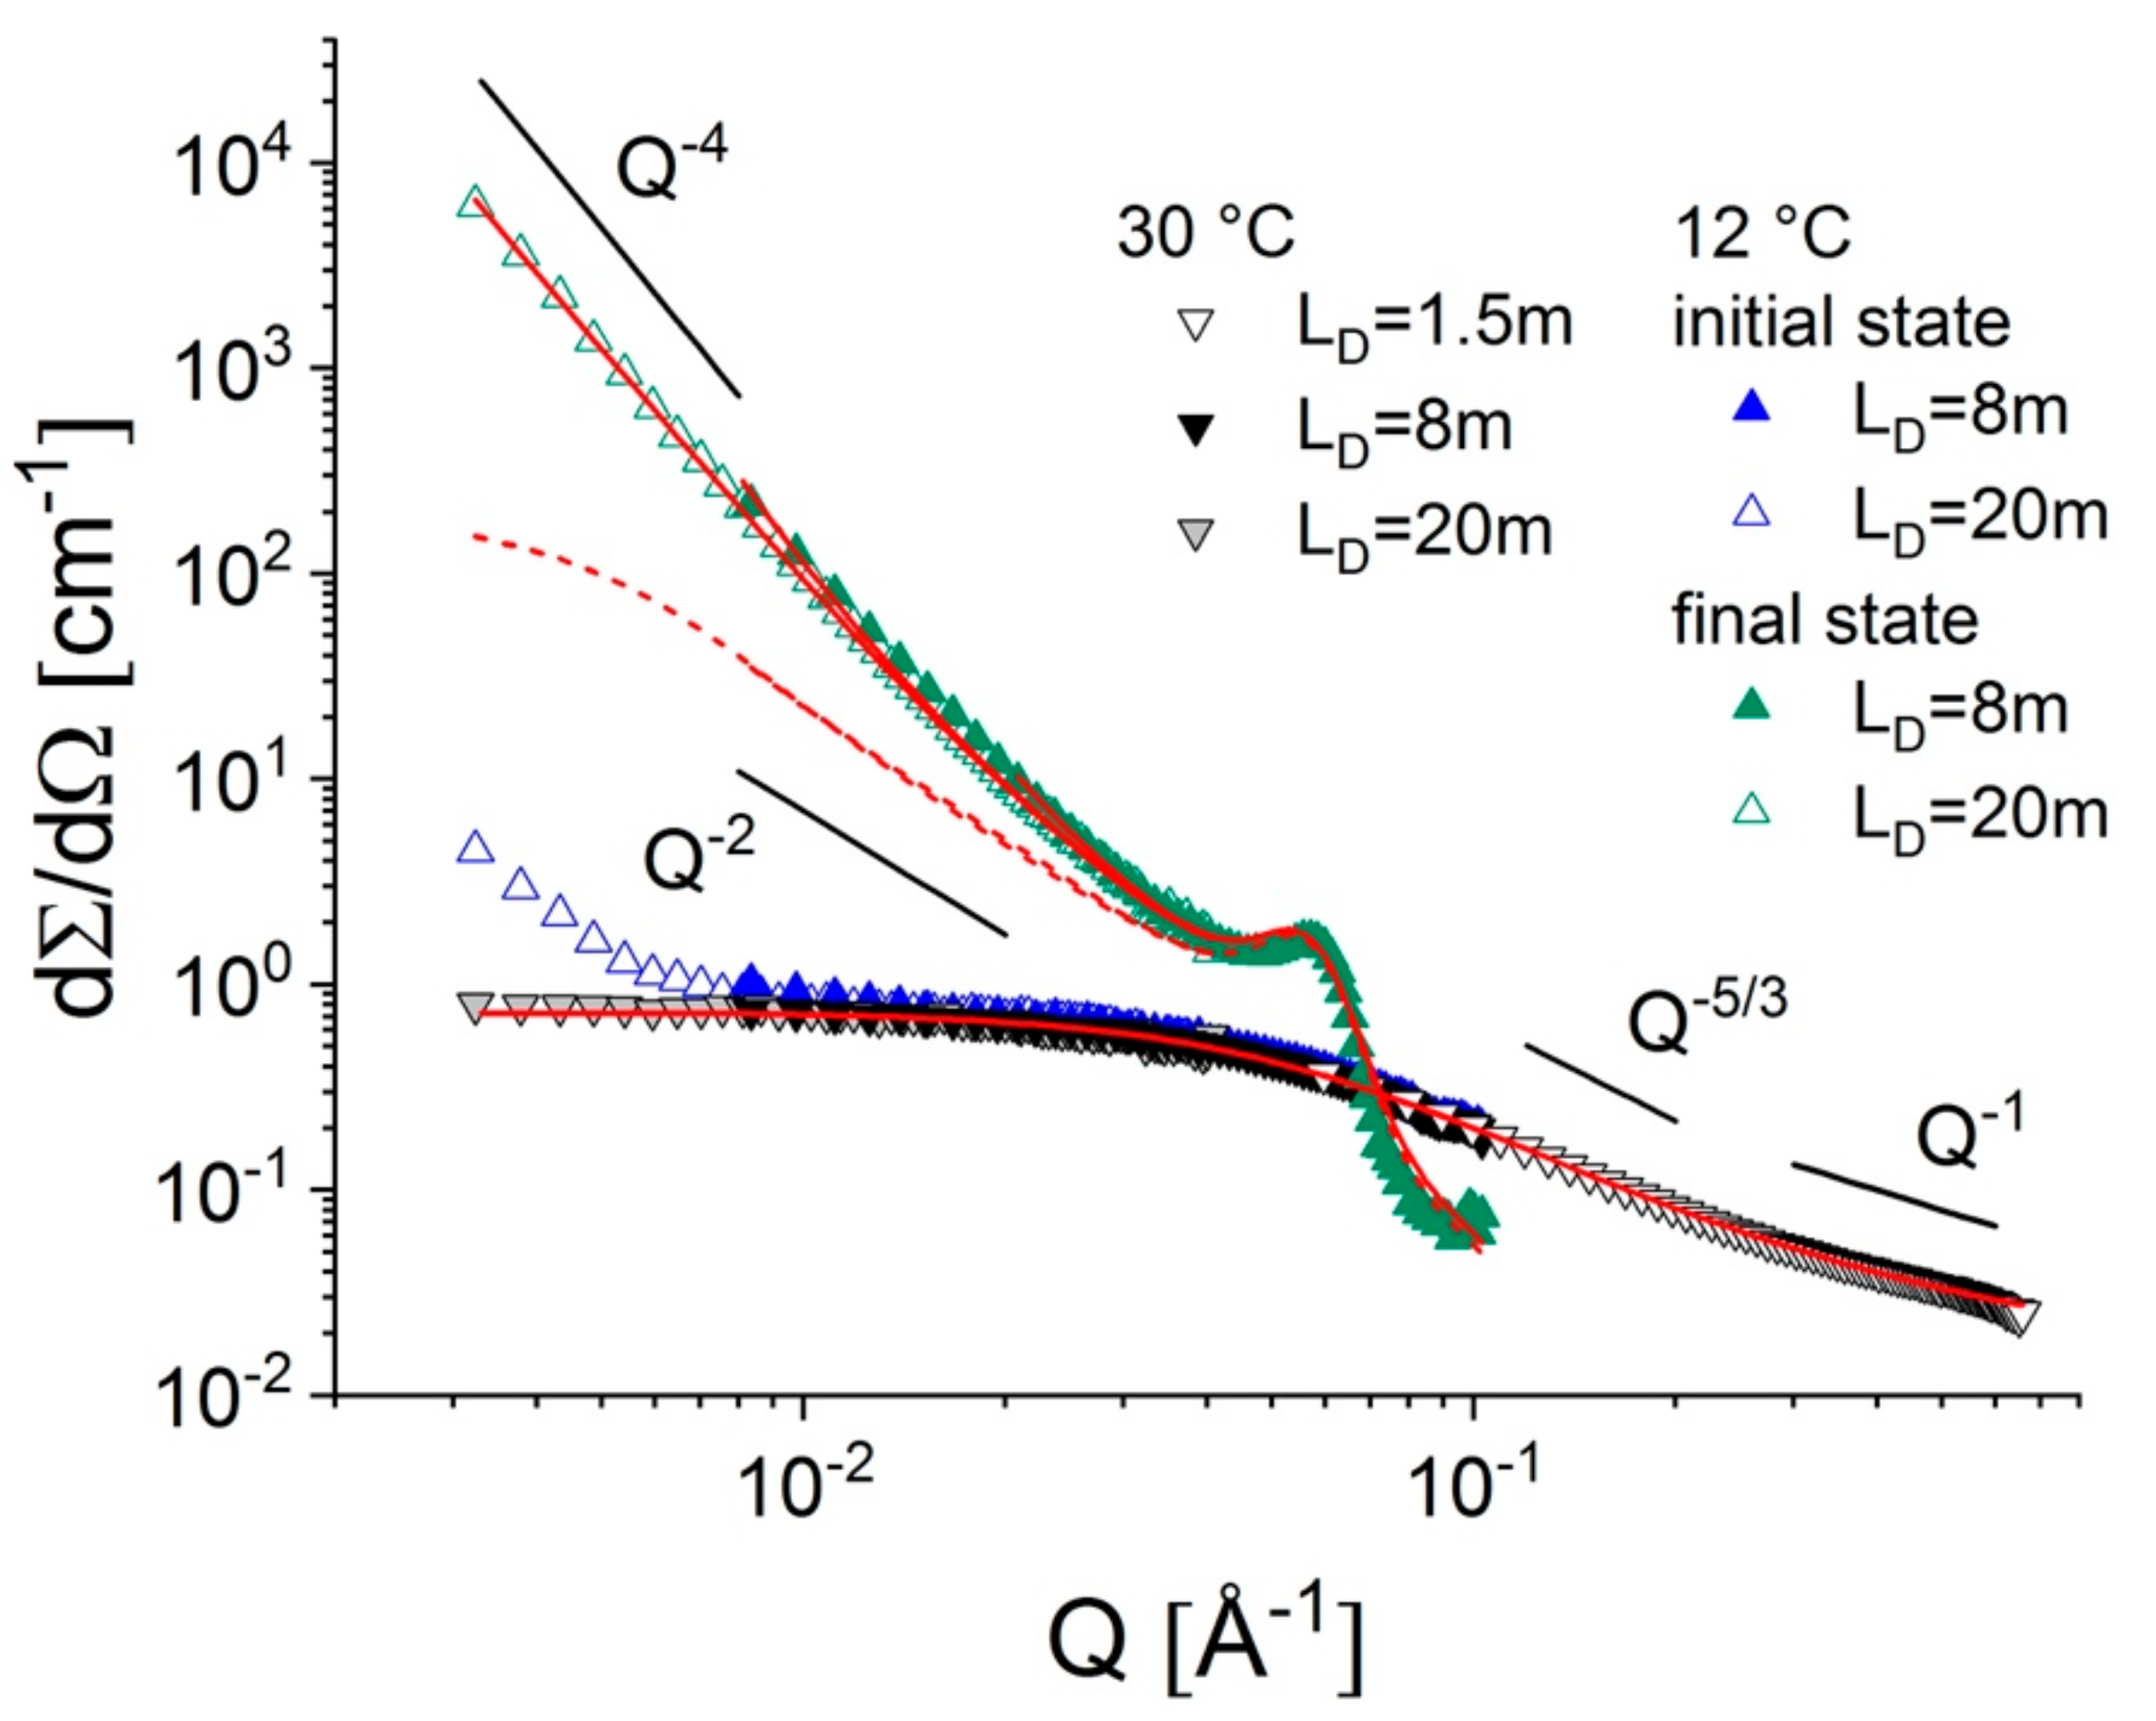
The polymer morphology in solution at 30 °C and 12 °C in the initial and final stages of crystallization was investigated by SANS in parallel with the FTIR analysis. Figure 6 reports the corrected and calibrated SANS results collected simultaneously with the acquisition of the infrared spectra. The power law exponents (Qp) specific for different polymer morphologies are given. Hence, swollen single coils (p = 5/3), one-dimensional morphologies or Kuhn segments (p = 1), lamellar (p = 2), and large 3D morphologies with sharp interfaces (p = 4) can be directly identified and characterized [33]. The model curves of the semi-flexible single coil and the crystalline lamellar stacks morphologies described later are also depicted.
At 30 °C all polymers are dissolved as semi-flexible coils in solution, as shown by the single-chain form factor features identified in the scattering profiles: the plateau towards low Q yields information about the volume fraction and molecular weight while the bending down of the intensity is characteristic of the Guinier regime, from which information about the radius of gyration of the polymer coil is obtained. The Q−5/3 power law regime towards high Q is indicative of excluded volume interactions between the chain segments (with −5/3—Flory’s exponent). A transition to Q−1 behavior is observed at higher Q, which indicates that short stiff (linear) polymer segments with a persistence length lP = b/2, with b the Kuhn segment, exist at a local length scale [34]. The small-angle scattering pattern at 30 °C was fitted using the unified Beaucage model [35] for multiple structural levels in hierarchical morphologies. The approach described the experimental data well and delivered the sizes involved in each structural level: the Rg = 37 Å of the polymer coil and the persistence length lP = 7.5 Å. Thus, both FTIR and SANS results are in good agreement regarding the polymer conformation at 30 °C as semi-flexible coil in solution.
At 12 °C, due to methodical reasons, we used the typical procedure for carrying out experiments over an extended Q-range by combining different LD’s rather than the time-resolved measurements on a selected narrow Q-range. Thus, the raw data were collected for one minute at two detection distances, LD = 8 m and 20 m (always in this order), with the detector movement from one position to another taking 10 min. Two sets of measurements were performed at 12 °C, starting at the time when the set temperature was attained by the Peltier-based variable temperature cuvette holder, which corresponds to the acquisition start of the cyan IR spectrum in Figure 5.
A decrease in the temperature resulted in the formation of polymer crystalline morphology that led to an increase of the scattering level towards low Q compared with the single chain scattering feature, as observed in the SANS results corresponding to the initial state at 12 °C (blue symbols in Figure 6). As observed in the FTIR spectra, a coexistence between an amorphous conformation of PEGDME, on one hand, and a slow increase in number density of crystallites by nucleation and growth, on the other hand, is observed, which explains the SANS pattern.
The scattering data collected in the end state at 12 °C indicate the formation at mesoscale of a morphology made of crystalline lamellae alternating with amorphous interlamellar regions, as denoted by the peak-like feature which indicates an interlamellar domain spacing of D* = 2π/Q*: where Q* represents the peak position, and the steep increase of intensity towards low Q, due to association of the lamellar stacks in bundles and branches, which led to the formation of a large scale spherulite morphology.
The scattering features characteristic of such morphology appear at much lower Q values than the range covered in pinhole mode with the KWS-2 [1] and in the current experiment only the high-Q asymptotic behavior of the scattering from the polymer spherulites could be observed (green symbols, Q−4 power law behavior). A fit with the model combining the form factor of individual lamellar slabs with the paracrystalline structure factor describing the stacking effects over distances larger than the lamellar thickness [33] successfully described the experimental SANS data and delivered the interlamellar distance D* = 110 Å and its large smearing σD* = 30 Å. A power law term with the exponent p = 4, as discussed above, was considered for a proper description of the data at low Q, which far exceeds the scattering from the polymer lamellae (depicted as a red dotted curve in Figure 6, based on the fitted parameters). A value for the lateral extension of lamellae (assumed as discs) much larger than their thickness was assumed as fixed parameter (RL = 500 Å), as long as this size level cannot be observed towards low Q, while a fixed lamellar thickness d = 45 Å [17] was considered in the fitting procedure, since no scattering data were collected at high Q at 12 °C. The lateral extension of the lamellae does not affect the fitting of the D* and σD* parameters, as long as it is supposed to be much larger than the lateral size of the lamellar stacks. A more detailed model interpretation of the SANS data in terms of “forward scattering” and scattering length density parameters for different regions of the complex morphology [33] is beyond the goal of this report. The SANS results indicate that crystalline lamellar stacks, which form larger objects (spherulites), are the dominating morphology in the sample and are in very good agreement with the FTIR observations, which indicate that PEGDME chains are mainly in helical conformation, thus crystalline state, in these conditions.

3.1.3. Polarized FTIR Measurements

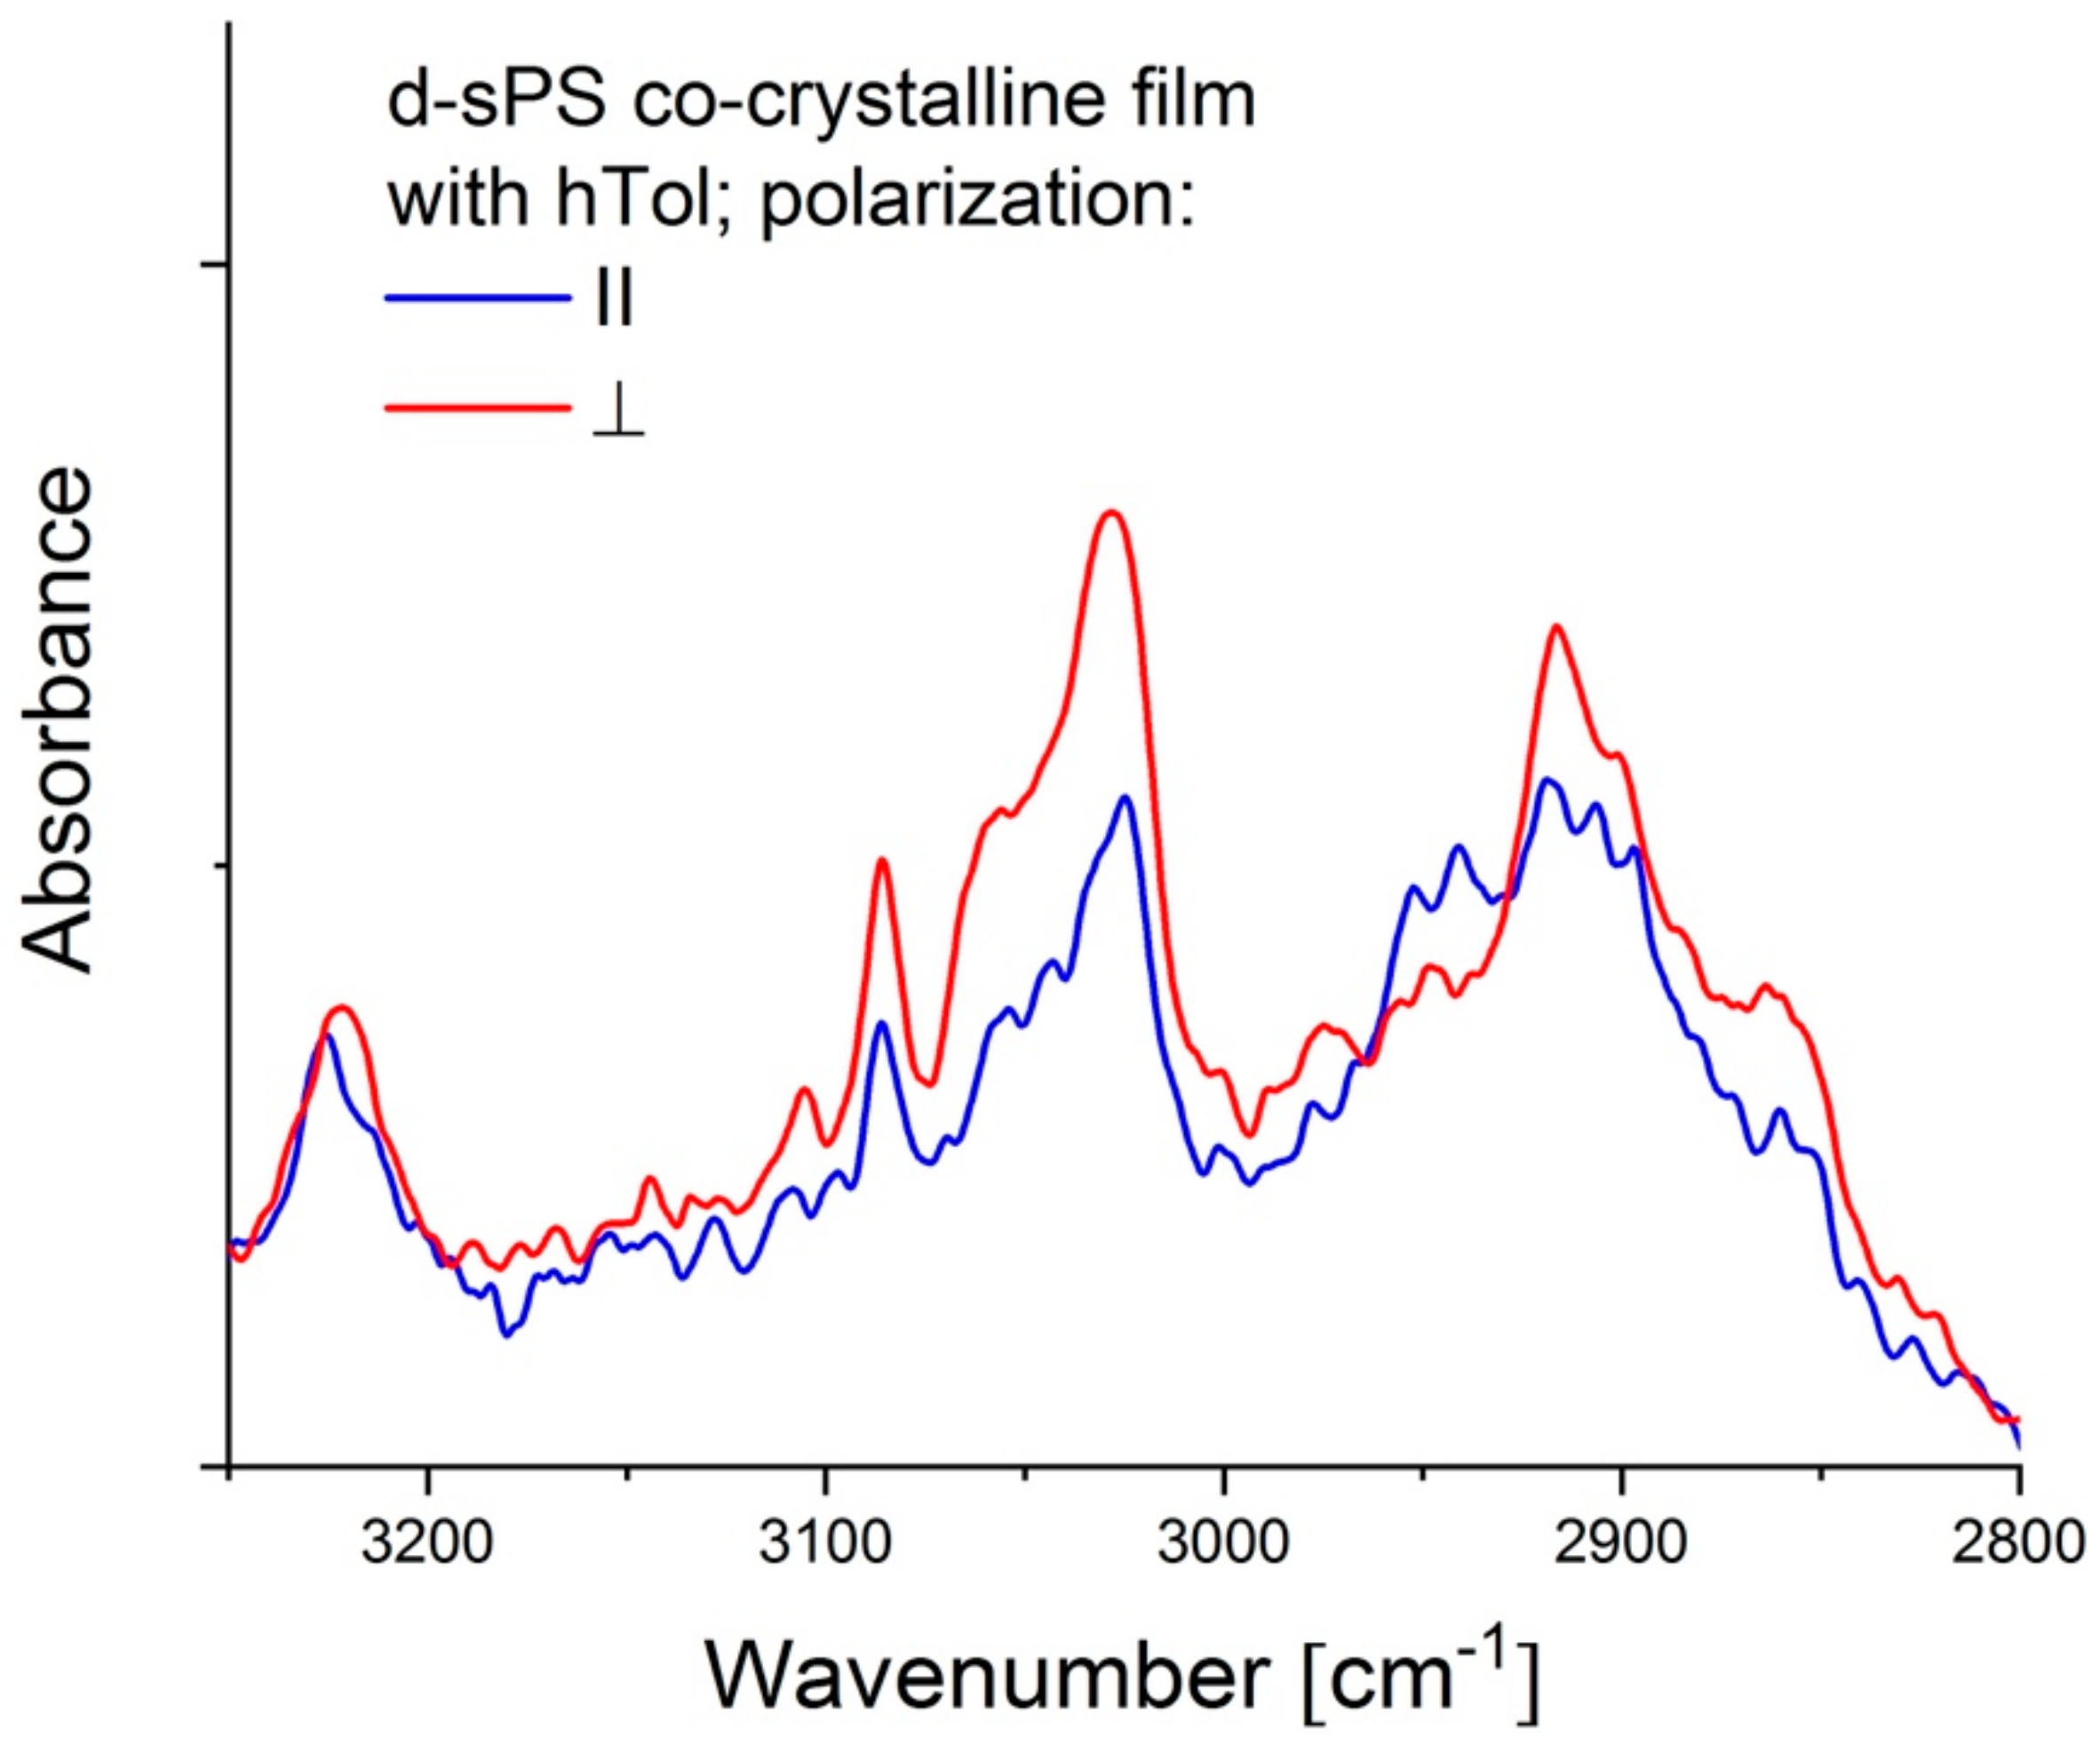
In Figure 7 we report polarized FTIR spectra measured on a d-sPS/dTol co-crystalline uniaxially deformed film with the polarized IR radiation parallel (blue line) and perpendicular (red line) to the drawing direction of the film. The FTIR analysis was done in this case independently to the SANS investigation and was meant to prove the performance of the IR polarizer using well-known samples [21]. SANS measurements on similar systems and guest exchange process were reported elsewhere [36]. The d-sPS/hTol-oriented film exhibits clear polarization in the 3100–2800 cm−1 region, which suggests that toluene guest molecules are kept oriented in the crystalline region of the d-sPS, as they are located between the oriented helices of the d-sPS host system. The hTol provides IR bands due to benzene ring C–H stretch modes in 3100–3000 cm−1, while its methyl group shows two bands due to antisymmetric stretch modes at about 2945 and 2920 cm−1 and a band due to symmetric stretch mode at about 2860 cm−1.

3.2. In Situ Dynamic Light Scattering

DLS, also known as photon-correlation spectroscopy (PCS) or quasi-elastic light scattering spectroscopy (QELSS), is based on the temporal analysis of the intensity fluctuations of the scattered light caused by the Brownian motion of particles (protein molecules, aggregates, polymer particles, etc.) in solution. The velocity of the Brownian motion is defined by a property known as the translational diffusion coefficient (D). D is related to the average hydrodynamic radius of the particles (RH) through the Stokes–Einstein equation [37]:
D = k B T 6 π η R H
where kB is the Boltzmann constant, T is the temperature, and η is the viscosity of the medium. The radius obtained by this technique is the radius of a sphere that has the same diffusion coefficient as the particle. If several particles are present in the solution, they can be easily distinguished if they are at least one order of magnitude different in size. This is particularly useful for samples, which show a tendency to aggregate over time, such as biological samples, which are sensitive to slight changes of temperature, pH of the solvent, radiation damage, etc. Since SANS measurements offering structural information on the nanometer scale often require integration times of hours, monitoring the sample composition on the minute timescale with DLS provides an additional insight into the aggregation state of the sample. This is why in situ DLS has been developed and used at many SANS beamlines so far [11,12,13,14].
A DLS measurement requires a highly monochromatic light beam, for example, produced by a laser illuminating an area of particles within a solution. The refractive index jump between those particles and the surrounding solution causes the light to be scattered. The particle size (and magnitude of Brownian motion) will affect the rate at which the intensity of this scattered light fluctuates. A single photon counting detector converts the scattered photons into standardized electric pulses. Those are fed into a digital autocorrelator which sorts the photons into time bins with respect to the time (t) when a first photon arrived at the detector and time (t + δt), when the next photon arrived on the detector. Thereby it constructs a correlation function (gII(t)). For larger particles, the scattered light changes slowly and the correlation persists for a long time. In contrast, if the particles are small and move rapidly then the correlation function decays more quickly.

3.2.1. DLS Setup

Similar to the setup developed by Heigl et al. [12], the DLS setup using the KWS-2 is built modularly, consisting of five major components: light source, optics defining the scattering geometry, detector, correlator, and computer. The optics defining the scattering geometry are placed at the sample position on the instrument, whereas the other components are mobile connected with optical fibers (Figure 8). The light from a He–Ne laser (20 mW, 632.8 nm) is coupled to a fiber (Schäfter + Kirchhoff GmbH, Hamburg, Germany) and brought to the neutron instrument. A collimator (Schäfter + Kirchhoff GmbH, Hamburg, Germany) and a mirror focus the light from the fiber into the center of the quartz cell, which was previously aligned in the center of the neutron beam. The scattered light under the angle ϑ (in the present case ϑ = 120°) is then guided by a mirror and collimated into a second fiber. The optics are mounted using standard optic holders (Thorlabs) and placed on a platform anchored on the vacuum tank of the neutron detector. This concept allows the use of a variety of sample changers with the existing optics. For alignment purposes, one can mark a spot on the quartz cuvette in the sample holder, where the laser hits the cell surface. After disconnecting the laser fiber and reconnecting it to the collimator for the scattered light, one can see and align the light path for the scattered light to the same sample spot marked in the quartz cell. This alignment is often good enough to obtain a first correlation curve which can then be optimized to a better intercept using nanoparticle solutions as highly scattering test samples. This alignment concept relies on the fact that both the laser light and the scattered light are guided through a single mode optical fiber, a specialty of this realization of in situ DLS.
After passing the mirror, the collimator, and the single mode fiber, the scattered photons arrive at an APD detector (Excelitas Technologies Corp. SPCM-AQRH-FC, Waltham, MA, USA). The recorded electrical pulses are autocorrelated with an ALV-7004 Multiple Tau Digital Correlator (ALV-GmbH, Langen, Germany). A computer displays the measured intensities and the autocorrelation functions. The correlation function and the recorded intensities are saved for further analysis. To protect the detection components, a filter wheel with neutral density filters is placed before coupling the laser light into the fiber. Based on the photon counts detected for each sample, the wheel adjusts to the optimum filter for each measurement.
A DLS measurement begins shortly after the start of the neutron measurement, which has been triggered by the instrument control software NICOS. Light scattering data are recorded in parallel and saved on a separate computer with a unique identifier containing the run number of the neutron measurement. The correlator determines the normalized intensity–intensity (second-order) auto-correlation function gII(τ). Data processing is performed post-experiment, by obtaining the electrical field first-order correlation function gI(τ) from gII(τ), according to the Siegert relation. gI(τ) is interpreted using a triple-exponential fit, corresponding to a triple-modal distribution [38]. For samples with higher polydispersity, a CONTIN fit routine can be used [39].

3.2.2. Proof of Concept: Investigation of Silica Nanospheres

Silica nanospheres (20 nm, NanoXactTM, nanoComposix, San Diego, CA, USA) were investigated as a proof of concept. The water-based solution with a reported concentration of 5 mg mL−1 was used as received. According to the producer, these nanospheres are sensitive to lower temperatures, leading to aggregation. Their diameter is 21.4 ± 2.7 nm, as determined by JEOL 1010 transmission electron microscope gravimetric analysis. In terms of absorption characteristics, their optical density at the 632.8 nm wavelength of the DLS-laser is lower than 0.005, meaning the light absorption by the silica nanosphere at this wavelength is negligible. The SANS data shown in Figure 9 confirms the silica nanosphere radius (Rns = 11.9 nm with polydispersity σ = 12%) and is not altered by the formation of any aggregates. On the other hand, the DLS investigations performed in parallel reveal that there are also larger structures in the solution of the silica nanospheres. The intensity of the first-order correlation function gI(τ) can be attributed as follows: 18% monomer (with a signal at 0.48 ms, corresponding to an average hydrodynamic radius of 13.3 nm) and 63% to aggregates (average RH of 185 nm). Less than 15% of the intensity can be attributed to larger-sized aggregates (RH ~2 μm) or can be assumed to occur because of noise. Given that the scattering intensity strongly depends on the particle’s volume, the percentage corresponds to 98% monomer and 2% aggregates. The reason for the presence of aggregates can be assumed as a thermal mistreatment of the sample due to temperature variation.

3.2.3. A Typical Sample: Apomyoglobin

Apomyoglobin in the molten globule state was investigated by SANS and in situ DLS. Because the protein is not in its native-alike state and the sample concentration is significantly higher than in the living organism, this system is prone to aggregation. Even slight changes in temperature and pH of the environment can lead to sudden aggregation. To ensure that the sample does not change during the SANS experiment, in situ DLS was employed. Every 5th minute during the hours-long SANS experiment, a DLS measurement was performed.
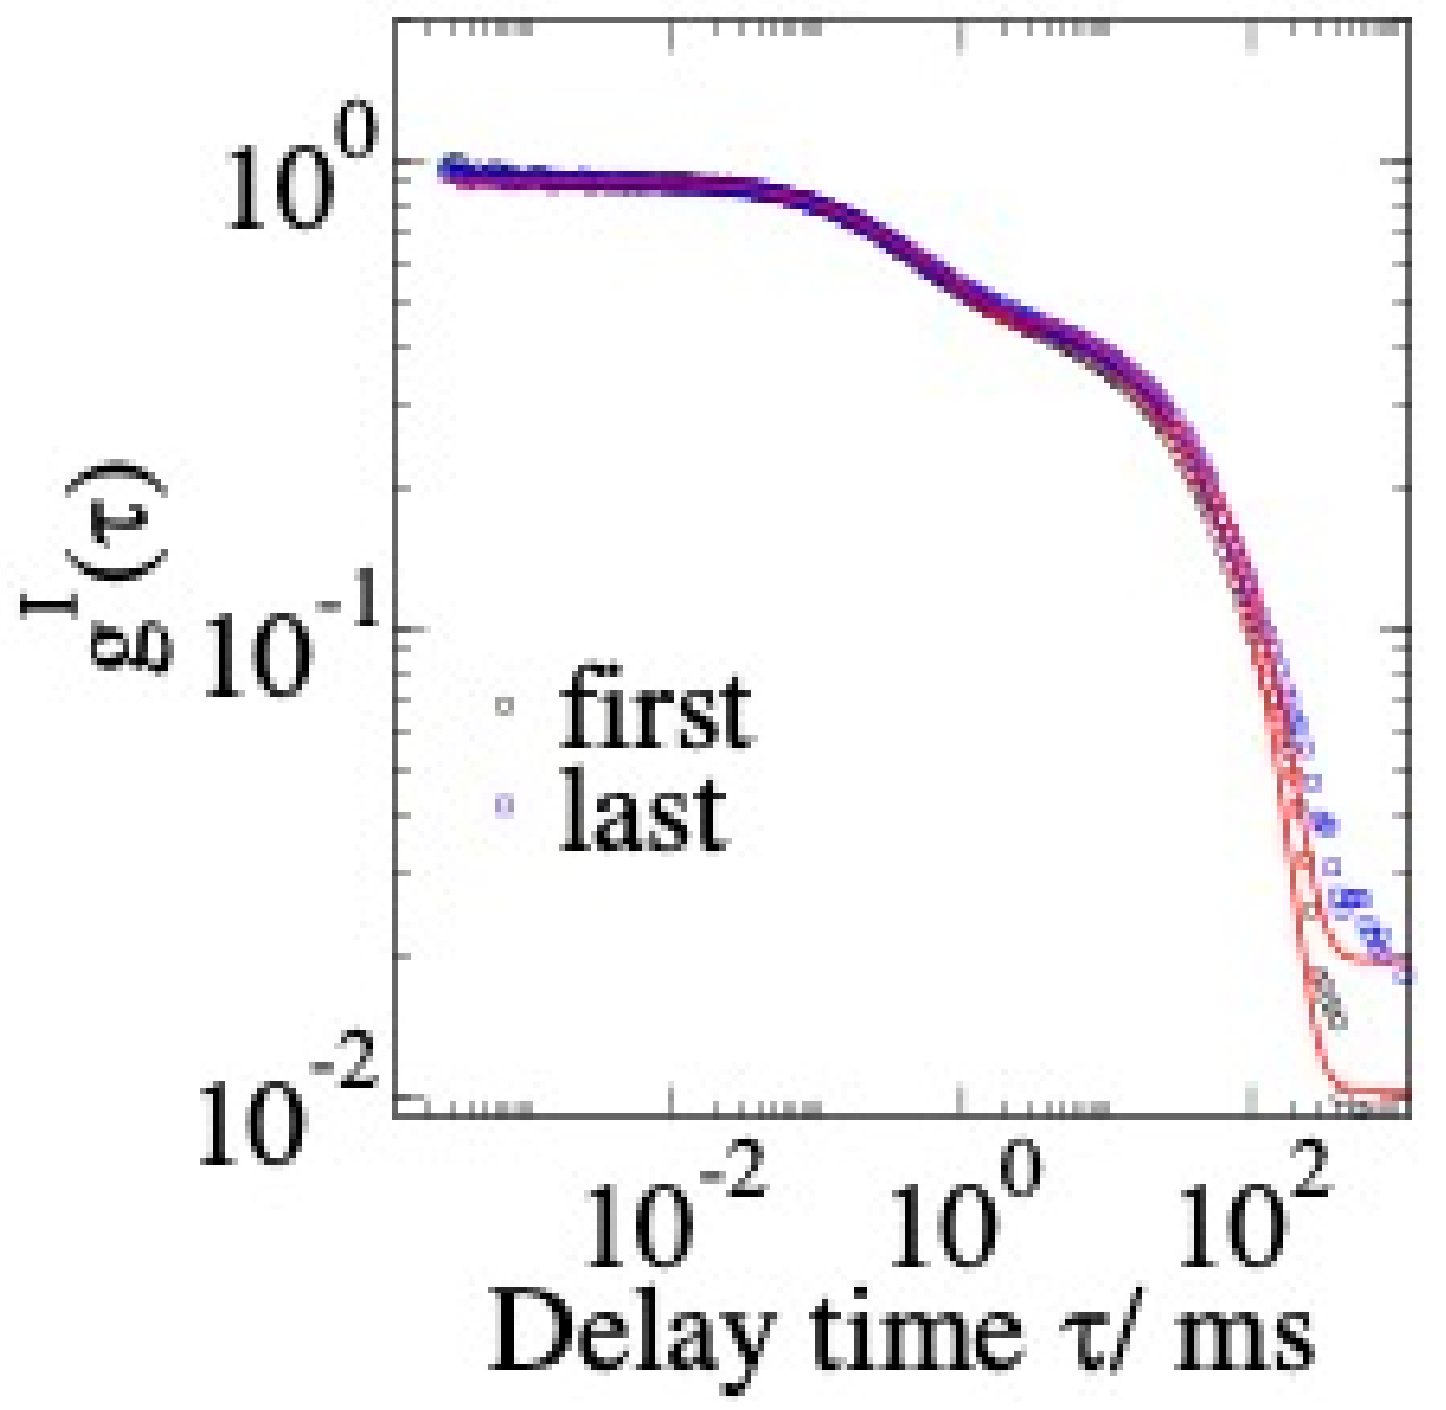
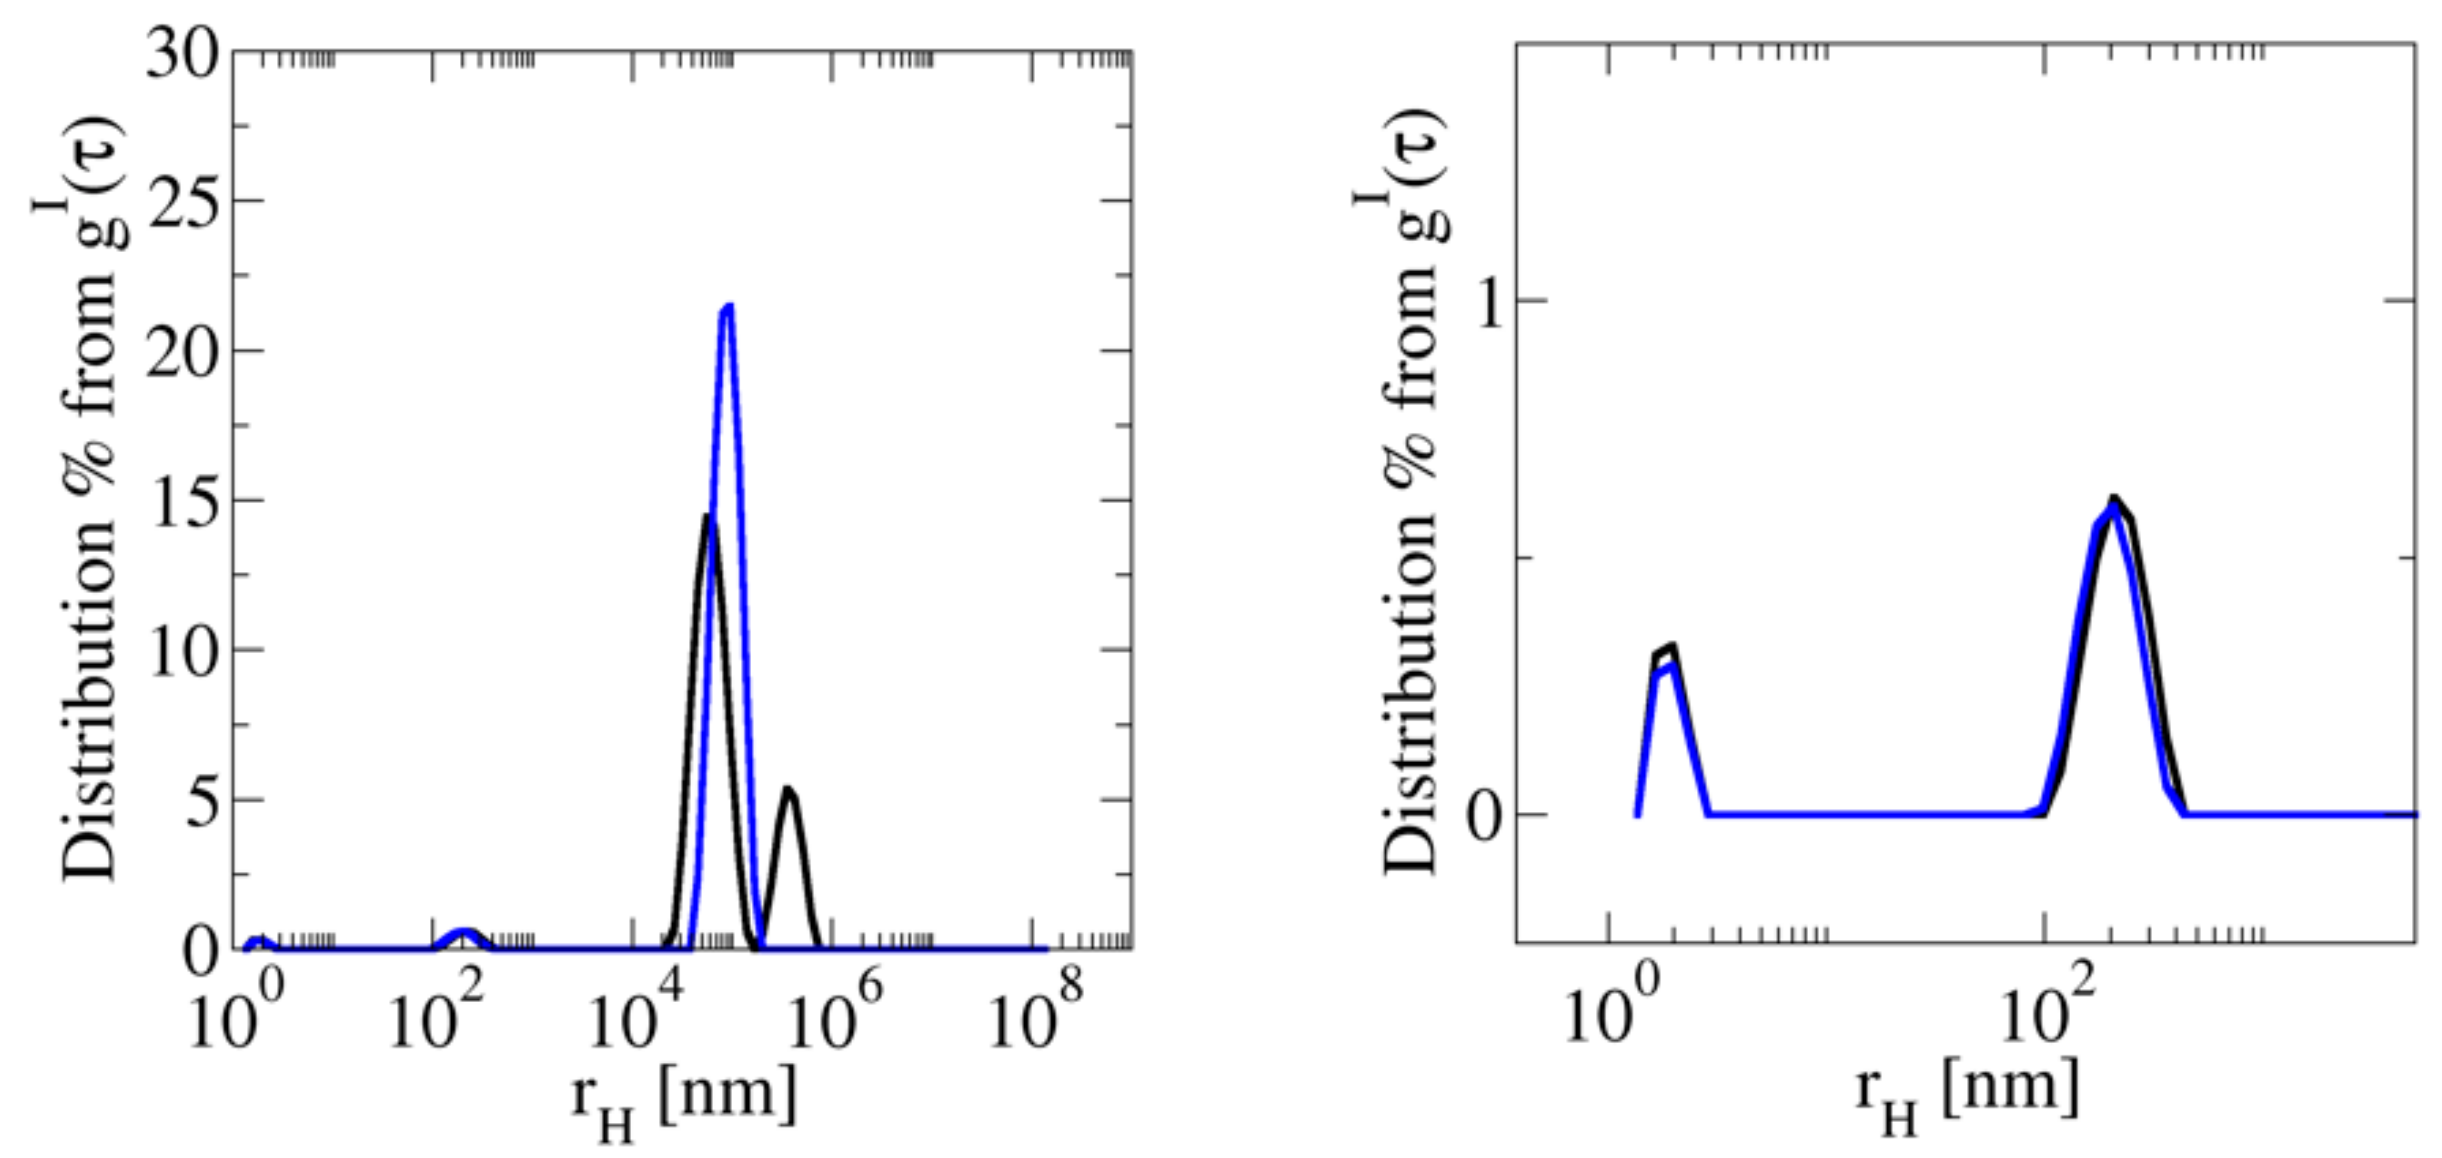
The first and the last measurement are shown in Figure 10 and one can see that the sample did not change. The first-order correlation function was evaluated using the CONTIN algorithm [39] and the particle-size distribution according to the scattering intensity can be seen in Figure 11. This confirms that the molten globule apomyoglobin solution did not form more aggregates during the SANS experiment and the amount of aggregates present already at the start of the SANS experiment could be determined. Beyond the RH~2 nm monomers, larger structures of RH ~100 nm are present in the solution. Signals of particles of RH > 10 μm which are attributed to noise can also be identified. Nevertheless, based on the fact that the scattering intensity is strongly dependent on the particle’s volume, the largest number of particles in the solution is represented by monomers and the second largest by the RH ~100 nm aggregates.
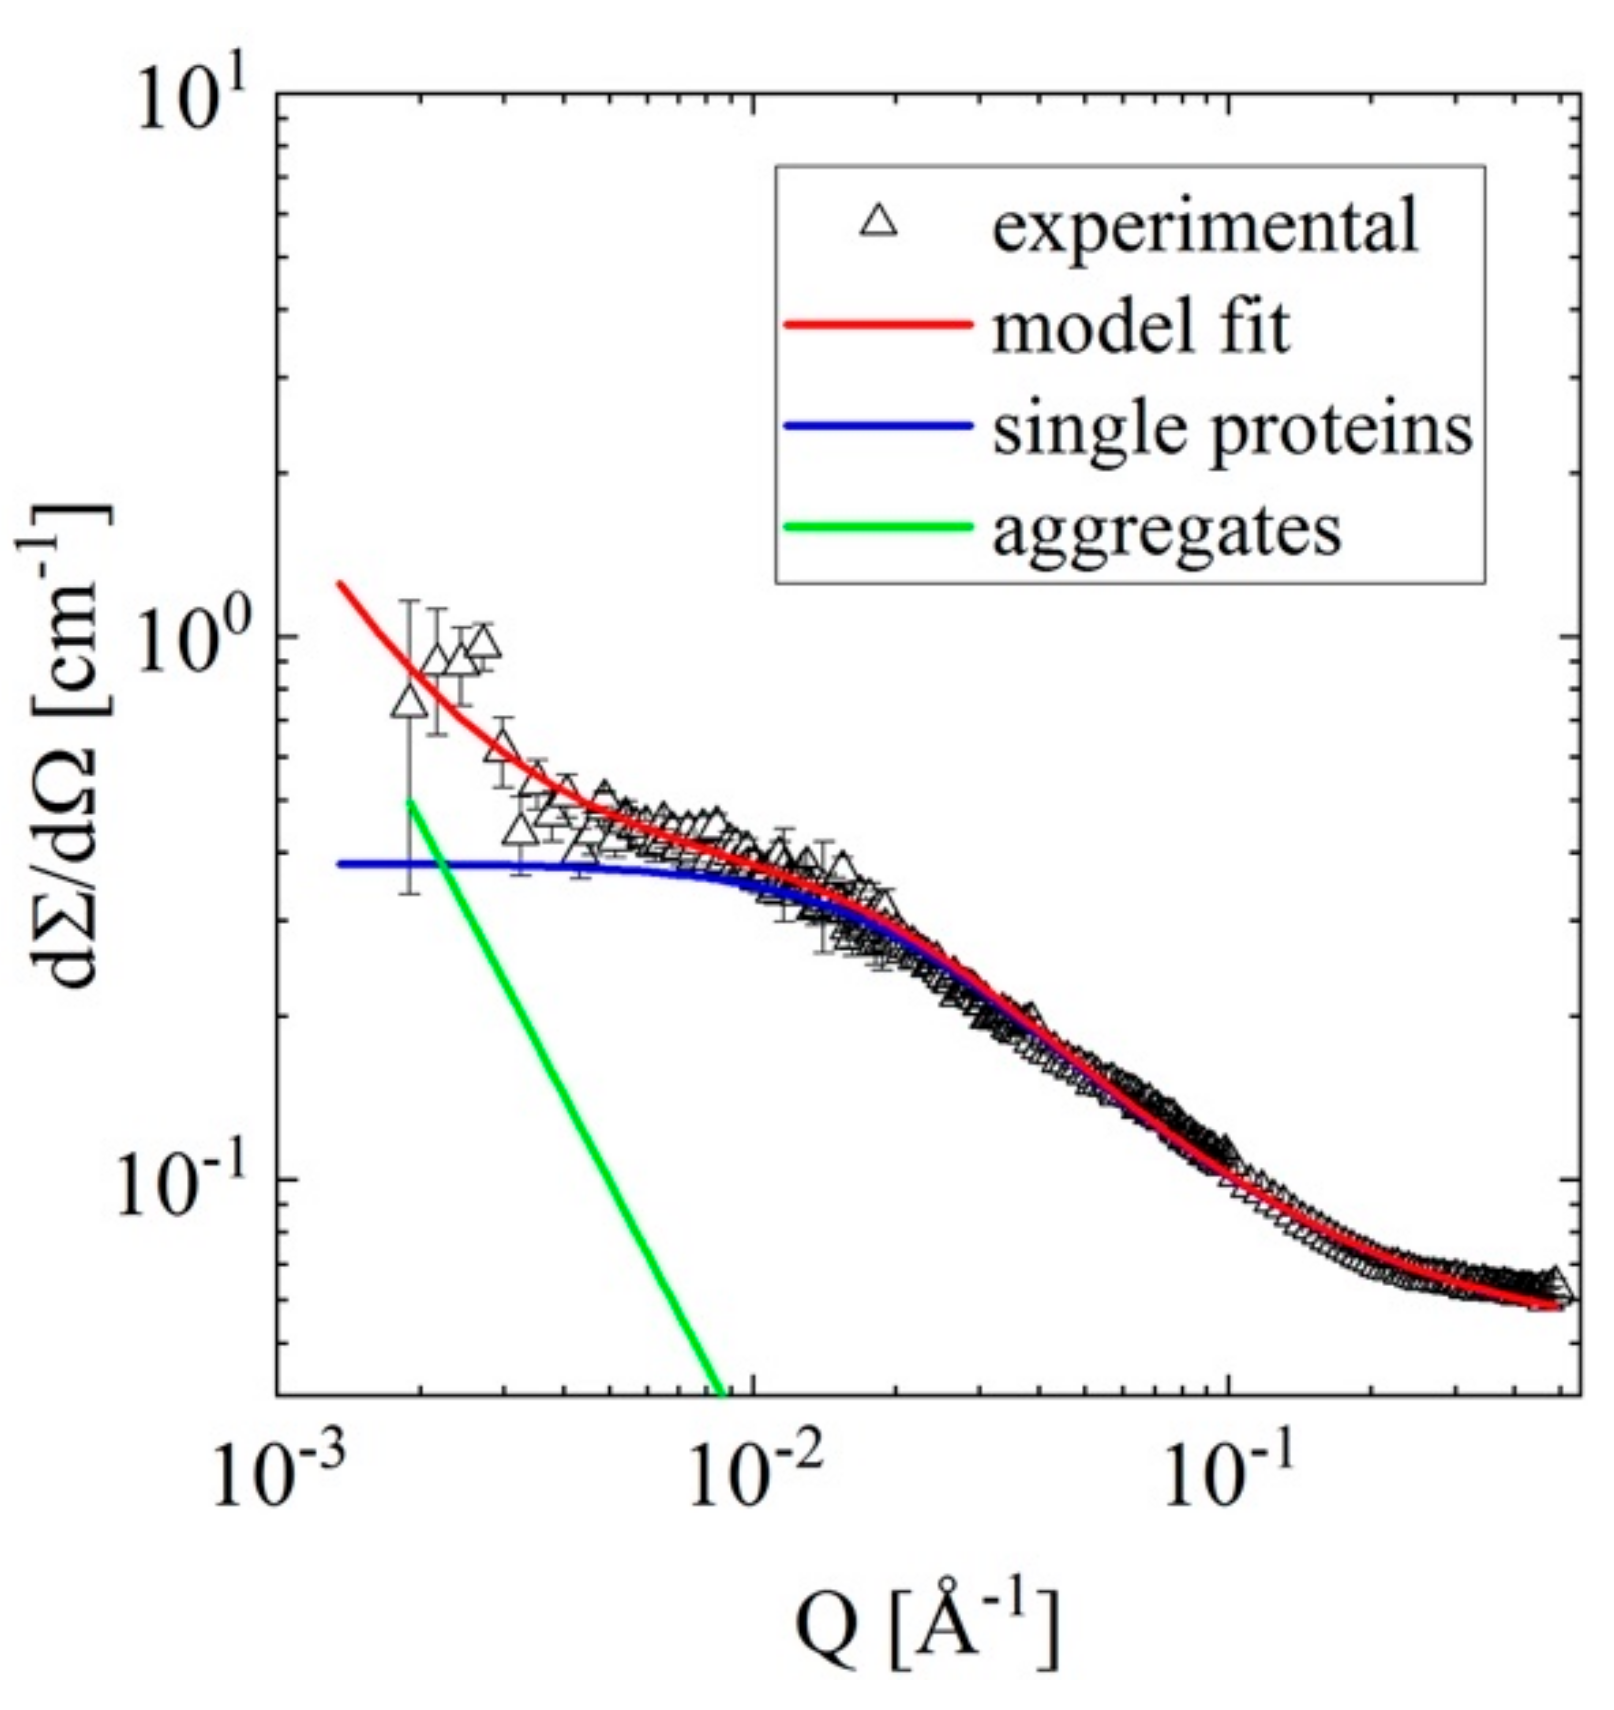
Figure 12 shows the corresponding SANS curve to the in situ DLS data discussed above. The scattering profile of the monomeric protein apomyoglobin is represented by the blue line and was determined based on the polymer with excluded volume model [40] and previous knowledge about the protein: excluded volume parameter ν = 0.46 and Rg = 2.5 nm [41].
The green line shows the scattering contribution from the aggregates with RH = 150 nm (which can be roughly approximated to Rg = 116 nm, according to the ratio Rg/RH = (3/5)0.5 [42]). Since for such large morphologies the Guinier regime occurs at lower Q values than the Q-range of the current SANS investigation, this contribution mostly resembles the power law regime of the Beaucage model with the Porod exponent p = 5/3 [35]. The red line is obtained by adding the blue and green lines, with an appropriate power law scaling factor at low Q, to describe the data well. Using this additional information from the in situ DLS measurement, one can now interpret the SANS curve better.

4. Conclusions

We reported here the concept and proof-of-principle tests of the in situ Fourier transform infrared (FTIR) spectroscopy and dynamic light scattering (DLS) analysis using the high intensity and extended Q-range SANS diffractometer KWS-2. Simultaneous approaches using light absorption and scattering with standard or real time SANS are now possible with the KWS-2, which enable in-beam control of the sample quality or provide complementary structural and composition information to neutrons. The performance of each setup was demonstrated using systems representative of those typically investigated on this beamline and benchmarked to studies performed offline.
These developments have been greatly assisted by the short exposure times provided by the high neutron flux of the FRM II reactor, the increased maneuverability allowed at the sample position of the instrument, and the flexibility of the instrument control software, NICOS, which is developed in-house at Garching.

Author Contributions

Conceptualization, L.B., T.E.S., A.R.; methodology, F.K., T.E.S., A.R.; software, G.B.; validation, L.B., F.K., T.E.S., A.R.; investigation, L.B., T.E.S., A.R.; data curation, L.B., T.E.S., A.R.; writing—original draft preparation, L.B., F.K., T.E.S., A.R.; writing—review and editing, L.B., T.E.S., A.R. All authors have read and agreed to the published version of the manuscript.

Funding

Not applicable.

Institutional Review Board Statement

Not applicable.

Informed Consent Statement

Not applicable.

Data Availability Statement

The data presented in this study are available on request from the corresponding author.

Acknowledgments

We are thankful to Simon Staringer, Vladimir Ossovyi, Thomas Kohnke, and Andreas Nebel (JCNS) for their technical support during installation and commissioning of the in situ FTIR and DLS setups with the KWS-2 SANS diffractometer. Design and realization of the Peltier-based variable temperature cuvette holder by Vladimir Ossovyi (JCNS) is specially acknowledged. The help from Maria-Maddalena Schiavone with the DSC measurements is gratefully acknowledged. A. R. is thankful to Hiroki Iwase (CROSS Neutron Science and Technology Center, Tokai, Japan) for help with the concept drawings of the sample cuvettes for the FTIR and SANS setup. This project was partially financially supported by the BMBF projects 05K16PA1 and 05K19PA3. T. E. S. wishes to thank Stefan Rustler, Simon Lechlmayr, and Raimund Heigl for their pioneering work on the in situ DLS setup.

Conflicts of Interest

The authors declare no conflict of interest.

References

  1. Radulescu, A.; Pipich, V.; Frielinghaus, H.; Appavou, M.-S. KWS-2, the high intensity/wide Q-range small-angle neutron diffractometer for soft-matter and biology at FRM II. J. Phys. Conf. Ser. 2012, 351, 012026. [Google Scholar] [CrossRef] [Green Version]
  2. Bras, W.; Derbyshire, G.E.; Devine, A.; Clark, S.M.; Cooke, J.; Komanschek, B.E.; Ryan, A.J. The Combination of Thermal Analysis and Time-Resolved X-ray Techniques: A Powerful Method for Materials Characterization. J. Appl. Crystallogr. 1995, 28, 26–32. [Google Scholar] [CrossRef]
  3. Bryant, G.K.; Gleeson, H.F.; Ryan, A.J.; Fairclough, J.P.A.; Bogg, D.; Goossens, J.G.P.; Bras, W. Raman spectroscopy combined with small angle X-ray scattering and wide angle X-ray scattering as a tool for the study of phase transitions in polymers. Rev. Sci. Instrum. 1998, 69, 2114. [Google Scholar] [CrossRef] [Green Version]
  4. Tashiro, K.; Sasaki, S. Structural changes in the ordering process of polymers as studied by an organized combination of the various measurement techniques. Prog. Polym. Sci. 2003, 28, 451–519. [Google Scholar] [CrossRef]
  5. Hirose, R.; Yoshioka, T.; Yamamoto, H.; Reddy, K.R.; Tahara, D.; Hamada, K.; Tashiro, K. In-house simultaneous collection of small-angle X-ray scattering, wide-angle X-ray diffraction and Raman scattering data from polymeric materials. J. Appl. Crystallogr. 2014, 47, 922–930. [Google Scholar] [CrossRef]
  6. Mathew, E.; Mirza, A.; Menhart, N. Liquid-chromatography-coupled SAXS for accurate sizing of aggregating proteins. J. Synchrotron Radiat. 2004, 11, 314–318. [Google Scholar] [CrossRef] [Green Version]
  7. Radulescu, A.; Pipich, V.; Ioffe, A. Quality assessment of neutron delivery system for small-angle neutron scattering diffractometers of the Jülich Centre for Neutron Science at the FRM II. Nucl. Instrum. Methods Phys. Res. A 2012, 689, 1–6. [Google Scholar] [CrossRef]
  8. Houston, J.E.; Brandl, G.; Drochner, M.; Kemmerling, G.; Engels, R.; Papagiannopoulos, A.; Sarter, M.; Stadler, A.; Radulescu, A. The high-intensity option of the SANS diffractometer KWS-2 at JCNS—Characterization and performance of the new multi-megahertz detection system. J. Appl. Crystallogr. 2018, 51, 323–336. [Google Scholar] [CrossRef]
  9. Jordan, A.; Jacques, M.; Merrick, C.; Devos, J.; Forsyth, T.; Porcar, L.; Martel, A. SEC-SANS: Size exclusion chromatography combined in-situ with small-angle neutron scattering. J. Appl. Crystallogr. 2016, 49, 2015–2020. [Google Scholar] [CrossRef] [Green Version]
  10. Kaneko, F.; Seto, N.; Sato, S.; Radulescu, A.; Schiavone, M.M.; Allgaier, J.; Ute, K. Development of a Simultaneous SANS/FTIR Measuring System. Chem. Lett. 2015, 44, 497–499. [Google Scholar] [CrossRef] [Green Version]
  11. Kohlbrecher, J.; Bollhalder, A.; Vavrin, R. A high pressure cell for small angle neutron scattering up to 500MPa in combination with light scattering to investigate liquid samples. Rev. Sci. Instrum. 2007, 78, 125101. [Google Scholar] [CrossRef] [PubMed] [Green Version]
  12. Heigl, R.J.; Longo, M.; Stellbrink, J.; Radulescu, A.; Schweins, R.; Schrader, T.E. Crossover from a Linear to a Branched Growth Regime in the Crystallization of Lysozyme. Crystallogr. Growth Des. 2018, 18, 1483–1494. [Google Scholar] [CrossRef]
  13. Nawroth, T.; Buch, P.; Buch, K.; Langguth, P.; Schweins, R. Liposome Formation from Bile Salt–Lipid Micelles in the Digestion and Drug Delivery Model FaSSIFmod Estimated by Combined Time-Resolved Neutron and Dynamic Light Scattering. Mol. Pharm. 2011, 8, 2162–2172. [Google Scholar] [CrossRef] [PubMed]
  14. Nigro, V.; Angelini, R.; King, S.; Franco, S.; Buratti, E.; Bomboi, F.; Mahmoudi, N.; Corvasce, F.; Scaccia, R.; Church, A.; et al. Apparatus for simultaneous dynamic light scattering–small angle neutron scattering investigations of dynamics and structure in soft matter. Rev. Sci. Instr. 2021, 92, 023907. [Google Scholar] [CrossRef]
  15. Radulescu, A.; Szekely, N.K.; Appavou, M.S.; Pipich, V.; Kohnke, T.; Ossovyi, V.; Staringer, S.; Schneider, G.J.; Amann, M.; Zhang-Haagen, B.; et al. Studying Soft-matter and Biological Systems over a Wide Length-scale from Nanometer and Micrometer Sizes at the Small-angle Neutron Diffractometer KWS-2. J. Vis. Exp. 2016, 118, e54639. [Google Scholar] [CrossRef] [Green Version]
  16. Hövelmann, C.H.; Gooßen, S.; Allgaier, J. Scale-Up Procedure for the Efficient Synthesis of Highly Pure Cyclic Poly(ethylene glycol). Macromolecules 2017, 50, 4169–4179. [Google Scholar] [CrossRef]
  17. Kaneko, F.; Radulescu, A.; Ute, K. Time-resolved SANS studies on guest exchange processes in cocrystals of syndiotactic polystyrene. Polymer 2013, 54, 3145–3149. [Google Scholar] [CrossRef]
  18. Stadler, A.M.; Koza, M.M.; Fitter, J. Determination of conformational entropy of fully and partially folded conformations of holo- and apomyoglobin. J. Phys. Chem. B 2015, 119, 72. [Google Scholar] [CrossRef] [PubMed]
  19. Gasteiger, E. Expasy: The proteomics server for in-depth protein knowledge and analysis. Nucl. Acids Res. 2003, 31, 3784. [Google Scholar] [CrossRef] [Green Version]
  20. Larkin, P.J. Infrared and Raman Spectroscopy. Principles and Spectral Interpretation; Elsevier: Amsterdam, The Netherlands, 2011. [Google Scholar]
  21. Kaneko, F.; Seto, N.; Sato, S.; Radulescu, A.; Schiavone, M.M.; Allgaier, J.; Ute, K. Simultaneous small-angle neutron scattering and Fourier transform infrared spectroscopic measurements on cocrystals of syndiotactic polystyrene with polyethylene glycol dimethyl ethers. J. Appl. Crystallogr. 2016, 49, 1420–1427. [Google Scholar] [CrossRef] [Green Version]
  22. Kaneko, F.; Kawaguchi, T.; Radulescu, A.; Iwase, H.; Morikawa, T.; Takata, S.; Nishiura, M.; Hou, Z. A new simultaneous measurement system of wide Q-range small angle neutron scattering combined with polarized Fourier transform infrared spectroscopy. Rev. Sci. Instrum. 2019, 90, 093906. [Google Scholar] [CrossRef]
  23. Kaneko, F.; Radulescu, A.; Iwase, H.; Takata, S.; Nishiura, M.; Hou, Z. Application of Simultaneous Measurement System Combining Wide Q-Range Small-Angle Neutron Scattering and Polarized Fourier Transform Infrared Spectroscopy: Cocrystal of Syndiotactic Polystyrene with Methyl Benzoate. JPS Conf. Proc. 2021, 33, 011076. [Google Scholar]
  24. Brandl, G.; Felder, C.; Pedersen, B.; Faulhaber, E.; Lenz, A.; Krüger, J. NICOS–The Instrument Control solution at the MLZ. In Proceedings of the 10th International Workshop on Personal Computers and Particle Accelerator Controls, Karlsruhe, Germany, 14–17 October 2014. [Google Scholar]
  25. Sasaki, T.; Miyazaki, A.; Sugiura, S.; Okada, K. Crystallization of Poly(ethylene oxide) from Solutions of Different Solvents. Polym. J. 2002, 34, 794–800. [Google Scholar] [CrossRef] [Green Version]
  26. Takahashi, Y.; Sumita, I.; Tadokoro, H. Structural studies of polyethers. IX. Planar zigzag modification of Poly(ethylene oxide). J. Polym. Sci. A Polym. Phys. 1973, 11, 2113–2122. [Google Scholar] [CrossRef]
  27. Kobayashi, M.; Kitagawa, K. Microstructure of poly (ethylene oxide) gels dispersed in various organic solvents. Macromol. Symp. 1997, 114, 291–296. [Google Scholar] [CrossRef]
  28. Yoshihara, T.; Tadokoro, H.; Murahashi, S.J. Normal Vibrations of the Polymer Molecules of Helical Conformation. IV. Polyethylene Oxide and Polyethylene-d4 Oxide. Chem. Phys. 1964, 41, 2902–2911. [Google Scholar] [CrossRef]
  29. Matsuura, H.; Miyazawa, T.J. Vibrational analysis of molten poly (ethylene glycol). Polym. Sci. A Polym. Phys. 1969, 7, 1735–1744. [Google Scholar] [CrossRef]
  30. Gines, J.M.; Arias, M.J.; Rabasco, A.M.; Novak, C.; Ruiz-Conde, A.; Sanchez-Soto, P.J. Thermal characterization of polyethylene glycols applied in the pharmaceutical thchnology using differential scanning calorimetry and hot stage microscopy. J. Thermal Anal. 1996, 46, 291–304. [Google Scholar] [CrossRef]
  31. Harder, P.; Grunze, M.; Dahint, R.; Whitesides, G.M.; Laibinis, P.E.J. Molecular Conformation in Oligo(ethylene glycol)-Terminated Self-Assembled Monolayers on Gold and Silver Surfaces Determines Their Ability To Resist Protein Adsorption. Phys. Chem. B 1998, 102, 426–435. [Google Scholar] [CrossRef]
  32. Miyazawa, T.; Fukushima, K.; Ideguchi, Y.J. Molecular vibrations and structure of high polymers. III. Polarized infrared spectra, normal vibrations, and helical conformation of polyethylene glycol. Chem. Phys. 1962, 37, 2764–2776. [Google Scholar] [CrossRef]
  33. Radulescu, A.; Fetters, L.J.; Richter, D. Polymer driven wax crystal control using partially crystalline polymeric materials. Adv. Polym. Sci. 2008, 210, 1–100. [Google Scholar]
  34. Ramachandran, R.; Beaucage, G.; Kulkarni, A.S.; McFaddin, D.; Merrick-Mack, J.; Galiatsatos, V. Persistence Length of Short-Chain Branched Polyethylene. Macromolecules 2008, 41, 9802–9806. [Google Scholar] [CrossRef]
  35. Hammouda, B. Analysis of the Beaucage model. J. Appl. Crystallogr. 2010, 43, 1474–1478. [Google Scholar] [CrossRef]
  36. Kaneko, F.; Radulescu, A.; Ute, K. Time-resolved small-angle neutron scattering study on guest-exchange processes in co-crystals of syndiotactic polystyrene. J. Appl. Crystallogr. 2014, 47, 6–13. [Google Scholar] [CrossRef] [Green Version]
  37. Cruickshank, M.C. The Stokes-Einstein law for diffusion in solution. Proc. R. Soc. Lond. A. 1924, 106, 724–749. [Google Scholar]
  38. Hassan, P.; Kulshreshtha, S. Modification to the cumulant analysis of polydispersity in quasielastic light scattering data. J. Colloid Interface Sci. 2006, 300, 744–748. [Google Scholar] [CrossRef] [PubMed]
  39. Provencher, S. Contin: A general purpose constrained regularization program for inverting noisy linear algebraic and integral equations. Comput. Phys. Commun. 1982, 27, 229–242. [Google Scholar] [CrossRef]
  40. Petrescu, A.J.; Receveur, V.; Calmettes, P.; Durand, D.; Desmadril, M.; Roux, B.; Smith, J.C. Small-angle neutron scattering by a strongly denatured protein: Analysis using random polymer theory. Biophys. J. 1997, 72, 335–342. [Google Scholar] [CrossRef] [Green Version]
  41. Balacescu, L.; Schrader, T.E.; Radulescu, A.; Zolnierczuk, P.; Holderer, O.; Pasini, S.; Fitter, J.; Stadler, A.M. Transition between protein-like and polymer-like dynamic behavior: Internal friction in unfolded apomyoglobin depends on denaturing conditions. Sci. Rep. 2020, 10, 1570–1580. [Google Scholar] [CrossRef] [Green Version]
  42. Kok, C.M.; Rudin, A. Relationship between the hydrodynamic radius and the radius of gyration of a polymer solution. Makromol. Chem. Rapid Commun. 1981, 2, 655–659. [Google Scholar] [CrossRef]
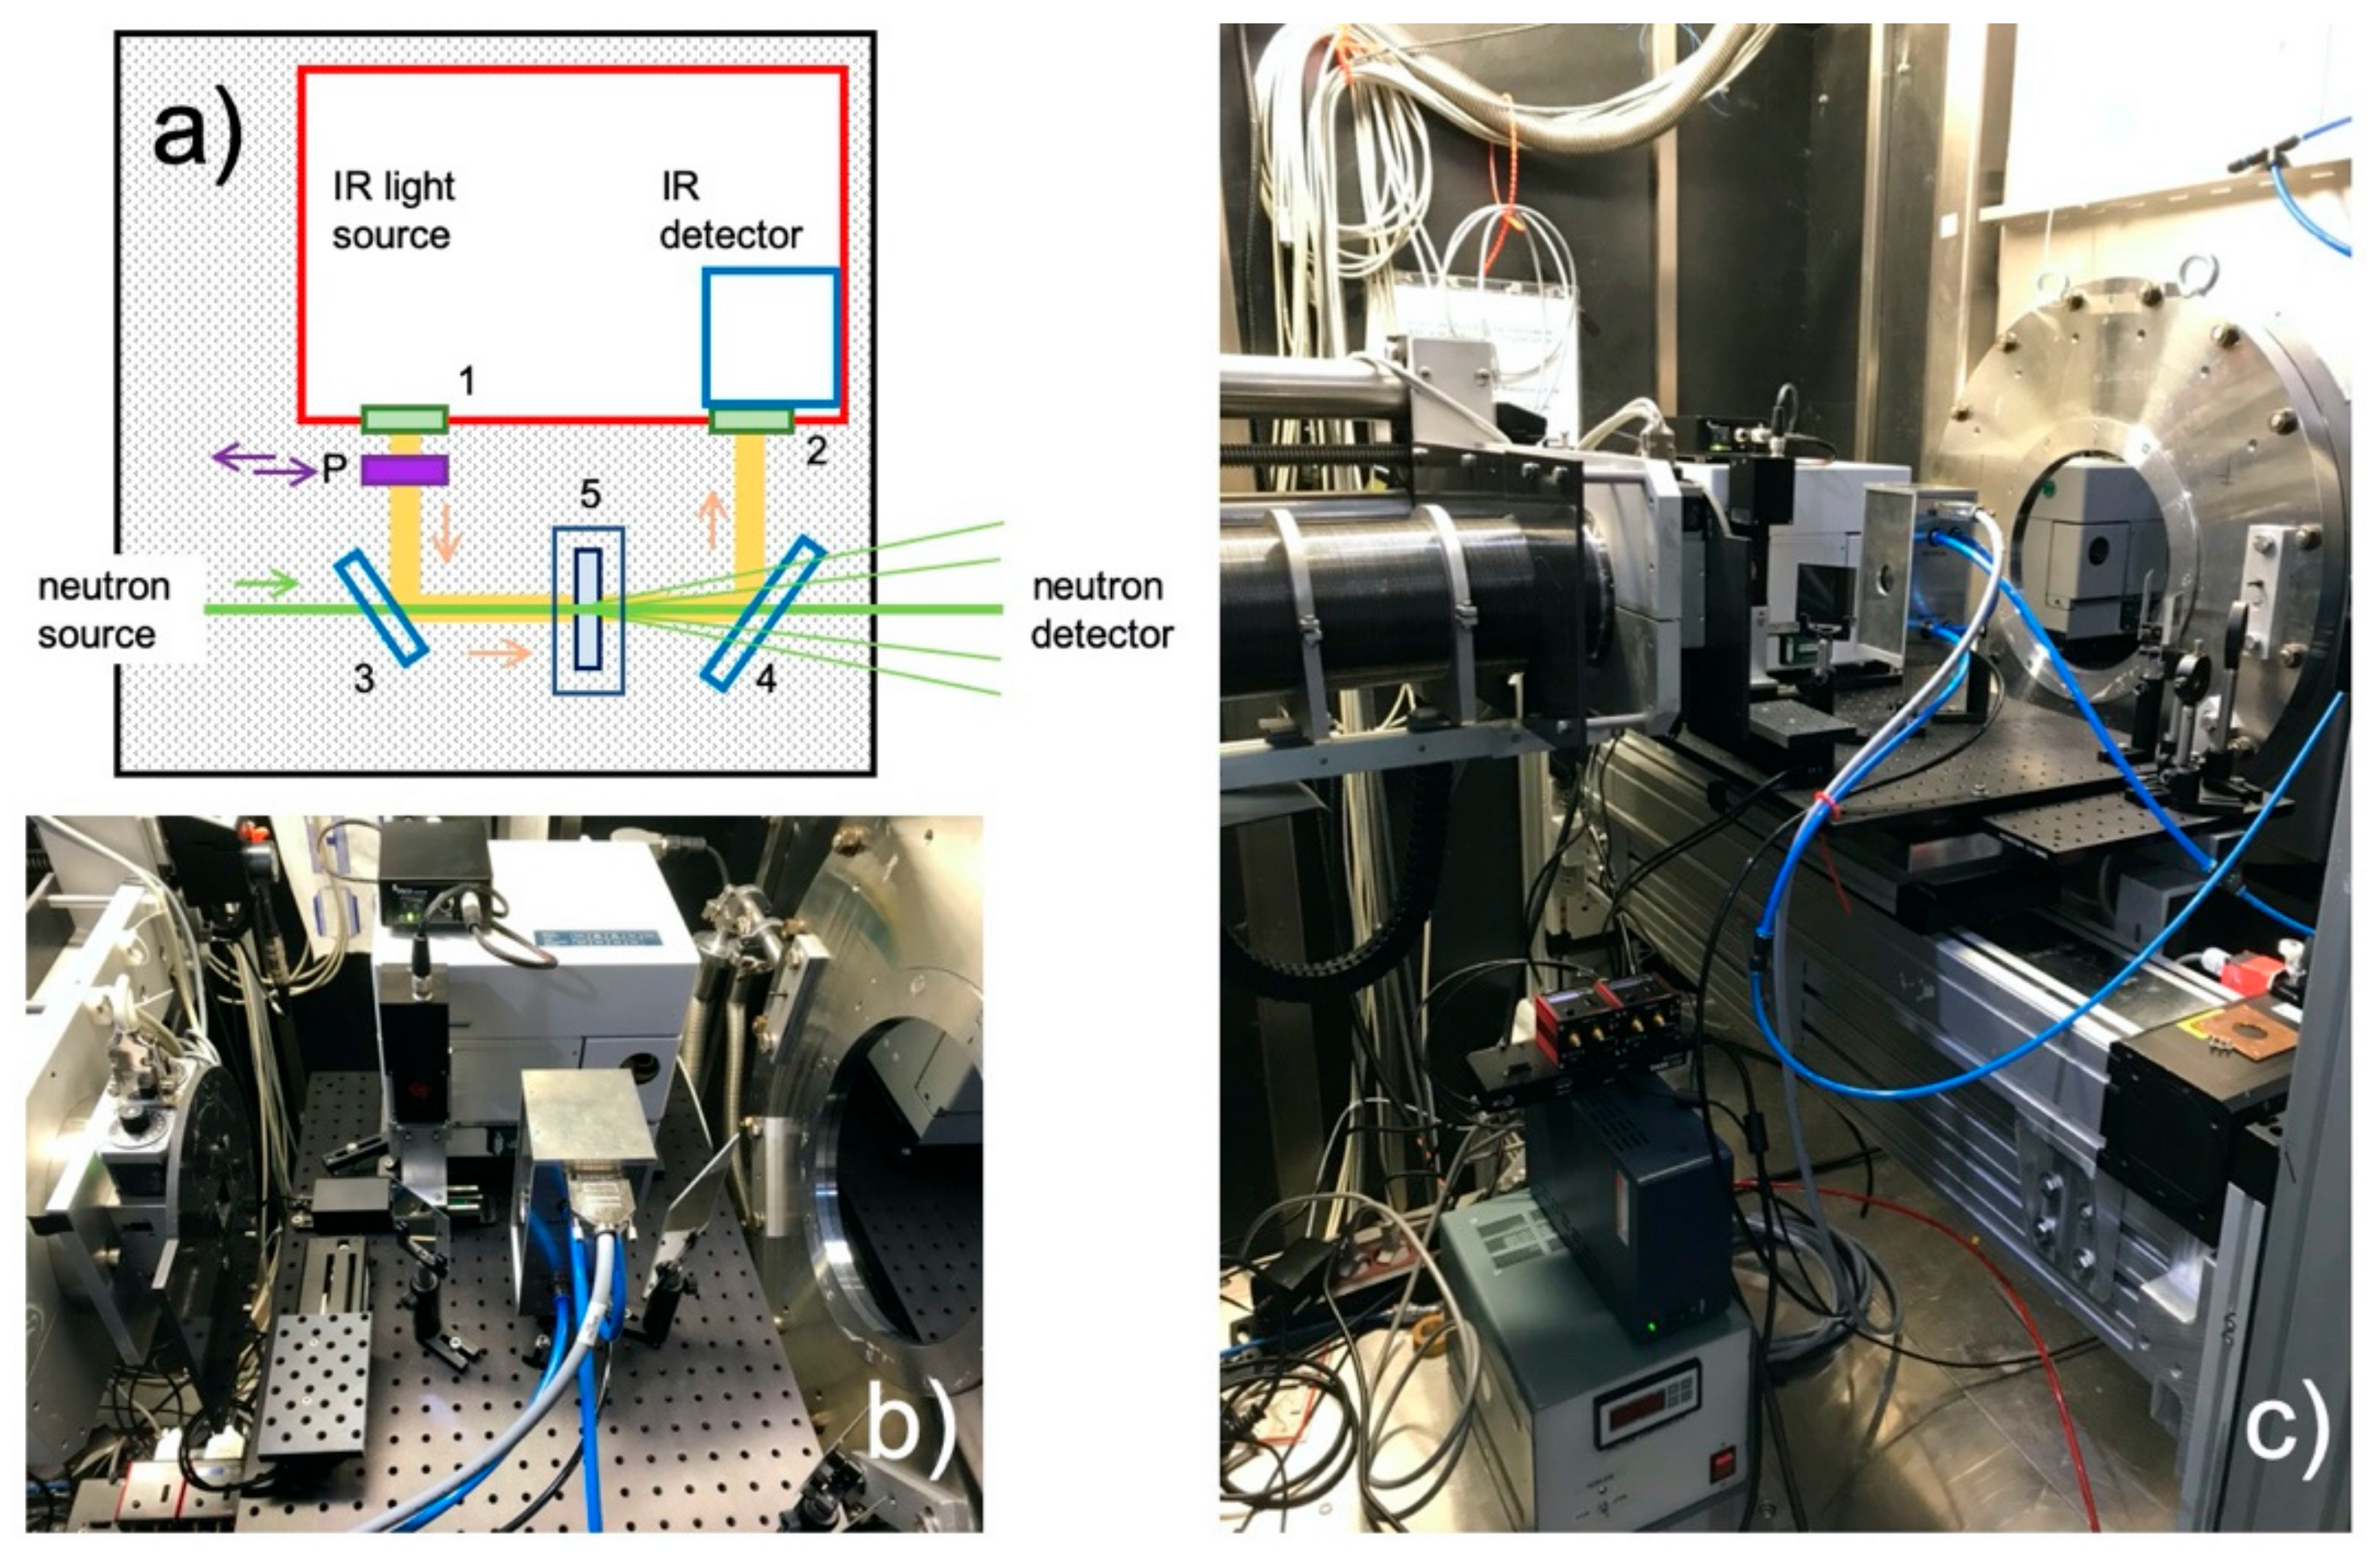
Figure 1. Schematic presentation (a) and detailed (b) and general (c) views of the new operational setup for in situ FTIR analysis simultaneous with the SANS investigation using the KWS-2. The numbers indicate the main components, which can be identified in the photos on the (b,c) panels: the outlet and inlet beam ports (1,2), the windows (3,4), and the new ancillary equipment (5) for the control of the temperature on the sample (in-house designed and produced Peltier-based thermostated cuvette holder), while P indicates the IR polarizer.
Applsci 11 05135 g001
Figure 2. Technical drawing of the new sample cuvette equipped with ZnSe windows, which is used for the simultaneous FTIR and SANS investigation of samples using the KWS-2. The liquid samples can be filled in by using the top openings, while the black O-rings, the series of screws (violet), and Teflon screws for the top openings provide the cuvette tightness. Cuvettes with 1 mm and 2 mm sample thickness are provided; the sample thickness can be further decreased to 0.5 mm or 0.2 mm by using additional ZnSe windows of appropriate thickness and diameter that can be placed inside of the cuvette, between the yellow windows shown here.
Applsci 11 05135 g002
Figure 3. The two-dimensional SANS patterns corrected for detector sensitivity collected at LD = 1.5 m from: empty beam (a), when the two Al-coated quartz windows (items 3 and 4 in Figure 1a) are added (b), and when the two ZnSe windows are added (c); data from the same setup as in (c) but collected at LD = 20 m are shown in (d). The yellow arrows indicate the Bragg reflections from the ZnSe material.
Applsci 11 05135 g003
Figure 4. The thermal behavior of hPEGDME (MW = 20,000 g mol−1) in solution of dTHF (ϕpol = 2%) during the crystallization process at a rate of 5 °C/min.
Applsci 11 05135 g004
Figure 5. FTIR spectral change observed during the crystallization of hPEGDME (MW = 20,000 g mol−1) from solution in dTHF in decreasing temperature from 30 °C to 12 °C. The arrow indicates the evolution of the FTIR spectra collected between the initial and final states at 12 °C with a time step of 30 s.
Applsci 11 05135 g005
Figure 6. SANS cross sections from solution of hPEGDME (MW = 20,000 g mol−1) in dTHF (ϕpol = 2%) measured at different temperatures, during the FTIR analysis (Figure 7). Data collected at different LD and temperatures are differentiated by symbols and colors as shown in the legend. The solid lines indicate the power law behavior in different Q ranges, whereas the red curves represent the model description of the experimental data, as discussed in the text. The dotted curve represents the scattering pattern from the lamellar stacks, as resulted from the global fit of the experimental data collected in the final state at 12 °C (green symbols).
Applsci 11 05135 g006
Figure 7. FTIR spectra measured with polarized IR beam parallel (blue line) and perpendicular (red line) to the uniaxially deformation direction of the d-sPS co-crystalline film with hTol: whole spectra (top) and detail (bottom) are shown.
Applsci 11 05135 g007aApplsci 11 05135 g007b
Figure 8. Left: Schematic view of the setup for simultaneous DLS and SANS analysis of samples using the KWS-2. Right: view of the setup on the sample stage of the neutron SANS diffractometer, between the sample aperture of the collimation system and the entrance window of the evacuated detector tank. Light beam trajectories to and from the sample are indicated in red. The sample cuvettes are placed in the locations of a Peltier-based multi-position variable temperature holder (Quantum Northwest Inc., Liberty Lake, WA, USA) that can move each sample in neutron/light beams in a controlled way.
Applsci 11 05135 g008
Figure 9. Left: the electrical field first-order correlation function gI(τ) obtained from the DLS measurement of the solution of silica nanospheres (with nominal diameter of 20 nm). The red line is a triple-exponential fit, identifying two decay times: 0.48 ms and 6.64 ms with considerable amplitudes and a third one with a comparably small amplitude which will be attributed to noise here. Right: the SANS cross section of the same solution (open symbols). The red line is the data fit based on the spherical form factor model (Rns = 11.9 nm) with polydispersity in size (σ = 12%) and instrument resolution considered [15]. Although the SANS curve does not signal the presence of aggregates in the solutions, the DLS does.
Applsci 11 05135 g009
Figure 10. The electrical field first-order correlation functions of the first and the last DLS measurements performed on the apomyoglobin sample during the neutron beam time. Although larger structures were permanently present in the sample, the two curves nearly coincide. This means that the aggregation state of the sample did not change during the long integration time needed for the SANS measurement. The red lines mark the fit to the data using the CONTIN algorithm.
Applsci 11 05135 g010
Figure 11. Left: The derived size distribution obtained from the measurements presented in Figure 12. Right: close-up of the smaller particles in the solution; besides the monomers with RH ~2 nm, larger structures of RH ~110 nm are present in the solution. The black line corresponds to the distributions obtained from the first DLS measurement, whereas the blue line indicates the results of the last measurement.
Applsci 11 05135 g011
Figure 12. SANS cross sections of the 15 mg/mL apomyoglobin molten globule solution. The blue line marks the simulation for the monomer scattering intensity based on the polymer with excluded volume model (Rg = 2.5 nm, ν = 0.46). The green line is the simulated scattering curve for a larger structure. The red line is obtained by adding the green and blue lines and describes the data well.
Applsci 11 05135 g012
Publisher’s Note: MDPI stays neutral with regard to jurisdictional claims in published maps and institutional affiliations.