Article

A Method of Ore Blending Based on the Quality of Beneficiation and Its Application in a Concentrator

College of Information Science and Engineering, Northeastern University, Shenyang 110819, China
*
Author to whom correspondence should be addressed.
Appl. Sci. 2021, 11(11), 5092; https://doi.org/10.3390/app11115092
Submission received: 29 March 2021 / Revised: 20 May 2021 / Accepted: 29 May 2021 / Published: 31 May 2021
(This article belongs to the Section Earth Sciences)

Abstract

:
Ore blending is an essential part of daily work in the concentrator. Qualified ore dressing products can make the ore dressing more smoothly. The existing ore blending modeling usually only considers the quality of ore blending products and ignores the effect of ore blending on ore dressing. This research proposes an ore blending modeling method based on the quality of the beneficiation concentrate. The relationship between the properties of ore blending products and the total concentrate recovery is fitted by the ABC-BP neural network algorithm, taken as the optimization goal to guarantee the quality of ore dressing products at the source. The ore blending system was developed and operated stably on the production site. The industrial test and actual production results have proved the effectiveness and reliability of this method.

1. Introduction

Ore blending generally refers to the blending of existing ore according to the production index before ore dressing. The purpose is to make the mixed ore properties more convenient for production, thus improving production efficiency and reducing production cost [1]. Ore blending can also ensure that the feed is uniform during ore processing, which guarantees normal production in the subsequent links. This is because the parameters such as the grinding time and the beneficiation reagent are all designed. In the process of ore blending, the model should be established according to the actual situation. Due to the diverse nature of raw ore used in different concentrators, the same model cannot be applied in other places.
Van Tonder et al. [2] proved that good mixed ore properties have a significant impact on flotation production. Some studies have applied the SIP (Stochastic Integer Programming) model to the ore dressing [3,4,5,6,7,8]. In order to make rational use of resources and increase the life of mines, operators often need to balance the use of high-grade ore and low-grade ore as much as possible, avoiding the occurrence of a decline in the mine’s overall quality due to excessive mining of high-grade ore. It requires the operator to make a reasonable ore allocation based on each mining area’s material composition report before deciding on the mining plan. Some studies use integer dynamic programming to calculate ore blending schemes [9,10]. Some scholars use metaheuristics to solve the problem of ore blending [11,12,13,14,15,16]. Some scholars research from the perspective of path planning. Based on the MCNFP (Minimum Cost Network Flow Problem) model, this paper designed a set of scheduling methods that can cover all areas [17]. Dominy, Simon C. et al. [18] proposed that geometallurgy is an essential addition to any evaluation project or mining operation. This method can achieve net present value optimization and effective ore body management while minimizing technical and operational risks. Navarra, Alessandro, etc. [19], applied the stochastic mine planning algorithm to different geometallurgical units and realized the quantification of the net present value (NPV) of the optional operation modes of the concentrator under the conditions of geological uncertainty, and then evaluated the operation mode of the concentrator. These methods have solved some practical problems in the industry, but they have some limitations. They assume that the original ore’s nature is constant at each block or that the change is weak. They believe that each block is processed independently of others, which is often an unrealistic assumption for mining complexes that require blending and homogenization before processing. Moreover, for the concentrator, the most critical indicator is the total concentrate recovery rate. The ore blending is also serving this indicator. Therefore, it is more in line with the manufacturers’ interests to combine the requirements of ore blending and dressing to produce a blending scheme.
Ore blending is an essential step in the daily production of the concentrator. A good ore blending scheme can improve grinding production workload, reasonably allocate the amount of ore into flotation, gravity separation, etc., and improve the concentrator’s production efficiency and economic efficiency [20]. Therefore, in the process of ore blending, the material balance and various indicators of the ore must be considered, and attention must be paid to the impact of the blending product on the quality of the comprehensive concentrate. If the low-quality content in the mixed ore is too high, the hardness becomes higher, which will increase the grinding time and consume more grinding balls. When the content of magnetic substance is insufficient, the effect of magnetic separation will be poor, which will affect the quality of magnetic separation concentrate. When the high-quality content is too high, it will consume more imported raw ore and increase the production cost. When the content is too low, the original pharmaceutical system will not be able to meet the flotation production needs, and more reagents will be wasted. These conditions will lead to the unqualified quality of the beneficiation concentrate. Existing methods cannot meet production requirements. This paper presents a method of ore blending modeling considering the total concentrate recovery and resource utilization. Section 1 introduces the research background and current situation. Section 2 first analyzes several factors that should be paid attention to when blending ore. Then, the ABC algorithm is used to improve the BP neural network algorithm and improve the modeling accuracy. The new algorithm is used to fit the relationship between the nature of the raw ore and the concentrate’s recovery rate, which is the first goal of the optimization model. Taking the maximization of resource utilization as the second goal, a multi-objective optimized beneficiation model was established. Section 3 uses the NSGA-II algorithm to solve the optimization model and introduces the software system developed based on the above method and its application in the production site. The results show the reliability and practicability of the method. Section 4 summarizes this research and proposes ideas for further research.

2. Materials and Methods

The raw ore used by a concentrator in this study was supplied by its own open-pit mining site, which limits the selectivity of beneficiation to a certain extent. The nature of this raw ore is very complicated. The composition was mainly low-grade ore, hematite, carbonate iron ore, and silicate iron ore. With the continuous mining of surface ore, the deep ore is continuously exposed. Due to this mine’s complex material content, the nature of deep ore and surface ore is very different, resulting in significant changes in the original ore’s nature during the mining process. Therefore, the existing methods could not be applied to this concentrator. Raw ore can be roughly divided into three categories. The red part of the ore body is rich in iron oxide (Fe2O3), which is called “red ore” by the workers and is a high-grade ore. The green part not far away is rich in ferrous ions, including ferrous carbonate (FeCO3) and ferrous silicate (FeSiO3). This part is challenging to beneficiate and is called “green ore” by the workers. Above them, the black part of the ore is mainly composed of iron tetroxide (Fe3O4). Workers call it magnetic iron, which is a very high-quality raw material. These ores are concentrated in one mining site, which shows that the nature of the ore on site is very complicated. This kind of complex raw ore leads to high real-time requirements for ore blending.
The field operator’s ore blending method is to put the property table of each ore blending block into Microsoft Excel and then mix the ore by a trial method based on considering product grade. Although this method can initially meet on-site production needs, its real-time performance is poor and wastes many human resources. Therefore, this research proposes an intelligent ore blending method, which can improve the real-time and robustness of ore blending. Before establishing the optimization model, it is necessary to analyze the constraint conditions of ore blending.

2.1. Constraints on Ore Blending

In actual production, mining and mixing of minerals are restricted by the nature of mine products and production capacity [21]. Therefore, various indicators must be comprehensively considered when generating an ore blending plan. There are usually two classification methods for ore blending indicators, which are divided according to the work order and the ore’s nature. According to the working order, the ore blending conditions can be divided into raw ore, ore blending indicators, and ore dressing products. According to the ore natures, it can be divided into ore’s physical properties, ore’s chemical properties, and quantity of ore. The first method is adopted in this research.
Raw ore conditions include OG (Ore Grade), HQC (High-Quality Content), LQC (Low-Quality Content), MPV (Minimum Production Volume), and GR (Geological Reserves). Ore grade refers to the ratio of metal to total ore in the raw ore. In this study, it is the iron content in the mixed mineral product, which is a percentage. High-quality content refers to the proportion of material that is conducive to subsequent work in total ore. Low-quality content refers to the proportion of material that is detrimental to subsequent work in total ore. In this study, HQC is Fe2O3 and Fe3O4, LQC is FeCO3 and FeSiO3. The MPV refers to the minimum production volume at each ore mining site. The geological reserves refer to the maximum amount of each ore that can be produced.
Ore blending indicators include the total amount of ore, the maximum and minimum values of mixed ore grades, the maximum and minimum values of high-quality material content, and the maximum and minimum values of total inferior ore content. These values are determined for the quality of the ore blending products, and their size is related to the use of the mixed ore. Therefore, the ore blending indicators need to be transferred to the production workshop when the production plan is determined. A useful ore blending product index can ensure to a certain extent that the quality of grinding products and beneficiation products meet the production standards, so it is also an essential condition that needs to be considered when ore blending to generate a plan.
Under normal circumstances, the above are the restrictive conditions for ore blending production. The operator determines the appropriate ore blending plan according to the actual situation and stores the produced mixed ore in their respective warehouses, waiting for distribution. The open-pit targeted by this research is the own property of a concentrator. The ore mined can only be used as raw material for this concentrator. Therefore, while ensuring the quality of the blended ore products, it is also necessary to make the mixed ore suitable for the beneficiation plant’s production. In order to achieve this goal, this research adds a condition to the ore blending scheme to ensure the quality of the beneficiation products. It is the difference between this ore blending method and the conventional ore blending method.
The last condition on ore blending is the quality of the beneficiation products. Predict the quality of the beneficiation products according to the mixed ore’s nature and guide the ore blending plan’s adjustment to form a closed-loop control. There are many influencing factors in the production process, from ore blending to beneficiation. Every time the ore blending scheme is adjusted, it takes several hours to know the adjustment effect through laboratory tests. It can be said that this is a nonlinear, extensive lag system, so this research considers this to be a black box system, and a neural network is used to build a predictive model.
Concentrate grade and concentrate recovery rate are the key indicators that determine the quality of beneficiation products. Not only that, they can also evaluate the metallurgical efficiency of the beneficiation process. However, in order to maintain the stability of production, the site often requires the concentrate grade to be kept near a certain fixed value, so the concentrate recovery rate becomes the most concerned indicator of the production workshop. Even the recovery rate of concentrate directly affects the performance pay of operators. Therefore, real-time and accurate prediction of the production index of concentrate recovery rate based on the nature of the mixed ore is the concentrator’s key task [22]. In this study, BP neural network was used to establish the prediction model, and the artificial bee colony algorithm was used to optimize the model, which achieved good results.

2.2. ABC-BPNN Model

ABC (Artificial Bee Colony) algorithm is a relatively novel evolutionary algorithm proposed by Dervis Karaboga [23]. In the ABC algorithm, the colony of artificial bees contains three groups of bees: employed bees, onlookers, and scouts [24]. A bee waiting on the dance area for deciding to choose a food source, is called an onlooker, and a bee going to the food source visited by itself previously is named an employed bee. A bee carrying out a random search is called a scout. The food source is the potential solution to the optimization, and one-to-one corresponds to the employed bees. Suppose that in the D-dimensional optimization problem, the population number is 2N (both the number of employed bees and the number of observed bees are N). Food source positions are randomly generated according to the following equation:
X i , j = X j min + δ ( X j max X j min )
where i = 1, 2, …, N. Xjmax and Xjmin are the upper bound and lower bound of the optimization problem. δ is a random number uniformly distributed between (0, 1).
After identifying the food source, the three bees moved in sequence.
(1) Employed bees: Employed bees at their corresponding food source Xi to generate candidate solution Vi according to the following formula. If Vi is better than Xi, replace it.
V i , j = X i , j + φ ( X i , j X k , j )
(2) Onlookers: When employed bee completed the operation, onlookers randomly selected a food source for extraction based on the following probability.
P i = f i t i i = 1 N f i t i
where fiti is the fitness function of food source Xi, which is proportional to food source quality. That is, the greater fitness value of a food source, the higher probability of selection by onlookers. When the onlooker selects the food source, it is updated according to Equation (2).
(3) Scouts: In the ABC algorithm, if a position cannot be improved further through a predetermined number of cycles called limit, then that food source is assumed to be abandoned. At this point, the scouts will generate a new food source according to Equation (1) to replace the discarded food source.
The ABC algorithm proved to be an excellent algorithm for solving optimization problems. Li used a wavelet neural network (WNN) and a new artificial bee colony algorithm (ABC) to predict the gold price [25]. Bahram and Nader combined ABC with BP and RBF neural network to predict phosphate ore grade [26]. In order to improve the convergence speed of the algorithm, Chen et al. introduced IABC algorithm and differential evolution (DE) algorithm into the new ABC search equation [27]. The method is applied to nonlinear system control problems. Anuar combines ABC with the artificial neural network to avoid the problem that the neural network is prone to fall into the local optimum and applies the algorithm to the classification of crime data [28]. Ghanem combined ABC with PSO as a feed-forward neural network training method and tested this method’s classification accuracy on multiple data sets [29]. Cui et al. proposed ABC algorithm based on distance fitness and verified it with standard data set [30]. Therefore, ABC algorithm was selected in this paper to optimize the parameters of BP neural network.
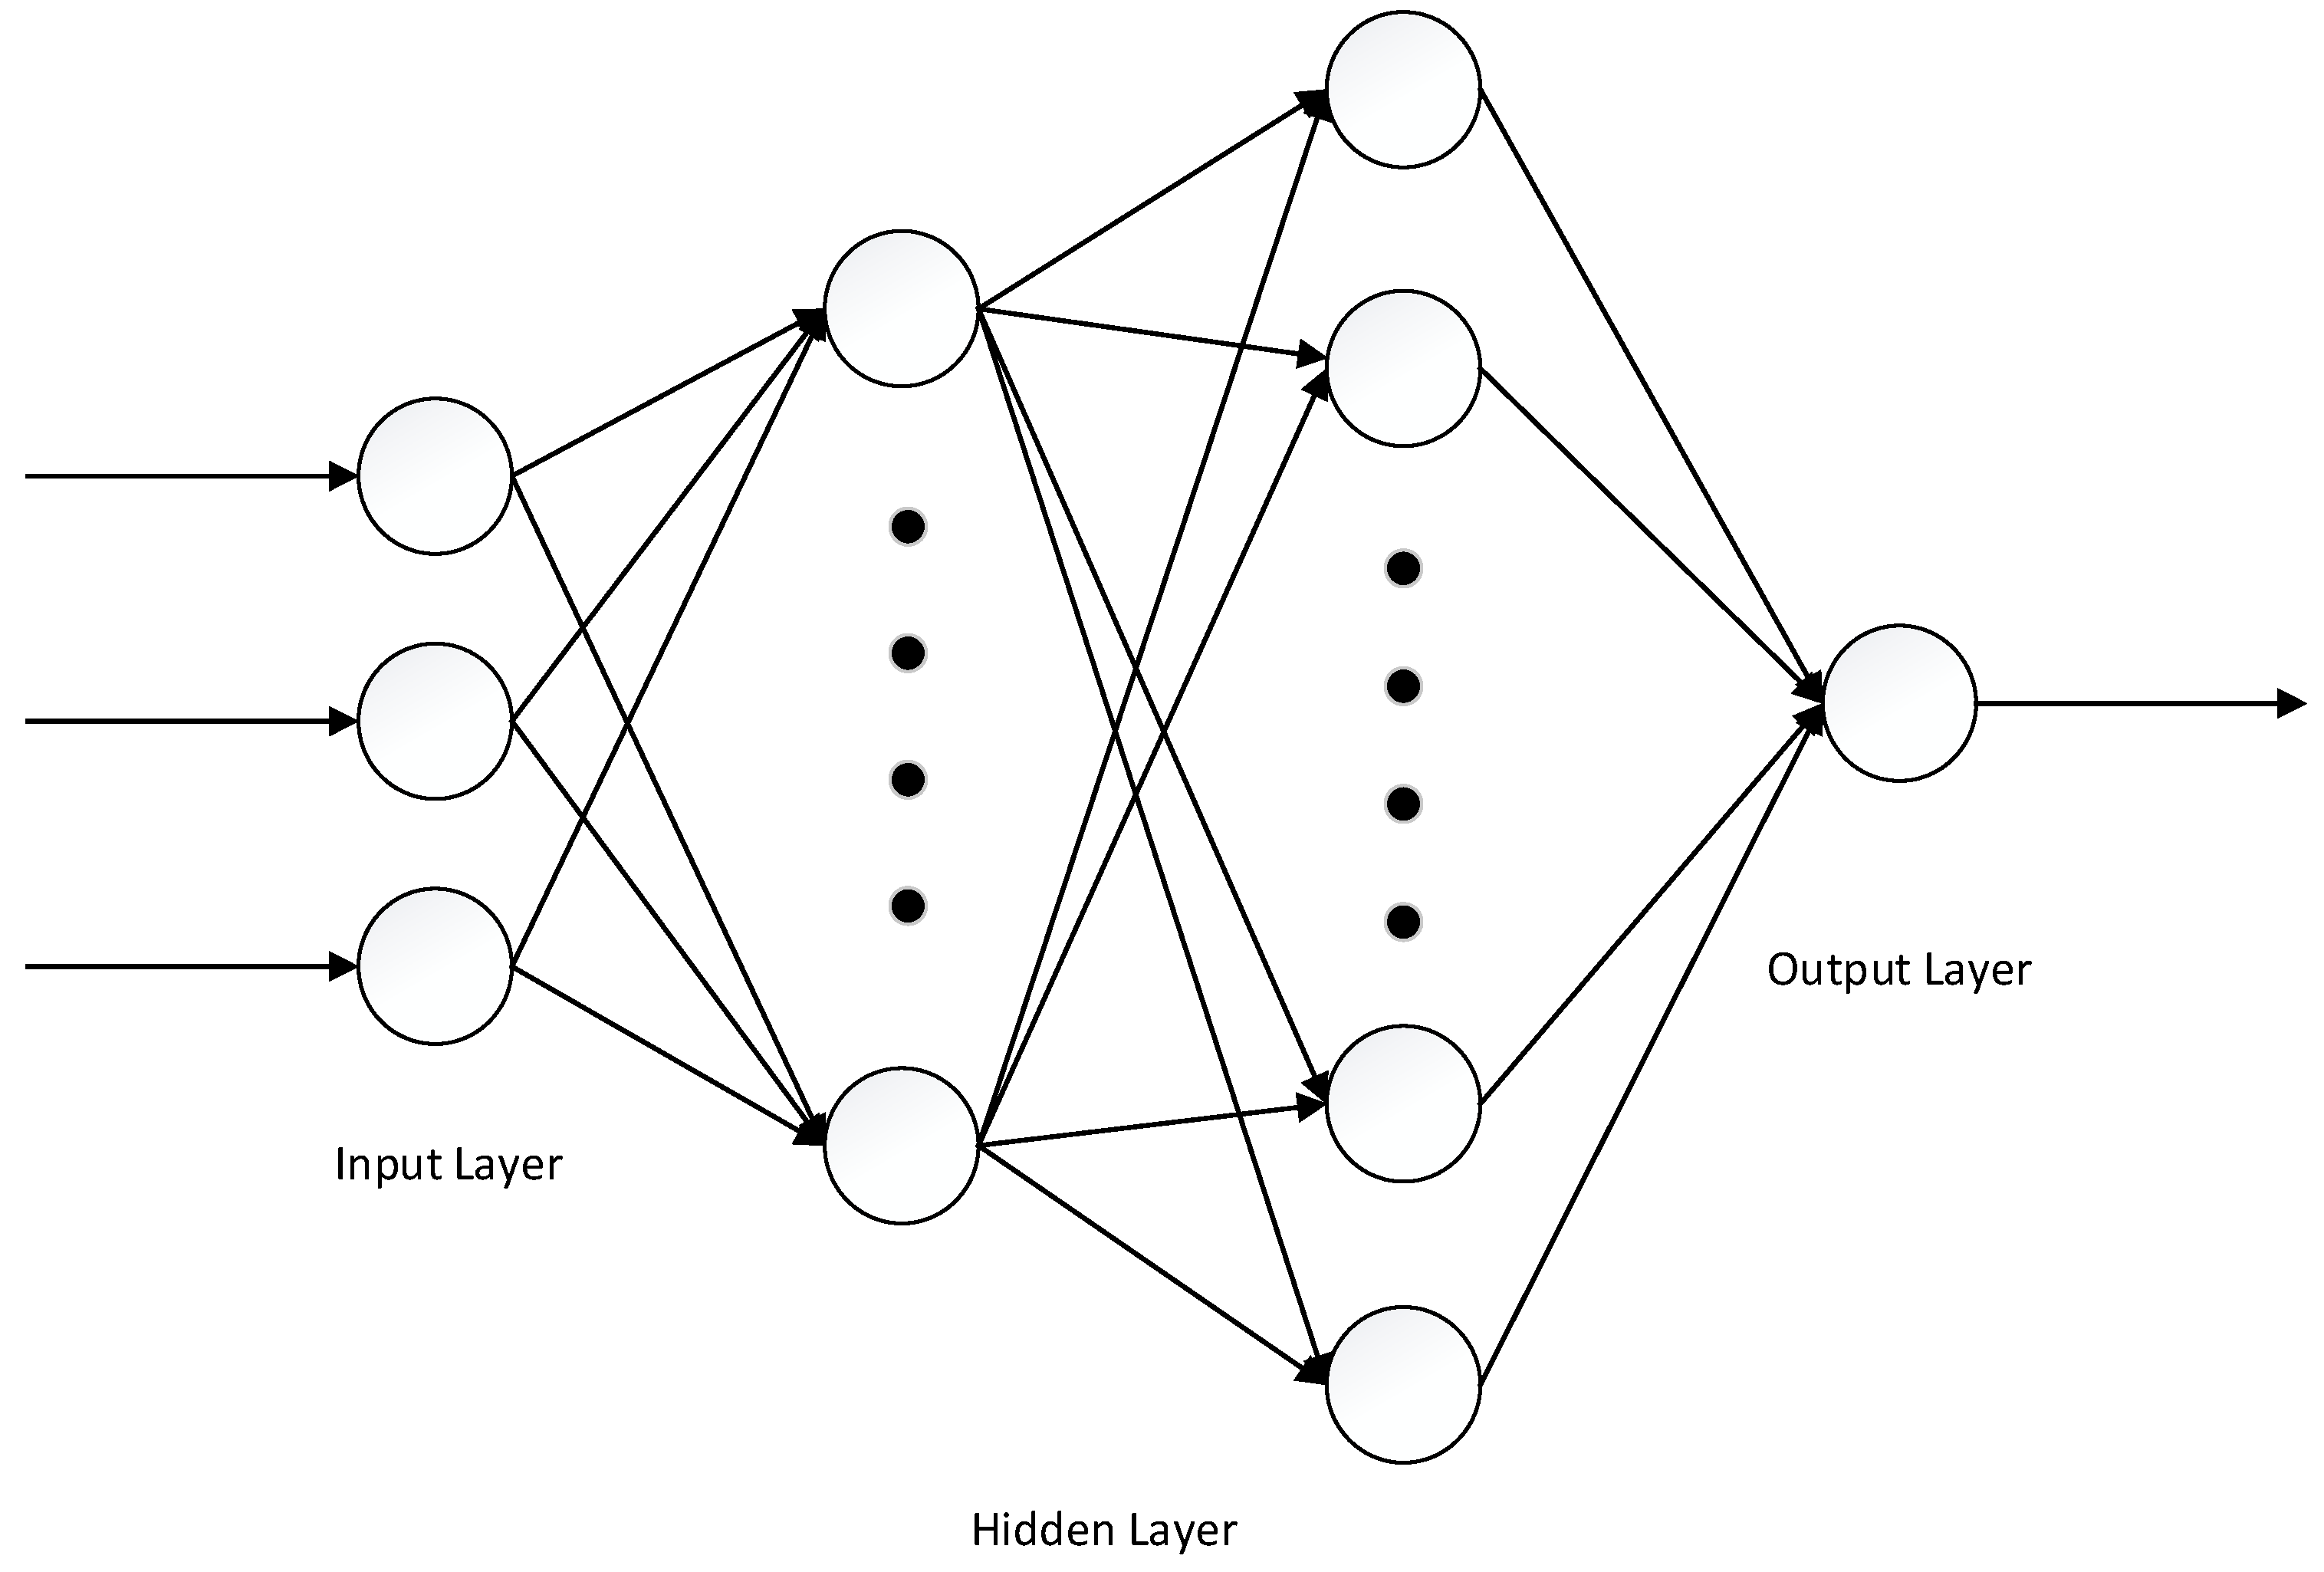
BP (Back Propagation) Neural Networks is a multi-layer feed-forward network trained by error inverse propagation algorithm proposed by Rumelhart and McClelland in 1986. It is one of the most widely used Neural network models. BP network can learn and store a large number of input-output mode mapping relations without revealing the mathematical equations describing such mapping relations in advance. Its learning rule is to use the gradient descent method to continuously adjust the network’s weight and threshold through the reverse propagation to minimize the network’s squared error. The topology of BP neural network model includes input layer, hidden layer, and output layer. Usually, the hidden layer has two or more layers of neurons. The number of input layer neuron nodes is the number of model inputs, and the number of output layer neurons is the number of model outputs.
The combination of ABC algorithm and BP neural network can establish an accurate model and avoid falling into local optimal. Figure 1 shows the flow chart of the ABC-BPNN algorithm.
Taking a concentrator as an example, this research introduces the ore blending model based on comprehensive concentrate recovery. An ABC-BP neural network algorithm was used to model the relationship between the recovery rate of concentrate and ore blending products’ properties. BP neural network algorithm is chosen because a mature algorithm should be used in engineering implementation, and this algorithm is suitable. When fitting by BP neural network algorithm, attention should be paid to the timeliness and rationality of fitting data. Set a reasonable number of hidden layers and neurons, and verify the model with the test set after training. If the error does not reach the acceptable range, training should be performed repeatedly until the error is small enough or the training number reaches the upper limit.

2.2.1. Data Preprocessing

After collecting and sorting the historical data of ore blending and the corresponding recorded ore dressing data, it is necessary to screen the data. This paper adopts the following strategies:
| P i P ¯ | 3 × 1 n i = 1 n ( P i P ¯ ) 2
where P is a data value. P ¯ = i = 1 n P i n . When the difference between a value and an average is greater than or equal to three standard deviations, this set of data is excluded. The first 80 percent of data was taken as training data, and the last 20 percent as test data.

2.2.2. Describing Function

The comprehensive concentrate recovery is related to ore grade h, high-quality content k and metal ion content l. The description function of total concentrate recovery can be expressed as:
J f ( X i )
As the ore grade h(•), high-quality content k(•) and metal ion content l(•) are related to the ore blending results, the above equation can be expressed as:
f [ h ( X i ) , k ( X i ) , l ( X i ) ]
where Xi is the amount of ore produced at the mine outlet of No.i.

2.2.3. Normalization

Considering that there are different dimensions of data involved in the fitting, it is necessary to normalize each group of data before training, and then use a neural network algorithm for modeling.
In this paper, data is normalized to the range [−1, 1]. The implementation method is:
P = 2 ( P P min ) / ( P max P min ) 1
where P is the input data, Pmax is the maximum value of the input data, and Pmin is the minimum value of the input data.

2.2.4. Fitting and Saving Function

According to the scene’s actual situation, after many times optimization training, it was finally found that the number of hidden layers was 2, which contained 6 and 8 neurons, respectively, for the model to work best. The neural network using this structure is shown in Figure 2.
The neural network parameter settings are shown in Table 1.
In order to measure the performance of the proposed method and to evaluate the prediction accuracy, the mean squared error (MSE) criterion is employed. Let (Xi, Oi); i = 1, 2, …, n be the training subset with size n, the MSE is calculated as follows.
M S E = 1 n i = 1 n ( y i d i ) 2
where yi is the actual output of the ith sample, di is the predicted value of the ith sample.
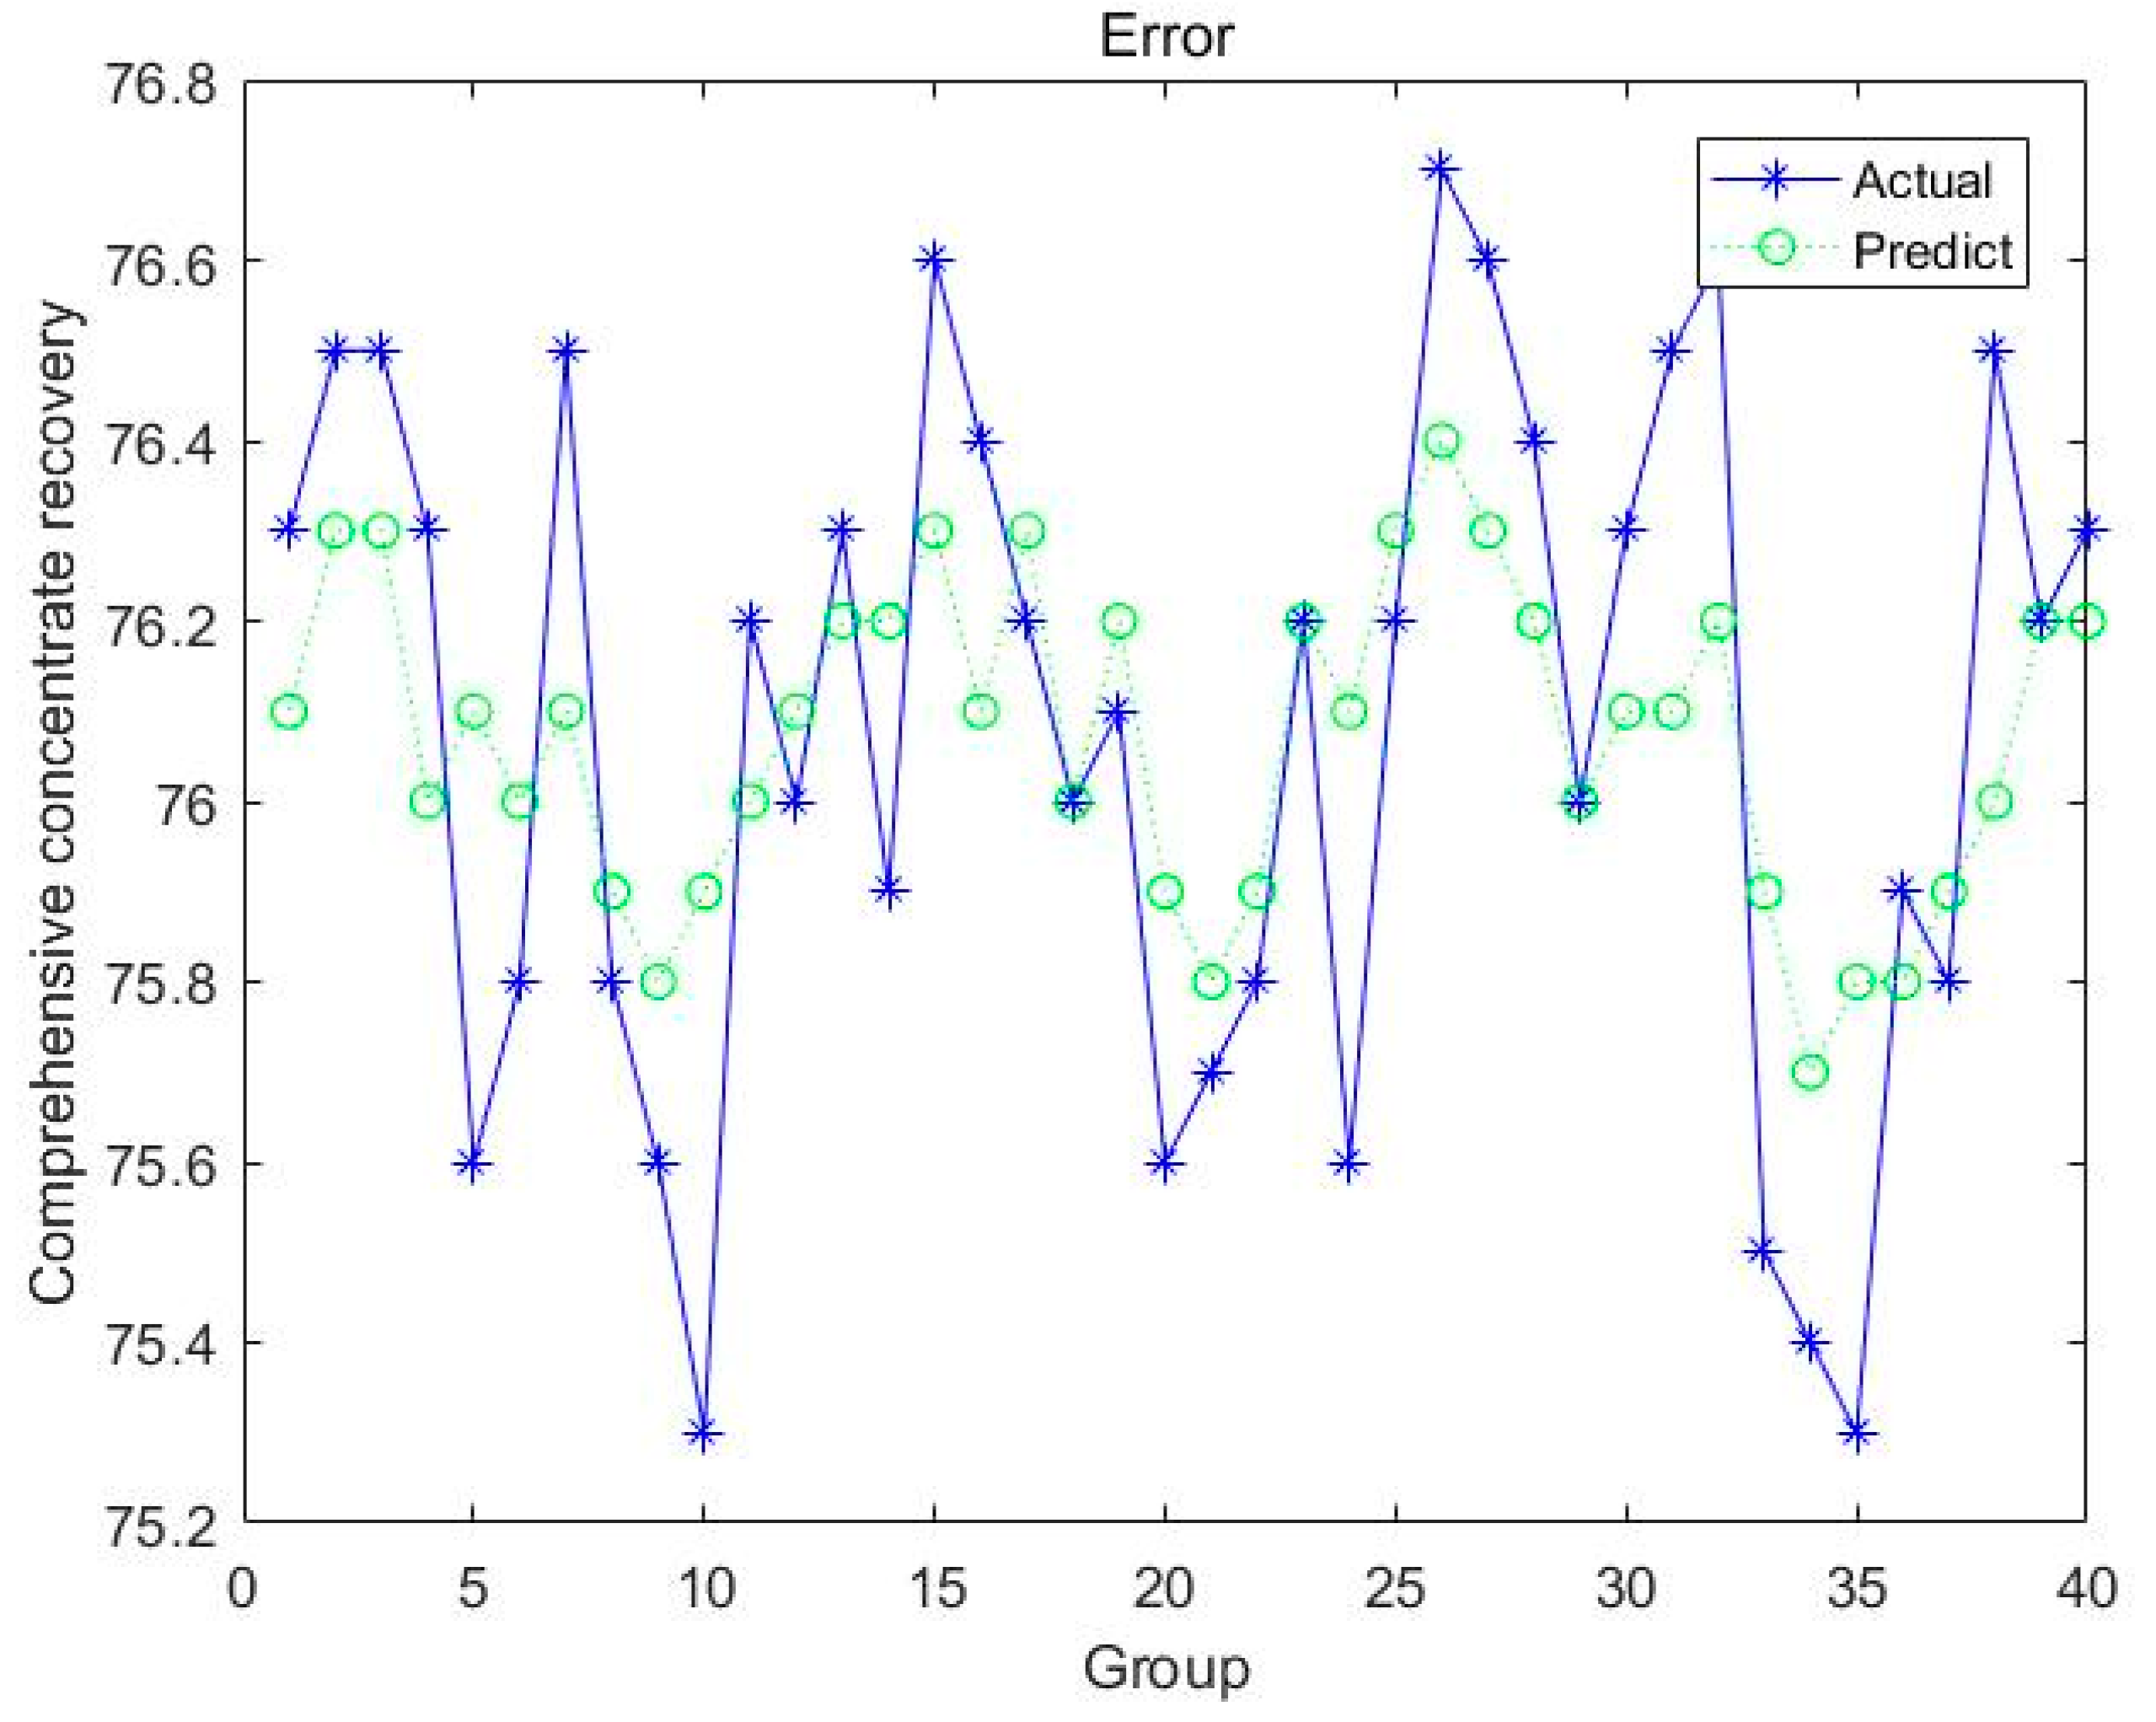
After the completion of fitting, 40 groups of data were taken as test data to verify the fitting results. The error is shown in Table 2:
Figure 3 shows the test results. The blue dot is the expected output and the green dot is the predicted output.
A comparison of the mean and standard deviation (SD) between ABC-BP and the other methods is shown in Table 3.
The mean values of all three algorithms are within the allowable range. The standard deviation of ABC-BP model is superior to other algorithms. Therefore, ABC-BP algorithm was adopted for modeling in this study.

2.3. Optimization Model

According to the neural network results and the scene’s actual situation, the optimization model can be established. Before ore blending, each outlet’s ore properties should be obtained as the ore blending model’s input data. Input the raw ore properties into the neural network model trained above to calculate the concentrate recovery rate’s predicted value. The absolute value of the difference between the predicted value and the target value is used as the optimization model’s objective function. According to the field experience, determine the ore blending indicators that make the sequence work normally and take this as the constraint conditions. In addition, the difference between the ore blending plan of this stope and other studies is that the unit amount of the mining volume of this stope is not “1 ton”, but “1 vehicle.” It means the full tonnage of a truck. Therefore, the decision variable is changed from mining volume to the number of mining vehicles. Then the optimization problem becomes a pure integer programming (PIP) problem. According to this, the first objective function of the optimization problem can be obtained: Formula (12).
In order to further ensure the quality of beneficiation products, when optimizing ore blending, the improvement of resource utilization must be another goal of ore blending. In the mining production process, the resource utilization index is an important index reflecting the loss of mineral resources mining and the recovery level of valuable metals. The resource utilization index can be expressed as:
Z l = W J M d × θ d × 1 γ s 1 γ p × 100 %
where Z l is the resource utilization rate; W J is the amount of concentrate metal; M d is the geological reserves; θ d is the geological grade; γ s is the dilution rate; and γ p is the loss rate.
Dilution rate: In the process of ore mining, due to the mixing of waste rock and gangue, loss of high-grade ore, dissolution or loss of some useful components, etc., the grade of the mined ore is lower than the geological grade of the ore in the industrial reserves calculated before mining. This phenomenon is called ore dilution. Mining dilution rate is the ratio of the difference between the original ore’s geological grade and the grade of the mined ore to the original ore’s geological grade, and the percentage of industrial reserves lost to reimbursed industrial reserves. It is one of the important factors to determine the degree of utilization of mineral resources. The formula for calculating the dilution rate is:
γ s = θ d θ c θ d × 100 %
where θ c is the grade of the mined ore. When the ore dilution rate is high, the selected ore grade is low, the quality of the concentrate product decreases, and the enterprise’s economic efficiency decreases.
Loss rate: In the process of mining and production, industrial ores cannot be fully mined, released, and transported. The loss rate is the degree of industrial ore production loss expressed as a percentage. The calculation formula for the loss rate is:
γ p = M l M c × 100 %
where M l is the amount of ore lost, and M c is the amount of ore mined. The amount of ore mined is the sum of the minerals mined in each mining area in the ore blending plan.
In summary, a multi-objective optimization problem can be obtained.
(1) 
Performance Index:
min ( | J f ( X i ) ε | ) , i = 1 , 2 , , m
max Z l ( X i ) , i = 1 , 2 , , m
where ε is the target value of concentrate recovery.
(2) 
Constraints:
(a)
Raw Ore Constraints
J f ( X i ) = f [ h ( X i ) , k ( X i ) , l ( X i ) ] , X i Ζ
M c = i = 1 m X i = W r
M P V i = x i min x i x i max = G R i
(b)
Mixed ore properties constraints
h min ( X i ) h ( X i ) h max ( X i )
k min ( X i ) k ( X i ) k max ( X i )
c min ( X i ) c ( X i ) c max ( X i )
where m is the number of ore producing blocks, W r is the total amount of production, h ( X i ) is the ore grade, k ( X i ) is the HQC, and c ( X i ) is the LQC.
After establishing the multi-objective optimization model, this study used the NSGA-II algorithm to solve it, and through the TOPSIS algorithm, extract the optimal solution from the Pareto solution set and provide it to the operator as the final ore blending plan. Then, the operator can adjust the production amount of each block according to the actual situation and the field’s requirements to make it more suitable for mining operation.

3. Results and Discussion

Based on the above algorithm, the ore blending optimization system was developed. The server of the system was located in the beneficiation dispatching room, and the upper computer was located in the ore blending office of another building. The communication between the two was realized by ethernet.
Based on this concentrator’s actual production situation, the modeling method was used to generate the ore blending scheme and compare it with the manual ore distribution scheme. There were four ore producing blocks in total. The ore properties of each ore producing block are shown in Table 4:
The property requirements of ore blending products are as Table 5:
A software platform was developed for this working condition and ore blending method. In order to facilitate the operator to use this system, a human–computer interaction interface of the system was compiled, shown in Figure 4. This interface can generate and display the ore blending plan. After clicking the “Parameter Setting” button, it will jump to the interface shown in Figure 5, where the operator can input relevant data.
Figure 5 shows the interface for setting parameters of the software. Data from Table 3 and Table 4 need to be entered into this interface.
In the current production, the effect of ore blending results on the recovery rate of concentrate has not been considered by operators, who only consider ore blending products’ properties.
Based on the above data, the modeling method is used. The optimization model can be expressed in the following forms:
min ( | J f ( X i ) 73 . 8 | ) , i = 4 max Z l ( X i ) , i = 4 s . t . { i = 1 m X i = 100 29 h ( X i ) 33 9 k ( X i ) 12 3 c ( X i ) 4 . 5 0 x i 100
where
h ( X i ) = i = 1 4 ( T i × x i ) i = 1 4 x i = 34 . 54 × x 1 + 29.26 × x 2 + 32.03 × x 3 + 31.87 × x 4 x 1 + x 2 + x 3 + x 4
k ( X i ) = i = 1 4 ( G i × x i ) i = 1 4 x i = 18.24 × x 1 + 12.87 × x 2 + 0 × x 3 + 0 × x 4 x 1 + x 2 + x 3 + x 4
l ( X i ) = i = 1 4 ( B i × x i ) i = 1 4 x i = 4.31 × x 1 + 4.25 × x 2 + 3.17 × x 3 + 2.56 × x 4 x 1 + x 2 + x 3 + x 4
The model was solved by optimization algorithm and the ore selectivity index was calculated. Compared with the results obtained by the original method. This method took about 3 min to generate an optimized ore blending scheme on an ordinary computer. The original method takes at least half an hour to calculate a plan by trial and error. The comparison results are shown in the Table 6:
It can be seen from Table 6 that the ore dressing index of the ore dressing results obtained by this modeling method is higher than that of the original method because the effect of the ore dressing results on the blending is directly considered by this method. Ore dressing index is a model used to evaluate the quality of mixed mineral products. After substituting the relevant parameters into the function, the output index represents the degree to which the mixed ore is suitable for beneficiation. The model is related to the ore’s composition, the particle size of the ore, and the grinding time. When comparing methods in this study, it is assumed that the ore size and grinding time are fixed values. The degree of ore suitable for beneficiation can be found in Table 7.
By looking up the table, it can be found that the ore blending scheme generated by this research can improve the quality of the mixed ore from “good” to “excellent”, and it takes less time. In the production process, the ore dressing index can be used to predict the nature and production cost of the beneficiation products, as shown in Table 8.
This concentrator produces about 7 million tons of concentrate per year. Using this solution can reduce the production cost per ton by at least 2 CNY (increase DOI by 1%), which can save 14 million CNY (2.15 million USD) per year.
The results of industrial trials are encouraging. The operator immediately put the system into production and applied it for four months, as shown in Table 9, Table 10, Table 11 and Table 12.
This method’s profit was 7.87 CNY (1.22 USD) per ton, higher than the original method’s maximum value. The monthly output was 360 kilotons. Under the premise that other production conditions remain unchanged, this method can increase the profit by 2.83332 million CNY (440,000 USD). Starting from the second month, the number of mining locations changed from 7 to 9. At this time, the number of calculations increased greatly, and it became more difficult to generate a ore blending plan with the original method, whereas this new method could generate an reliable plan.
In the last three months, compared with the original method, the profit created by this new method is at least 8.36, 7.53, and 10.92 CNY (1.30, 1.17, and 1.70 USD), respectively. The effect of industrial application shows the effectiveness of this research.

4. Conclusions

The current common iron ore blending methods only refer to the mixed ore indicators and the original ore’s nature, but ignore the impact of the mixed ore properties on the beneficiation production. They often regard ore blending and beneficiation as two separate processes, rather than using the former as an auxiliary link to the latter to ensure the quality of the beneficiation products. This has led to a disconnect in the whole process of beneficiation production. This paper proposes a method of ore blending based on the quality of beneficiation.
This method uses the ABC-BP neural network to fit the blended product’s properties and the total concentrate recovery rate and establishes a prediction model. The results show that the improved BP neural network based on the ABC algorithm has a good application effect. This research also proposes not only to increase the recovery rate of beneficiation as the goal, but also to focus on long-term development, and to improve the resource utilization rate of the mine as another goal. In this way, the mining farm and the concentrator obtained the linkage through the ore grade, which can achieve a win-win effect. Based on this, a multi-objective optimized ore blending model was established, and a reasonable ore blending plan could obtained after calculation. Finally, a set of ore blending scheme generation system was developed, and it operated stably in a concentrator.
Scholars should continue to collect data on mixed ore and beneficiation concentrates and establish a more comprehensive concentrate quality model in further research. This is because the accuracy of the objective function in the multi-objective optimization ore blending model determines the ore blending scheme’s reliability. Moreover, the constraint conditions for optimizing ore blending should keep pace with the times. Taking this research as an example, when the ODI calculation rules are changed, the operator must actively change the constraint conditions for ore blending. In future research, a system linked to an economic benefit calculation should be developed to further reduce manual intervention.

Author Contributions

Conceptualization, B.L. and D.Z.; methodology, D.Z.; software, D.Z.; validation, B.L., D.Z. and X.G.; formal analysis, B.L. and D.Z.; investigation, B.L. and D.Z.; resources, X.G.; data curation, D.Z.; writing—original draft preparation, D.Z.; writing—review and editing, B.L. and D.Z.; visualization, B.L. and D.Z.; supervision, B.L. and D.Z.; project administration, X.G. All authors have read and agreed to the published version of the manuscript.

Funding

This work was supported by the National Natural Science Foundation of China (No. 61573088).

Conflicts of Interest

The authors declare no conflict of interest.

References

  1. Nava, J.V.; Llorens, T.; Menéndez-Aguado, J.M. Kinetics of Dry-Batch Grinding in a Laboratory-Scale Ball Mill of Sn–Ta–Nb Minerals from the Penouta Mine (Spain). Metals 2020, 10, 1687. [Google Scholar] [CrossRef]
  2. Van Tonder, E.; Deglon, D.A.; Napier-Munn, T.J. The effect of ore blends on the mineral processing of platinum ores. Min. Eng 2010, 23, 621–626. [Google Scholar] [CrossRef] [Green Version]
  3. Lamghari, A.; Dimitrakopoulos, R. A diversified Tabu search approach for the open-pit mine production scheduling problem with metal uncertainty. Eur. J. Oper. Res. 2012, 222, 642–652. [Google Scholar] [CrossRef] [Green Version]
  4. Consuegra, F.R.A.; Dimitrakopoulos, R. Algorithmic approach to pushback design based on stochastic programming: Method, application and comparisons. Min. Technol. 2010, 119, 88–101. [Google Scholar] [CrossRef]
  5. Ramazan, S.; Dimitrakopoulos, R. Production scheduling with uncertain supply: A new solution to the open pit mining problem. Optim. Eng. 2013, 14, 361–380. [Google Scholar] [CrossRef]
  6. Benndorf, J.; Dimitrakopoulos, R. Stochastic long-term production scheduling of iron ore deposits: Integrating joint multi-element geological uncertainty. J. Min. Sci. 2013, 49, 68–81. [Google Scholar] [CrossRef]
  7. Leite, A.; Dimitrakopoulos, R. Stochastic optimisation model for open pit mine planning: Application and risk analysis at copper deposit. Min. Technol. 2013, 116, 109–118. [Google Scholar] [CrossRef]
  8. Goodfellow, R.C.; Dimitrakopoulos, R. Global optimization of open pit mining complexes with uncertainty. Appl. Soft Comput. 2016, 40, 292–304. [Google Scholar] [CrossRef]
  9. Lambert, W.B.; Newman, A.M. Tailored Lagrangian Relaxation for the open pit block sequencing problem. Ann. Oper. Res. 2014, 222, 419–438. [Google Scholar] [CrossRef]
  10. Boland, N.; Dumitrescu, I.; Froyland, G.; Gleixner, A.M. LP-based disaggregation approaches to solving the open pit mining production scheduling problem with block processing selectivity. Comput. Oper. Res. 2009, 36, 1064–1089. [Google Scholar] [CrossRef]
  11. Goodfellow, R.; Dimitrakopoulos, R. Algorithmic integration of geological uncertainty in pushback designs for complex multiprocess open pit mines. Min. Technol. 2013, 122, 67–77. [Google Scholar] [CrossRef] [Green Version]
  12. Ferland, J.A.; Amaya, J.; Djuimo, M.S. Application of a Particle Swarm Algorithm to the Capacitated Open Pit Mining Problem; Springer: Berlin/Heidelberg, Germany, 2007; Volume 76, pp. 127–133. [Google Scholar]
  13. Shishvan, M.S.; Sattarvand, J. Long term production planning of open pit mines by ant colony optimization. Eur. J. Oper. Res. 2015, 240, 825–836. [Google Scholar] [CrossRef]
  14. Kumral, M. Optimizing ore-waste discrimination and block sequencing through simulated annealing. Appl. Soft Comput. 2013, 13, 3737–3744. [Google Scholar] [CrossRef]
  15. Khan, A.; Niemann-Delius, C. Production Scheduling of Open Pit Mines Using Particle Swarm Optimization Algorithm. Adv. Oper. Res. 2014, 2014, 1–9. [Google Scholar] [CrossRef] [Green Version]
  16. Montiel, L.; Dimitrakopoulos, R. Stochastic mine production scheduling with multiple processes: Application at Escondida Norte, Chile. J. Min. Sci. 2013, 49, 583–597. [Google Scholar] [CrossRef]
  17. Dewil, R.; Vansteenwegen, P.; Cattrysse, D.; Van Oudheusden, D. A minimum cost network flow model for the maximum covering and patrol routing problem. Eur. J. Oper. Res. 2015, 247, 27–36. [Google Scholar] [CrossRef] [Green Version]
  18. Dominy, S.; Connor, L.O.; Parbhakar-Fox, A.; Glass, H.; Purevgerel, S. Geometallurgy—A Route to More Resilient Mine Operations. Minerals 2018, 8, 560. [Google Scholar] [CrossRef] [Green Version]
  19. Navarra, A.; Menzies, A.; Jordens, A.; Waters, K. Strategic evaluation of concentrator operational modes under geological uncertainty. Int. J. Min. Process 2017, 164, 45–55. [Google Scholar] [CrossRef]
  20. Tavares, L.M.; Kallemback, R.D.C. Grindability of binary ore blends in ball mills. Min. Eng. 2013, 41, 115–120. [Google Scholar] [CrossRef]
  21. Birat, J. Society, Materials, and the Environment: The Case of Steel. Metals 2020, 10, 331. [Google Scholar] [CrossRef] [Green Version]
  22. Phull, J.; Egas, J.; Barui, S.; Mukherjee, S.; Chattopadhyay, K. An Application of Decision Tree-Based Twin Support Vector Machines to Classify Dephosphorization in BOF Steelmaking. Metals 2020, 10, 25. [Google Scholar] [CrossRef] [Green Version]
  23. Karaboga, D.; Basturk, B. A powerful and efficient algorithm for numerical function optimization: Artificial bee colony (ABC) algorithm. J. Glob. Optim. 2007, 39, 459–471. [Google Scholar] [CrossRef]
  24. Karaboga, D.; Akay, B. A survey: Algorithms simulating bee swarm intelligence. Artif. Intell. Rev. 2009, 31, 61–85. [Google Scholar] [CrossRef]
  25. Li, B. Research on WNN Modeling for Gold Price Forecasting Based on Improved Artificial Bee Colony Algorithm. Comput. Intel. Neurosci. 2014, 2014, 1–10. [Google Scholar] [CrossRef] [Green Version]
  26. Jafrasteh, B.; Fathianpour, N. A hybrid simultaneous perturbation artificial bee colony and back-propagation algorithm for training a local linear radial basis neural network on ore grade estimation. Neurocomputing 2017, 235, 217–227. [Google Scholar] [CrossRef]
  27. Chen, C.; Tsai, Y.; Jhang, R. Approximation of the Piecewise Function Using Neural Fuzzy Networks with an Improved Artificial Bee Colony Algorithm. J. Autom. Control Eng. 2015, 3, 18–21. [Google Scholar] [CrossRef]
  28. Anuar, S.; Selamat, A.; Sallehuddin, R. Hybrid artificial neural network with artificial bee colony algorithm for crime classification. In Computational Intelligence in Information Systems; Springer: Berlin/Heidelberg, Germany, 2015; pp. 31–40. [Google Scholar]
  29. Ghanem, W.A.H.M.; Jantan, A. Swarm intelligence and neural network for data classification. In Proceedings of the 2014 IEEE International Conference on Control System, Computing and Engineering (ICCSCE 2014), Penang, Malaysia, 28–30 November 2014; IEEE: Piscataway, NJ, USA, 2014; pp. 196–201. [Google Scholar]
  30. Cui, L.; Zhang, K.; Li, G.; Wang, X.; Yang, S.; Ming, Z.; Huang, J.Z.; Lu, N. A smart artificial bee colony algorithm with distance-fitness-based neighbor search and its application. Future Gener. Comput. Syst. 2018, 89, 478–493. [Google Scholar] [CrossRef]
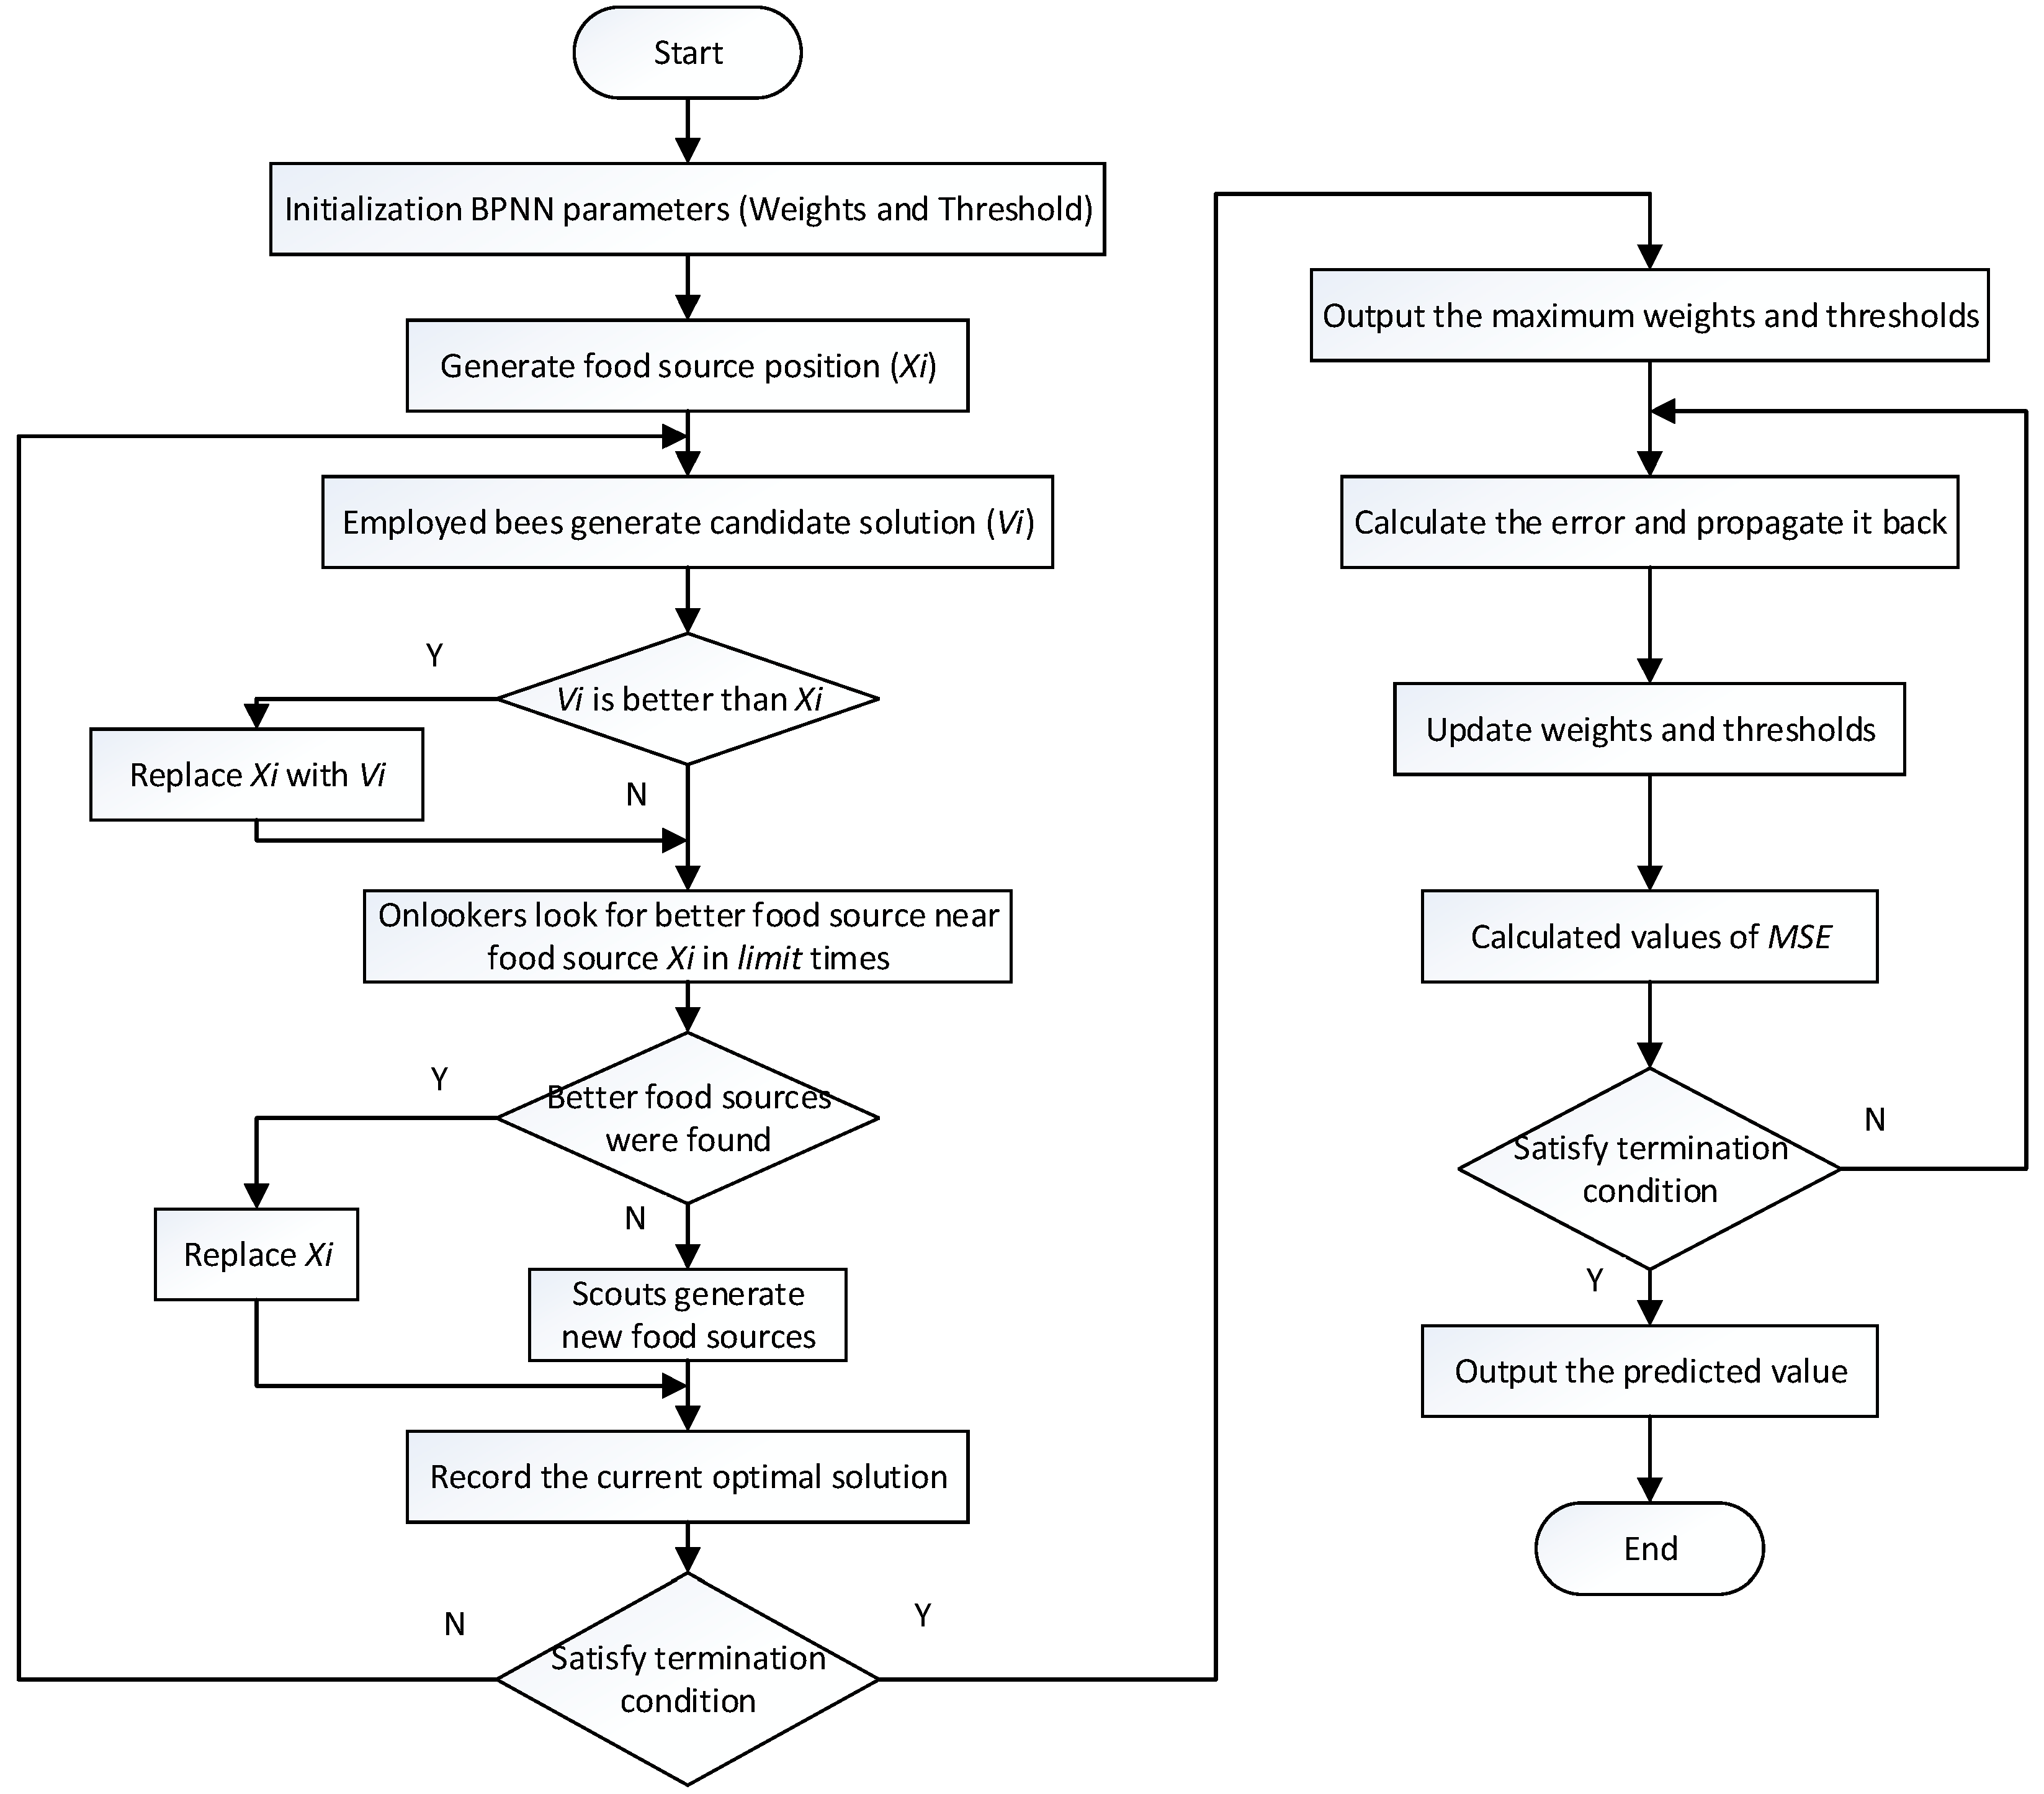
Figure 1. The flow chart of the ABC-BPNN algorithm.
Applsci 11 05092 g001
Figure 2. Neural network structure chart.
Applsci 11 05092 g002
Figure 3. Text of neural network.
Applsci 11 05092 g003
Figure 4. Main interface of the ore blending system.
Applsci 11 05092 g004
Figure 5. Interface for blending parameters setting.
Applsci 11 05092 g005
Table 1. Parameter of neural network.
Maximum TrainingLearning RateMinimum ErrorNumber of InputNumber of Output
25000.10.000131
Table 2. Error of model.
Test ErrorTraining Error
0.07880.0309
Table 3. Comparison with other methods.
AlgorithmMeanSD
ABC-BP76.07250.0309
PSO-BP77.11320.0421
NA-BP75.86540.0674
Table 4. The ore properties of each ore producing block.
NoOre Grade T (%)Iron Content M (%)High Quality Content G (%)Low Quality Content B (%)Minimum Production Volume (Unit)Geological Reserves (Unit)
134.5420.3218.244.310100
229.2615.4812.874.250100
332.033.2103.170100
431.872.5002.560100
Table 5. The property requirements of ore blending products.
Total Ore (Unit)Concentrate Recovery (%)Upper Grade of Ore (%)Lower Grade of Ore (%)Upper of High Quality (%)Lower of High Quality (%)Upper of Low Quality (%)Lower of Low Quality (%)
10073.833291294.53
Table 6. Ore blending scheme.
Modeling MethodMining No.1Mining No.2Mining No.3Mining No.4Ore Dressing Index
Original method1624322879.45
This method2727311582.35
Table 7. Quality evaluation method of mixed ore.
No.Ore Dressing IndexResult
1>80Excellent
270–80Good
360–70Qualified
450–60Relatively poor
540–50Poor
6<40Unavailable
Table 8. The nature and production cost of beneficiation products.
ODIConcentrate GradeTailing GradeConcentration RatioCost (CNY/t)
Excellent67.5%7.5–8.5%2.93–3.03%383
Good67.5%8.5–9.5%3.03–3.14%407
Qualified67.5%9.5–10.5%3.14–3.26%447
Relatively poor67.5%10.5–11.5%3.26–3.39%511
Poor67.5%11.5–13.5%3.39–3.72%609
Unavailable67.5%More than 13.5%More than 3.72%796
Table 9. Ore blending scheme in June.
SchemeMining
No.1
Mining
No.2
Mining
No.3
Mining
No.4
Mining
No.5
Mining
No.6
Mining
No.7
Mixed Ore Grade
(%)
Profit (CNY)
Method 14124156142554.3046.00
Method 2502466152554.0850.24
Method 3412415614 2554.5645.04
Method 450246615 25 54.3649.64
This method502055132454.2258.11
Table 10. Ore blending scheme in July.
SchemeMining
No.1
Mining
No.2
Mining
No.3
Mining
No.4
Mining
No.5
Mining
No.6
Mining
No.7
Mining
No.8
Mining
No.9
Mixed Ore
Grade (%)
Profit (CNY)
Method 1412401506142554.3094.12
Method 250240606152554.08102.71
Method 3410241506142554.5693.49
Method 450024606151554.36102.35
Method 5412400156131555.2883.68
Method 650240066142554.5198.85
This method46233636142454.18112.10
Table 11. Ore blending scheme in August.
SchemeMining
No.1
Mining
No.2
Mining
No.3
Mining
No.4
Mining
No.5
Mining
No.6
Mining
No.7
Mining
No.8
Mining
No.9
Mixed Ore
Grade (%)
Profit (CNY)
Method 1422301506152553.7154.12
Method 242320606152554.0359.83
Method 3421850156152554.0049.35
Method 442293066152554.0157.94
This method362631325142454.1567.36
Table 12. Ore blending scheme in September.
SchemeMining
No.1
Mining
No.2
Mining
No.3
Mining
No.4
Mining
No.5
Mining
No.6
Mining
No.7
Mining
No.8
Mining
No.9
Mixed Ore
Grade (%)
Profit (CNY)
Method 1452000156142554.4056.41
Method 2450200156142554.6356.09
Method 3452001506152553.8369.35
Method 4450201506152554.0468.92
This method352711356132454.2180.27
Publisher’s Note: MDPI stays neutral with regard to jurisdictional claims in published maps and institutional affiliations.